

Abstract
Mesenchymal stem cells (MSCs) have the potential to be the source for cell-based therapies. However, MSCs can undergo malignant transformation in a tumor microenvironment where a high level of interleukin (IL)-6 is present. In this study, we investigated the role of IL-6 and signal transducer and activator of transcription 3 (STAT3) signaling in malignant transformation of MSCs. Rat MSCs were isolated and indirectly cocultured with C6 glioma cells. Coculture of MSCs with astrocytes was used as a control. After 7 days of culture, the cells were assessed for malignant transformation using MTT assay and immunofluorescence staining. The levels of hepatocyte growth factor, IL-6, and basic fibroblast growth factor, and the expression of STAT3 and soluble IL-6 receptor in the cultured cells and conditioned media were measured using RT-PCR, ELISA, and Western blot analysis. The expression levels of STAT3 downstream targets, CyclinD1 and Bcl-xl, were determined as well. Our data showed that almost all of the MSCs became phenotypically malignant after indirect coculture with glioma cells, which was confirmed by tumor formation assays when these cells were injected into nude mice. The expression of IL-6 was significantly increased in MSCs cocultured with glioma cells, which was associated with significantly increased expressions of soluble IL-6 receptor, transmembrane glycoprotein GP130, STAT3, phosphorylated STAT3, CyclinD1, and Bcl-xl. Similar results were obtained when the MSCs were treated with IL-6. Treatment of the cocultured MSCs and glioma cells with STA-21, to block the constitutive STAT3 signaling, reduced the risk of MSC tumor-like transformation in the tumor microenvironment. These data suggest that IL-6 plays a critical role in malignant transformation of rat MSCs, which is associated with an enhancement of the STAT3 signaling pathway in the tumor microenvironment.
Keywords: Malignant transformation, mesenchymal stem cells, STAT3, tumor microenvironment
Mesenchymal stem cells (MSCs) have the potential for broad clinical applications, including cell-based therapy and graft-versus-host prevention. These cells have some unique characteristics including antitumor effects, low immunogenicity, and potent proliferation potential.1–3 However, MSCs have been shown to undergo malignant transformation, although the underlying mechanism(s) is unknown.4,5 It is reported that malignant transformation of MSCs could occur after long-term in vitro culture,6 suggesting that cellular microenvironment changes might be associated with the malignant transformation of MSCs.
Studies have indicated that the C6 glioma microenvironment is abnormally rich in hepatocyte growth factor (HGF), interleukin (IL)-6, basic fibroblast growth factor (bFGF), and other JAK signaling molecules that are involved in the growth of many tumors.7,9,10 Interleukin-6 and its receptors are critically involved in the process of inflammation and tumorigenesis.23,24 Soluble IL-6 receptor (sIL-6R) is responsible for binding with IL-6 and then coupling with the transmembrane glycoprotein GP130 to initiate intracellular signaling through activation of the JAK and signal transducer and activator of transcription 3 (STAT3) pathway.8,11,12 As a cytoplasm protein that is coupled with the JAK signaling pathway, STAT3 plays an important role in cellular functions, including cell proliferation and antiapoptotic activity.13 Its main target genes include cell proliferation-associated protein CyclinD1 and antiapoptotic-related protein Bcl-xl.15 An excessive activation of STAT3 could lead to abnormal cell proliferation, and promote tumor formation and progression.12,14 Recently, we showed that rat MSCs became malignant cancer cells when exposed to the tumor microenvironment, and factors, including IL-6, released from the cancer cells played a critical role in the malignant transformation of MSCs.17 The present study investigated the role of JAK signaling molecules in mediating the effect of IL-6 on malignant transformation of MSCs.
Materials and Methods
Culture and characterization of rat MSCs
Adult Wistar rats (40 ± 10 g each) and neonatal Wistar rats (0–3 days old) were purchased from the Experimental Animal Center at Daping Hospital (Third Military Medical University, Chongqing, China). The experimental protocol was approved by the Animal Usage and Welfare Committee at Chongqing Medical University (Chongqing, China). Rat bone marrow MSCs were prepared and cultured as described previously.16 Briefly, MSCs from male Wistar rats were isolated and cultured in DMEM/F12 (Invitrogen, Carlsbad, CA, USA) with 10% FBS (TBD, Tianjing, China), at 37°C with 5% CO2 and 95% humidity. At 90% confluence, the cells were subcultured for four passages and harvested for phenotypic characterization and differentiation as described previously.17 For phenotypic characterization, the cells were fixed and prepared for immunofluorescence staining for CD71 and CD105 as described previously.1 The cell preparations were exposed to mouse anti-CD71 (1:100; Abcam, Cambridge, UK) and rabbit anti-CD105 (1:100; Abcam). Goat anti-mouse tetramethylrhodamine isothiocyanate-conjugated antibody (1:50) and goat anti-rabbit FITC-conjugated antibody (1:50) were used as the secondary antibodies.
Culture and characterization of rat astrocytes
Astrocytes were prepared from the cortex of neonatal Wistar rats, and cultured as previously described.18 Briefly, cells were isolated and cultured in DMEM/F12 with 10% FBS at 37°C with 5% CO2 and 95% humidity. Confluent cultures were shaken at 1000g overnight, and the medium was changed the next morning. After the third night of culture and shaking, the cells were trypsinized and cultured for 24 h in the presence of 10 μM cytosine arabinoside. After reaching confluence again, the cells were subcultured into 6-well plates and grown for an additional 3 weeks. At this point, the cultures contained 93–100% type 1 astrocytes, as determined with immunochemical staining for glial fibrillary acidic protein (GFAP).
Indirect coculture of MSCs with rat glioma C6 cells and astrocytes
Mesenchymal stem cells (1.5 × 10⁶ cells/mL) were cocultured in DMEM/F12 with indirect coculture with C6 cells (1.5 × 10⁶ cells/mL) or astrocytes in a 6-well Transwell chamber. After 7 days of indirect coculture with C6 cells or astrocytes, MSCs were collected for analysis. The experiment was divided into four groups: (i) experimental group (MSCs and C6 glioma indirect coculture); (ii) positive control (cultured C6 glioma cells); (iii) negative control (MSCs and astrocytes indirect coculture); and (iv) cultured MSCs.
Inhibition of STAT3 by STA-21
To examine the effect of inhibition of STAT3, MSCs cocultured with C6 glioma cells were treated with different doses (0–50 μM) of STAT3-specific inhibitor STA-21 (Santa Cruz Biotechnology, Santa Cruz, CA, USA) for 24 h. The compound of STA-21 was solubilized in DMSO (100 mmol/L), which was further diluted in injectable saline for animal studies.28
Enzyme-linked immunosorbent assay for HGF, IL-6, bFGF, and sIL-6R
The conditioned media of the cells in each group were analyzed for HGF, IL-6, bFGF, and sIL-6R levels using an ELISA kit (Westang, Shanghai, China) according to the manufacturer's instructions. Sandwich ELISA protocols were used, and calibration was done with standard HGF, IL-6, bFGF, and sIL-6R provided in the kit.
Quantitative real-time PCR analysis
Quantitative real-time PCR assay was used to assess the transcriptional expression of tumor-related genes including p53, MDM2, STAT3, CyclinD1, and Bcl-xl. Total RNAs were extracted from cells, and reverse-transcribed with a kit from TaKaRa (Otsu, Japan) for the assay using a SYBR Green dye kit (TaKaRa) as described previously.19 β-actin was used as the endogenous housekeeping gene to normalize the mRNA levels. The specific primers were: p53, 5′-gccatctacaagaagtcacaacac-3′ (forward) and 5′-ctgtcgtccagatactcagcatac-3′ (reverse); MDM2, 5′-ctatcgggtcacagtctatcagg-3′ (forward) and 5′-agttctcacgaagggtccaac-3′ (reverse); STAT3, 5′-ggcatcaatcctgtggtata- ac-3′ (forward) and 5′-cttggtggtggacgag aac-3′ (reverse); CyclinD1, 5′-gcatctacact- gacaactctatc-3′ (forward) and 5′-ttgttctcatccgcctctg-3′ (reverse); and Bcl-xl, 5′-cacagc agcagtttggatg-3′ (forward) and 5′-ggatgttagatcactgaatgc-3′ (reverse). The results were expressed as the mean of 2-ΔΔCt (calculated according to the manufacturer's instructions) ± SD.
Immunofluorescent staining
All the cell preparations were incubated with the primary antibodies against p53 (mouse monoclonal, 1:80; Santa Cruz Biotechnology), MDM2 (mouse monoclonal, 1:80; Santa Cruz Biotechnology), STAT3 (mouse monoclonal, 1:20; Abcam), or p-STAT3 (mouse monoclonal 1:100; Cell Signaling Technology, Danvers, MA, USA), and the astrocytes were incubated with the primary antibody against GFAP (mouse monoclonal, 1:100; Thermo Fisher Scientific, Waltham, MA, USA) overnight, followed by exposure to the corresponding tetramethylrhodamine isothiocyanate-conjugated secondary antibodies (1:100 goat anti-mouse and goat anti-rabbit; Santa Cruz Biotechnology) at 37°C for 1 h. The cells were subsequently examined using a BX51 fluorescence microscope (Olympus, Tokyo, Japan).
Western blot analysis
Cell lysates were prepared from each group for Western blot analysis to determine the expression level of tumor-related proteins P53, MDM2, STAT3, p-STAT3, GP130, CyclinD1, and Bcl-xl. After preparation, the samples were incubated with mouse anti-P53, MDM2 mAb (1:200; Santa Cruz Biotechnology), STAT3 mAb (1:20; Abcam), p-STAT3 mAb (1:100; Cell Signaling Technology), and CyclinD1 and Bcl-xl antibodies (1:1000; Epitomics, Burlingame, CA, USA), mouse anti-rat β-actin mAb (1:5000; Boster Bio-engineering, Wuhan, China) as recommended by the manufacturers. The preparations were then exposed to goat anti-mouse or rabbit antibody (1:2000; Zhongshan Bio-engineering, Beijing, China) in PBS.
Cell counting after IL-6 treatment
The MSCs were divided into two groups: the experimental group (MSCs cultured with excessive IL-6); and the control group (MSCs cultured without IL-6). Cell growth curves were obtained for each group after 1 and 2 months of culture to determine the effect of IL-6 on promoting the proliferation of MSCs and malignant transformation.
Cell viability assay
Cell viability was assayed by measuring blue formazan that was generated from MTT by mitochondrial dehydrogenase, which is active only in live cells. Cells in each group were seeded in 96-well flat-bottomed microtiter plates (3000–5000 cells/well), and were incubated for 1–7 days at 37°C with 5% CO2 and 95% O2. Then MTT was added to each well and incubated for 4 h at 37°C. The formazan product was dissolved by adding 200 μL DMSO to each well, and absorbance was read at 490 nm. All measurements were carried out in triplicate, and each experiment was repeated at least three times.
In vivo tumorigenesis
Six-week-old SPF grade male BALB/c nude mice were purchased from the Experimental Animal Center at Chongqing Medical University. These mice were fed a standard rodent diet and water ad libitum in an aseptic laminar flow room with 60–70% humidity at 25°C. A total of 50 μL cell preparations in each group (containing 2 × 10⁶ tumor cells) was injected into the nail pad of the mice s.c. The tumors were harvested 4–8 weeks after transplantation, and examined morphologically and cytohistologically using standard H&E staining.
Statistical analysis
All data were expressed as the mean ± SD, and statistically analyzed using one-way anova. The differences were considered statistically significant when P < 0.05.
Results
Identification of astrocytes and MSCs
To ensure that the cells used in the present study were astrocytes and MSCs, the phenotype of the cells was determined by measuring the specific cell markers for rat astrocyte GFAP and MSC CD71 and CD105, respectively. As shown in Figure1(a), more than 95% of the astrocytes and C6 glioma cells under immunofluorescence staining were positive for GFAP, but the ratio of the expression of MSCs was only 13%, confirming that these cells were astrocytes. As expected, more than 95% of the cells stained double-positive for CD71 and CD105, confirming that these cells were MSCs (Fig.1b,c).
Figure 1.
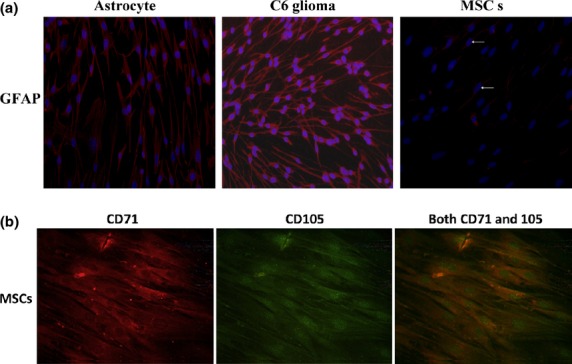
Identification of astrocytes and mesenchymal stem cells (MSCs). (a) Using immunofluorescence staining, the cytoplasm of astrocytes and C6 glioma cells were stained positive for glial fibrillary acidic protein (GFAP). (b) Immunofluorescence staining showed that MSCs were stained positive for CD71 and CD105.
Transformation of MSCs to tumor cells in simulated tumor microenvironment
As shown in Figure2(a), the morphology of the cells cocultured with C6 glioma cells was significantly changed. The cytoplasm contracted toward the perinuclear area, and the cells became longer and thinner with smaller nuclei compared to normal MSCs, which were similar to the glioma cells. The cells in this group also grew much faster than the normal MSCs. The growth curve of the MSCs cocultured with C6 glioma cells was similar to that of glioma cells, as shown in Figure2(b) (P < 0.05), suggesting malignant transformation of MSCs after coculture with C6 glioma cells.
Figure 2.
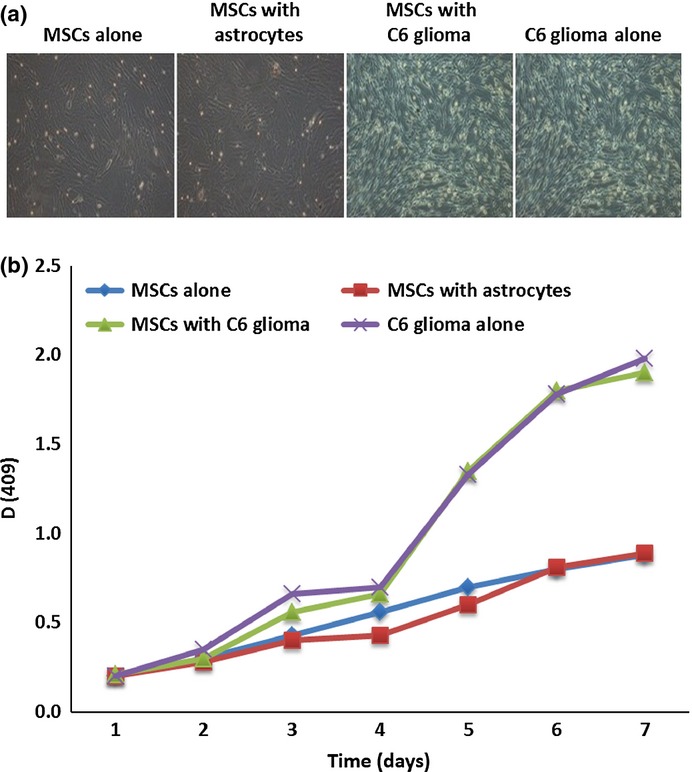
Characteristics of mesenchymal stem cells (MSCs) after coculture with C6 glioma cells. (a) Microscopic examination revealed that the cells showed tumor cell-like morphology a few days after indirect coculture with C6 glioma cells. (b) MTT assay showed the cells after indirect coculture with C6 glioma cells had a growth curve identical to that of cultured glioma cells with a much faster cell proliferation rate than that of control cells. *P < 0.05 compared to control cells.
In vivo tumor formation by MSCs cocultured with C6 glioma cells
In order to determine the tumorigenicity of the cells after malignant transformation, the MSCs cocultured with C6 glioma cells or with normal cells were injected into nude mice. Thirty days after the injection, the injected MSCs cocultured with C6 glioma cells or glioma cells themselves developed into an invasive tumor that was composed of undifferentiated cells and infiltrated to the peripheral musculus, as examined by H&E staining (Fig.3a). After the injection, the volume of invasive tumors in nude mice for each group was measured every day by rule, as shown in Figure3(b). Tumor growth and progression were similar for cells cocultured with C6 glioma cells, and glioma cells alone. The invasive tumors in the two groups grew much faster than in the normal group, further suggesting the malignant nature of the cells after coculture with C6 glioma cells. No tumor growth was observed after injection of normal MSCs or MSCs cocultured with normal astrocytes.
Figure 3.
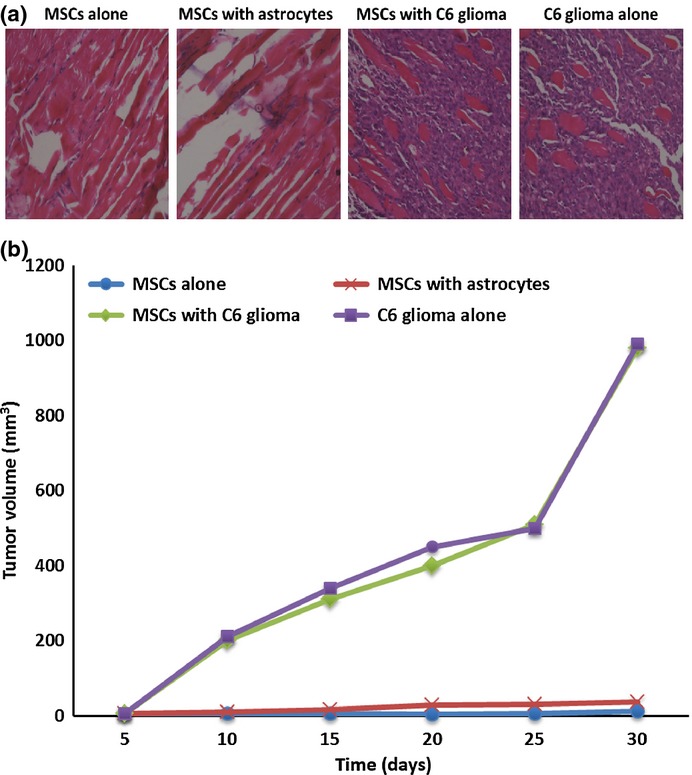
Tumor growth in nude mouse after injection of mesenchymal stem cells (MSCs) cocultured with C6 glioma cells. (a) H&E staining of tissue at cell injection sites in nude mice showed clusters of tumor cells after injection of glioma cells or MSCs cocultured with C6 glioma cells. Only skeletal muscle cells were visualized at the sites injected with the normal control cells. (b) Tumor growth curve in nude mice after injection of MSCs into the mouse nail pads. The xenograft volume was measured every 5 days up to 30 days following cell inoculation.
Expression of HGF and IL-6, not bFGF, was increased in MSCs cocultured with C6 glioma cells
As shown in Figure4, the levels of HGF and IL-6 were significantly increased in the conditioned media of the MSCs cocultured with C6 glioma cells compared to that of normal MSCs or the MSCs cocultured with normal astrocytes (P < 0.01). However, no significant change in the expression of bFGF was observed in the cells cocultured with C6 glioma cells (P > 0.05). There was no significant difference in the expression of HGF, IL-6, or bFGF between normal MSCs and the cells cocultured with astrocytes. Analysis with ELISA showed that the level of sIL-6R in the conditioned media of glioma cells and the cells cocultured with C6 glioma cells was also significantly increased (Fig.5a) along with an increased expression of the membrane protein GP130 (as determined by immunofluorescence staining in these cells as compared with normal MSCs (Fig.5b) (P < 0.05).
Figure 4.
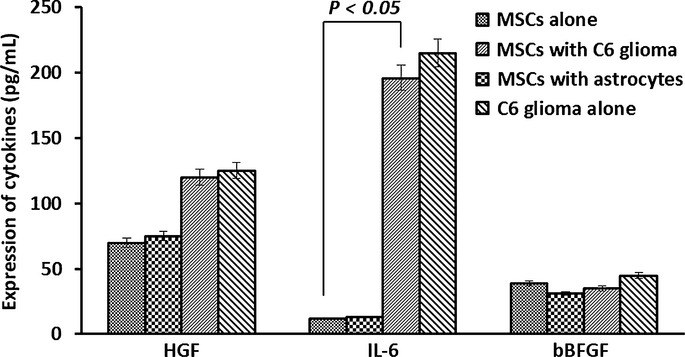
Levels of hepatocyte growth factor (HGF), interleukin (IL)-6, and basic fibroblast growth factor (bFGF) detected in the conditioned media from mesenchymal stem cells (MSCs) cocultured with C6 glioma cells. Analysis with ELISA showed that expression levels of HGF and IL-6 were increased significantly in the MSC media cocultured with C6 glioma cells, whereas bFGF expression was not significantly changed in MSCs cocultured with tumor cells compared to the control group. No significant difference in the expression of HGF, IL-6, or bFGF was observed in the control group.
Figure 5.

Expression of interleukin (IL)-6, soluble IL-6 receptor (sIL-6R), transmembrane glycoprotein GP130, signal transducer and activator of transcription 3 (STAT3), p-STAT3, CyclinD1, and Bcl-xl in mesenchymal stem cells (MSCs) cocultured with tumor cells. (a) Immunofluorescence staining showed that the membrane of MSCs cocultured with C6 glioma tumor cells, and glioma tumor cells themselves, showed strong staining for GP130 protein, whereas the control cells did not show any significant staining. (b) Analysis with ELISA indicated that IL-6 and sIL-6R were significantly increased in the conditioned media from MSCs cocultured with C6 glioma cells or directly from the tumor cells. (c) Quantitative RT-PCR analysis showed that mRNA levels for STAT3, CyclinD1, and Bcl-xl in MSCs cocultured with C6 glioma cells were significantly increased compared to control cells (*P < 0.05; **P < 0.05; ***P < 0.05). (d) Western blotting data indicated that the protein expression of STAT3, p-STAT3, CyclinD1, and Bcl-xl in MSCs cocultured with C6 glioma cells was significantly increased compared to the control groups. (e) Immunofluorescence staining revealed the presence and cellular distribution of STAT3 and p-STAT3 in MSCs under various treatments.
Expression of STAT3, p-STAT3, CyclinD1, and Bcl-xl increased in MSCs cocultured with C6 glioma cells
Analyses using quantitative RT-PCR (Fig.5c) and Western immunoblotting (Fig.5d) showed that expression of STAT3, p-STAT3, CyclinD1, and Bcl-xl was significantly increased in the MSCs cocultured with C6 glioma cells compared to the normal controls (P < 0.05). Immunofluorescence staining data showed that STAT3 and p-STAT3 proteins were located in the cell nucleus as expected (Fig.5e). Similar results were obtained from the cultured malignant glioma cells (P > 0.05).
Interleukin-6 promoted proliferation of MSCs and expression of P53, MDM2, and STAT3 in MSCs
As shown in Figure6(a), normal MSCs displayed the characteristic morphology of enlarged and fibroblast-like cells in a well-organized orientation, whereas the MSCs became smaller and longer with reduced cytoplasm around the nucleus after 1 and 2 months of culture with an excessive amount of IL-6 (200 pg/mL). The cells also grew much faster after 2 months of treatment with IL-6, as shown in Figure6(b). The expression of P53, MDM2, and STAT3 (both mRNAs and proteins) was significantly increased in the cells after 2 months of treatment with IL-6 over control (Fig.6c–e) (P < 0.05). The mutant P53 protein was found in 25.2% of cells treated with IL-6, whereas no mutant P53 was present in the control MSCs (P < 0.05). Expression of MDM2 protein was increased significantly, with 32.33% and 87.26% of cells positive for MDM2 in the control and IL-6-treated cells, respectively (P < 0.05).
Figure 6.

Characteristics of mesenchymal stem cells (MSCs) after treatment with interleukin (IL)-6. (a) The appearance of MSCs after treatment with the same amount (200 pg/mL) of IL-6 was changed and the morphology was similar to that of tumor cells. (b) Cell growth curve for MSCs treated with IL-6 for 2 months was similar to that of C6 glioma cells. (c) Quantitative RT-PCR analysis data showed that mRNA levels for P53, MDM2, and signal transducer and activator of transcription 3 (STAT3) in MSCs treated with IL-6 were significantly increased compared to control cells. (d) Western blotting data showed that the protein expression levels of P53, MDM2, and STAT3 in IL-6-treated MSCs was significantly increased compared to control cells. (e) Immunofluorescence staining confirmed the increased intracellular protein levels of P53, MDM2, and STAT3 in MSCs treated with IL-6.
Interleukin-6-treated MSCs produced tumor in nude mice
When IL-6-treated cells were injected into the skin of nude mice, visible tumor growth was observed in the injection site 3 months after injection (Fig.7a), whereas no tumor growth was present at the site injected with control cells (Fig.7c). Staining with H&E revealed different sized clusters of amorphous tumor cells without specific cell orientation in the injection site with the IL-6-treated cells (Fig.7b). Necrotic cells were visible in the center of some cell clusters. Only normal skeletal muscle structure was seen on H&E staining in the inoculation site with control cells (Fig.7d).
Figure 7.
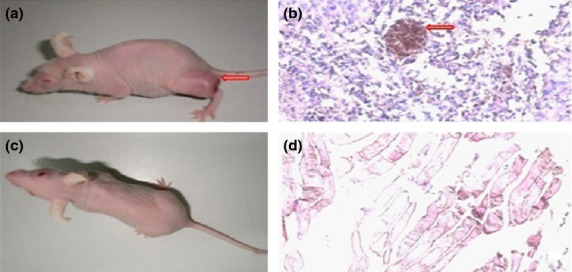
Injection of mesenchymal stem cells (MSCs) treated with interleukin (IL)-6 generated tumor formation in nude mice. (a) Tumors were observed in nude mice at the site injected with MSCs treated with IL-6 (arrow). (b) H&E staining of tissue from the cell injection site showed clusters of tumor cells with necrosis in the center (arrow). (c) No tumor growth was observed in nude mice after injection of normal control cells. (d) H&E staining of tissues at the cell injection site in the control group showed a normal skeletal muscle structure.
Effect of inhibition of STAT3
As shown in Figure8(a), MSCs cocultured with C6 glioma cells were treated with 0–50 μM STA-21for 24 h and the cell proliferation inhibition rate was analyzed using MTT. Significant cell growth inhibition was observed in STA-21 treatment groups compared with the group without STA-21 treatment (P < 0.05). Analyses using Western immunoblotting (Fig.8b) indicated that the expression of STAT3, p-STAT3, CyclinD1, and Bcl-xl was significantly decreased in STA-21 treatment groups compared to the group without STA-21 treatment (P < 0.05).
Figure 8.
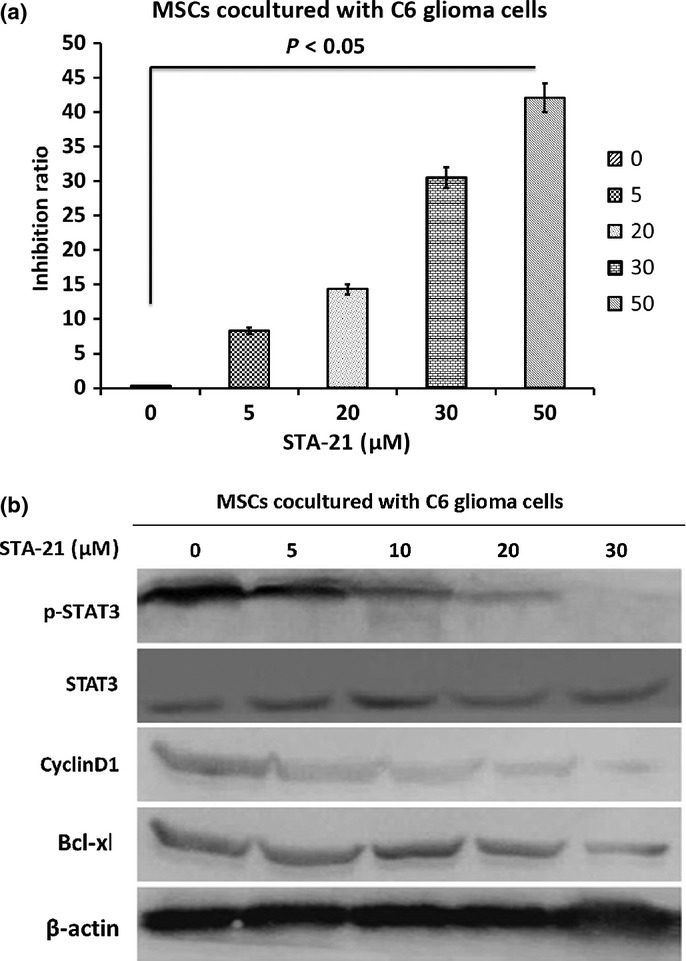
Effect of inhibition of signal transducer and activator of transcription 3 (STAT3) by STA-21. (a) Mesenchymal stem cells (MSCs) cocultured with C6 glioma cells were treated with 0–50 μM STA-21 for 24 h then the cell proliferation inhibition rate was analyzed using MTT. (b) Western blotting data showed that the protein expression levels of STAT3, p-STAT3, CyclinD1, and Bcl-xl in STA-21-treated groups were significantly increased compared to the group without STA-21 treatment.
Discussion
Recently, we showed for the first time that, after indirect coculture with glioma C6 cells, MSCs showed the characteristics of malignant cells, such as tumor cell-like morphology, cell proliferation, and cell cycle, development of poorly differentiated tumors, and in vivo invasive behavior.17 The fact that rat MSCs underwent malignant transformation after a short period of indirect coculture with cancer cells clearly indicated that the tumor microenvironment could be an important determinant for the fate of MSCs.
It has been reported that high levels of HGF, IL-6, bFGF, and other JAK signaling molecules are present in the C6 glioma microenvironment.8–10 In the present study, we observed that the expression of IL-6 is significantly increased in C6 glioma cells and cells cocultured with C6 glioma cells, whereas the others (HGF and bFGF) were not changed in the cells after coculture. Interleukin-6 is a multifunctional cytokine, and is an important factor in various diseases including rheumatoid arthritis, lymphoproliferative disorders, multiple myeloma, osteoporosis, and Alzheimer's disease.26 An elevated serum IL-6 level has been correlated with poor prognosis in patients with a variety of cancers.27 Interleukin-6 binds to sIL-6R, and forms a circulating complex.25 This soluble complex then binds to the cells that express GP130, and induces intracellular signal transduction and gene expression in the target cells.26 In the present study, significantly high levels of IL-6, sIL-6R, and GP130 were detected in MSCs that were indirectly cocultured with cancer cells, indicating that the malignant transformation of MSCs is correlated with IL-6. Our data are consistent with reports from previous studies.20–22
It has been shown that increased IL-6 expression can result in an increase of the expression and nuclear translocation of STAT3.22 Interleukin-6 and related STAT3 signaling pathways play a critical role in the survival of intestinal epithelial cells in colitis-associated cancer. Constitutive activation of STAT3 provides cancer cells with growth and survival advantages through activating multiple signaling pathways and regulations of a broad range of gene expressions in the cells.15
In the present study, the expression and activation of STAT3 (both in vivo and in vitro) and its downstream targets such as CyclinD1 and Bcl-xl were significantly increased in MSCs indirectly cocultured with cancer cells, compared to control cells. Similar results were obtained when MSCs were treated with a similar level of IL-6 as that in the tumor microenvironment. Additionally, through treating cocultured MSCs with glioma using STA-21, to block the constitutive STAT3 signaling, the risk of MSC tumor-like transformation in the tumor microenvironment was reduced. These data suggest that IL-6 and the related STAT3 signaling pathway might be critically involved in the malignant transformation of MSCs in a tumor microenvironment. The information is clinically important in patient selection for cell-based therapies using MSCs. Caution should be taken when MSCs are used in patients with an underlying malignancy.
Acknowledgments
This study was supported by the National Science Foundation of China (Grant No. 31140035), and the Foundation of Chongqing Science and Technology Commission (Grant Nos. CSTC, 2011jjA10060).
Disclosure Statement
The authors have no conflict of interest.
Funding information
National Science Foundation of China (31140035). Foundation of Chongqing Science & Technology Commission (CSTC, 2011jjA10060).
References
- 1.Javazon EH, Beggs KJ, Flake AW. Mesenchymal stem cells: paradoxes of passaging. Exp Hematol. 2004;32:414–25. doi: 10.1016/j.exphem.2004.02.004. [DOI] [PubMed] [Google Scholar]
- 2.Le Blanc K, Tammik C, Rosendahl K, Zetterberg E, Ringdén O. HLA expression and immunologic properties of differentiated and undifferentiated mesenchymal stem cells. Exp Hematol. 2003;31:890–6. doi: 10.1016/s0301-472x(03)00110-3. [DOI] [PubMed] [Google Scholar]
- 3.Nakamura K, Ito Y, Kawano Y. Anti-tumor effect of genetically engineered mesenchymal stem cells in a rat gliomas. Gene Ther. 2004;11:1155–9. doi: 10.1038/sj.gt.3302276. [DOI] [PubMed] [Google Scholar]
- 4.Zhou YF, Bosch-Marce M, Okuyama H, et al. Spontaneous transformation of cultured mouse bone marrow-derived stromal cells. Cancer Res. 2006;66:10849–54. doi: 10.1158/0008-5472.CAN-06-2146. [DOI] [PubMed] [Google Scholar]
- 5.Aguilar S, Nye E, Chan J, et al. Murine but not human mesenchymal stem cells generate osteosarcoma-like lesions in the lung. Stem Cells. 2007;25:1586–94. doi: 10.1634/stemcells.2006-0762. [DOI] [PubMed] [Google Scholar]
- 6.Røsland GV, Svendsen A, Torsvik A, et al. Long-term cultures of bone marrow-derived human mesenchymal stem cells frequently undergo spontaneous malignant transformation. Cancer Res. 2009;69:5331–9. doi: 10.1158/0008-5472.CAN-08-4630. [DOI] [PubMed] [Google Scholar]
- 7.Chen Q, Zhang H, Yang H. Expression of interleukin 6, signal transducer and activator of transcription 3 and vascular endothelial growth factor in human glioma and their relationship. Chin J Exp Surg. 2006;23:1457–9. [Google Scholar]
- 8.Bromberg J, Wang TC. Inflammation and cancer: IL-6 and STAT3 complete the link. Cancer Cell. 2009;15:79–80. doi: 10.1016/j.ccr.2009.01.009. [DOI] [PMC free article] [PubMed] [Google Scholar]
- 9.Knowles LM, Stabile LP, Egloff AM, et al. HGF and c-Met participate in paracrine tumorigenic pathways in head and neck squamous cell cancer. Clin Cancer Res. 2009;15:3740–50. doi: 10.1158/1078-0432.CCR-08-3252. [DOI] [PMC free article] [PubMed] [Google Scholar]
- 10.Westermann R, Unsicker K. Basic fibroblast growth factor (bFGF) and rat C6 glioma cells: regulation of expression, absence of release, and response to exogenous bFGF. Glia. 1990;3:510–21. doi: 10.1002/glia.440030610. [DOI] [PubMed] [Google Scholar]
- 11.Sturzu A, Heckl S. Magnetic resonance imaging of human glioma cells by means of an interleukin-6 receptor-targeted contrast agent. Chem Biol Drug Des. 2010;75:369–74. doi: 10.1111/j.1747-0285.2009.00936.x. [DOI] [PubMed] [Google Scholar]
- 12.Knüpfer H, Preiss R. Lack of knowledge: breast cancer and the soluble interleukin-6 receptor. Breast Care. 2010;5:177–80. doi: 10.1159/000314248. [DOI] [PMC free article] [PubMed] [Google Scholar]
- 13.He G, Karin M. NF-κB and STAT3 - key players in liver inflammation and cancer. Cell Res. 2011;21(1):159–68. doi: 10.1038/cr.2010.183. [DOI] [PMC free article] [PubMed] [Google Scholar]
- 14.Johnston PA, Grandis JR. STAT3 signaling: anticancer strategies and challenges. Mol Interv. 2011;11:18–26. doi: 10.1124/mi.11.1.4. [DOI] [PMC free article] [PubMed] [Google Scholar]
- 15.Lai SY, Johnson FM. Defining the role of the JAK-STAT pathway in head and neck and thoracic malignancies: implications for future therapeutic approaches. Drug Resist Updat. 2010;13:67–78. doi: 10.1016/j.drup.2010.04.001. [DOI] [PubMed] [Google Scholar]
- 16.Chedrawy EG, Wang JS, Nguyen DM, Shum-Tim D, Chiu RC. Incorporation and integration of implanted myogenic and stem cells into native myocardial fibers: anatomic basis for functional improvements. J Thorac Cardiovasc Surg. 2002;124:584–90. doi: 10.1067/mtc.2002.122544. [DOI] [PubMed] [Google Scholar]
- 17.Liu J, Zhang Y, Bai L, Cui X, Zhu J. Rat bone marrow mesenchymal stem cells undergo malignant transformation via indirect co-cultured with tumour cells. Cell Biochem Funct. 2012;30:650–6. doi: 10.1002/cbf.2844. [DOI] [PubMed] [Google Scholar]
- 18.Schwartz JP, Wilson DJ. Preparation and characterization of type 1 astrocytes cultured from adult rat cortex, cerebellum, and striatum. Glia. 1992;5:75–80. doi: 10.1002/glia.440050111. [DOI] [PubMed] [Google Scholar]
- 19.Arikawa E, Sun Y, Wang J, et al. Cross-platform comparison of SYBR Green real-time PCR with TaqMan PCR, microarrays and other gene expression measurement technologies evaluated in the MicroArray Quality Control(MAQC)study. BMC Genomics. 2008;9:328. doi: 10.1186/1471-2164-9-328. [DOI] [PMC free article] [PubMed] [Google Scholar]
- 20.Niu G, Wright KL, Ma Y, et al. Role of Stat3 in regulating p53 expression and function. Mol Cell Biol. 2005;25:7432–40. doi: 10.1128/MCB.25.17.7432-7440.2005. [DOI] [PMC free article] [PubMed] [Google Scholar]
- 21.Masuda A, Kamai T, Abe H, Arai K, Yoshida K. Is Stat3 and/or p53 mRNA expression a prognostic marker for renal cell carcinoma? Biomed Res. 2009;30:171–6. doi: 10.2220/biomedres.30.171. [DOI] [PubMed] [Google Scholar]
- 22.Liu Y, Lin J. Blocking the IL-6-STAT3 signaling pathway: potential liver cancer therapy. Future Oncol. 2011;7:161–4. doi: 10.2217/fon.10.183. [DOI] [PubMed] [Google Scholar]
- 23.Jndoyan Z, Martirosyan N. The role of aldosterone and IL-6 in the pathogenesis of inflammation in familial Mediterranean fever. Georgian Med News. 2012;206:44–8. [PubMed] [Google Scholar]
- 24.Johnson C, Han Y, Hughart N, McCarra J, Alpini G, Meng F. Interleukin 6 and its receptor, key players in hepatobiliary inflammation and cancer. Transl Gastrointest Cancer. 2012;1:58–70. doi: 10.3978/j.issn.2224-4778.2011.11.02. [DOI] [PMC free article] [PubMed] [Google Scholar]
- 25.Azevedo A, Cunha V, Teixeira AL, Medeiros R. IL-6/IL-6R as a potential key signaling pathway in prostate cancer development. World J Clin Oncol. 2011;2:384–96. doi: 10.5306/wjco.v2.i12.384. [DOI] [PMC free article] [PubMed] [Google Scholar]
- 26.Hirano T. Interleukin 6 in autoimmune and inflammatory diseases: a personal memoir. Proc Jpn Acad Ser B Phys Biol Sci. 2010;86:717–30. doi: 10.2183/pjab.86.717. [DOI] [PMC free article] [PubMed] [Google Scholar]
- 27.Wang Y, Li L, Guo X, et al. Interleukin-6 signaling regulates anchorage-independent growth, proliferation, adhesion and invasion in human ovarian cancer cells. Cytokine. 2012;59:228–36. doi: 10.1016/j.cyto.2012.04.020. [DOI] [PubMed] [Google Scholar]
- 28.Kermorgant S, Parker PJ. Receptor trafficking controls weak signal delivery: a strategy used by c-Met for STAT3 nuclear accumulation. J Cell Biol. 2008;182:855–63. doi: 10.1083/jcb.200806076. [DOI] [PMC free article] [PubMed] [Google Scholar]