Abstract
Quantifying global patterns of terrestrial nitrogen (N) cycling is central to predicting future patterns of primary productivity, carbon sequestration, nutrient fluxes to aquatic systems, and climate forcing. With limited direct measures of soil N cycling at the global scale, syntheses of the 15N:14N ratio of soil organic matter across climate gradients provide key insights into understanding global patterns of N cycling. In synthesizing data from over 6000 soil samples, we show strong global relationships among soil N isotopes, mean annual temperature (MAT), mean annual precipitation (MAP), and the concentrations of organic carbon and clay in soil. In both hot ecosystems and dry ecosystems, soil organic matter was more enriched in 15N than in corresponding cold ecosystems or wet ecosystems. Below a MAT of 9.8°C, soil δ15N was invariant with MAT. At the global scale, soil organic C concentrations also declined with increasing MAT and decreasing MAP. After standardizing for variation among mineral soils in soil C and clay concentrations, soil δ15N showed no consistent trends across global climate and latitudinal gradients. Our analyses could place new constraints on interpretations of patterns of ecosystem N cycling and global budgets of gaseous N loss.
Quantifying global patterns of terrestrial nitrogen (N) cycling is central to predicting future patterns of primary productivity, carbon sequestration, nutrient fluxes to aquatic systems, and climate forcing1,2,3,4. With limited direct measurements of soil N cycling at the global scale, past syntheses of the 15N:14N ratio of soil organic matter (represented as δ15N relative to a standard) have inferred that hotter and drier ecosystems tend to lose a greater proportion of their N through gaseous pathways5,6. Global soil δ15N patterns are also among the main evidence used to support the idea that plant productivity in tropical ecosystems is less N limited than in temperate ecosystems6,7. These conclusions have assumed that soils with high δ15N lose a greater proportion of N through strongly 15N-discriminating loss processes such as NH3 volatilization and denitrification rather than through less discriminating loss pathways such as dissolved organic N and NO3− leaching5,8,9,10.
Past analyses of global soil δ15N patterns have examined relatively simple direct relationships between soil δ15N and climate or latitude5,6,11. Yet, other factors that might affect soil δ15N and co-vary with climate could influence global relationships between soil δ15N and climate. For example, a large proportion of the global variation in foliar δ15N is explained by the N concentrations of leaves12, most likely because plants that have high foliar N concentrations are more likely to be growing in soils where fractionating loss pathways dominate N losses. Like leaves, soil C or N concentrations might be important covariates for soil δ15N. Although rates of microbial processing of plant litter are known to vary across climate gradients13,14,15, the extent to which soil C or N concentrations might shape geographic patterns of soil δ15N remains unexplored. Soils with different C or N concentrations might consistently vary in their δ15N due to differences in the composition of organic matter inputs or rates of microbial processing of organic matter, both of which could affect the N isotopic composition of soil organic matter. In addition, soil texture has the potential to affect the relative importance of different loss pathways16 and/or the differential retention of 15N-enriched organic matter17,18,19,20,21. With highly weathered tropical sites more likely to have greater clay concentrations than many high-latitude ecosystems22, this may be an additional confounding influence on global patterns of soil δ15N.
Beyond improving models of the controls on soil δ15N, it is imperative to continue to expand databases of soil δ15N because non-linear relationships may become apparent as data on soil 15N accumulate, which may affect interpolation of N cycling rates in poorly characterized ecosystems. For example, at the global scale, foliar δ15N increases with increasing foliar N concentrations, but only above a mean annual temperature (MAT) of −0.5°C12. Such observations are important, because they prompt mechanistic hypotheses that test critical understanding how climate influences ecosystem N cycling. For soil δ15N, past syntheses of soil δ15N included too few samples, especially for cold ecosystems, to adequately determine whether non-linear relationships exist between soil δ15N and climate.
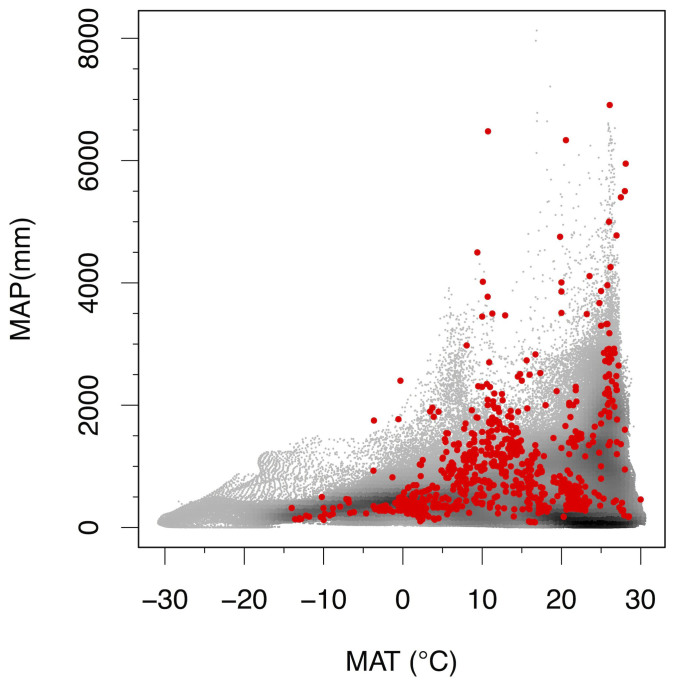
To better understand global patterns of soil δ15N, we assembled a global dataset of published and original surface soil δ15N values and examined relationships of soil δ15N with climate, soil organic C and N concentrations ([C], [N]), and soil clay concentrations. The dataset comprised 5824 measurements of δ15N of soil organic matter from surface (<30 cm) mineral soils. Data for an additional 973 organic soils were compiled, but are only analyzed secondarily here as δ15N signatures of organic soils are more likely to represent the signatures of plants than the ultimate decomposition products of plant biomass. When averaged at 0.1° latitude and longitude, soils represented 910 locations (Fig. 1) that spanned 44°C (MAT) (−14°C to 30°C) and over 9000 mm mean annual precipitation (MAP) (84–9510 mm) (Fig. 2).
Figure 1. Map of sites used in this study.
Map created in JMP 10.0.2.
Figure 2. Map of climate space of sites in this study to global terrestrial climate density.
Sites used in this study are red. Background points represent the density of ice-free land surface area at particular combinations of mean annual temperature (MAT) and mean annual precipitation (MAP).
Results
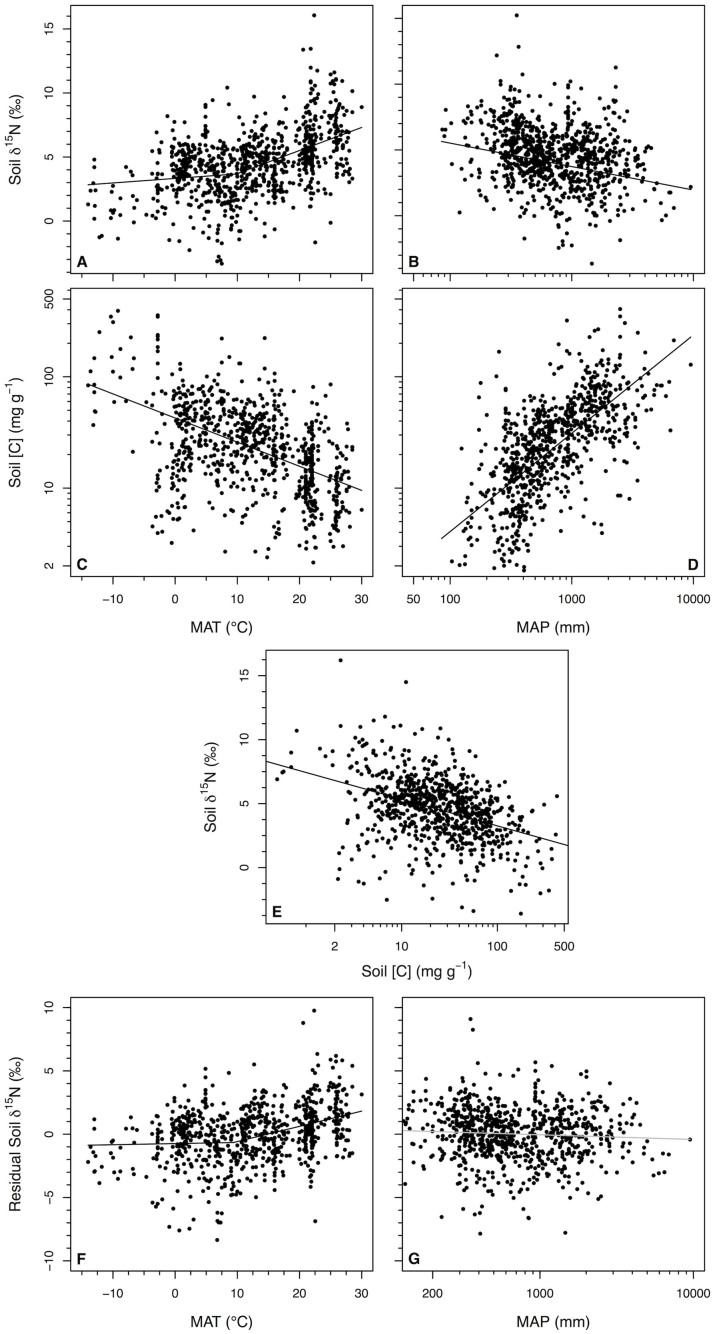
Congruent with previous research, soil organic matter was more enriched in 15N in both hot ecosystems and dry ecosystems than corresponding cold ecosystems or wet ecosystems (Fig. 3; Table 1). Soil δ15N increased with increasing MAT at a rate of 0.18 ± 0.02‰ °C−1 for soils from ecosystems with MAT > 9.8°C. Yet, below 9.8°C, soil δ15N did not change with increasing MAT (0.035 ± 0.024‰ °C−1; P > 0.1). High-precipitation ecosystems had lower soil δ15N with soil δ15N decreasing at a rate of 1.78 ± 0.24‰ per order of magnitude increase in MAP, after accounting for any co-variation in MAT.
Figure 3. Relationships among climate and soil parameters.
Relationships between mean annual temperature (MAT) and mean annual precipitation (MAP) and (A,B) soil δ15N (n = 910) and (C,D) soil [C] of surface soils (n = 828). Each point represents values for all samples averaged per 0.1° latitude and longitude. The relationship between soil [C] and soil δ15N is shown in panel (E) (n = 828). After accounting for the variation in soil δ15N explained by soil [C] (n = 828), the residual variation in soil δ15N is shown vs. (F) MAT and (G) MAP (n = 828). Gray regression line is not significant at P > 0.05. Values displayed in relationships with MAT and MAP were corrected for variation that could be explained by the other climate variable and soil depth.
Table 1. Regression results for mineral soil δ15N vs. climate. Inflection point for MAT in the breakpoint model was 9.83 ± 1.83 °C. r2 = 0.26 for the breakpoint model and 0.24 for the linear model. Units for MAP were mm before log-transformation.
| Estimate | P | |
|---|---|---|
| Breakpoint | ||
| Intercept (‰) | 7.71 ± 0.65 | <0.001 |
| MATCold (‰ °C−1) | 0.03 ± 0.02 | >0.1 |
| MATHot (‰ °C−1) | 0.18 ± 0.02 | <0.001 |
| log10 MAP (‰) | −1.78 ± 0.24 | <0.001 |
| Average Depth (‰ cm−1) | 0.08 ± 0.02 | <0.001 |
| Linear | ||
| Intercept (‰) | 8.31 ± 0.64 | <0.001 |
| MAT (‰ °C−1) | 0.12 ± 0.01 | <0.001 |
| log10 MAP (‰) | −2.10 ± 0.23 | <0.001 |
| Average Depth (‰ cm−1) | 0.09 ± 0.02 | <0.001 |
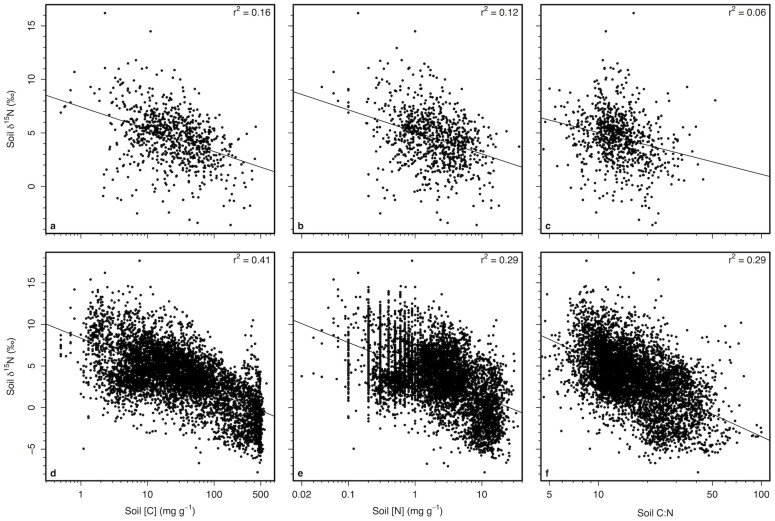
At the global scale, soil [C] also declined with increasing MAT and decreasing MAP (P < 0.001; r2 = 0.42; Fig. 3). Soil δ15N was highest for low-C soils and decreased with increasing soil [C] (r2 = 0.16, P < 0.001, n = 828; Fig. 3, Fig. 4). After accounting for variation among mineral soils in soil [C], the global range in MAT observed here was associated with just 2.7‰ variation in soil δ15N (Fig. 3), with MAT explaining much less variation in residual soil δ15N (P < 0.001, r2 = 0.14, n = 828). Likewise, after calculating the residuals between soil δ15N and [C], MAP no longer predicted variation in soil δ15N (P = 0.1). Soil [N] and C:N were weaker predictors of soil δ15N than soil [C], but generate similar patterns as soil [C] (Fig. 4).
Figure 4. Patterns of soil δ15N with soil C and N concentrations.
Relationships between (A,D) soil carbon concentrations, (B,E) soil nitrogen concentrations, and (C,F) soil C:N with soil δ15N for (A–C) mineral soils and (D–F) mineral as well as organic soil horizons. For (A–C), each point represents soils averaged for 0.1° latitude and longitude. All relationships significant at P < 0.001.
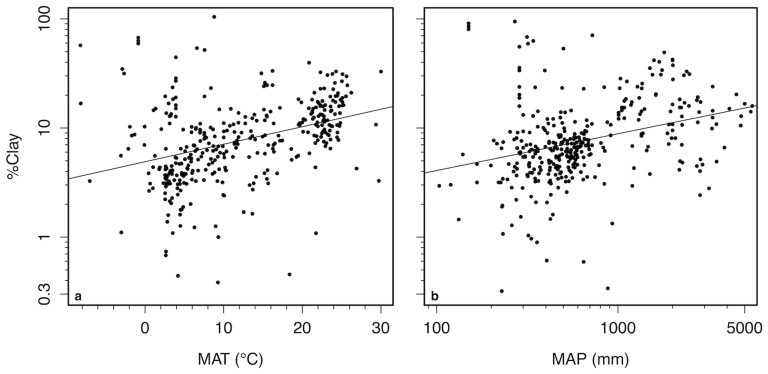
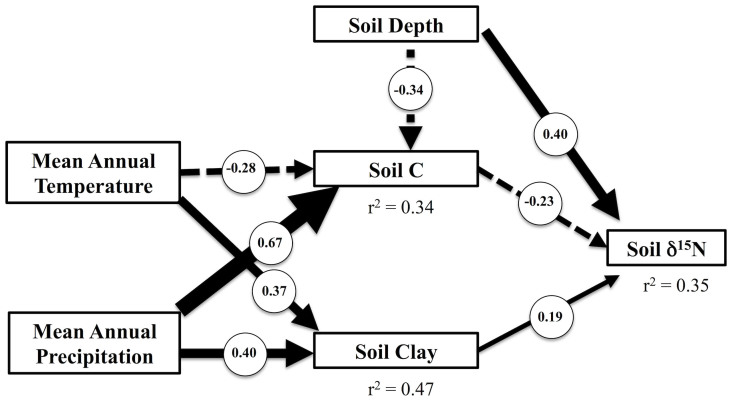
The variation in soil δ15N explained by MAT after taking into account relationships with soil [C] could be caused by the high concentrations of clay found in many tropical soils. 30% of the residual variation in soil [C] after accounting for variation in climate could be explained by soil texture (Fig. 5). Soils with greater silt and clay concentrations had greater [C] than sandy soils (Fig. 5). Within our data, hot sites also had greater clay concentrations than cold sites (Fig. 6). After taking into account the positive relationship between clay concentrations and soil δ15N (Fig. 7), MAT had no remaining influence on soil δ15N (Fig. 7). Interpretations of these sequential regression results were further supported by a structural equation model that simultaneously evaluated both direct effects of climate on soil δ15N as well as indirect effects via effects on soil [C] and clay concentrations (Fig. 8). Mean annual temperature and precipitation only influenced soil δ15N indirectly through their effects on soil [C] and clay. Direct relationships between climate and soil δ15N were not significant (Fig. 8).
Figure 5. Relationships between soil carbon concentrations and texture.
Shown are the percentages of (A,D) sand, (B,E) silt, and (C,F) clay vs. (A–C) soil carbon (mg g−1) as well as (D–F) residual log10-transformed soil carbon (mg g−1) after accounting for MAT, log10MAP, and average depth. All points represent soil values averaged to 0.1° latitude and longitude.
Figure 6. Patterns of soil clay concentrations with climate.
Relationships between (A) mean annual temperature (MAT) and (B) mean annual precipitation (MAP) vs. clay concentrations of surface mineral soils. log (%Clay) = −0.84 + 0.016 × MAT + 0.55 × log(MAP); r2 = 0.47, P < 0.001, n = 359. All points represent soil values averaged to 0.1° latitude and longitude.
Figure 7. Lack of relationship between climate and soil δ15N after accounting for variation in clay concentrations.
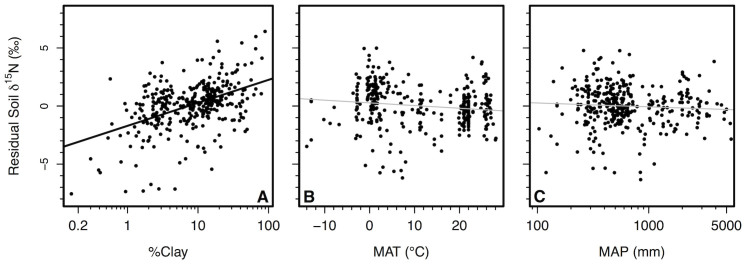
Relationship between (A) clay concentrations in soil and residual soil δ15N after accounting for the relationship between soil δ15N and soil [C] (y = 1.71 + 2.01 × log(x), r2 = 0.22, P < 0.001; n = 355). Also shown are relationships between (B) mean annual temperature (MAT), (C) mean annual precipitation (MAP) and residual soil δ15N after accounting for variation in soil [C], clay concentrations, and soil depth. Non-significant relationships are shown in gray. All points represent soil values averaged to 0.1° latitude and longitude.
Figure 8. Structural equation model of direct and indirect effects of climate on soil δ15N.
Path-diagram of final structural equation model containing only significant relationships. Positive coefficients overlaid on solid paths and negative coefficients on dashed paths. Arrow thickness proportional to path coefficient. Direct effects of climate on soil δ15N were not significant.
Discussion
The global-scale relationships between soil δ15N and both soil [C] and clay suggest that the relationship between soil δ15N and climate is indirect, and mediated through climatic effects on soil [C] and clay. Our analyses indicate that known dependencies of microbial processing of soil C and N on temperature and moisture that have been observed experimentally, within soil profiles, and at local to regional scales23,24,25,26 largely converge in their effects on soil δ15N at the global scale. Further understanding of global soil δ15N patterns will require direct quantification of the relative importance of different loss pathways as well as the δ15N values and relative quantities of different soil fractions across broad gradients. Among ecosystems, SOM δ15N has the potential to be influenced by variation in the 15N signature of atmospheric N deposition. Yet, with the signatures of deposited N often near 0‰9,27, the lack of pattern in SOM δ15N along climate gradients once the degree of decomposition and clay are taken into account is unlikely to be driven by specific regions of the world receiving greater amounts of deposited N.
In all, the global patterns of soil δ15N revealed here support the hypothesis that hot and/or dry ecosystems might not lose a greater proportion of N to the atmosphere relative to other ecosystems, as has been previously concluded from soil N isotope data5,6. Although the relationships between clay and soil δ15N could be driven by greater proportions of fractionating gaseous N loss in soils with high clay concentrations, an alternative explanation is the relative proportion of fractionating N loss is not directly influenced by clays, but instead is due to clays stabilizing more 15N-enriched soil organic matter17,18,19,20,21. As a result of having greater decomposition of organic matter and/or greater concentrations of clay, it is possible that soils in hotter and/or drier ecosystems have soil organic matter with high δ15N as a result of having a greater proportion of their N contained in mineral-associated organic matter as opposed to having a greater proportion of N being lost to fractionating pathways (Fig. 9).
Figure 9. Conceptual model of a hypothesis to explain the higher δ15N of soils from hot and/or dry ecosystems.
Hot and/or dry ecosystems might not have a greater proportion N lost to fractionating (gradient arrow) vs. non-fractionating (solid arrow) losses. Note, arrows not to scale. Instead, as a result of having organic matter that has been decomposed to a greater degree and/or greater clay concentrations, soils from hot and/or dry ecosystems might simply have a greater proportion of their N in mineral-associated organic matter, which is enriched in 15N relative to non-mineral-associated organic matter.
In support of the idea that the proportion of N lost via fractionating pathways might not vary predictably across global climate gradients, recent research has revealed underappreciated amounts of N loss to the atmosphere and aquatic ecosystems suggestive of similar proportions of fractionating N losses across climatic gradients. For example, although tundra ecosystems are typically considered dominated by organic N cycling with little net N mineralization28, gross N mineralization rates and N2O fluxes can contribute to a high proportion of losses, especially given seasonal asynchronies between mineralization and uptake29,30,31. Tropical ecosystems may lose a larger quantity of N to the atmosphere than many temperate ecosystems. Yet, NO3− fluxes in tropical streams can also be more than an order of magnitude greater than temperate streams32,33. These examples from geographically disparate ecosystems may reflect similar, proportional fractionating losses of N to the atmosphere across latitudinal gradients. Higher N availability that is characteristic of many low-latitude ecosystems may in fact reduce the proportion of N lost in gaseous forms relative to leaching34.
Ultimately, future interpretations of global patterns of N cycling will depend strongly on understanding the mechanisms that drive global relationships between clay content, soil C concentrations and soil organic matter δ15N. From these relationships, we hypothesized that global patterns of soil δ15N may reflect the degree to which soil organic matter has been enriched in 15N by microbial processing and protected by mineral association. This would parallel the δ15N of soil organic matter consistently increasing with depth across soils globally25, which can be attributed to greater degrees of processing of soil organic matter at depth35,36,37. Recognizing the influence of the degree of microbial processing and protection on soil δ15N may potentially alter assumptions that soil δ15N scales positively with the proportion of N lost via gaseous processes, which has been central to estimates of global denitrification and N2-fixation9,38. Clarifying whether such assumptions are valid is critical. In addition, global patterns of soil δ15N need to be rectified with global patterns of plant δ15N. For example, it is poorly understood how the relatively high tissue δ15N of plants in hot, dry places12 relates to our finding that high soil δ15N in these locations is best explained by a high degree of decomposition and protection of organic matter. More research is also needed to understand the mechanisms that explain the different inflection points in plant and soil δ15N relationships with mean annual temperature, as well as why plants are generally depleted in 15N relative to soils12. With geographic gradients able to provide a surrogate for future climates39,40,41, interpretations of global patterns of soil δ15N will factor prominently in predicting changes in patterns of gaseous N flux to the atmosphere in response to changes in the Earth-climate system.
Methods
Data on soil δ15N were acquired from the literature and by contacting individual researchers known to have collected soil nitrogen isotope data in the past. For each soil, we collected data on geographic coordinates with climate data taken from the original source or 50-year climatic means (1950–2000) were acquired from WorldClim42. For each soil sample, we recorded soil depth, soil δ15N, and where possible [C], [N], ratio of C to N on a mass basis, and soil texture (percentages of sand, silt, and clay). Due to correlations among soil texture categories, only clay concentrations are included in models here.
Only soils considered by the authors as mineral soils (no litter or O horizons) with depths that averaged <30 cm were included in the main synthesis. Select permafrost samples from below this zone were also included, in order to improve the representation of cold sites as there should be little further processing of soil organic matter once frozen. Subsequent analyses also examined patterns across mineral and organic soil horizons. Soils that were under crops were not included in the synthesis.
To reduce over-representation of individual sites, average soil δ15N were derived for each 0.1° latitude and longitude. Average soil δ15N was derived by calculating the average δ15N for each soil depth and then weighting the average soil δ15N by N content if multiple depths were measured. To examine relationships between soil δ15N and climate, a non-linear model was used to predict soil δ15N with MAT, log-transformed MAP, and average soil depth, which included an independently-fit breakpoint for the relationship between MAT and soil δ15N12. Subsequent models were used to predict the residuals of the relationship between soil δ15N and [C]. A structural equation model (SEM)43 was used to test the relative importance of direct vs. indirect linkages between climate and soil δ15N. A non-hierarchical model was first developed and then downward stepwise selection was used to generate a hierarchical model that included only significant paths. SEM statistics were calculated in IBM SPSS AMOS version 20.0.0.1 (AMOS Development Corp. Meadville, Pennsylvania, USA). All other statistics were computed in JMP 10.0.2 (SAS Institute, Cary, North Carolina, USA).
Author Contributions
J.M.C. designed research and created all figures. J.M.C. and L.W. analysed the data, J.M.C. led the writing of the paper with substantial input from A.J.E., L.A., W.T.B., E.N.J.B., M.D.C., N.J.H., E.A.H., A.K., K.K., J.M.K., M.C.M., E.M.S., J.R.M., K.K.M., A.M., G.B.N., R.S.O., S.S.P., P.L.P., C.A.Q., A.R., L.A.S., B.A.S., B.L.T., R.A.G.V., W.W., L.W. and B.Z.
Acknowledgments
The authors express their sincere appreciation to the numerous individuals who provided data for this synthesis, especially Stephen Porder, Georg Guggenberger, Robert Mikutta, Valery Terwilliger and Yuanhe Yang. Mac Post, Ben Houlton, Phil Taylor, Sharon Hall, Sharon Billings, and Matt Wallenstein provided helpful advice on earlier versions of this manuscript. Any use of trade names is for descriptive purposes only and does not imply endorsement by the US Government.
References
- Galloway J. N. et al. Transformation of the nitrogen cycle: Recent trends, questions, and potential solutions. Science 320, 889–892 (2008). [DOI] [PubMed] [Google Scholar]
- Goll D. S. et al. Nutrient limitation reduces land carbon uptake in simulations with a model of combined carbon, nitrogen and phosphorus cycling. Biogeosciences 9, 3547–3569 (2012). [Google Scholar]
- Pinder R. W. et al. Climate change impacts of US reactive nitrogen. Proc. Natl. Acad. Sci. U. S. A. 109, 7671–7675 (2012). [DOI] [PMC free article] [PubMed] [Google Scholar]
- Hudman R. C. et al. Steps towards a mechanistic model of global soil nitric oxide emissions: implementation and space based-constraints. Atmos. Chem. Phys. 12, 7779–7795 (2012). [Google Scholar]
- Amundson R. et al. Global patterns of the isotopic composition of soil and plant nitrogen. Global Biogeochemical Cycles 17, 1031 (2003). [Google Scholar]
- Martinelli L. A. et al. Nitrogen stable isotopic composition of leaves and soil: tropical versus temperate forests. Biogeochemistry 46, 45–65 (1999). [Google Scholar]
- Hedin L. O., Brookshire E. N. J., Menge D. N. L. & Barron A. R. The nitrogen paradox in tropical forest ecosystems. Annu. Rev. Ecol. Evol. Syst. 40, 613–635 (2009). [Google Scholar]
- Handley L. L. & Scrimgeour C. M. Terrestrial plant ecology and 15N natural abundance: the present limits to interpretation for uncultivated systems with orginal data from a Scottish old field. Adv. Ecol. Res. 27, 133–212 (1997). [Google Scholar]
- Houlton B. Z. & Bai E. Imprint of denitrifying bacteria on the global terrestrial biosphere. Proc. Natl. Acad. Sci. U. S. A. 106, 21713–21716 (2009). [DOI] [PMC free article] [PubMed] [Google Scholar]
- Velthof G. L. et al. Temporal stability of spatial patterns of nitrous oxide fluxes from sloping grassland. J. Environ. Qual. 29, 1397–1407 (2000). [Google Scholar]
- Handley L. L. et al. The 15N natural abundance (delta15N) of ecosystem samples reflects measures of water availability. Aust. J. Plant Physiol. 26, 185–199 (1999). [Google Scholar]
- Craine J. M. et al. Global patterns of foliar nitrogen isotopes and their relationships with climate, mycorrhizal fungi, foliar nutrient concentrations, and nitrogen availability. New Phytol. 183, 980–992 (2009). [DOI] [PubMed] [Google Scholar]
- Gholz H. L., Wedin D. A., Smitherman S. M., Harmon M. E. & Parton W. J. Long-term dynamics of pine and hardwood litter in contrasting environments: toward a global model of decomposition. Glob. Change Biol. 6, 751–765 (2000). [Google Scholar]
- Powers J. S. et al. Decomposition in tropical forests: a pan-tropical study of the effects of litter type, litter placement and mesofaunal exclusion across a precipitation gradient. J. Ecol. 97, 801–811 (2009). [Google Scholar]
- Liski J., Nissinen A., Erhard M. & Taskinen O. Climatic effects on litter decomposition from arctic tundra to tropical rainforest. Glob. Change Biol. 9, 575–584 (2003). [Google Scholar]
- Barton L., McLay C. D. A., Schipper L. A. & Smith C. T. Annual denitrification rates in agricultural and forest soils: a review. Aust. J. Soil Res. 37, 1073–1093 (1999). [Google Scholar]
- Baisden W. T. Turnover and storage of C and N in five density fractions from California annual grassland surface soils. Global Biogeochemical Cycles 16 (2002). [Google Scholar]
- Kramer M. G., Sollins P., Sletten R. S. & Swart P. K. N isotope fractionation and measures of organic matter alteration during decomposition. Ecology 84, 2021–2025 (2003). [Google Scholar]
- Sollins P. et al. Sequential density fractionation across soils of contrasting mineralogy: evidence for both microbial- and mineral-controlled soil organic matter stabilization. Biogeochemistry 96, 209–231 (2009). [Google Scholar]
- Liao J. D., Boutton T. W. & Jastrow J. D. Organic matter turnover in soil physical fractions following woody plant invasion of grassland: Evidence from natural 13C and 15N. Soil. Biol. Biochem. 38, 3197–3210 (2006). [Google Scholar]
- Marin-Spiotta E., Silver W. L., Swanston C. W. & Ostertag R. Soil organic matter dynamics during 80 years of reforestation of tropical pastures. Glob. Change Biol. 15, 1584–1597 (2009). [Google Scholar]
- Jenny H. Factors of Soil Formation: A System of Pedology. (Dover Publications, New York 1994). [Google Scholar]
- Natelhoffer K. J. & Fry B. Controls on natural nitrogen-15 and carbon-13 abundances in forest soil organic matter. Soil Sci. Soc. Am. J. 52, 1633–1640 (1988). [Google Scholar]
- Billings S. A. & Richter D. D. Changes in stable isotopic signatures of soil nitrogen and carbon during 40 years of forest development. Oecologia 148, 325–333 (2006). [DOI] [PubMed] [Google Scholar]
- Hobbie E. A. & Ouimette A. P. Controls of nitrogen isotope patterns in soil profiles. Biogeochemistry 95, 355–371 (2009). [Google Scholar]
- Quesada C. A. et al. Basin-wide variations in Amazon forest structure and function are mediated by both soils and climate. Biogeosciences 9, 2203–2246 (2012). [Google Scholar]
- Koba K. et al. The 15N natural abundance of the N lost from an N-saturated subtropical forest in southern China. Journal of Geophysical Research: Biogeosciences (2005–2012) 117 (2012). [Google Scholar]
- Schimel J. P. & Bennett J. Nitrogen mineralization: Challenges of a changing paradigm. Ecology 85, 591–602 (2004). [Google Scholar]
- Buckeridge K. M., Cen Y.-P., Layzell D. B. & Grogan P. Soil biogeochemistry during the early spring in low arctic mesic tundra and the impacts of deepened snow and enhanced nitrogen availability. Biogeochemistry 99, 127–141 (2009). [Google Scholar]
- Filippa G. et al. Winter and summer nitrous oxide and nitrogen oxides fluxes from a seasonally snow-covered subalpine meadow at Niwot Ridge, Colorado. Biogeochemistry 95, 131–149 (2009). [Google Scholar]
- Harms T. K. & Jones J. B. Thaw depth determines reaction and transport of inorganic nitrogen in valley bottom permafrost soils. Glob. Change Biol. 18, 2958–2968 (2012). [DOI] [PubMed] [Google Scholar]
- Brookshire E. N. J., Gerber S., Menge D. N. & Hedin L. O. Large losses of inorganic nitrogen from tropical rainforests suggest a lack of nitrogen limitation. Ecol. Lett. 15, 9–16 (2012). [DOI] [PubMed] [Google Scholar]
- Brookshire E. N. J., Hedin L. O., Newbold J. D., Sigman D. M. & Jackson J. K. Sustained losses of bioavailable nitrogen from montane tropical forests. Nature Geoscience 5, 123–126 (2012). [Google Scholar]
- Perakis S. S., Sinkhorn E. R. & Compton J. E. delta15N constraints on long-term nitrogen balances in temperate forests. Oecologia 167, 793–807 (2011). [DOI] [PubMed] [Google Scholar]
- Boström B., Comstedt D. & Ekblad A. Isotope fractionation and 13C enrichment in soil profiles during the decomposition of soil organic matter. Oecologia 153, 89–98 (2007). [DOI] [PubMed] [Google Scholar]
- Wallander H., Mörth C.-M. & Giesler R. Increasing abundance of soil fungi is a driver for 15N enrichment in soil profiles along a chronosequence undergoing isostatic rebound in northern Sweden. Oecologia 160, 87–96 (2009). [DOI] [PubMed] [Google Scholar]
- Lindahl B. D. et al. Spatial separation of litter decomposition and mycorrhizal nitrogen uptake in a boreal forest. New Phytol. 173, 611–620 (2007). [DOI] [PubMed] [Google Scholar]
- Vitousek P. M., Menge D. N., Reed S. C. & Cleveland C. C. Biological nitrogen fixation: rates, patterns and ecological controls in terrestrial ecosystems. Philos. Trans. R. Soc. Lond. B Biol. Sci. 368, 20130119 (2013). [DOI] [PMC free article] [PubMed] [Google Scholar]
- Trumbore S. E., Chadwick O. A. & Amundson R. Rapid exchange between soil carbon and atmospheric carbon dioxide driven by temperature change. Science 272, 393–396 (1996). [Google Scholar]
- Davidson E. A. & Janssens I. A. Temperature sensitivity of soil carbon decomposition and feedbacks to climate change. Nature 440, 165–173 (2006). [DOI] [PubMed] [Google Scholar]
- Batjes N. H. Total carbon and nitrogen in the soils of the world. Eur. J. Soil Sci. 47, 151–163 (1996). [Google Scholar]
- Hijmans R. J., Cameron S. E., Parra J. L., Jones P. G. & Jarvis A. Very high resolution interpolated climate surfaces for global land areas. Int. J. Climatol. 25, 1965–1978 (2005). [Google Scholar]
- Grace J. B. Structural equation modeling and natural systems. (Cambridge University Press, 2006). [Google Scholar]


