

Abstract
Background
Improved mortality prediction for patients in intensive care units (ICU) remains an important challenge. Many severity scores have been proposed but validation studies have concluded that they are not adequately calibrated. Many flexible algorithms are available, yet none of these individually outperform all others regardless of context. In contrast, the Super Learner (SL), an ensemble machine learning technique that leverages on multiple learning algorithms to obtain better prediction performance, has been shown to perform at least as well as the optimal member of its library. It might provide an ideal opportunity to construct a novel severity score with an improved performance profile. The aim of the present study was to provide a new mortality prediction algorithm for ICU patients using an implementation of the Super Learner, and to assess its performance relative to prediction based on the SAPS II, APACHE II and SOFA scores.
Methods
We used the Multiparameter Intelligent Monitoring in Intensive Care II (MIMIC-II) database (v26) including all patients admitted to an ICU at Boston’s Beth Israel Deaconess Medical Center from 2001 to 2008. The calibration, discrimination and risk classification of predicted hospital mortality based on SAPS II, on APACHE II, on SOFA and on our Super Learned-based proposal were evaluated. Performance measures were calculated using cross-validation to avoid making biased assessments. Our proposed score was then externally validated on a dataset of 200 randomly selected patients admitted at the ICU of Hôpital Européen Georges-Pompidou in Paris, France between September 2013 and June 2014. The primary outcome was hospital mortality. The explanatory variables were the same as those included in the SAPS II score.
Results
24,508 patients were included, with median SAPS II 38 (IQR: 27–51), median SOFA 5 (IQR: 2–8). A total of 3,002/24,508(12.2%) patients died in the hospital. The two versions of our Super Learner-based proposal yielded average predicted probabilities of death of 0.12 (IQR: 0.02–0.16) and 0.13 (IQR: 0.01–0.19), whereas the corresponding values for the SOFA and SAPS II scores were, respectively, 0.12 (IQR: 0.05–0.15) and 0.30 (IQR: 0.08–0.48). The cross-validated area under the receiver operating characteristics curve (AUROC) for SAPS II and SOFA were 0.78(95%CI: 0.77–0.78) and 0.71 (95%CI: 0.71–0.72), respectively. Our proposal reached an AUROC of 0.85 (95%CI: 0.84–0.85) when the explanatory variables were categorized as in SAPS II, and of 0.88 (95%CI: 0.87–0.89) when the same explanatory variables were included without any transformation. In addition, it exhibited better calibration properties than previous score systems. On the external validation dataset, the AUROC was 0.94 (95%CI: 0.90–0.98) and calibration properties were good.
Interpretation
As compared to conventional severity scores, our Super Learner-based proposal offers improved performance for predicting hospital mortality in ICU patients. A user-friendly implementation is available online and should prove useful to clinicians seeking to validate our score.
Funding
Fulbright Foundation, Assistance Publique – Hôpitaux de Paris (RP); Doris Duke Clinical Scientist Development Award (MP) and NIH Grant # 2R01AI074345-06A1(MvdL).
Introduction
The burden of care for critically ill patients is massive. For instance, in the United States, it currently accounts for nearly 1% of the gross domestic product, and although less than 10% of hospital beds are found in intensive care units (ICU), ICU departments contribute to 22% of total hospital costs 1. In the United Kingdom, the total cost of intensive care is estimated to be £541 million per annum, which represents 0.6% of National Health Service expenditures2. During the period 2009–2012, the average hospital mortality rate for patients hospitalized in ICU was estimated to be 11–12% 3. Predicting mortality in patients hospitalized in ICU is crucial for assessing severity of illness and adjudicating the value of novel treatments, interventions and health care policies. In the past 30 years, considerable effort has been invested in modelling the risk of death in ICU patients. Several severity scores have been developed with the objective of predicting hospital mortality from baseline patient characteristics, defined as measurements obtained within the first 24 hours after ICU admission. The first scores proposed, APACHE 4(Acute Physiology and Chronic Health Evaluation), APACHE II5, and SAPS6 (Simplified Acute Physiology Score), relied upon subjective methods for variable selection, namely relying on a panel of experts to select and assign weights to variables according to perceived relevance for mortality prediction. Further scores, such as the SAPS II7, were subsequently developed using statistical modelling techniques 8,9,10,7. To this day, the SAPS II 7 and APACHE II 5 scores remain the most widely used in clinical practice. However, since first being published, they have been modified several times in order to improve their predictive performance 9,10. These scores are known to discriminate survivors and non-survivors well. However, several external validation studies performed in various countries have suggested that neither the most recent versions of SAPS nor of APACHE are adequately calibrated, which means that they fail to accurately predict the actual probability of death 11,12. Locally-customized variants of these scores have also been developed to incorporate regional variations. For instance, versions of the SAPS score have been specifically tailored to France, to Southern Europe and Mediterranean countries, and to Central and Western Europe 10,13,14. Despite these extensions of SAPS, predicted hospital mortality remains generally overestimated 11,12,15–17.
Most ICU severity scores rely on a logistic regression model. Such models impose stringent constraints on the relationship between explanatory variables and risk of death. For instance, main-term logistic regression typically relies on a linear and additive relationship between a pre-specified transformation of the mean outcome and its predictors. Given the complex processes underlying death in ICU patients, such an assumption might be unrealistic, and predictive power may be relatively low if an incorrect parametric model is utilized as opposed to a more flexible option. On the contrary, if the assumed parametric model is correct, it will generally provide the best prediction, at least in large samples. Hence, the poor calibration of current severity scores might be to a large extent a consequence of the misspecification of the underlying statistical model rather than to the choice of variables included in this model. We hypothesized that, by using a more flexible model, we could improve prediction performance without increasing the number of variables in the model. To the extent this hypothesis holds, it would offer a means to improve predictive performance given a limited set of commonly available predictors, as well as an attractive method for building new predictors using an expanded set of variables.
Given that the true relationship between risk of mortality in the ICU and explanatory variables is unknown, we expect that prediction can be improved by using an automated algorithm to estimate risk of death without requiring any specification about the shape of the underlying relationship. Such methods are often referred to as nonparametric. Some studies have evaluated the benefit of nonparametric approaches, namely based on neural networks or data-mining, to predict hospital mortality in ICU patients 18–23. These studies have unanimously concluded that nonparametric methods might perform at least as well, if not better, than standard logistic regression in predicting ICU mortality.
Recently, the Super Learner was developed as a nonparametric technique for constructing an optimal prediction algorithm from a given set of candidate algorithms provided by the user 24,21. The Super Learner ranks the algorithms according to their prediction performance, and then builds the aggregate algorithm given by the optimal weighted combination of all candidate algorithms. Theoretical and numerical results have demonstrated that the Super Learner performs no worse than the unknown optimal choice in the provided library of candidate algorithms, at least in large samples. It capitalizes on the richness of the library it builds upon and generally offers gains over any specific candidate algorithm in terms of flexibility to accurately fit the data.
The primary aim of this study, designated as the first stage of the Super ICU Learner Algorithm (SICULA) project, was to develop a scoring procedure for ICU patients based on the Super Learner using data from the Multiparameter Intelligent Monitoring in Intensive Care II (MIMIC-II) study 25–27, and to determine whether it results in improved mortality prediction relative to the SAPS II, the APACHE II and the SOFA scores. Although additional work remains to be done to validate the resulting prediction algorithm on a large external cohort and to incorporate additional predictor variables, an accessible, user-friendly web implementation of our scoring procedure has been made available. This implementation allows clinicians to utilize our score in their own practice, say as an aid in determining treatment allocation, provides an opportunity for clinician-researchers to validate our algorithm within the context of their own patient populations, and serves as an improved risk stratification tool for use in clinical research. This is in rather sharp contrast to other instances in which scores have been developed using complex machine learning methods but the resulting scores cannot be readily calculated by clinicians. Indeed, we could not identify a single example in which an implementation of a published scoring procedure was made publicly available on the web. In addition, we have made the corresponding R code available to other investigators in an online appendix.
Patients and Methods
Data Collection and Patients
The MIMIC-II study25–27 includes all patients admitted to an ICU at the Beth Israel Deaconess Medical Center (BIDMC) in Boston, MA since 2001. Patient recruitment is still ongoing. For the sake of the present study, only data from MIMIC-II version 26 (2001–2008) on adult ICU patients (>15 years-old) were included.
Hospital Characteristics
The BIDMC is a 620-bed tertiary academic medical center and a Level I Trauma Center with 77 critical care beds. The ICUs at the BIDMC are closed, with continuous in-house supervision of patient care by an intensivist. These ICUs include medical (MICU), trauma-surgical (TSICU), coronary (CCU), cardiac surgery recovery (CSRU) and medico-surgical (MSICU) critical care units.
Patient Inclusion and Measures
All consecutive patients were included in the MIMIC-II database. The data acquisition process was not visible to staff and did not interfere with the clinical care of patients or methods of monitoring. Only patients with a single ICU admission per hospital stay were considered for the present analysis. Two categories of data were collected: clinical data, aggregated from ICU information systems and hospital archives, and high-resolution physiologic data (waveforms and time series of derived physiologic measurements), recorded on bedside monitors. Clinical data were obtained from the CareVue Clinical Information System (Models M2331A and M1215A, Philips Healthcare, Andover, Massachusetts) deployed in all study ICUs, and from hospital electronic archives. The data included time-stamped nurse-verified physiologic measurements (e.g., hourly documentation of heart rate, arterial blood pressure, pulmonary artery pressure), nurses’ and respiratory therapists’ progress notes, continuous intravenous (IV) drip medications, fluid balances, patient demographics, interpretations of imaging studies, physician orders, discharge summaries, and ICD-9 codes. Comprehensive diagnostic laboratory results (e.g., blood chemistry, complete blood counts, arterial blood gases, microbiology results) were obtained from the patient’s entire hospital stay including periods outside the ICU. In the present study, we focused exclusively on outcome variables (specifically, ICU and hospital mortality) and variables included in the SAPS II7 and SOFA scores28.
Ethical Issues
This study was approved by the Institutional Review Boards of Beth Israel Deaconess Medical Center (Boston, MA) and the Massachusetts Institute of Technology (Cambridge, MA). Requirement for individual patient consent was waived because the study did not impact clinical care and all protected health information was de-identified. De-identification was performed in compliance with Health Insurance Portability and Accountability Act (HIPAA) standards in order to facilitate public access to MIMIC-II. Deletion of protected health information (PHI) from structured data sources (e.g., database fields that provide patient name or date of birth) was straightforward. Additionally, PHI were removed from the discharge summaries and diagnostic reports as well as the approximately 700,000 free-text nursing and respiratory notes in MIMIC-II using an automated algorithm previously shown to out perform clinicians in detecting PHI 29.
Prediction Algorithms
The primary outcome measure was hospital mortality. The data recorded within the first 24 hours following ICU admission were extracted separately from the MIMICII2V26 database and used to compute two of the most widely used severity scores, namely the SAPS II7 and SOFA 28 scores. Individual mortality prediction for the SAPS II score was calculated as defined by its authors7:
In addition, we developed a new version of the SAPS II score, by fitting to our data a main-term logistic regression model using the same explanatory variables as those used in the original SAPS II score7. The same procedure was used to build a new version of the APACHE II score 5. Finally, because the SOFA score 28 is sometimes used in clinical practice as a proxy for outcome prediction, it was also computed for all subjects. Mortality prediction based on the SOFA score was obtained by regressing hospital mortality on the SOFA score using a main-term logistic regression. These two algorithms for mortality prediction were compared to our Super Learner-based proposal.
Super Learner
The Super Learner (Appendix 1) has been proposed as a method for selecting via cross-validation the optimal regression algorithm among all weighted combinations of a set of candidate algorithms, henceforth referred to as the library24,30,31. To implement the Super Learner, a user must provide a customized collection of various data-fitting algorithms, and must also specify a performance measure - in our case the squared difference between observed and predicted outcomes. The Super Learner then uses V-fold cross-validation to estimate the mean squared prediction error of each algorithm on data not used when building the prediction model, and then selects the convex combination of algorithms that provides the smallest squared prediction error on independent data.
Comparison of the 12 algorithms relied on 10-fold cross-validation. As illustrated in Appendix 1, the data were first split into 10 mutually exclusive and exhaustive blocks of approximately equal size. Each algorithm was fit on 9 blocks (the training set) and used to predict mortality for patients in the remaining block (the validation set). The mean squared error between predicted and observed outcomes was then calculated. This procedure was repeated exactly 10 times, with a different block used as validation set every time. Each observation therefore served exactly once in the validation set and was included in the training set for all other rounds. Performance measures were aggregated over all 10 iterations, yielding a cross-validated estimate of the mean-squared error (CV-MSE) for each algorithm. A crucial aspect of this approach is that for each iteration not a single patient appears in both the training and validation sets. The potential for overfitting, wherein the fit of an algorithm is overly tailored to the available data at the expense of performance on future data, is thereby mitigated, as overfitting is more likely to occur when training and validation sets intersect. Candidate algorithms were ranked according to their CV-MSE and the algorithm with least CV-MSE was identified. This algorithm was then refitted using all available data, leading to a prediction rule referred to as the Discrete Super Learner. Subsequently, the prediction rule consisting of the CV-MSE- minimizing weighted convex combination of all candidate algorithms was also computed and refitted on all data. This is what we refer to as the Super Learner combination algorithm 31. Finally, the performance of the Super Learner combination algorithm was itself evaluated using an additional layer of cross validation: the entire procedure was run in turn on each 9/10th of the data, and performance measures described below were evaluated on the remaining validation set and averaged across the 10 validation sets.
Theoretical results suggest that, in order to optimize the performance of the resulting algorithm, the inputted library should include as many sensible algorithms as possible. In this study, the library size was limited to 12 algorithms (enumerated in Appendix 2) for computational reasons. Among these 12 algorithms, some were parametric, such as logistic regression or related methods classically used for ICU scoring systems, and some were non parametric, in the sense that they imposed only minimal constraints on the underlying data distribution. In the present study, we chose the library to include most of the parametric (including regression models with various combinations of main and interaction terms as well as splines, and fitted using maximum likelihood with or without penalization) and nonparametric algorithms previously evaluated for the prediction of mortality in critically ill patients in the literature. The main-term logistic regression is the parametric algorithm that has been used for constructing both the SAPS II and APACHE II scores. This algorithm was included in the SL library so that revised fits of the SAPS II score based on the current data also competed against other algorithms.
The data used in fitting our prediction algorithm included the 17 variables used in the SAPS II score: 13 physiological variables (age, Glasgow coma scale, systolic blood pressure, heart rate, body temperature, PaO2/FiO2 ratio, urinary output, serum urea nitrogen level, white blood cells count, serum bicarbonate level, sodium level, potassium level and bilirubin level), type of admission (scheduled surgical, unscheduled surgical, or medical), and three underlying disease variables (acquired immunodeficiency syndrome, metastatic cancer, and hematologic malignancy derived from ICD-9 discharge codes). Two sets of predictions based on the Super Learner were produced: the first based on the 17 variables as they appear in the SAPS II score (SL1), and the second, on the original, untransformed variables (SL2).
Performance Measures
A key objective of this study was to compare the predictive performance of scores based on the Super Learner to that of the SAPS II and SOFA scores. This comparison hinged on a variety of measures of predictive performance, described below.
A mortality prediction algorithm is said to have adequate discrimination if it tends to assign higher severity scores to patients that died in the hospital compared to those that did not. We evaluated discrimination using the cross-validated area under the receiver-operating characteristic curve (AUROC), reported with corresponding 95% confidence interval (95% CI). Discrimination can be graphically illustrated using the receiver-operating (ROC) curves. Additional tools for assessing discrimination include box plots of predicted probabilities of death for survivors and non-survivors, and corresponding discrimination slopes, defined as the difference between the mean predicted risks in survivors and non-survivors. All these are provided below.
A mortality prediction algorithm is said to be adequately calibrated if predicted and observed probabilities of death coincide rather well. We assessed calibration using the Cox calibration test12,32,33. Because of its numerous shortcomings, including poor performance in large samples, the more conventional Hosmer-Leme show statistic was avoided 34,35. Under perfect calibration, a prediction algorithm will satisfy the logistic regression equation ‘observed log-odds of death = α + β * predicted log-odds of death’ with α=0 and β=1. To implement the Cox calibration test, a logistic regression is performed to estimate α and β; these estimates suggest the degree of deviation from ideal calibration. The null hypothesis (α, β)=(0,1) is tested formally using a U-statistic36.
Summary reclassification measures, including the Continuous Net Reclassification Index (cNRI) and the Integrated Discrimination Improvement (IDI), are relative metrics which have been devised to overcome the limitations of usual discrimination and calibration measures 37,38,39. The cNRI comparing severity score A to score B is defined as twice the difference between the proportion of non-survivors and of survivors, respectively, deemed more severe according to score A rather than score B. The IDI comparing severity score A to score B is the average difference in score A between survivors and non-survivors minus the average difference in score B between survivors and non-survivors. Positive values of the cNRI and IDI indicate that score A has better discriminative ability than score B, whereas negative values indicate the opposite. We computed the reclassification tables and associated summary measures to compare each Super Learner proposal to the original SAPS II score and each of the revised fits of the SAPS II and APACHE II scores.
Baseline variables and outcomes are summarized in Table 1. Median (inter-quartile range) and count (percentage) are reported for continuous and binary variables, respectively. All analyses were performed using statistical software R version 2.15.2 for Mac OS X (The R Foundation for Statistical Computing, Vienna, Austria; specific packages: cvAUC40, Super Learner41 and ROCR42).
Table 1. Baseline characteristics and Outcome measures.
Continuous variables are presented as Median [InterQuartile Range]; Binary or categorical variables as Count (%).
| Overall population (n=24,508) | Dead at Hospital Discharge (n=3,002) | Alive at Hospital Discharge (n=21,506) | |
|---|---|---|---|
| Age | 65 [51–77] | 74 [59–83] | 64 [50–76] |
| Gender (female) | 13,838 (56.5%) | 1,607 (53.5%) | 12231 (56.9%) |
| First SAPS | 13 [10–17] | 18 [14–22] | 13 [9–17] |
| First SAPS II | 38 [27–51] | 53 [43–64] | 36 [27–49] |
| First SOFA | 5 [2–8] | 8 [5–12] | 5 [2–8] |
| Origin | |||
| Medical | 2,453 (10%) | 240 (8%) | 2,213 (10.3%) |
| Trauma | 7,703 (31.4%) | 1,055 (35.1%) | 6,648 (30.9%) |
| Emergency Surgery | 10,803 (44.1%) | 1,583 (52.7%) | 9,220 (42.9%) |
| Scheduled Surgery | 3,549 (14.5%) | 124 (4.1%) | 3,425 (15.9%) |
| Site | |||
| MICU | 7,488 (30.6%) | 1,265 (42.1%) | 6,223 (28.9%) |
| MSICU | 2,686 (11%) | 347 (11.6%) | 2,339 (10.9%) |
| CCU | 5,285 (21.6%) | 633 (21.1%) | 4,652 (21.6%) |
| CSRU | 8,100 (33.1%) | 664 (22.1%) | 7,436 (34.6%) |
| TSICU | 949 (3.9%) | 93 (3.1%) | 856 (4%) |
| HR (bpm) | 87 [75–100] | 92 [78–109] | 86 [75–99] |
| MAP (mmHg) | 81 [70–94] | 78 [65–94] | 82 [71–94] |
| RR (cpm) | 14 [12–20] | 18 [14–23] | 14 [12–18] |
| Na (mmol/l) | 139 [136–141] | 138 [135–141] | 139 [136–141] |
| K (mmol/l) | 4.2 [3.8–4.6] | 4.2 [3.8–4.8] | 4.2 [3.8–4.6] |
| HCO3 (mmol/l) | 26 [22–28] | 24 [20–28] | 26 [23–28] |
| WBC (103/mm3) | 10.3 [7.5–14.4] | 11.6 [7.9–16.9] | 10.2 [7.4–14.1] |
| P/F ratio | 281 [130–447] | 174 [90–352] | 312 [145–461] |
| Ht (%) | 34.7 [30.4–39] | 33.8 [29.8–38] | 34.8 [30.5–39.1] |
| Urea (mmol/l) | 20 [14–31] | 28 [18–46] | 19 [13–29] |
| Bilirubine (mg/dl) | 0.6 [0.4–1] | 0.7 [0.4–1.5] | 0.6 [0.4–0.9] |
| Hospital LOS (days) | 8 [4–14] | 9 [4–17] | 8 [4–14] |
| ICU death (%) | 1,978 (8.1%) | 1,978 (65.9% | - |
| Hospital death (%) | 3,002 (12.2%) | - | - |
The SICULA prediction algorithm
We refer to the Super Learner-based prediction algorithm using untransformed variables (SL2) as SICULA, an acronym for Super ICU Learning Algorithm. An implementation of the SICULA in JavaScript and R has been made available via a user-friendly web interface (http://webapps.biostat.berkeley.edu:8080/sicula/). Using this web application, clinicians and researchers can obtain the predicted probability of hospital mortality in ICU patients based on SICULA by inputting patient characteristics.
External Validation
An external validation of the predictive performance of the SICULA was performed using the same metrics but a completely independent dataset. The data used for external validation are those from 200 patients hospitalized between September 1st 2013 and June 30th 2014 and randomly selected from the internal anonymous database of patients from the medical, surgical and trauma ICU at Hôpital Européen Georges Pompidou, a tertiary academic medical center and Level I Trauma Center in Paris, France.
Role of the funding sources
The funding sources had no role in the collection, analysis, or interpretation of the data. All authors had full access to all of the data. The corresponding author had final responsibility to submit for publication.
Results
Patients
A total of 24,508 patients were included in this study. Their baseline characteristics are summarized in Table 1. Median age was 65 (IQR=51–77). The majority of patients were male (56.5%). The main reasons for ICU admission (derived from ICD-9 discharge codes) were surgery or trauma: emergency surgery in 10,803 patients (44.1%), trauma in 7,703 (31.4%), and elective surgery in 3,549 patients (14.5%). Only 2,453 patients (10.0%) were admitted for medical reasons. The patients were hospitalized in different intensive care units: CSRU (8600, 35.1%), MICU (7488, 30.5%), CCU (5285, 21.6%), MSICU (2686, 10.9%) and TSICU (949, 3.9%). The median SAPS II at admission was 38 (27–51), while the median SOFA score was 5 [2–8]. Median hospital length of stay was of 8 (4–14) days. A total of 1,978 deaths occurred in ICU (8.1%, 95%CI: 7.7–8.4), and 1,024 additional deaths were observed after ICU discharge, resulting in an estimated hospital mortality of 12.2% (95%CI: 11.8–12.7).
Discrimination
The ROC curves for hospital mortality prediction are provided in Figure 1. The cross-validated AUROC (cv-AUROC) was 0.71 (95%CI: 0.70–0.72) for the SOFA score, and 0.78 (95%CI: 0.77–0.78) for the SAPS II score. When refitting the SAPS II score on our data, the cv-AUROC reached 0.83 (95%CI: 0.82–0.83); this is similar to the results obtained with the revised fit of the APACHE II, which led to an AUROC of 0.82 (95%CI: 0.81–0.83). The two Super Learner (SL1 and SL2) prediction models substantially outperformed the SAPS II and the SOFA score. The cv-AUROC was 0.85 (95%CI: 0.84–0.85) for SL1, and 0.88 (95%CI: 0.87–0.89) for SL2, revealing a clear advantage of the Super Learner-based prediction algorithms over both the SOFA and SAPS II scores.
Figure 1. Receiver-Operating Characteristics curves.

Super Learner 1: Super Learner with categorized variables; Super Learner 2: Super Learner with non-transformed variables. These results were obtained using 10-fold cross-validation. We also implemented 50-fold cross-validation and found no material change in the estimated performance of the SICULA algorithm (cvAUC for the SICULA: 0.91 [0.90–0.92]).
Discrimination was also evaluated by comparing differences between the predicted probabilities of death among the survivors and the non-survivors using each prediction algorithm (Appendix 3). The discrimination slope equalled 0.09 for the SOFA score, 0.26 for the SAPS II score,0.21 for SL1, and 0.26 forSL2.
Calibration
The average predicted probability of death based on Super Learner 1 was 0.12 (IQR: 0.02–0.16); it was 0.13 (IQR: 0.01–0.19) when Super Learner 2 was used instead (Table 2). It was similar when using the SOFA score (0.12, IQR: 0.05–0.15), the refitted version of the SAPS II score (0.12, IQR: 0.03–0.16) and the APACHE II score (0.12, IQR: 0.03–0.16). The average probability of death was severely overestimated by the original version of the SAPS II score (0.30, IQR: 0.08–0.48). For each model, histograms of the predicted probabilities of death by survivorship status are provided in Figure 2. Calibration plots are provided in Appendix 3. These plots suggest a lack of fit for the SAPS II score, although the calibration properties were markedly improved by refitting the SAPS II score. The prediction based on the SOFA and the APACHE II scores exhibited excellent calibration properties. For the Super Learner-based predictions, the estimates of α and β were close to the null values. The calibration plots provided in Appendix 3 suggest that SL1 is the only method that provides accurate predictions for the entire range of death probability. Indeed, for other algorithms, the predicted probabilities fall close to the ideal calibration line for low probabilities of death but move away from this line as death probabilities increase. For SL1, the predicted probabilities stay close to the ideal calibration line whatever the death probability.
Table 2.
Observed versus predicted hospital mortality.
| Observed hospital death (%) | 3002 (12.2%) |
|---|---|
|
| |
| Mortality prediction (mean [IQR]): | |
| SOFA | 0.12 [0.05–0.15] |
| SAPS II original version | 0.30 [0.08–0.48] |
| SAPS II refitted | 0.12 [0.03–0.16] |
| APACHE II refitted | 0.12 [0.03–0.16] |
| Super Learner 1 | 0.12 [0.02–0.16] |
| Super Learner 2 | 0.13 [0.01–0.19] |
Figure 2. Distribution of the predicted probability of death in the survivors and the non-survivors.

Upper panel: SAPS II on the left, SOFA on the right; Medium panel: new fit of the SAPS II on the left, new fit of the APACHE II on the right; Lower panel: on the left, Super Learner using categorized variables (Super Learner 1), on the right Super Learner with non-transformed variables (Super Learner 2).
Super Learner Library
The performance of the 12 candidate algorithms, the Discrete Super Learner and the Super Learner combination algorithms, as evaluated by CV-MSE and CV-AUROC, are presented in Figure 3. As suggested by theory, when using either categorized variables (SL1) or untransformed variables (SL2), the Super Learner combination algorithm achieved the same performance as the best of all 12 candidates, with an average CV-MSE of 0.084 (SE=0.001) and an average AUROC of 0.85 (95%CI: 0.84–0.85) for SL1 (best single algorithm: Bayesian Additive Regression Trees, with CV-MSE=0.084 and AUROC=0.84 (95%CI: 0.84, 0.85)). For the SL2, the average CV-MSE was of 0.076 (SE=0.001) and the average AUROC of 0.88 (95%CI: 0.87–0.89) (best single algorithm: Random Forests, with CV-MSE=0.076 and AUROC=0.88 (95%CI: 0.87–0.89)). In both cases (SL1 and SL2), the Super Learner outperformed the main term logistic regression used to develop the SAPS II or the APACHE II score (main term logistic regression: CV-MSE= 0.087 (SE=0.001) and AUROC=0.83 (95%CI: 0.82– 0.83)).
Figure 3. Cross-validated mean-squared error for the Super Learner and the 12 candidate algorithms included in the library.
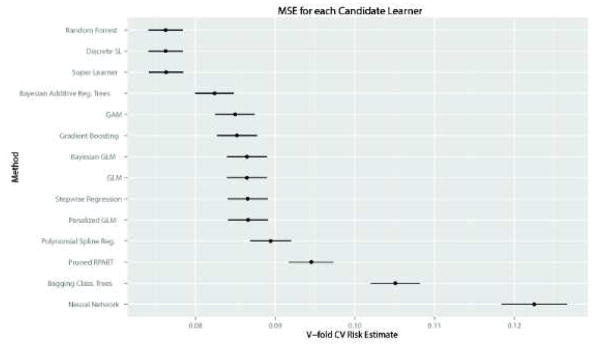
Upper panel concerns the Super Learner with categorized variables (Super Learner 1): Mean Squared Error (MSE) associated with each candidate algorithm (top figure) – Receiver Operating Curves (ROC) for each candidate algorithm (bottom figure); Lower panel concerns the Super Learner with non-transformed variables (Super Learner 2): Mean Squared Error (MSE) associated with each candidate algorithm (top figure) – Receiver Operating Curves (ROC) for each candidate algorithm (bottom figure).
Reclassification Tables
The reclassification tables involving the SAPS II score in its original and its actualized versions, the revised APACHE II score, and the SL1 and SL2 scores are provided in Table 2. When compared to the classification provided by the original SAPS II, the actualized SAPS II or the revised APACHE II score, the Super Learner-based scores resulted in a downgrade of a large majority of patients to a lower risk stratum. This was especially the case for patients with a predicted probability of death above 0.5.
We computed the cNRI and the IDI considering each Super Learner proposal (score A) as the updated model and the original SAPS II, the new SAPS II and the new APACHE II scores (score B) as the initial model. In this case, positive values of the cNRI and IDI would indicate that score A has better discriminative ability than score B, whereas negative values indicate the opposite. Results are summarized in Table 3. As compared to the original SAPS II, both the cNRI were significantly different from zero for SL1. For SL2, the cNRI was significantly different from zero, while the IDI was close to zero. When compared to the classification provided by the actualized SAPS II, the cNRI and IDI were significantly different from zero for both SL1 and SL2. When compared to the actualized APACHE II score, the cNRI and IDI were also significantly different from zero for both SL1 and SL2. When compared to either the revised SAPS II or APACHE II scores, both Super Learner proposals resulted in a large proportion of patients reclassified, especially from higher predicted probability strata to lower ones.
Table 3. A. Reclassification tables.
Super Learner 1: Super Learner with categorized variables; Super Learner 2: Super Learner with non-transformed variables. B. Reclassification statistics. Super Learner 1: Super Learner with categorized variables; Super Learner 2: Super Learner with non-transformed variables.
| A. | |||||||
|---|---|---|---|---|---|---|---|
| Initial model | Updated model | Predicted probability according to initial model | |||||
| 0–0.25 | 0.25–0.5 | 0.5–0.75 | 0.75–1 | % reclassified | |||
| SAPS II, original | SL1 | 0–0.25 | 13,341 | 134 | 3 | 0 | 1% |
| 0.25–0.5 | 4,529 | 723 | 50 | 0 | 86% | ||
| 0.5–0.75 | 2,703 | 1090 | 174 | 2 | 96% | ||
| 0.75–1 | 444 | 705 | 473 | 137 | 92% | ||
| SL2 | 0–0.25 | 12,932 | 490 | 55 | 1 | 4% | |
| 0.25–0.5 | 4,062 | 1,087 | 142 | 11 | 79% | ||
| 0.5–0.75 | 2,531 | 1,165 | 258 | 15 | 93% | ||
| 0.75–1 | 485 | 775 | 448 | 51 | 97% | ||
| SAPS II, refitted | SL1 | 0–0.25 | 20,104 | 884 | 30 | 2 | 4% |
| 0.25–0.5 | 894 | 1,426 | 238 | 9 | 44% | ||
| 0.5–0.75 | 18 | 328 | 361 | 62 | 53% | ||
| 0.75–1 | 1 | 14 | 71 | 66 | 57% | ||
| SL2 | 0–0.25 | 19,221 | 1,667 | 124 | 8 | 9% | |
| 0.25–0.5 | 765 | 1,478 | 318 | 6 | 42% | ||
| 0.5–0.75 | 24 | 346 | 367 | 32 | 52% | ||
| 0.75–1 | 0 | 26 | 94 | 32 | 79% | ||
| APACHE II, refitted | SL1 | 0–0.25 | 19,659 | 1,140 | 107 | 6 | 6% |
| 0.25–0.5 | 1,262 | 1,195 | 296 | 34 | 57% | ||
| 0.5–0.75 | 89 | 298 | 264 | 71 | 63% | ||
| 0.75–1 | 7 | 19 | 33 | 28 | 68% | ||
| SL2 | 0–0.25 | 18,930 | 1,764 | 200 | 18 | 9% | |
| 0.25–0.5 | 1,028 | 1,395 | 345 | 19 | 50% | ||
| 0.5–0.75 | 50 | 333 | 309 | 30 | 57% | ||
| 0.75–1 | 2 | 25 | 49 | 11 | 87% | ||
| B. | |||
|---|---|---|---|
| Super Learner 1 | Super Learner 2 | ||
| SAPS II, original | cNRI | 0.088 95%CI: (0.050, 0.126) |
0.247 95%CI: (0.209, 0.285) |
| IDI | −0.048 95%CI: (−0.055, −0.041) |
−0.001 95%CI: (−0.010, −0.008) |
|
| SAPS II, refitted | cNRI | 0.295 95%CI: (0.257, 0.333) |
0.528 95%CI: (0.415, 0.565) |
| IDI | 0.012 95%CI: (0.008, 0.017) |
0.060 95%CI: (0.054, 0.065) |
|
| APACHE II, refitted | cNRI | 0.336 95%CI: (0.298, 0.374) |
0.561 95%CI: (0.524, 0.598) |
| IDI | 0.029 95%CI: (0.023, 0.035) |
0.076 95%CI: (0.069, 0.082) |
|
External Validation
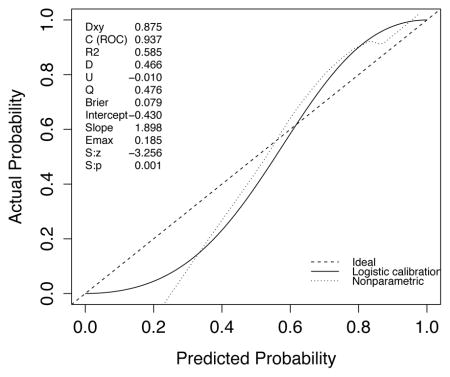
A set of 200 patients hospitalized between September 2013 and June 2014 and randomly selected from the internal database of the medical, surgical and trauma ICU at Hôpital Européen Georges Pompidou, a tertiary academic medical center and a Level I Trauma Center in Paris, France, was used for external validation of the SICULA. The main reasons for ICU admission were emergency surgery in 129 patients (64.1%), elective surgery in 12 patients (6%) and medical in 59 patients (29.5%). The median SAPS II at ICU admission was 40 (18–56). Forty-two patients (21%) died during their ICU stay. The ROC curve for SICULA-based hospital mortality prediction is provided in Appendix 4. The corresponding AUROC was 0.94 (95%CI: 0.90–0.98). The estimated values of α and β were of −0.43 and 1.88 respectively (U statistic = −0.01, p=0.48), indicating good calibration properties.
Discussion
The goal of the present study was to assess whether an ensemble machine learning technique (i.e., a composite algorithm built upon an ensemble of multiple learning algorithms to obtain better prediction performance), the so-called Super Learner, would offer any gain in predicting hospital mortality in critically ill patients. Our main result is that the scores we have developed based on the Super Learner improve the prediction of hospital mortality in our sample and in an external validation sample, both in terms of discrimination and calibration, as compared to the SAPS II or the APACHE II scoring systems. The Super Learner severity score (SL2 or SICULA) is based on untransformed versions of the variables used in SAPS II and APACHE II, and is available online through a web application. An illustration of mortality prediction scores obtained from the SAPS II, APACHE II and SICULA algorithms for three different patient profiles is provided in Table 4.
Table 4.
Illustration ofmortality prediction scores obtained from the SAPS II, APACHE II and SICULA algorithms for three different patient profiles.
| Patient 1: Haemorrhagic shock | Patient 2: Medical Sepsis | Patient 3: Scheduled high-risk surgery | |
|---|---|---|---|
|
| |||
| Age | 40 | 80 | 80 |
| Heart rate | 120 | 100 | 100 |
| Systolic BP | 95 | 85 | 100 |
| GCS | 8 | 14 | 15 |
| Temperature | 35.5 | 38 | 35 |
| Urine output | 700 | 700 | 1200 |
| PaO2/FiO2 | 300 | 200 | 300 |
| Serum urea | 7 | 10 | 7 |
| WBC | 9 | 19 | 14 |
| Potassium | 4.0 | 4.8 | 4.0 |
| Sodium | 142 | 142 | 142 |
| Bicarbonates | 18 | 18 | 22 |
| Hematocrit | 25% | 35% | 35% |
| Bilirubin | 0.8 | 0.8 | 0.8 |
| Chronic diseases | None | None | Metastatic cancer |
| Type of admission | Unscheduled surgery – Trauma | Medical | Scheduled surgery |
|
| |||
| Mortality prediction: | |||
| SAPS II | 46.1% | 41.5% | 21.3% |
| APACHE II | 32.2% | 23.5% | 26.2% |
| SICULA | 29.4% | 29.9% | 28.7% |
Acknowledging that the assumptions underlying the use of common parametric methods, such as logistic regression, are generally unrealistic in this context, various authors have advocated the use of nonparametric techniques for predicting ICU mortality. More than 15 years ago, Dybowski et al. evaluated neural networks for this purpose18 and reported a significantly improved AUROC as compared to standard logistic regression including second order interactions. However, in a similar setting, Clermont et al. later found that logistic regression and neural networks performed similarly for ICU mortality prediction19. Conflicting results were reported for other nonparametric techniques as well. For instance, Ribas et al. demonstrated that use of support vector machines 20 resulted in increased prediction accuracy relative to the APACHE II score 5 and various shrinkage methods (including the Lasso and ridge regression). Again, these results were tempered when Kim et al. reported that no clear benefit was derived from using neural networks and support vector machines in their sample as compared to APACHE III21. Rather, in the latter study, optimal performance was achieved using a decision tree. Similar results have previously been reported using the MIMIC-II dataset. Indeed, a Bayesian ensemble learning algorithm has recently been evaluated during an ICU mortality prediction modelling exercise as part of the PhysioNet/Computing in Cardiology Challenge and has shown substantial improvement in prediction performance as compared to the SAPS score 43. During the same challenge, different authors achieved improved mortality prediction using a method based on support vector machines 44. Such contradictory results on the relative performance of different prediction tools under score the fact that no single algorithm invariably outperforms all others. In any given setting, according to the outcome of interest, the set of explanatory variables available and the underlying population to which it will be applied, the best predictive model might be achieved by a parametric or any of a variety of nonparametric methods. For example, in a situation where some knowledge about the true shape of the relationship between the outcome and the explanatory variables is available, a parametric model reflecting this knowledge is likely to outperform any nonparametric technique. The crucial advantage of the Super Learner is that it can include as many candidate algorithms as inputted by investigators, including algorithms reflecting available scientific knowledge, and in fact borrows strength from diversity in its library. Indeed, established theory indicates that in large samples the Super Learner performs at least as well as the (unknown) optimal choice among the library of candidate algorithms31. This is illustrated here in Figure 3, showing that SL1 achieves similar performance as BART, the best candidate when using transformed variables, while SL2 achieves similar performance as random forest, which outperformed all other candidates when using untransformed variables. Hence, the Super Learner offers a much more flexible alternative to other nonparametric methods.
Our results illustrate that a variety of measures must be considered when evaluating the predictive performance of a given severity score. Although the discrepancy between average predicted probability of death and actual observed in-sample mortality rate was substantial for the original SAPS II score, it was very small and nearly identical for each of SL1, SL2, the SOFA score and the refitted version of the SAPS II and APACHE II scores. This does not however imply that the latter are equally good mortality scores. Indeed, prediction may very well be accurate on average yet still poor at the individual level. Moreover, the accurate average mortality prediction seen with the refitted SAPS II and APACHE II scores might reflect a certain level of overfitting. It is important then to consider a broader assessment of these scores’ performance, namely by carefully studying their discrimination and calibration properties. On one hand, the first SOFA score exhibited very good calibration, yet had very poor discrimination, as reflected by the large overlap in predicted probabilities of death between survivors and non-survivors. On the other hand, the SAPS II score enjoyed high discrimination, but was inadequately calibrated in our sample. These results are consistent with previous studies that evaluated the calibration of the SAPS II score15. The Super Learner offered an appealing tradeoff with good calibration properties and far better discrimination than either the SAPS II and SOFA scores. A disclaimer should nonetheless accompany a criticism of the SOFA score on this basis: in reality, this score was not initially developed for mortality prediction. However, many intensivists use the SOFA score as a surrogate for organ failure quantification and follow-up to assess patients’ response to ICU care, and thereby adjust their own perception of likely patient outcomes. For this reason, we chose to assess the performance of SOFA for ICU mortality prediction. Given the similarity in calibration of the two Super Learner-based scores (SL1 and SL2), we recommend using the Super Learner with untransformed explanatory variables (SL2) in view of its greater discrimination. When considering risk reclassification, the two Super Learner prediction algorithms had similar cNRI, but SL2 clearly had a better IDI. It should be emphasized that, when considering the IDI, the SL1 seemed to perform worse that the SAPS II score. Nonetheless, the IDI must be used carefully since it suffers from similar drawbacks as the AUROC: it summarizes prediction characteristics uniformly over all possible classification thresholds even though many of these are unacceptable and would never be considered in practice45. We externally validated the performance of the SICULA using a small dataset obtained from a French ICU. Discrimination performance was excellent. Calibration results were slightly worse than those obtained internally. However, this is mitigated by the fact that the validation sample substantially differed from the training sample, with more severely ill patients, very few patients hospitalized for coronary care, and thus a consistently higher hospital mortality rate. It is likely that refitting the SICULA using a wider spectrum of ICU patients would improve its external validity -this is one of the primary goals of the second phase of the SICULA project.
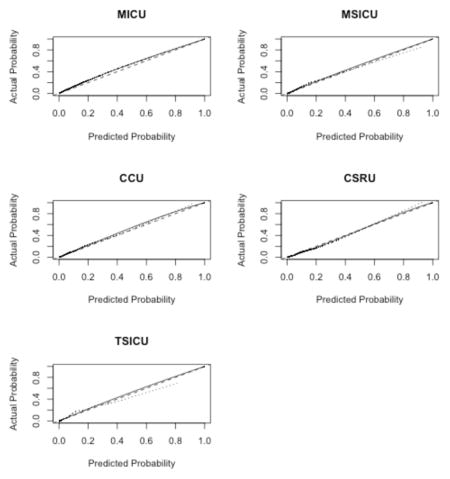
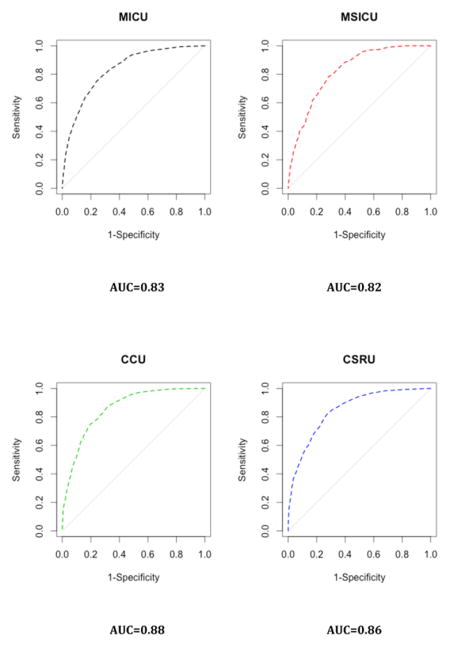
Our study has some limitations. First, we used the SAPS II and the APACHE II scores as references despite the availability of more recent algorithms. This was partly due to the fact that some of the predictors included in the most recent version of these scores were not directly available in the MIMIC-II database. Nonetheless, these scores (e.g., SAPS 3 and APACHE III) have been reported to face the same drawbacks as SAPS II12,15,46. Moreover, those scores remain the most widely used scores in practice 47. Second, our sample comes from a single hospital. Nevertheless, this issue may be alleviated by the fact that patients in our sample come from five different ICUs, injecting a certain level of heterogeneity in our patient pool. This case-mix heterogeneity may in turn represent a limitation when considering the score for a very specific subpopulation of patients. Moreover, overfitting was mitigated by the use of cross-validation48. The patients included in the MIMIC-II cohort seem representative of the overall ICU patient population, as reflected by a hospital mortality rate in the MIMIC-II cohort that is similar to the one reported for ICU patients during the same time period 3. Consequently, our score can be reasonably expected to exhibit, in other samples, performance characteristics similar to those reported here, at least in samples drawn from similar patient populations. However, it should be mentioned that by discarding patients with multiple ICU admissions during the same ICU stay, we might have shrunk the study population toward a less severely ill one. The second phase of the SICULA project will include patients with multiple ICU stays. In addition, information concerning do not resuscitate orders or restricted treatments was missing in our dataset and should ideally be taken into account in future work. Third, the large representation in our sample of CCU or CSRU patients, who often have lower severity scores than medical or surgical ICU patients, may have limited our score’s applicability to more critically ill patients. Further scrutiny however revealed that the average SAPS II score in our sample is comparable to that reported in similar studies 15,46. Of note, results concerning the discrimination and calibration of the SICULA by ICU type (i.e. MICU, CSRU, CCU, MSICU and TSICU) showed no substantial difference in prediction performance between units (Appendix 5). Fourth, some variables needed to compute the SAPS II (e.g., elective surgery, underlying disease variables or main reason for ICU admission) were not directly available in the dataset and had to be extrapolated from other data. Finally, a key assumption made was that the poor calibration associated with current severity scores derives from the use of insufficiently flexible statistical models rather than an inappropriate selection of variables included in the model. For this reason and for the sake of providing a fair comparison of our novel score with the SAPS II score, we included the same explanatory variables as used in SAPS II. Expanding the set of explanatory variables used could potentially result in a score with even better predictive performance. In the future, expanding the number of explanatory variables will probably further improve the predictive performance of the score. However, this will probably strengthen further the need for nonparametric approaches and ensemble learning algorithms such as the Super Learner. Indeed, parametric models are known to be less and less adequate as the number of predictors increases49. Moreover, when increasing the number of predictors, a sensible trade-off between complexity and performance is even more crucial in order for the score to still be applicable in practice.
We conclude from this first stage of the SICULA project that, in this population, the prediction of hospital mortality based on the SICULA prediction algorithm achieves significantly improved performance, both in terms of calibration and discrimination, as compared to conventional severity scores. The SICULA prediction algorithm is a promising alternative that could prove valuable both in clinical practice and for research purposes. Externally validating results of this study in different populations, particularly outside of the United States, providing periodic updates of the SICULA fit, and assessing the potential benefit of including additional variables in the score remain important future challenges that will be tackled in the second stage of the SICULA project. Of course, before we can unequivocally recommend widespread use of our algorithm, it will be important to confirm our findings in this second phase. Nevertheless, we believe the currently available web implementation of SICULA (Appendix 6) should prove useful to both clinicians and other investigators in critical care medicine.
Research in Context.
As part of this project, a systematic review of the literature was conducted in Pubmed and Google Scholar using the following keywords: ICU, mortality prediction, severity scores, machine learning, Super Learner, nonparametric. No restriction was applied. All appropriate and reliable articles were selected based on a careful reading and served as background for our research. Our search revealed that there have been several attempts to use machine learning techniques in the context of ICU mortality prediction, though to the best of our knowledge none of the reported efforts seem to have utilized ensemble learning techniques. More importantly, the resulting scores are neither commonly used nor even widely available to clinicians and researchers. The most common severity scores currently in practice date back to the early 1980s and are based on classical logistic regression models.
Our results demonstrate that flexible modelling approaches may yield significant improvement in ICU mortality prediction. This suggests that instead of relying on any single parametric or nonparametric modelling technique, an ensemble machine learning approach should be used to model outcomes as complex as ICU mortality.
Clinicians should be aware that prediction based on classical parametric approaches could be misleading. As pertains to ICU mortality prediction, the SICULA algorithm derived in this work is a promising alternative that could prove valuable both in clinical practice and for research purposes.
Acknowledgments
Funding: RP received funding for International Mobility from the Fulbright Foundation and from the Assistance Publique – Hôpitaux de Paris (APHP). MP is a recipient of a Doris Duke Clinical Scientist Development Award. MvdL is the recipient of NIH Grant # 2R01AI074345-06A1.
Appendix 1. Super Learner Algorithm
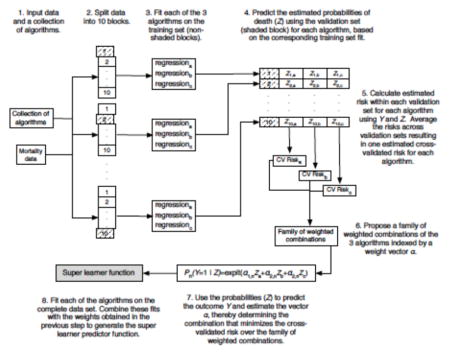
From van der Laan & Rose, Targeted Learning 2011 (with permission) 50.
Appendix 2. Algorithms included in the Super Learner Library
Linear Models and derivatives:
Logistic regression: standard logistic regression, including only main terms for each covariate and including interaction terms 43 (SL.glm);
Stepwise regression: logistic regression using a variable selection procedure based on the Akaike Information Criteria 44 (SL.stepAIC);
Generalized additive model 44: additive model including smoothing functions of the predictors, the functions being choosed in order to optimize the outcome prediction (SL.gam);
Generalized linear model with penalized maximum likelihood 45 : regression models where the coefficients are constrained so that the sum of their absolute values falls below some constant chosen by cross-validation, thereby achieving variable selection while shrinking some regression coefficients toward zero (SL.glmnet);
Multivariate adaptive polynomial spline regression 45: adaptive regression procedure using piecewise linear splines to model the response (SL.polymars);
Bayesian generalized linear model 46 : approach to linear regression in which the statistical analysis is undertaken within the context of Bayesian inference (SL.bayesglm);
Generalized boosted regression model 50: machine learning method for regression problems which produces a prediction model in the form of an ensemble of weak prediction models (SL.gbm);
Trees and Networks:
Neural Networks 48: machine learning algorithm inspired by animal’s neuronal network which is capable of pattern recognition (SL.nnet);
-
Classification trees: generally speaking, trees are methods that partition the covariate space into disjoint pieces and then classify the observations according to which partition element they fall in. Bagging, pruning, random forests and BART are particular implementations of this general principle
Bagging classification trees 49: a set a trees is created from several subsamples drawn with replacement (SL.ipredbagg);
Pruned Recursive Partitioning and Regression Trees 51: pruning is a backing technique that avoids data overfiiting (SL.rpartPrune);
Random Forest 47 : a set a trees is created from several bootstrap samples (SL.randomForest);
Bayesian Additive Regression Trees 52: BART is a sum of trees model where the growth of a tree is constrained by priors and then uses an iterative Markov-chain Monte Carlo algorithm to back fit the model (SL.bart);
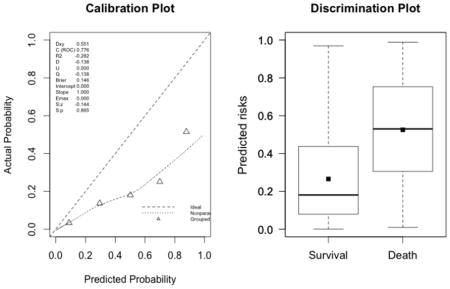
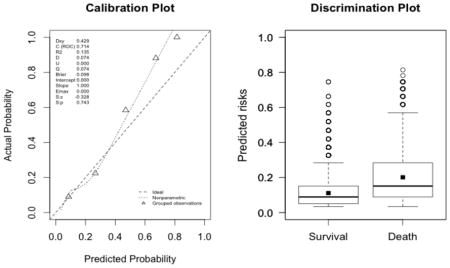
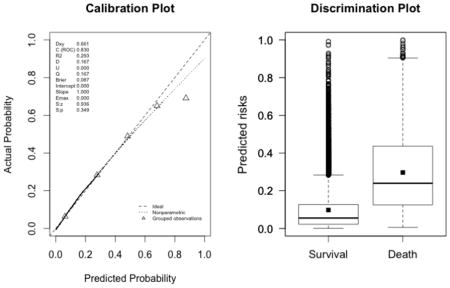
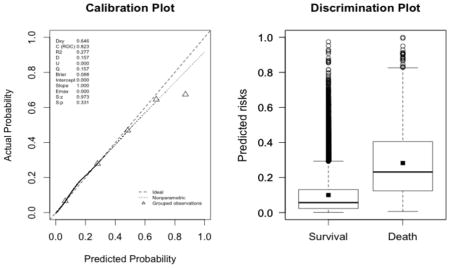
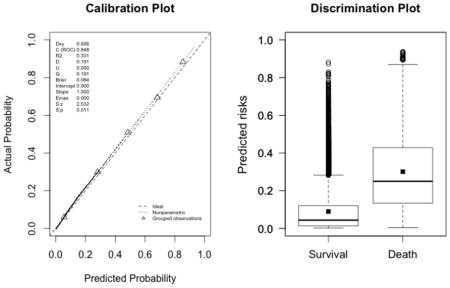
Appendix 3. Calibration plots (left, with the corresponding U statistic) and discrimination plots (right, with corresponding discrimination slope)
The plots indicate a lack of fit for the SAPS II score. The estimated values of α and β were of −1.51 and 0.72 respectively (U statistic = 0.25, p<0.0001). The calibration properties were markedly improved by refitting the SAPS II score: α <0.0001 and β=1 (U<0.0001, p=1.00). The prediction based on the SOFA and the APACHE II scores exhibited excellent calibration properties, as reflected by α <0.0001 and β=1 (U<0.0001, p=1.00). For the Super Learner-based predictions, though the estimates of α and β were close to the null values, the large sample size nonetheless resulted in U-statistics significantly different from zero: SL1: 0.14 and 1.04, respectively (U=0.0007, p=0.0001); SL2: 0.24 and 1.25, respectively (U=0.006, p<0.0001).
-
SAPS II (U=0.25, p<0.0001; discrimination slope=0.26)
-
SOFA (U<0.0001, p=0.9999; discrimination slope=0.09)
-
New fit of the SAPS II score (U<0.0001, p=0.9999; discrimination slope=0.20)
-
New fit of the APACHE II score (U<0.0001, p=0.9999; discrimination slope=0.18)
-
Super Learner 1 (U=0.0007, p<0.0001; discrimination slope=0.21)
-
Super Learner 2 (U=0.006, p<0.0001; discrimination slope=0.26)
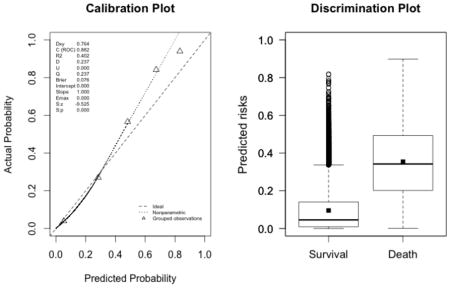
Appendix 4. External Validation of the SICULA
A. Discrimination
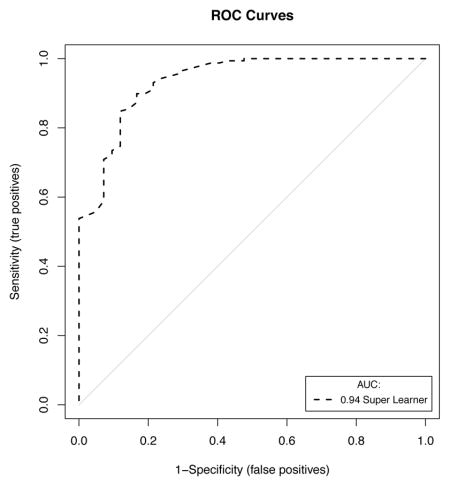
B. Calibration
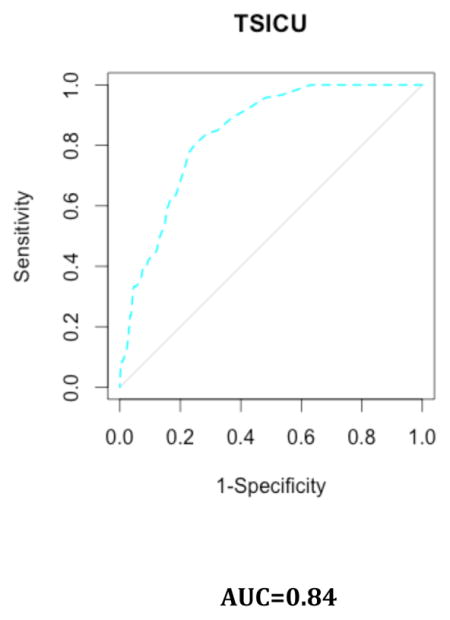
Appendix 5. Results by ICU
A. Calibration Plots
B. Discrimination Plots
Appendix 6. Use of the web app and clinical illustration
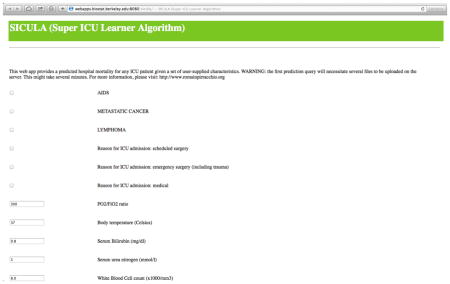
The use of the web app requires entering patients’ characteristics. For continuous variables, average normal values are proposed by default, but can be readily entered by users. Missing values are allowed. After inputting data in all relevant fields, the SICULA mortality prediction score can be obtained by clicking on ‘Analyse.’ In any given web session, the first prediction requested may only appear after several minutes, since initialization of the system requires significant computational efforts.
Footnotes
Declaration of interests
The authors declared no conflicts of interest.
CONTRIBUTORS
RP contributed to conceptualisation of the study, analysis and interpretation of data, and drafting and revision of the report; MP and MC contributed to analysis and interpretation of data, and drafting and revision of the report; MRR contributed to analysis of data and revision of the report; SC and MvdL contributed to interpretation of data and revision of the report.
Publisher's Disclaimer: This is a PDF file of an unedited manuscript that has been accepted for publication. As a service to our customers we are providing this early version of the manuscript. The manuscript will undergo copyediting, typesetting, and review of the resulting proof before it is published in its final citable form. Please note that during the production process errors may be discovered which could affect the content, and all legal disclaimers that apply to the journal pertain.
Bibliography
- 1.Halpern NA, Pastores SM. Critical care medicine in the United States 2000–2005: an analysis of bed numbers, occupancy rates, payer mix, and costs. Crit Care Med. 2010;38:65–71. doi: 10.1097/CCM.0b013e3181b090d0. [DOI] [PubMed] [Google Scholar]
- 2.Ridley S, Morris S. Cost effectiveness of adult intensive care in the UK. Anaesthesia. 2007;62:547–54. doi: 10.1111/j.1365-2044.2007.04997.x. [DOI] [PubMed] [Google Scholar]
- 3.Zimmerman JE, Kramer AA, Knaus WA. Changes in hospital mortality for United States intensive care unit admissions from 1988 to 2012. Critical Care. 2013;17:R81. doi: 10.1186/cc12695. [DOI] [PMC free article] [PubMed] [Google Scholar]
- 4.Knaus WA, Zimmerman JE, Wagner DP, Draper EA, Lawrence DE. APACHE-acute physiology and chronic health evaluation: a physiologically based classification system. Crit Care Med. 1981;9:591–7. doi: 10.1097/00003246-198108000-00008. [DOI] [PubMed] [Google Scholar]
- 5.Knaus WA, Draper EA, Wagner DP, Zimmerman JE. APACHE II: a severity of disease classification system. Crit Care Med. 1985;13:818–29. [PubMed] [Google Scholar]
- 6.Le Gall JR, Loirat P, Alperovitch A, et al. A simplified acute physiology score for ICU patients. Crit Care Med. 1984;12:975–7. doi: 10.1097/00003246-198411000-00012. [DOI] [PubMed] [Google Scholar]
- 7.Le Gall JR, Lemeshow S, Saulnier F. A new Simplified Acute Physiology Score (SAPS II) based on a European/North American multicenter study. JAMA. 1993;270:2957–63. doi: 10.1001/jama.270.24.2957. [DOI] [PubMed] [Google Scholar]
- 8.Lemeshow S, Teres D, Klar J, Avrunin JS, Gehlbach SH, Rapoport J. Mortality Probability Models (MPM II) based on an international cohort of intensive care unit patients. JAMA. 1993;270:2478–86. [PubMed] [Google Scholar]
- 9.Knaus WA, Wagner DP, Draper EA, et al. The APACHE III prognostic system. Risk prediction of hospital mortality for critically ill hospitalized adults. Chest. 1991;100:1619– 36. doi: 10.1378/chest.100.6.1619. [DOI] [PubMed] [Google Scholar]
- 10.Le Gall JR, Neumann A, Hemery F, et al. Mortality prediction using SAPS II: an update for French intensive care units. Crit Care. 2005;9:R645–652. doi: 10.1186/cc3821. [DOI] [PMC free article] [PubMed] [Google Scholar]
- 11.Nassar AP, Jr, Mocelin AO, Nunes ALB, et al. Caution when using prognostic models: a prospective comparison of 3 recent prognostic models. J Crit Care. 2012;27:423, e1–7. doi: 10.1016/j.jcrc.2011.08.016. [DOI] [PubMed] [Google Scholar]
- 12.Poole D, Rossi C, Latronico N, Rossi G, Finazzi S, Bertolini G. Comparison between SAPS II and SAPS 3 in predicting hospital mortality in a cohort of 103 Italian ICUs. Is new always better? Intensive Care Med. 2012;38:1280–8. doi: 10.1007/s00134-012-2578-0. [DOI] [PubMed] [Google Scholar]
- 13.Metnitz B, Schaden E, Moreno R, Le Gall J-R, Bauer P, Metnitz PGH. Austrian validation and customization of the SAPS 3 Admission Score. Intensive Care Med. 2009;35:616–22. doi: 10.1007/s00134-008-1286-2. [DOI] [PubMed] [Google Scholar]
- 14.Moreno RP, Metnitz PGH, Almeida E, et al. SAPS 3--From evaluation of the patient to evaluation of the intensive care unit. Part 2: Development of a prognostic model for hospital mortality at ICU admission. Intensive Care Med. 2005;31:1345–55. doi: 10.1007/s00134-005-2763-5. [DOI] [PMC free article] [PubMed] [Google Scholar]
- 15.Beck DH, Smith GB, Pappachan JV, Millar B. External validation of the SAPS II, APACHE II and APACHE III prognostic models in South England: a multicentre study. Intensive Care Med. 2003;29:249–56. doi: 10.1007/s00134-002-1607-9. [DOI] [PubMed] [Google Scholar]
- 16.Aegerter P, Boumendil A, Retbi A, Minvielle E, Dervaux B, Guidet B. SAPS II revisited. Intensive Care Med. 2005;31:416–23. doi: 10.1007/s00134-005-2557-9. [DOI] [PubMed] [Google Scholar]
- 17.Ledoux D, Canivet J-L, Preiser J-C, Lefrancq J, Damas P. SAPS 3 admission score: an external validation in a general intensive care population. Intensive Care Med. 2008;34:1873–7. doi: 10.1007/s00134-008-1187-4. [DOI] [PubMed] [Google Scholar]
- 18.Dybowski R, Weller P, Chang R, Gant V. Prediction of outcome in critically ill patients using artificial neural network synthesised by genetic algorithm. Lancet. 1996;347:1146–50. doi: 10.1016/s0140-6736(96)90609-1. [DOI] [PubMed] [Google Scholar]
- 19.Clermont G, Angus DC, DiRusso SM, Griffin M, Linde-Zwirble WT. Predicting hospital mortality for patients in the intensive care unit: a comparison of artificial neural networks with logistic regression models. Crit Care Med. 2001;29:291–6. doi: 10.1097/00003246-200102000-00012. [DOI] [PubMed] [Google Scholar]
- 20.Ribas VJ, López JC, Ruiz-Sanmartin A, et al. Severe sepsis mortality prediction with relevance vector machines. Conf Proc IEEE Eng Med Biol Soc. 2011;2011:100–3. doi: 10.1109/IEMBS.2011.6089906. [DOI] [PubMed] [Google Scholar]
- 21.Kim S, Kim W, Park RW. A Comparison of Intensive Care Unit Mortality Prediction Models through the Use of Data Mining Techniques. Healthc Inform Res. 2011;17:232–43. doi: 10.4258/hir.2011.17.4.232. [DOI] [PMC free article] [PubMed] [Google Scholar]
- 22.Foltran F, Berchialla P, Giunta F, Malacarne P, Merletti F, Gregori D. Using VLAD scores to have a look insight ICU performance: towards a modelling of the errors. J Eval Clin Pract. 2010;16:968–75. doi: 10.1111/j.1365-2753.2009.01240.x. [DOI] [PubMed] [Google Scholar]
- 23.Gortzis LG, Sakellaropoulos F, Ilias I, Stamoulis K, Dimopoulou I. Predicting ICU survival: a meta-level approach. BMC Health Serv Res. 2008;8:157–64. doi: 10.1186/1472-6963-8-157. [DOI] [PMC free article] [PubMed] [Google Scholar]
- 24.Dudoit S, Van Der Laan MJ. Asymptotics of cross-validated risk estimation in estimator selection and performance assessment. Statistical Methodology. 2003;2:131–54. [Google Scholar]
- 25.Lee J, Scott DJ, Villarroel M, Clifford GD, Saeed M, Mark RG. Open-access MIMIC-II database for intensive care research. Conf Proc IEEE Eng Med Biol Soc. 2011;2011:8315– 8. doi: 10.1109/IEMBS.2011.6092050. [DOI] [PMC free article] [PubMed] [Google Scholar]
- 26.Saeed M, Villarroel M, Reisner AT, et al. Multiparameter Intelligent Monitoring in Intensive Care II: a public-access intensive care unit database. Crit Care Med. 2011;39:952–60. doi: 10.1097/CCM.0b013e31820a92c6. [DOI] [PMC free article] [PubMed] [Google Scholar]
- 27.Goldberger AL, Amaral LA, Glass L, et al. PhysioBank, PhysioToolkit, and PhysioNet: components of a new research resource for complex physiologic signals. Circulation. 2000;101:E215–220. doi: 10.1161/01.cir.101.23.e215. [DOI] [PubMed] [Google Scholar]
- 28.Vincent JL, Moreno R, Takala J, et al. The SOFA (Sepsis-related Organ Failure Assessment) score to describe organ dysfunction/failure. On behalf of the Working Group on Sepsis-Related Problems of the European Society of Intensive Care Medicine. Intensive Care Med. 1996;22:707–10. doi: 10.1007/BF01709751. [DOI] [PubMed] [Google Scholar]
- 29.Neamatullah I, Douglass MM, Li-wei H, Lehman, et al. Automated de-identification of free-text medical records. BMC medical informatics and decision making. 2008;8:32–48. doi: 10.1186/1472-6947-8-32. [DOI] [PMC free article] [PubMed] [Google Scholar]
- 30.Van Der Laan MJ, Dudoit S. UC Berkeley Division of Biostatistics Working Paper Series. 2003. Unified cross-validation methodology for selection among estimators and a general cross-validated adaptive epsilon-net estimator: Finite sample oracle inequalities and examples; pp. 1–103. Working Paper. [Google Scholar]
- 31.Van der Laan MJ, Polley EC, Hubbard AE. Super learner. Stat Appl Genet Mol Biol. 2007;6:Article 25. doi: 10.2202/1544-6115.1309. [DOI] [PubMed] [Google Scholar]
- 32.Cox DR. Two further applications of a model for binary regression. Biometrika. 1958;45:562–5. [Google Scholar]
- 33.Harrison DA, Brady AR, Parry GJ, Carpenter JR, Rowan K. Recalibration of risk prediction models in a large multicenter cohort of admissions to adult, general critical care units in the United Kingdom. Crit Care Med. 2006;34:1378–88. doi: 10.1097/01.CCM.0000216702.94014.75. [DOI] [PubMed] [Google Scholar]
- 34.Kramer AA, Zimmerman JE. Assessing the calibration of mortality benchmarks in critical care: The Hosmer-Lemeshow test revisited. Crit Care Med. 2007;35:2052–6. doi: 10.1097/01.CCM.0000275267.64078.B0. [DOI] [PubMed] [Google Scholar]
- 35.Bertolini G, D’Amico R, Nardi D, Tinazzi A, Apolone G. One model, several results: the paradox of the Hosmer-Lemeshow goodness-of-fit test for the logistic regression model. J Epidemiol Biostat. 2000;5:251–3. [PubMed] [Google Scholar]
- 36.Miller ME, Hui SL, Tierney WM. Validation techniques for logistic regression models. Statistics in medicine. 1991;10:1213–26. doi: 10.1002/sim.4780100805. [DOI] [PubMed] [Google Scholar]
- 37.Cook NR. Use and misuse of the receiver operating characteristic curve in risk prediction. Circulation. 2007;115:928–35. doi: 10.1161/CIRCULATIONAHA.106.672402. [DOI] [PubMed] [Google Scholar]
- 38.Cook NR. Statistical evaluation of prognostic versus diagnostic models: beyond the ROC curve. Clin Chem. 2008;54:17–23. doi: 10.1373/clinchem.2007.096529. [DOI] [PubMed] [Google Scholar]
- 39.Pencina MJ, D’Agostino RB, Sr, D’Agostino RB, Jr, Vasan RS. Evaluating the added predictive ability of a new marker: from area under the ROC curve to reclassification and beyond. Stat Med. 2008;27:157–172. doi: 10.1002/sim.2929. discussion 207–212. [DOI] [PubMed] [Google Scholar]
- 40.LeDell E, Petersen M, van der Laan M, LeDell ME. [accessed March 13, 2014];Package ‘cvAUC’. ftp://ftp.sam.math.ethz.ch/sfs/Software/R-CRAN/web/packages/cvAUC/cvAUC.pdf.
- 41.Polley E, van der Laan M. SuperLearner: Super Learner Prediction. R package version. 2010:11–8. [Google Scholar]
- 42.Sing T, Sander O, Beerenwinkel N, Lengauer T. ROCR: visualizing classifier performance in R. Bioinformatics. 2005;21:3940–1. doi: 10.1093/bioinformatics/bti623. [DOI] [PubMed] [Google Scholar]
- 43.Johnson A, Dunkley N, Mayaud L, Tsanas A, Kramer A, Clifford G. Patient-specific Predictions in the ICU using a Bayesian Ensemble. Computing in Cardiology 2012. 2012;39:249–52. [Google Scholar]
- 44.Citi L, Barbieri R. PhysioNet 2012 Challenge: Predicting Mortality of ICU Patients using a Cascaded SVM-GLM Paradigm. Proc Computing In Cardiology 2012. 2012;39:257–60. [Google Scholar]
- 45.Greenland S. The need for reorientation toward cost-effective prediction: comments on ‘Evaluating the added predictive ability of a new marker: From area under the ROC curve to reclassification and beyond’ by M. J. Pencina et al., Statistics in Medicine (DOI: 10.1002/sim.2929) Stat Med. 2008;27:199–206. doi: 10.1002/sim.2995. [DOI] [PubMed] [Google Scholar]
- 46.Sakr Y, Krauss C, Amaral ACKB, et al. Comparison of the performance of SAPS II, SAPS 3, APACHE II, and their customized prognostic models in a surgical intensive care unit. Br J Anaesth. 2008;101:798–803. doi: 10.1093/bja/aen291. [DOI] [PubMed] [Google Scholar]
- 47.Rosenberg AL. Recent innovations in intensive care unit risk-prediction models. Curr Opin Crit Care. 2002;8:321–30. doi: 10.1097/00075198-200208000-00009. [DOI] [PubMed] [Google Scholar]
- 48.Steyerberg EW, Harrell FE, Jr, Borsboom GJJ, Eijkemans MJ, Vergouwe Y, Habbema JDF. Internal validation of predictive models: Efficiency of some procedures for logistic regression analysis. Journal of Clinical Epidemiology. 2001;54:774–81. doi: 10.1016/s0895-4356(01)00341-9. [DOI] [PubMed] [Google Scholar]
- 49.Strobl C, Malley J, Tutz G. An Introduction to Recursive Partitioning: Rationale, Application and Characteristics of Classification and Regression Trees, Bagging and Random Forests. Psychol Methods. 2009;14:323–48. doi: 10.1037/a0016973. [DOI] [PMC free article] [PubMed] [Google Scholar]
- 50.Van der Laan MJ, Rose S. Targeted Learning: Causal Inference for Observational and Experimental Data. Springer; 2011. [Google Scholar]