

Abstract
Redox-signaling is implicated in deleterious microglial activation underlying CNS disease, but how ROS program aberrant microglial function is unknown. Here, the oxidation of NF-κB p50 to a free radical intermediate is identified as a marker of dysfunctional M1 (pro-inflammatory) polarization in microglia. Microglia exposed to steady fluxes of H2O2 showed altered NF-κB p50 protein-protein interactions, decreased NF-κB p50 DNA binding, and augmented late-stage TNFα expression, indicating that H2O2 impairs NF-κB p50 function and prolongs amplified M1 activation. NF-κB p50−/− mice and cultures exhibited a disrupted M2 (alternative) response and impaired resolution of the M1 response. Persistent neuroinflammation continued 1 week after LPS (1mg/kg, IP) administration in the NF-κB p50−/− mice. However, peripheral inflammation had already resolved in both strains of mice. Treatment with the spin-trap DMPO mildly reduced LPS-induced 22 h TNFα in the brain in NF-κB p50+/+ mice. Interestingly, DMPO failed to reduce and strongly augmented brain TNFα production in NF-κB p50−/− mice, implicating a fundamental role for NF-κB p50 in the regulation of chronic neuroinflammation by free radicals. These data identify NF-κB p50 as a key redox-signaling mechanism regulating the M1/M2 balance in microglia, where loss of function leads to a CNS-specific vulnerability to chronic inflammation.
Keywords: Microglia, NF-κB p50, Redox Signaling, H2O2, CNS
INTRODUCTION
Microglia, the resident macrophages in the central nervous system (CNS), are critical actors regulating normal CNS physiology and health (Aguzzi et al. 2013). As CNS sentinels, microglia detect and respond to a diverse array of stimuli in the brain, including environmental toxins, bacterial toxins, cytokines, neuron damage, and disease proteins (Block et al. 2007), where the activation state exists on a spectrum of pro-inflammatory (M1) or alternative (M2) responses (Boche et al. 2013; Durafourt et al. 2012; Jang et al. 2013). M1 activation is characterized by the upregulation of pro-inflammatory mediators (ex. TNFα, IL-1β, COX2, and iNOS) and the production of reactive oxygen species (ROS, ex. H2O2 and ONOO−) (Block et al. 2007). Implicit in the maintenance of homeostasis, the initial M1 response is typically followed by a secondary M2 activation that is important for wound healing and resolving inflammation, which is marked by the expression of factors such as Arginase1 (Arg-1), Ym1, and Fizz1 (Boche et al. 2013; Durafourt et al. 2012; Mills 2012).
Accumulating evidence demonstrates that a deleterious and neurotoxic microglial phenotype occurs when microglia activation is dysregulated to become a polarized M1 phenotype (Hu et al. 2012; Liao et al. 2012), which is defined by an enhanced pro-inflammatory response with impaired resolution (M2 response) (Chhor et al. 2013; Jang et al. 2013). This unchecked microglial pro-inflammatory response is implicated in several late onset neurodegenerative diseases, such as Parkinson’s disease (McGeer et al. 1988). While the mechanisms driving the dysregulation of the microglial pro-inflammatory response are poorly understood, recent evidence has linked ROS to microglia-driven neuropathology (Cheret et al. 2008; Liao et al. 2012; Qin et al. 2013).
Redox signaling is an essential component of the M1 response (Brune et al. 2013) in microglia (Innamorato et al. 2009) and reports have also confirmed ROS regulation of microglial M2 activation (Innamorato et al. 2009; Liao et al. 2012). Published evidence indicates that compounds causing ROS production in microglia, such as rotenone and diesel exhaust particles, amplify the pro-inflammatory response in microglia without the ability to initiate the full M1 response (ex. initiate cytokine production) in this cell type (Gao et al. 2003; Levesque et al. 2011). Consistent with this premise, studies targeting NOX2 (Gao et al. 2003; Qin et al. 2013; Qin et al. 2004) and NOX1 (Cheret et al. 2008) enzyme isoforms by genetic deletion or the use of pharmacologic inhibitors to reduce microglial ROS production demonstrate an attenuated M1 response to the potent pro-inflammatory stimulus, lippopolysacharide (LPS). This enhanced sensitivity of microglia to pro-inflammatory stimuli conferred by ROS is often referred to as priming (Schilling and Eder 2011), which has been implicated in aging and neurodegenerative disease (Harry 2013; Lee et al. 2013). Reports also reveal that attenuation of microglial ROS through genetic deletion of NOX2 and NOX2 inhibitors elevates the microglial M2 markers in response to LPS (Choi et al. 2012). Together, these studies provide a framework to propose that ROS may drive a polarized M1 response in microglia, but precisely how ROS could regulate the M1/M2 balance in microglia is unclear.
The NF-κB family of transcription factors are intricately involved in macrophage M1 and M2 signaling (Porta et al. 2009), are redox sensitive (Kabe et al. 2005), and have been implicated in both microglial activation and neurodegenerative diseases (Saijo et al. 2009). A recent report documents the decline in NF-κB p50 expression in the substantia nigra of patients diagnosed with dementia with Lewy Bodies, supporting that aberrant NF-κB p50 function is involved in CNS disease (Saldana et al. 2007). NF-κB p50 is ubiquitously expressed, is the first redox sensitive eukaryotic transcription factor identified (Schreck et al. 1991; Staal et al. 1990), and is oxidized on residue cys62 (Kabe et al. 2005), where oxidation has been linked to decreased DNA binding (Kabe et al. 2005). Thus, while the thiyl radical form of NF-κB p50 has been implied in multiple cell types, the cysteine radical has yet to be identified and measured. Functionally, NF-κB p50 has dual roles in inflammation, where it traditionally forms a heterodimer with NF-κB p65 to initiate a pro-inflammatory cytokine response and NF-κB p50 homodimers act as repressors of pro-inflammatory genes (Pereira and Oakley 2008). Importantly, NF-κB p50 gene regulation is reported to be cell-specific, where repression or expression of a particular gene is dependent upon the organ/tissue/cell investigated (Ishikawa et al. 1998; Kabe et al. 2005). While previous reports indicate a complex role for NF-κB p50 in the microglial pro-inflammatory response in the hippocampus and murine Alzheimer’s disease models (Rolova et al. 2014), the consequences of loss of NF-κB p50 function for both the transfer of peripheral inflammation to the brain and the chronic, self-perpetuating microglial response/neuroinflammation are poorly understood. Furthermore, the role of NF-κB p50 in redox regulation of this process is unknown.
In an effort to understand how microglia shift to a chronically primed and polarized M1 phenotype, the current study sought to address: 1) the impact of ROS on microglial NF-κB p50; 2) the effect of NF-κB p50 on microglial M1 polarization and chronic, self-propelling neuroinflammation; 3) the role of NF-κB p50 in redox-regulation of chronic neuroinflammation. Here, we identify the NF-κB p50 radical for the first time and demonstrate a paradoxical role for NF-κB p50 in microglial redox regulation of activation, where the data support that microglial ROS impair NF-κB p50 protein/DNA binding interactions, the loss of NF-κB p50 function results in a CNS-specific vulnerability to chronic inflammation, and NF-κB p50 is a key regulator of redox-signaling driving chronic TNFα production in the brain.
MATERIALS AND METHODS
Reagents
Lipopolysaccharide (0111:B4, lot 050M4100) was purchased from Sigma-Aldrich (St. Louis, MO). Cell culture reagents were obtained from Invitrogen (Carlsbad, CA) and Corning (Corning, NY). HALT protease and phosphatase inhibitor was obtained from Thermo Fisher Scientific (Rockford, IL). The rabbit α-DMPO-nitrone adduct antibody was a generous gift from Ron Mason at NIEHS/NIH. The spin trap 5,5-dimethyl-1-pyrroline N-oxide (DMPO) was acquired from Dojindo Molecular Technologies (Rockville, MD). All other reagents were procured from Sigma Aldrich Chemical Company (St. Louis, MO).
Animals
Six-eight week old NF-κB p50 deficient mice (B6.Cg-Nfkb1 tm1Bal/J, NF-κB p50−/−), and C57BL/6J (NF-κB p50+/+) mice were purchased from Jackson Laboratories (Bar Harbor, Maine) and maintained in a strict pathogen-free environment. NF-κB p50−/− mice fail to express functional NF-κB p105 or NF-κB p50 proteins due to a targeted mutation of exon 6 in the Nfkb1 gene, which results in a non-functional truncated peptide that fails to dimerize with NF- κB subunits or bind DNA (Sha et al. 1995). Because the NF-κB p50−/− mutation is maintained in the C57BL/6J background, C57BL/6J (NF-κB p50+/+) mice were used as control animals. NF-κB p50−/− mice exhibit defective B cell responses, defective macrophage responses to pro-inflammatory stimuli, and defects in basal and specific antibody production (Cao et al. 2006; Snapper et al. 1996). Mouse breeding was designed to achieve accurate timed-pregnancy ±0.5 days. Housing, breeding, and experimental use of the animals were performed in strict accordance with the National Institutes of Health guidelines.
Primary Microglia Cultures
Primary enriched microglia cultures were prepared from whole brains of 1 day old C57BL/6J mouse pups, as previously described (Block et al. 2004).
Primary Mixed Glia Cultures
Primary mixed glia cultures containing approximately 55% astrocytes and 45% microglia were prepared from whole brains of 1 day old NF-κB p50−/− and NF-κB p50+/+ mouse pups, as previously described (Block et al. 2004).
BV2 Cells
The BV2 mouse microglia cell lines were maintained at 37°C in DMEM supplemented with 10% FBS, 50 U/mL penicillin and 50 μg/mL streptomycin in a humidified incubator with 5% CO2/95% air. Only passages 3–7 were used for the study.
N27 Cells
N27 cells are T-antigen immortalized rat mesencephalic dopaminergic (DA) neuron cells (Zhou et al. 2000). N27 cells were grown in RPMI 1640 medium supplemented with 10% fetal bovine serum, penicillin (100 U/ml), streptomycin (100 U/ml), and 2 mM L-glutamine. Cells were maintained at 37°C in a 5% CO2 humidified atmosphere.
Soluble Neuron Injury Factors-N27 Conditioned Media
Soluble neuron injury factors were prepared as previously reported (Levesque et al. 2010). Briefly, N27 cells were seeded (5 x10⁶ cells/well) in a 24 well plate. After 24 h, cells were exposed to treatment media alone or the DA neurotoxicant 1-methyl-4-phenylpyridinium (MPP+, 10 μM) for 24 hr. Cells were then washed three times with 1 mL/well of warm treatment media to remove MPP+. Next, 1 ml of fresh treatment media was added to each well and soluble factors were allowed to accumulate for 6 h. The conditioned (6 h) media was transferred to other cultures for treatment.
In vivo LPS Treatment
Six-eight week old male NF-κB p50+/+ and NF-κB p50−/− mice were given a single intraperitoneal (IP) injection of LPS (1 or 5 mg/kg) or equivalent volume of vehicle (0.9% saline). The LPS dose was based on our previously established Parkinson’s disease model (Qin et al. 2007) where peripheral inflammation quickly transfers to the brain to activate microglia in C57BL/6J mice. Early (3 h) or chronic (1 week) neuroinflammation and microglial activation was assessed, where serum and brain tissue were collected for protein, mRNA, or morphological analyses.
In vivo DMPO/LPS Treatment
To assess the effect of the free radical scavenger DMPO (Mason 2004) on early (3h) neuroinflammation, male NF-κB p50+/+ and NF-κB p50−/− mice were given an IP injection of DMPO (1g/kg) or equivalent volume of vehicle (0.9% saline) at 1h before and 1h after LPS (5mg/kg) injection. Serum and brain tissue were collected for analysis at 3h post-LPS injection. To discern the effect of the free radical scavenger DMPO on self-propelling and late (22h) neuroinflammation, male NF-κB p50+/+ and NF-κB p50−/− mice were given a single IP injection of LPS (5mg/kg) or equivalent volume of vehicle (0.9% saline). IP injections of DMPO (1g/kg) or equivalent volume of vehicle (0.9% saline) were given at 8, 16 and 20h post-LPS injection. Brain tissue was collected for mRNA analysis at 22h post-LPS injection.
Immunohistochemistry
The right hemisphere of the brain was fixed in 4% paraformaldehyde for 2 days and cryoprotected in 30% sucrose. Coronal sections (40 μm) of the midbrain region containing the substantia nigra pars compacta (SNpc) were collected with a freezing stage microtome (Microm HM 450, Thermo Scientific, Waltham, MA). Dopaminergic neurons were stained to confirm that sectioned samples across mice were in the same frame of the SNpc, and were recognized with an anti-tyrosine hydroxylase (TH, 1:1000) rabbit polyclonal antibody (Millipore Billerica, MA) and microglia were stained with a polyclonal rabbit anti-ionized calcium-binding adaptor molecule-1 (Iba1, 1:1000) antibody (Wako, Richmond, VA). Free-floating brain slices were treated with 1% H2O2, washed twice for 10 min with phosphate buffered saline (PBS), incubated 20 min with a blocking solution (PBS containing 1% bovine serum albumin, 4% goat serum, 0.4% Triton X-100) and incubated overnight at 4°C with primary antibody diluted 1:1000 in DAKO antibody diluent. Slices were then washed twice in PBS, incubated with biotinylated anti-rabbit antibody (Vector Laboratories, Burlingame, CA) for 1 h, washed twice in PBS, and incubated with Vectastain ABC Kit (Vector Laboratories, Burlingame, CA) reagents according to manufacturer’s instructions. Staining was visualized using 3,3′-diaminobenzidine and urea-hydrogen peroxide tablets (Sigma-Aldrich, St. Louis, MO). Images were captured with an Olympus BX51 microscope (Olympus America, Center Valley, PA).
Immuno-spin Trapping ELISA
Recent development of the immuno-spin trapping technique allows secondary radicals, such as protein radicals, to be stabilized with the spin trap DMPO and then identified with antibodies (Chatterjee et al. 2009; Ramirez et al. 2007; Ramirez and Mason 2005). More specifically, DMPO reacts with secondary radicals to form nitrone adducts, which then remain covalently attached as a radical reporter detected by the rabbit anti-DMPO antibody (Siraki et al. 2007). Quantification of secondary protein radicals was assessed in BV2 and primary microglia whole cell homogenates. For 30 min measures, BV2 cells were pre-loaded with 40 mM DMPO in serum-free media for 1 h prior to treatment and SIN-1 (1 μM) or glucose (5 μM)/glucose oxidase (50 mU/ml) (G/GO) was added. The time point of 30 min has been previously established as an ideal exposure time for ROS-producing compounds, such as rotenone (Gao et al. 2003), to enhance the microglial pro-inflammatory response to LPS. For 3 h measures, primary microglia were pre-loaded with 40mM DMPO for 30 minutes, followed by treatment for 3 h with DMPO in the treatment media. All cells were lysed after treatment with RIPA buffer containing Halt Protease and Phosphatase Inhibitor Cocktail (ThermoFisher Scientific, Rockland, IL) and DTPA (100 μM), as previously described (Chatterjee, 2007). After incubation of the samples on ice for 30 minutes, they were centrifuged at 14,000 xg for 10 min The supernatant was collected and stored at −20°C until use. For general quantification of DMPO-nitrone adducts by ELISA, a NUNC MaxiSorp (ThermoFisher Scientific, Rockland, IL) 96 well ELISA plate was coated with total cell lysate protein (100μg/well) at 4°C overnight. The plate was blocked with 1% casein solution (Sigma chemicals, St. Louis, MO) and 5% sucrose in PBS for 2 h. Next, a 1:1,000 dilution of anti-DMPO antibody in 1% casein was applied to the wells for 1 h. After washing 3x with PBS-T, a solution of 1:1,000 HRP-anti rabbit antibody in 1% casein and PBS was applied to the wells. After washing 3X with PBS-T, 100ul of 3,3′,5′5-tetramethylbenzidine liquid substrate (Sigma chemicals, St. Louis, MO) was applied to each well for 20 minutes. This was followed by addition of 50ul of the 2N H2SO4 stop solution and the plate was read at 450 A° on a SpectraMax M2 plate reader (Molecular Devices, Sunnyvale, CA).
Immuno-spin Trapping Immunoprecipitation
The NF-κB p50 radical was identified by immunoprecipitating with the anti-DMPO antibody or the anti-NF-κB p50 antibody (sc-114, Santa Cruz Biotechnology, Dallas, TX) using the Peirce Crosslink IP Kit (ThermoFisher Scientific, Rockland, IL) and western blot analysis of the IP samples. Protein homogenate samples were pre-cleared (1 h at 4°C) with the control agarose resin slurry provided with the kit. An antibody column was prepared according to manufacturer instructions using 25μg of anti-DMPO antibody or 25μg of the anti-NF-κB p50 antibody. The homogenate (600 μg/sample) was incubated and rocked overnight at 4°C with the antibody/agarose slurry mixture in the column. Immune complexes were eluted with elution buffer according to the manufacturer’s instructions. The elution fractions were then resuspended in NuPAGE LDS sample loading buffer and immediately resolved by reducing SDS-PAGE in 4–12% Bis Tris gels (Invitrogen, Carlsbad, CA, USA). The NF-κB p50 radical was identified by western blot of the IP sample with an NF-κB p50 antibody when the IP was performed with the DMPO antibody or the DMPO antibody was used to identify the protein radical when the IP was performed with the anti-NF-κB p50 antibody.
Nuclear Protein Extraction & NF-κB p50 DNA Binding ELISA
Nuclear protein was collected using a commercially available Nuclear Extract kit (Active Motif, Carlsbad, CA). Nuclear protein was assessed for the ability to bind a generic NF-κB DNA consensus site (5′-GGGACTTTCC-3′) immobilized on a 96 well plate using the TransAM NFκB Chemi ELISA (Active Motif, Carlsbad, CA), following manufacturer instructions.
Analysis of Nuclear NF-κB p50 Disulfide Bonds with Co-immunoprecipitation and Non-reducing Gels
Nuclear protein was collected using a commercially available Nuclear Extract kit (Active Motif, Carlsbad, CA). Co-IP was performed on the pre-cleared nuclear extract with a goat polyclonal anti-NF-κB p50 antibody (10 μg/column, C-19, Santa Cruz Biotechnology, Dallas, TX) using a commercially available kit (ThermoFisher Scientific, Rockland, IL) according to manufacturer’s instructions. The elution fractions from the IP were then resolved in non-reducing conditions (no DTT added to the sample, preserving disulfide bridges), on a 4–12% Bis Tris gel (Invitrogen, Carlsbad, CA, USA). Western blot analysis and staining with a goat polyclonal anti-NF-κB p50 antibody (1:500, C-19, Santa Cruz Biotechnology, Dallas, TX) was used to identify the disulfide bond preserved protein binding profile of nuclear NF-κB p50 in microglia. Non-eluted nuclear protein was probed with rabbit polyclonal anti-lamin b2 antibody (1:1000 Abcam, Cambridge, MA) on a separate gel as a loading control. Nuclear protein loaded to control agarose resin (ThermoFischer Scientific, Rockland, IL) was used as a negative control.
siRNA Knockdown of NFκB1 in BV2 Cells
The commercially available double-stranded siRNA Silencer Select oligonucleotide against the mouse NFκB1 gene (s70544) and the mouse control oligonucleotide siRNA (4390843) was purchased from Invitrogen Life Technologies (Grand Island, NY). BV2 cells were reverse transfected for 48 h by seeding 0.5 x 10⁴ cells/well in a 24 well plate in a final 500 μl volume of 10 nM siRNA (control or NFKB1), 100μl of Opti-MEM 1x + GlutaMAX (Invitrogen Life Technologies, Grand Island, NY), 400μl of DMEM (Invitrogen Life Technologies, Grand Island, NY), and 0.75 μl Lipofectamine RNAiMax (Invitrogen Life Technologies, Grand Island, NY). An additional 500 μl of DMEM media containing 2% FBS in addition to the transfection reagents listed above was added to the wells as a final boost to the knockdown for an additional 24 h of transfection. At 72 h after seeding, media containing siRNA and transfection reagents were removed and cells were treated with DMEM containing 2% FBS. NFκB1 knockdown was assessed with the mouse GAPDH (4448490) and NFκB1 (4331182) TaqMan Gene Expression Assays (Life Technologies, Grand Island, NY) per manufacturer instructions. These transfection conditions provided maximum NFκB1 knockdown of 63% at 6 h post-treatment (Figure S1a) without toxicity (data not shown) that remained reduced at 12h (Figure S1b).
Quantitative Reverse Transcriptase Polymerase Chain Reaction
Total RNA was extracted from the left hemisphere of the mouse midbrain or from primary cell cultures using Trizol (Invitrogen Life Technologies, Grand Island, NY) according to manufacturer’s instructions. The RNA was treated with Ambion DNase I (Invitrogen Life Technologies, Grand Island, NY) which was subsequently removed with Qiagen RNeasy RNA cleanup kit (Qiagen, Germantown, MD). The RNA (1.0 – 0.3 μg/sample) was reverse transcribed using iScript Reverse Transcription Supermix (BioRad, Hercules, CA) according to manufacturer’s instructions. Quantitative RT-PCR was performed on a CFX96 (BioRad, Hercules, CA) real-time PCR detection system with 1 μl of cDNA, SsoFast Evagreen Supermix (BioRad, Hercules, CA), and 500 nM forward and reverse primers, per manufacturer’s instructions. Cycling parameters were 1 cycle at 95°C for 5 min, 40 cycles of 95°C (5 sec.) and 56°C (5 sec.) followed by a melt curve measurement consisting of 5 second 0.5°C incremental increases from 65°C to 95°C. Table S1 lists the primer sequences used in this study.
Adult Microglia Isolation
Adult microglia isolation was performed as previously described (Harms and Tansey 2013; Schwarz et al. 2013). Briefly, at 3h post-injection mice were anesthetized and perfused with 50 mL cold PBS. Whole brain tissue (400 mg) was cut into small pieces with a sterile razor, suspended in 1 ml Hank’s buffered saline solution (HBSS) without CaCl2 and MgCL2 (Corning, Corning, NY) and spun 2 min at 300 xg, 4°C. A single-cell suspension was prepared using the Miltenyi Neural Tissue Dissociation Kit (P, Miltenyi Biotec, San Diego, CA) according to manufacturer’s instructions. The single-cell suspension was washed with 10 ml HBSS containing CaCl2 and MgCL2 (Corning, Corning, NY) and spun for 10 min at 300 xg, 4°C. Next, the cells were depleted of myelin by suspension in 3 ml of 30% isotonic Percoll (GE Healthcare Life Sciences, Pittsburgh, PA) followed by a 10 min centrifugation at 700 xg, 4°C. The cell pellet was washed in 5 ml HBSS without CaCl2 and MgCL2 and isolation of microglia was performed with magnetic CD11b microbeads (Miltenyi, San Diego, CA) and MACS magnetic separator (Miltenyi, San Diego, CA) according to manufacturer’s instructions. Flow cytometry analysis of CD11b microbead isolated cells confirmed that 87.0% of isolated cells were CD11b+ (Figure S2).
Confirmation of Microglia Isolation with Flow Cytometry
Following adult microglia isolation, purity was assessed by flow cytometry. After washing with cold wash buffer (0.5% BSA, 2mM EDTA in PBS) the cells were incubated 5 min, at 4°C with 5 μL Mouse Fc Receptor Block (CD16/CD32; BD Pharmingen, San Diego, CA) followed by a 20 min incubation at 4°C in the dark with PE-conjugated monoclonal anti-mouse CD11b (Miltenyi Biotec, San Diego, CA) or PE-conjugated rat IgG2b κ isotype (eBioscience, San Diego, CA). Cells were washed and resuspended in cold wash buffer prior to analysis on a BD FACSCanto II Analyzer (BD Biosciences, San Jose, CA). Doublets were excluded from each sample based on forward scatter (height vs. area) while dead cells were excluded based on propidium iodide staining.
Tumor Necrosis Factor α ELISA
The TNFα concentrations in sera and cell culture media were measured with a commercial ELISA kit from R&D Systems (Minneapolis, MN), as previously reported (Qin et al. 2007).
Stereology: Assessment of Microglia Morphology
Evaluation of microglial activation in the SNpc using the fractionator method of unbiased stereology was performed, as previously described (Hutson et al. 2011). Briefly, using TH-stained sections to discern all samples were in the same frame in the SNpc, the SNpc was delineated with a 4X objective in 3 evenly spaced coronal sections at −3.14, −3.26, and −3.38 mm bregma and IBA-1 stained microglia within the SNpc were counted with a 40X objective. Previously defined morphological parameters (Hutson et al. 2011) were used to score stages of microglial activation on a scale of 0–3. More specifically, microglia were categorized into stages of activation ranging from resting (stage 0) to several activated stages (stages 1– 3) that are classified based on thickness, length, complexity of processes, and cell body size (Figure 5a). Samples were counted in a blind manner by 2 individuals using an Olympus BX51 microscope (Center Valley, PA) and newCAST software (Visiopharm, Hoersholm, Denmark). Conclusions were drawn only when differences in counts were less than 12% between individuals.
Figure 5. NF-κB p50−/− mice have enhanced activated microglia morphology in response to peripheral LPS injection.

NF-κB p50+/+ and NF-κB p50−/− mice were injected with saline or LPS (5 mg/kg, IP) to discern the impact of loss of NF-κB p50 function on microglia morphology in vivo. (a) Images (60X) depict representative examples of microglial activation stages. Microglia within the substantia nigra pars compacta (in the midbrain) were stained with IBA1 and categorized into stages of activation. The relative number of microglia at 3 h post injection within (b) Stage 0, (c) Stage 1, (d) Stage 2, and (e) Stage 3 was quantified by the fractionator method. Values are reported as mean cells/μm2 ± s.e.m. of 3 coronal sections (40 μm) per animal (n=3). An asterisk indicates significant difference (P<0.05) from control and an † indicates a difference between mouse strains. (f) Representative images are 40X and the scale bar depicts 50 μm.
Statistical Analysis
Data were analyzed by a one way or two way analysis of variance, the treatment groups were expressed as the mean ±SEM, and mean differences were assessed with Bonferroni’s post-hoc analysis. To assess significant differences in mortality, a Chi-Square test was used. In cases where only two means could be compared, an independent t-test was used. A value of P<0.05 was considered statistically significant.
RESULTS
The NF-κB p50 Radical is Associated with Impaired NF-κB p50 Function in Microglia
Free radicals and reactive species (ex. H2O2, CO3•−, •OH, and ONOO−) are primary oxidants produced during microglial M1 activation (Block et al. 2007) that react with cellular components (ex. proteins, DNA, RNA, and antioxidants), which may then be converted into radicals themselves (secondary radicals) (Ramirez and Mason 2005). While many oxidative changes may occur in activated microglia, only some molecules become a radical containing an unpaired electron and of these, it is unknown how many are functionally relevant for the activation phenotype. To begin to address how ROS impact redox sensitive signaling in microglia, microglia cells were treated with LPS (100 ng/ml), the peroxynitrite generator SIN-1 (1 mM), or the hydrogen peroxide (H2O2) generator system glucose/glucose oxidase (G/GO, 50 mU/mL) for 30 minutes. Immuno-spin trapping analysis of whole cell lysate by ELISA revealed that LPS (P<0.05, Figure 1a; Figure S3), G/GO (P<0.05, Figure 1b), and SIN-1 (P<0.05, Figure S4a) resulted in the elevation of free radical-derived protein-nitrone adducts in microglia, supporting the presence and elevation of secondary radicals derived from the oxidation of protein in the cells. Immunoprecipitation of NF-κB p50 from the total cell lysate and subsequent analysis by western blot with a specific antibody detecting the free radical reporter DMPO identified the NF-κB p50 radical in BV2 cells 30 minutes after G/GO treatment (P<0.05, Figure 1c). Immuno-spin trapping analysis by immunoprecipitation also identified the NF-κB p50 radical in cell lines and primary microglia treated with other M1 polarizing agents and ROS generators, such as LPS (Figure 1d), neuron injury factors, (Figure 1d), and SIN-1 (Figure S4b). Thus, data support that both ROS and known triggers of M1 polarization induce the formation of the oxidized product, the NF-κB p50 radical in microglia.
Figure 1. Microglial ROS result in NF-κB p50 radical formation, impairs NF-κB p50 function, and augments late stage TNFα expression.

BV2 microglia pre-loaded with 40mM of the spin-trap DMPO and treated with (a) LPS 100 ng/ml for 3h and (b) glucose/glucose oxidase (G/GO, 5mM, 50 mU/ml) for 30 minutes show elevated levels of DMPO-nitrone adducts, as measured by immuno-spin trapping ELISA, indicating that secondary radicals (proteins and DNA) important for redox signaling are elevated in activated microglia. (c) NF-κB p50 immunoprecipitation and immuno-spin trapping of total cell lysate reveal the presence of the radical form of NF-κB p50 in G/GO treated BV2 cells at 30 minutes post treatment. A representative image is shown. n=3. (d) Primary microglia were treated with 40 mM of the spin-trap DMPO combined with media alone (Control), LPS 10 ng/ml, or neuron injury factors (NIF, from N27 neurons treated with 10 μM MPP+) for 3 h reveal the NF-κB p50 radical is present in microglia activated by diverse M1 stimuli 3 h after treatment. A representative image is shown. n=3. (e) NF -kB p50 co-immunoprecipitation of nuclear lysate and resolution on a non-denaturing gel to preserve disulfide bonds shows modification of NF-kB p50 protein-protein interactions in G/GO activated BV2 cells at 30 minutes post treatment. n=3 (f) G/GO treatment of BV2 nuclear extract collected at 24 h post-LPS 10 ng/ml reduces NF-κB p50 DNA binding as assessed by ELISA. Values are reported as mean percent of control ± s.e.m. n=3. G/GO augments TNFα (g) mRNA and (h) protein expression at 24 h in BV2 cells treated with repeated LPS treatments (0 and 21 h). Values are reported as mean percent of control ± s.e.m. n=3. mRNA expression was evaluated by quantitative RT-PCR, values were normalized to GAPDH using the 2−ΔΔCT method. An asterisk indicates significant difference (P<0.05) from control.
G/GO was used to discern the impact of H2O2 on NF-κB p50 function in microglia. Western blot analysis of nuclear extracts revealed that G/GO caused no significant changes in the amount of NF-κB p50 in the nucleus (data not shown). Isolation of nuclear extract from microglia treated with G/GO for 30 minutes and co-immunoprecipitation of NF-κB p50 revealed that H2O2 changed NF-κB p50 protein-protein binding interactions (Figure 1e). Samples run out on a non-reducing gel, transferred, and probed with the NF-κB p50 antibody for western blot demonstrate that G/GO decreased the upper band when compared to control (Figure 1e). The analysis of DNA binding in G/GO-treated microglial nuclear extracts at 30 minutes post treatment showed a G/GO-induced decline in DNA binding, as measured by ELISA (P<0.05, Figure 1f). Treatment of microglial extracts with DTT enhanced NF-κB p50 DNA binding (P<0.05, Figure S5a). DTT pre-treatment in BV2 cells reduced LPS-induced TNFα protein in the supernatant at 3 h (P<0.05, Figure S5b) and mRNA production at 24 h (P<0.05, Figure S5c) without toxicity(P>0.05, Figure S5d), further supporting that the oxidation/reduction status of microglial NF-κB p50 regulates DNA binding and the production of TNFα. Further, 3 h G/GO treatment in microglia at 20 h after repeated LPS treatment resulted in augmented TNFα expression (Figure 1g, Figure 1h, P<0.05), indicating that H2O2 amplifies the late stages of the M1 response, particularly affecting tolerance. Together, data support that H2O2 impairs NF-κB p50 protein-protein interactions and reduces NF-κB p50 DNA binding in microglia, thereby instigating loss of function and a chronic M1 response marked by the presence of the oxidized form of NF-κB p50 protein.
Microglial NF-kB p50/NF-kB p65 DNA Binding Kinetics in Response to LPS are Divergent
The ability of nuclear NF-κB p50 and NF-κB p65, prototypical pro-inflammatory transcriptions factors of the NF-κB canonical activation pathway, to bind DNA was assessed across time. Figure 2a demonstrates unique DNA binding patterns over time for the two transcription factors, where NF-κB p65 shows peak DNA binding at 3 h, followed by continual decline observed for 24 h after stimulus. However, NF-κB p50 steadily increases DNA binding following LPS treatment until approximately 8 h after the stimulus, where it plateaus and remains elevated out to 24 h (Figure 2a, P<0.05). Differences between NF-kB p50 and NF-κB p65 were the most robust at 24 h post LPS treatment (Figure 2a, P<0.05). These distinct DNA binding trajectories from the same nuclear extract support the presence of separate activity and function for NF-κB p50 and NF-κB p65 in the normal microglial M1 response.
Figure 2. Loss of NF-κB p50 shifts the M1 kinetic response to LPS in CNS cells.

(a) Analysis of nuclear extracts from BV2 microglia stimulated with 10ng/ml LPS collected at 1, 3, 8 and 24 h post-treatment shows divergent NF-κB p50 and NF-κB p65 DNA binding kinetics over time and predominant NF-κB p50 DNA binding during the later stages of the pro-inflammatory response. Values are reported as mean percent of 0 h time point ± s.e.m. n=3. Primary NF-κB p50+/+ and NF-κB p50−/− mixed glia cultures were treated with LPS 10 ng/ml and (b) TNFα mRNA, (c) TNFα protein, and (d) IL-1β mRNA expression were assessed. BV2 microglia reverse transfected with control or NFκB1 siRNA for 72 h showed enhanced (e) TNFα and (f) IL-1β mRNA expression at 6h post-LPS 10 ng/ml treatment. mRNA expression was evaluated by quantitative RT-PCR, values were normalized to β-actin or GAPDH using the 2−ΔΔCT method and were reported as mean expression ± s.e.m. Protein expression was evaluated by a commercially available ELISA and reported as the mean concentration ± s.e.m. An asterisk indicates significant difference (P<0.05) from control and an † indicates a difference between siRNA treatments or genotype.
Loss of NF-κB p50 Shifts the M1 Kinetic Response in CNS Cells
Primary mixed-glia cultures (containing microglia and astrocytes) from NF-κB p50+/+ and NF-κB p50−/− mice were used to examine the LPS-induced pro-inflammatory gene expression across time. Significant genotype differences in peak expression occurred at 6 h for TNFα (Figure 2b, P<0.05) and 3 h for IL-1β (Fig 2d, P<0.05), where NF-κB p50−/− cultures showed the highest expression of TNFα and the lowest expression of IL-1β. Assessing TNFα protein in the supernatant by ELISA determined that genotype differences in peak expression occurred at 12 h after LPS treatment (Figure 2c, P<0.05), where again NF-κB p50−/− cultures showed the highest expression. siRNA knockdown of NFκB1 (NF-κB p50 gene) in BV2 cells showed that reduction of NF-κB p50 augmented 6h TNFα mRNA (Figure 2e, P<0.05), and IL-1β (Figure 2f, P<0.05) in response to LPS in microglia cells. However, treatment of mixed-glia cultures with TNFα (4ng/ml) revealed elevated TNFα (Figure 3a, P<0.05) and reduced IL-1β (Figure 3b, P<0.05) at 6 h in NF-κB p50−/− cultures. Notably, there was no impact of loss of NF-κB p50 function on COX2 expression in NF-κB p50−/− mixed glia and NFκB1 siRNA knockdown in microglia treated with LPS or TNFα (data not shown). Thus, the amplifying effect of NF-κB p50 functional loss was dependent upon the pro-inflammatory factor, the cell culture type, and the timing of the assessment. Together, data indicate that that loss of NF-κB p50 shifts the kinetic response of M1 activation, favoring the prolongation of the TNFα response in CNS cells, particularly microglia.
Figure 3. Loss of NF-κB p50 function modulates the M1 response to TNFα in CNS cells.
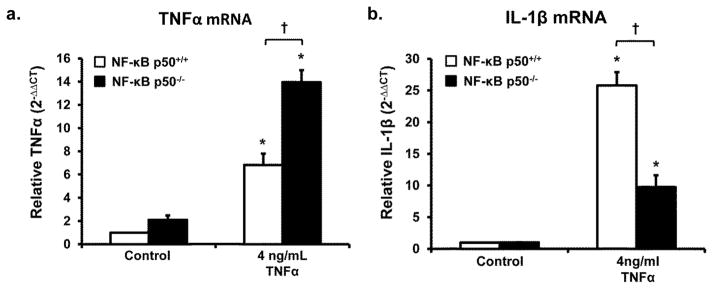
Primary NF-κB p50+/+ and NF-κB p50−/− mixed-glia cultures were treated with TNFα (4 ng/ml). (a) TNFα and (b) IL-1β mRNA expression were evaluated at 6h post-treatment by quantitative RT-PCR. Values are normalized to β-actin using the 2−ΔΔCT method. An asterisk indicates significant difference (P<0.05) from control and an † indicates a difference between mouse strains. n=3
NF-κB p50 and Early M1 Activation
The systemic effects of LPS have long been implicated in neuropathology (Ling et al. 2006; Qin et al. 2007; Wang et al. 2009). Peripheral injection of LPS (5 mg/kg, IP) in NF-κB p50+/+ and NF-κB p50−/− adult mice was employed to determine how loss of NF-κB p50 function impacts the peripheral circulating cytokine response, the transfer of inflammation from the periphery to the brain, and the degree of M1 activation in the brain. Peripheral LPS administration rapidly stimulates circulating cytokine production, where cytokines cross the blood brain barrier, activate microglia in the substantia nigra pars compacta (SNpc) in the midbrain (Qin et al. 2007), and elevate ROS production in the striatum (Clement et al. 2010). As such, serum and midbrain measures of pro-inflammatory factors in the current study were assessed at 3 h after treatment. NF-κB p50−/− mice responded to LPS with significantly elevated levels of circulating TNFα when compared to NF-κB p50+/+ mice, indicating an enhanced peripheral pro-inflammatory response in the absence of NF-κB p50 (P<0.05, Figure 4a). Similar effects in the midbrain were found, where LPS-induced TNFα mRNA (P<0.05, Figure 4b) and IL-1β mRNA (P<0.05, Figure 4c) expression was significantly elevated in NF-κB p50−/− mice. However, while LPS increased midbrain COX-2 mRNA expression levels in both NF-κB p50−/− and NF-κB p50+/+ mice, genotype differences were not significant (data not shown). NF-κB p50−/− mice also produced lower levels of midbrain TGFβ in response to LPS (P<0.05, Figure S6), indicating lower levels of the production of M2 polarizing signals. Together, these data demonstrate that loss of NF-κB p50 function causes enhanced peripheral inflammation, where this pro-inflammatory priming transfers to the brain. While NF-κB p50−/− mice exhibited an enhanced TNFα and IL-1β response in the midbrain, COX-2 was unaffected at 3 h post-treatment, further supporting that NF-κB p50 differentially regulates gene expression of M1 markers.
Figure 4. Peripheral and central inflammation in NF-κB p50−/− mice.

NF-κB p50+/+ and NF-κB p50−/− mice were injected with saline or LPS (5 mg/kg, IP) to investigate the effects of loss of NF-κB p50 function on neuroinflammation. Serum and midbrain tissue were collected following sacrifice at 3h post-injection. (a) Circulating serum TNFα levels were measured with ELISA. Neuroinflammation in the midbrain was assessed by measuring (b) TNFα, and (c) IL-1β through quantitative RT-PCR. To discern the role of NF-κB p50 in how free radicals regulate the LPS response, DMPO (1 g/kg, IP) or vehicle (0.9% saline) was administered to NF-κB p50+/+ and NF-κB p50−/− mice 1h before and 1h after LPS (5mg/kg IP) injection. Peripheral inflammation was assessed at 3h post-LPS injection by measuring circulating serum TNFα in (d) NF-κB p50+/+ and (e) NF-κB p50−/− mice with ELISA. Neuroinflammation in the midbrain was assessed at 3h post-LPS injection by TNFα expression in (f) NF-κB p50+/+ and (g) NF-κB p50−/− mice through quantitative RT-PCR. Values are normalized to β-actin or GAPDH using the 2−ΔΔCT method and are reported as mean expression ± s.e.m. An asterisk indicates significant difference (P<0.05) from control and an † indicates a difference between mouse strains. n=3–5
To begin to distinguish the effects of NF-κB p50 loss specific to microglia in vivo, microglia morphology was analyzed in the SNpc of saline or LPS-treated NF-κB p50+/+ and NF-κB p50−/− mice at 3 h post-injection. While there were no significant differences in total microglial number conferred by genotype or treatment (data not shown), microglia morphology in response to LPS was affected by the loss of NF-κB p50 function. Consistent with the premise of enhanced M1 activation, NF-κB p50−/− mice showed the greatest decrease in number of resting microglia in response to LPS (Stage 0) (P<0.05, Figure 5b). However, LPS injection resulted in similar elevation of Stage 1 activated microglia in both genotypes (P<0.05, Figure 5c). Importantly, NF-κB p50−/− mice had the greatest increase in microglia with higher stages of activation (Stage 2 and Stage 3) in response to LPS when compared to NF-κB p50+/+ mice (P<0.05, Figure 5d–f). These findings detail how the absence of functional NF-κB p50 results in a heightened morphological response of microglia in the SNpc, where NF-κB p50−/− mice have fewer resting microglia and greater numbers of intensely activated cells in response to LPS.
To determine whether M1 activation in microglia was affected by loss of NF-κB function, microglial cells were isolated from adult brains after saline or LPS treatment and gene expression was assessed with quantitative RT-PCR. Microglia cells from LPS-treated NF-κB p50−/− mice showed the highest levels of TNFα (Figure 6a, P<0.05), IL-1β (Figure 6b, P<0.05), and COX2 (Figure 6c, P<0.05) mRNA expression at 3 h. This is consistent with the premise that NF-κB p50−/− microglia have an enhanced M1 response, supporting that these cells may be more responsive to peripheral inflammation and that the microglia themselves are a cellular source of elevated pro-inflammatory factors in the midbrain.
Figure 6. Adult NF-κB p50−/− microglia display elevated M1 activation in response to peripheral LPS.

NF-κB p50+/+ and NF-κB p50−/− mice were injected with saline or LPS (5 mg/kg, IP) and microglia were isolated from the whole brain with CD11b microbeads at 3h post-injection. Isolated microglia were assessed for differences in (a) TNFα, (b) IL-1β, and (c) COX-2 mRNA expression through quantitative RT-PCR. Values are normalized to GAPDH using the 2−ΔΔCT method and are reported as mean expression ± s.e.m. An asterisk indicates significant difference (P<0.05) from control and an † indicates a difference between mouse strains. n=6 for all panels except a (n=3).
DMPO was used to begin to explore the role of free radicals in the regulation of the early TNFα response in vivo. DMPO, which scavenges primary and secondary radicals, was administered as a pre-treatment to NF-κB p50+/+ and NF-κB p50−/− mice. Both circulating and brain TNFα levels were assessed at 3h after LPS or saline administration. DMPO treatment reduced levels of TNFα production in the brain in saline-treated mice from both strains (P<0.05, Table S4), supporting a role for radicals in the regulation of resting brain TNFα expression. In addition, DMPO reduced TNFα levels in response to LPS in the serum and brain of only NF-κB p50−/− mice (P<0.05, Figure 4d and Figure 4e), suggesting that loss of NF-κB p50 function may augment LPS-induced redox signaling effects at the 3h time point.
NF-κB p50, Pro-inflammatory Resolution, & M2 Activation
Inducible nitric oxide synthase (iNOS) converts L-arginine to nitric oxide, is a key component of the M1 response, is upregulated in neurodegenerative disease, and has long been linked to microglia-mediated neuropathology (Bal-Price and Brown 2001; Tieu et al. 2003). Interestingly, iNOS expression was the highest in the midbrain of NF-κB p50+/+ mice in response to LPS at 3h (Figure 7a, P<0.05), and adult NF-κB p50+/+ microglia isolated after LPS treatment at 3 h (Figure 7b, P<0.05). However, kinetic analysis of LPS-induced iNOS mRNA expression in primary NF-κB p50+/+ and NF-κB p50−/− mixed glia cultures showed an early pattern that was similar to our in vivo results where iNOS expression was lower in LPS treated NF-κB p50−/− at 3 h, but the difference was not statistically significant. While LPS-induced iNOS expression remained at relatively similar levels across all observed time points in NF-κB p50+/+ mixed glia cultures, iNOS expression in NF-κB p50−/− cells increased across time and peaked at 12 post-treatment, where expression was significantly higher than NF-κB p50+/+ cultures at 12 h (Figure 7c, P<0.05). TNFα treatment showed no significant genotype effects for iNOS expression in mixed glia cultures at 6h (Figure 7d, P>0.05). Thus, the consequences of loss of NF-κB p50 on iNOS expression are time dependent, where amplification due to loss of function occurs at later time points.
Figure 7. Loss of NF-κB p50 function inhibits the M2 response and impairs M1 resolution in the brain.

iNOS mRNA expression is decreased in (a) midbrain and (b) CD11b microbead isolated microglia of NF-κB p50−/− mice at 3 h post-injection LPS (5 mg/kg IP). (c) Evaluation of iNOS gene expression across time shows that primary NF-κB p50−/− mixed glia cultures have enhanced iNOS expression only at the later time point, 12 h post-LPS 10 ng/ml treatment. (d) Consistent with these findings, no genotype differences in iNOS gene expression were seen at 3 h in response to TNFα in primary mixed glia cultures. (e) The M2 marker Arginase-1 is downregulated in primary NF-κB p50−/− mixed glia cultures at 12 h post-LPS 10 ng/ml treatment. (f) BV2 microglia reverse transfected with NFκB1 siRNA for 72 h show reduced 12 h Arginsae-1 expression in response to IL-4 (10 ng/ml). (g) NF-κB p50−/− mice injected with LPS (1 mg/kg IP) continue to display elevated TNFα expression in the midbrain at 1 week post-injection. (h) DMPO (1g/kg IP) injected at 8,16 and 20h post -LPS (5mg/kg IP) treatment mildly reduced midbrain TNFα expression in NF-κB p50+/+ mice yet enhanced TNFα expression in NF-κB p50−/− mice at 22h post-LPS injection. Gene expression evaluated through quantitative RT-PCR with values normalized to β-actin or GAPDH using the 2−ΔΔCT method and reported as mean expression ± s.e.m. An asterisk indicates significant difference (P<0.05) from control and an † indicates a difference between mouse strains. n=3 for all panels except b (n=5), f (n=9) and g (n=4).
M2 activation follows the M1 activation at later stages in the normal, healthy pro-inflammatory response. Arg-1 is an enzyme and M2 marker important for downregulating iNOS activity. Arg-1 metabolizes L-arginine to ornithine and urea thereby limiting the supply of substrate to iNOS. Here, we show that NF-κB p50−/− mixed glia cultures demonstrated significantly lower expression of Arg-1 in untreated controls and in LPS-treated cultures at 12 h (Figure 7e, P<0.05) and 24 h (data not shown). Analysis of other M2 markers, such as YM1 and FIZZ1 showed no baseline genotypic differences, no elevation in response to M1 stimuli, and no modification with loss of NF-κB p50 function (data not shown). NFκB1 siRNA knockdown in BV2 cells caused reduced Arg-1 expression in response to IL-4 (Figure 7f, P<0.05), suggesting that loss of NF-κB p50 function may impair the ability of microglia to respond to M2 polarizing stimuli. These findings support that loss of NF-κB p50 dysregulates iNOS function, where only the late iNOS expression is augmented, potentially shifting this component of the M1 balance towards an elevated and chronic response.
Due to excessive mortality rates in NF-κB p50−/− mice at both 24 h (Table S3) and 1 week (Table S2) after exposure to LPS (5 mg/kg, IP), a lower dose of LPS (1 mg/kg, IP) was used to explore the chronic effects of loss of NF-κB p50 function. Importantly, midbrain analysis revealed that only TNFα remained elevated 1 week after LPS treatment from all M1 and M2 markers measured, and only NF-κB p50−/− mice showed this persistent neuroinflammation (Figure 7g, P<0.05). Further, no elevation of circulating cytokines were detected in the serum (data not shown), supporting that this chronic component of the M1 response was limited to the brain.
To determine the role of radicals in chronic and self-propelling neuroinflammation in in vivo, DMPO was administered after initiation of the pro-inflammatory response, at 8, 16 and 20 h after LPS in NF-κB p50+/+ and NF-κB p50−/− mice. Our previous reports have shown that at 22 h after peripheral LPS injection, circulating TNFα levels have resolved to resting levels but neuroinflammation persists in a self-propelling, chronic state (Qin et al. 2007). As such, brain TNFα levels were assessed at 22 h after LPS administration. While DMPO treatment resulted in a trend of TNFα reduction in LPS-treated NF-κB p50+/+ (P = 0.10), NF-κB p50−/− mice showed an opposite effect of TNFα augmentation (P<0.05, Figure 7h). Thus, NF-κB p50 is implicated as an important mechanism of redox signaling driving persistent CNS TNFα production, where loss of NF-κB p50 function reverses the effect of DMPO in vivo.
DISCUSSION
Dysregulated microglial activation favoring an excessive and chronic pro-inflammatory (M1) phenotype has been increasingly implicated in progressive neuron damage in several neurodegenerative diseases (Block et al. 2007). Current theory proposes that unchecked M1 activation in microglia is also coupled with a concurrent impaired M2 response to create an imbalance in activation, a process termed “M1 polarization”. At present, this M1/M2 balance in microglia is poorly understood. Furthermore, how microglia acquire this pathologic M1 polarization, how to identify the deleterious phenotype, and mechanistic targets that provide options to intervene remain unclear. Previous reports point to a key role for ROS in how microglia become deleterious (Qin et al. 2004), but the underlying redox signaling mechanisms reprograming microglia are unknown. Here, we begin to address these issues and demonstrate that: NF-κB p50 is a key redox-signaling switch regulating M1/M2 balance in microglia; the NF-κB p50 radical is a marker of loss of NF-κB p50 function and chronic ROS-driven microglial pathology; this mechanism regulates CNS-specific vulnerability to chronic neuroinflammation; NF-κB p50 may be a key mechanism through which radicals regulate the chronic TNFα response in the brain.
As the first identified redox sensitive transcription factor (Schreck et al. 1991; Staal et al. 1990), we first sought to determine how ROS impacted NF-κB p50 in microglia. The current study demonstrates for the first time that the NF-κB p50 radical is formed in response to both ROS (H2O2 Figure 1c; peroxynitrite, Figure S4b) and a robust pro-inflammatory stimulus (LPS & neuron injury factors, Figure 1d). Additionally, we show that microglial NF-κB p50 is highly sensitive to redox fluctuations in the cell, whereby oxidation decreases NF-κB p50 DNA binding (Figure 1f) and reduction increases NF-κB p50 DNA binding (Figure S5a). Data also indicate that H2O2 generation with G/GO impairs the interactions of nuclear NF-κB p50 with other proteins (Figure 1e), supporting that microglial ROS results in a loss of NF-κB p50 function. Further, data also demonstrate that H2O2 generation with G/GO during the late stages of a microglial pro-inflammatory response translates into augmentation of M1 activation in microglia, which is seen as an elevated TNFα response (Figure 1g & h). Together, these data indicate that microglial ROS results in formation of the NF-κB p50 radical, loss of NF-κB p50 function (DNA & protein binding interactions), and augmentation of the pro-inflammatory response.
Despite being one of the most widely studied pro-inflammatory transcription factors, NF-κB regulation of the pro-inflammatory response is complex (Oeckinghaus et al. 2011), findings are conflicting, and the mechanisms are poorly understood in microglia, particularly with regard to dysregulated, chronic inflammation that is inherent to neurodegenerative disease (Rolova et al. 2014). To help explain how loss of NF-κB p50 function impacts microglial activation, we examined the kinetic response of NF-κB p50/p65 DNA binding to an M1 trigger, LPS. Our findings point to a fundamental separation of NF-κB p50 and NF-κB p65 activity in microglial M1 activation, where the DNA binding patterns over time are unique for NF-κB p50 and NF-κB p65 (Figure 2a), suggesting they are performing different functions in M1 activation.
Given the established roles of NF-κB p50 in both initiating and resolving the pro-inflammatory response (Baer et al. 1998; Bohuslav et al. 1998; Wessells et al. 2004), it was initially unclear how the loss of NF-κB p50 function, through ROS (Figure 1), the CNS disease process (Saldana et al. 2007), or genetic manipulation (Figs. 2–7), would impact microglial activation. However, consistent with reports in mouse AD models (Rolova et al. 2014), our data indicate that a loss of NF-κB p50 function in the midbrain/substantia nigra culminates in a general pattern of amplification in the later stages of the pro-inflammatory response for some pro-inflammatory factors, both in the CNS and in microglia (Figs. 2–7), emphasizing that the NF-κB p50/p65 heterodimer is sufficient, but not necessary, for the initiation of the microglial pro-inflammatory response. Notably, not all M1 and M2 factors were affected similarly by loss of NF-κB p50 function in this study, which is consistent with the fact that there are known differences in transcriptional/signaling regulation of these diverse factors (Zhou et al. 2014).
A key unresolved issue revolves around the instigating pro-inflammatory transcription factor in the absence of NF-κB p50. Interestingly, the NF-κB p65/p65 homodimer has been hypothesized as one possible alternate pro-inflammatory transcription factor combination for initiating the pro-inflammatory response (Rajendrasozhan et al. 2010; Wessells et al. 2004). This is consistent with our findings that unlike NF-κB p50, peak NF-κB p65 DNA binding occurs early on, during the initiation of the LPS-induced M1 pro-inflammatory response, supporting that NF-κB p65 likely has a role in the M1 initiating process independent from NF-κB p50 in microglia (Figure 2a). However, the specific initiating transcription factor in the absence of NF-κB p50 in microglia remains unknown. Together, our data support that the most critical function of NF-κB p50 in the microglial pro-inflammatory response is its inhibitory role, where loss of NF-κB p50 function not only allows initiation of the M1 response, but ultimately augments and dysregulates the M1 response.
The current study emphasizes that the predominant effect of loss of NF-κB p50 function is a shift in the kinetic response of M1/M2 activation to favor a chronic TNFα (M1) response. Importantly, data consistently show that loss of NF-κB p50 upregulates TNFα, a key neurotoxic cytokine regulating microglia-mediated neurotoxicity (McCoy et al. 2006), across all experimental models (Figure 2b, 2c, 2e, 3a, 4a, 4b, 6a, and 7g). However, data also reveal that the effects of loss of NF-κB p50 function on the CNS response of other M1 markers can be inconsistent and dependent on cell type, the pro-inflammatory factor, and the time after stimulus that the response is measured. More specifically, this suggests that the assessment of the impact of NF-κB p50 on M1/M2 factors at any single time point may be confounded by model-specific timing of the kinetic response, which may explain the discrepancy reported here for some factors (IL-1β, Figure 2d, 3b, 4c, and 6b). In fact, the importance of NF-κB p50 as a modulator of M1 kinetics becomes increasingly evident at the later stages of the response to LPS. For example, data demonstrate that loss of NF-κB p50 function impaired the resolution phase of the pro-inflammatory response, where peak expression of key pro-inflammatory markers, including TNFα (Figure 2b,c) and iNOS (Figure 7c), shifted to later time points, further supporting that NF-κB p50 is a key for stabilizing the resolution stage of the M1/M2 balance.
In addition, data also support that the presence of M1 or M2 markers may reveal little about the microglial function when assessed without knowledge of the appropriate kinetic response. Given the importance of the synchronized timing of M1/M2 factors in normal microglial activation, the identification of the NF-κB p50 radical as an upstream molecular marker for ROS-induced disruption of M1/M2 homeostasis in microglia, either in activated cells in which the M1/M2 response has already been initiated (ex. LPS exposure, Figure 1d) or in primed cells prior to M1/M2 initiation (ex. H2O2 exposure, Figure 1c), will allow a dysregulated microglial phenotype to be identified independently of model-specific variations in the M1/M2 kinetic response.
Excessive and chronic microglial activation is hypothesized to underlie progressive neuron damage in diverse neurodegenerative diseases, where ROS have been implicated as key for this deleterious microglial phenotype (Block et al. 2007). The present work demonstrates that loss of NF-κB p50 function, due to ROS (Figure 1) or genetic manipulation (Figure 7), favors chronic microglia-mediated inflammation. More specifically, data suggest that loss of NF-κB p50 function impairs the microglial transition from an M1 pro-inflammatory response to an M2 alternative/wound healing response. For example, in normal, healthy microglial activation, NO production is downregulated as microglia transition from an M1 to an M2 response through an increase in Arg-1 (M2 marker) expression with concomitant decrease in iNOS expression (M1 resolution). However in the absence of NF-κB p50, we observed the opposite phenomenon, where iNOS expression failed to resolve and Arg-1 failed to be upregulated, promoting the potential for chronic NO dysregulation. Considering the sensitivity of NF-κB p50 to oxidation and the established role of iNOS in deleterious microglial activation (Brown 2010), unchecked NO synthesis and iNOS expression may also serve as a feed forward mechanism further driving pathology in microglia and the brain. Moreover, data indicate that microglia become unresponsive to M2 polarizing triggers such as IL-4 (Figure 7f) in the absence of NF-κB p50. Ultimately, the culmination of this disrupted M1/M2 balance in microglia due to loss of NF-κB p50 is a chronic pro-inflammatory response in the brain, but only in TNFα production (Figure 7g). This is observed in LPS treated NF-κB p50−/− mice that continue to express TNFα at elevated levels in the midbrain at 1 week post-peripheral LPS administration, long after the peripheral inflammation has abated (Figure 7g). This CNS-specific and persistent elevation of TNFα is important, as TNFα is a critical neurotoxic cytokine in CNS disease, is strongly linked to microglia-mediated neurotoxicity in neurodegenerative disease (McCoy et al. 2006), and has a well characterized ability to cause neuronal toxicity through initiation of programmed cell death pathways (Hsu et al. 1995). Given previous reports of the importance of TNFα in chronic neuroinflammation (Qin et al. 2007) and the fact that NF-κB p50−/− cells respond similarly to both TNFα and LPS in vitro (Figures 2 and 3), these data suggest that the chronic TNFα response in the brain may be an integral component to the chronic CNS response in the NF-κB p50−/− mice.
While redox-signaling is a known regulator of inflammation in both the periphery and the brain, little is known about free radical driven mechanisms in this process. The administration of DMPO, a spin-trap and scavenger of primary and secondary radicals, attenuated resting TNFα levels in the brain in both NF-κB p50+/+ and NF-κB p50−/− mice, implicating radicals in the regulation of basal levels TNFα in the brain (Table S4). Data also suggest that the loss of NF-κB p50 function may augment ROS-mediated effects in the early response to LPS in brain and circulating TNFα (Figure 4d and 4e). Importantly, data point to NF-κB p50 as a critical redox signaling mechanism directing the sustained and chronic neuroinflammation process. While DMPO mildly attenuated LPS-induced chronic midbrain TNFα in NF-κB p50+/+ mice at 22 h, DMPO surprisingly amplified midbrain TNFα in the LPS-treated NF-κB p50−/− mice (Figure 7h). This suggests that during chronic neuroinflammation, DMPO in the absence of NF-κB p50 not only fails to ameliorate the chronic TNFα response as expected, but that the chronic response and redox signaling may be pathologically dysregulated, implicating NF-κB p50 as a key regulator in how free radicals may drive the chronic pro-inflammatory response in the brain.
Together, these findings implicate the NF-κB p50 radical in deleterious microglial activation. However, it is important to note that mechanistic inquiry into the causal role of the NF-κB p50 radical in neuropathology is technically limited because the radical is covalently modified during the identification process with DMPO, making functional analysis unlikely. As such, we are unable to directly demonstrate the NF-κB p50 radical species as a critical endpoint mechanism regulating microglial function and chronic neuroinflammation. In fact, the NF-κB p50 radical may be one of many possible ROS/radical driven NF-κB p50 intermediates involved in this mechanism. Rather, the data support that the NF-κB p50 radical may be a marker of ROS/free radical-driven pathology underlying CNS-specific and chronic neuroinflammation.
In summary, we demonstrate that NF-κB p50 is a key redox signaling mechanism driving M1 polarization in microglia, where this augmented M1 and impaired M2 response creates an imbalance favoring chronic production of TNFα in the brain. Mechanistically, we show that microglial ROS results in formation of the NF-κB p50 radical, which occurs concurrently with loss of NF-κB p50 function and enhanced late-stage M1 activation, indicating that microglial ROS regulate this NF-κB p50 control of the M1/M2 switch (Figure 8). iNOS dysregulation is revealed as another critical consequence of loss of NF-κB p50 function in a potential positive feedback mechanism augmenting redox signaling, which may also promote some loss of sensitivity to M2 signaling. These findings reveal essential mechanisms through which ROS/free radicals reprogram microglia to become a deleterious phenotype and may underlie both microglia priming (enhanced sensitivity to pro-inflammatory stimuli) and the progressive nature of microglia-mediated neuropathology/chronic activation in neurodegenerative diseases. Given that chronic neuroinflammation/microglial activation and microglial priming are implicated in both the early and active pathology in neurodegenerative diseases, these findings suggest that the oxidized post-translational modifications of NF-κB p50 may be a potential marker for the M1 polarized microglial phenotype and preclinical CNS disease, offering hope for defining, targeting, and ameliorating the deleterious microglial phenotype.
Figure 8. NF-κB p50 is a redox signaling switch for M1 polarization/dysregulated activation.

Microglia, the resident macrophages in the central nervous system (CNS), are mandatory for normal CNS physiology and health. These sentinels detect and respond to a diverse array of stimuli in the brain, including environmental toxins, bacterial toxins, cytokines, neuron damage, and disease proteins, where the activation state is traditionally defined on a spectrum of pro-inflammatory (M1) or alternative (M2) responses. M1 activation is characterized by the upregulation of pro-inflammatory mediators (ex. TNFα and iNOS) and in normal physiology is followed by the M2 response (ex. Arg-1 & IL-4) that is important for wound healing and M1 resolution. In the case of disease, a deleterious microglial phenotype can occur when the response is dysregulated, tipping the balance to a chronically activated and polarized M1 phenotype. M1 polarization is defined by an enhanced pro-inflammatory response, impaired pro-inflammatory resolution, and a deficit in the alternative response (M2 response). Here, we demonstrate that ROS (i.e. H2O2) disrupt this microglial activation balance by perturbing the kinetics of the M1/M2 shift, favoring chronic M1 polarization through the loss of NF-κB p50 function, a process characterized by the presence of the NF-κB p50 radical (NF-κB p50•−). Further, we demonstrate that: this loss of NF-κB p50 function results in an enhanced and chronic neuroinflammation that persists long after the initial peripheral instigating immune signal has abated. These findings support that NF-κB p50 may be critical for how radicals regulate chronic TNFα production in the brain, and that there is a CNS-specific vulnerability to chronic inflammation through this mechanism.
Supplementary Material
Main Points.
A free radical intermediate of NF-κB p50 was discovered in microglia in response to ROS priming and M1 triggers of activation.
Microglial ROS impair both NF-κB p50 protein and DNA binding in microglia, where the NF-κB p50 radical formation is associated with loss of function.
Loss of NF-κB p50 function impairs microglial M1/M2 balance.
Loss of NF-κB p50 function causes a chronic, CNS-specific pro-inflammatory response to peripheral LPS administration.
NF-κB p50 is implicated as a key mechanism through which free radicals regulate chronic TNFα production in the brain.
Acknowledgments
This research was supported by the National Institute of Environmental Health Sciences/the National Institute of Health [Grant number 1R01ES016951]. Microscopy and stereology was performed at the VCU Department of Anatomy and Neurobiology Microscopy Facility, which is supported with funding from NIH-NINDS Center core grant (5P30NS047463-02). We thank Scott Henderson, PhD for his stereology expertise and technical assistance with this study. The authors thank Thurn Sams, Maria Bright, and Bryan Rohr for their assistance with maintenance and breeding of timed pregnant animals.
ABBREVIATIONS
- DMPO
5,5-Dimethyl-1-Pyrroline-N-Oxide
- CNS
central nervous system
- ROS
reactive oxygen species
- TNFα
tumor necrosis factor alpha
- iNOS
inducible nitric oxide synthase
- COX2
Cyclooxygenase-2
- IL-1β
Interleukin-one beta
- H2O2
hydrogen peroxide
- ONOO−
peroxinitrite
- Arg-1
arginase one
- YM1
chitinase-like 3 protein
- Fizz1
Resistin-like molecule alpha
- NOX2
NADPH Oxidase 2
- LPS
lipopolysaccharide
- SIN-1
3-morpholinosyndnomine
- G/GO
glucose/glucose oxidase
- RT-PCR
real time – polymerase chain reaction
- PBS
phosphate buffered saline
- IL-4
Interleukin-four
Footnotes
The authors have no competing interests to declare.
References
- Aguzzi A, Barres BA, Bennett ML. Microglia: scapegoat, saboteur, or something else? Science. 2013;339:156–61. doi: 10.1126/science.1227901. [DOI] [PMC free article] [PubMed] [Google Scholar]
- Baer M, Dillner A, Schwartz RC, Sedon C, Nedospasov S, Johnson PF. Tumor necrosis factor alpha transcription in macrophages is attenuated by an autocrine factor that preferentially induces NF-kappaB p50. Mol Cell Biol. 1998;18:5678–89. doi: 10.1128/mcb.18.10.5678. [DOI] [PMC free article] [PubMed] [Google Scholar]
- Bal-Price A, Brown GC. Inflammatory neurodegeneration mediated by nitric oxide from activated glia-inhibiting neuronal respiration, causing glutamate release and excitotoxicity. J Neurosci. 2001;21:6480–91. doi: 10.1523/JNEUROSCI.21-17-06480.2001. [DOI] [PMC free article] [PubMed] [Google Scholar]
- Block ML, Wu X, Pei Z, Li G, Wang T, Qin L, Wilson B, Yang J, Hong JS, Veronesi B. Nanometer size diesel exhaust particles are selectively toxic to dopaminergic neurons: the role of microglia, phagocytosis, and NADPH oxidase. FASEB J. 2004;18:1618–20. doi: 10.1096/fj.04-1945fje. [DOI] [PubMed] [Google Scholar]
- Block ML, Zecca L, Hong JS. Microglia-mediated neurotoxicity: uncovering the molecular mechanisms. Nat Rev Neurosci. 2007;8:57–69. doi: 10.1038/nrn2038. [DOI] [PubMed] [Google Scholar]
- Boche D, Perry VH, Nicoll JA. Review: activation patterns of microglia and their identification in the human brain. Neuropathol Appl Neurobiol. 2013;39:3–18. doi: 10.1111/nan.12011. [DOI] [PubMed] [Google Scholar]
- Bohuslav J, Kravchenko VV, Parry GC, Erlich JH, Gerondakis S, Mackman N, Ulevitch RJ. Regulation of an essential innate immune response by the p50 subunit of NF-kappaB. J Clin Invest. 1998;102:1645–52. doi: 10.1172/JCI3877. [DOI] [PMC free article] [PubMed] [Google Scholar]
- Brown GC. Nitric oxide and neuronal death. Nitric Oxide. 2010;23:153–65. doi: 10.1016/j.niox.2010.06.001. [DOI] [PubMed] [Google Scholar]
- Brune B, Dehne N, Grossmann N, Jung M, Namgaladze D, Schmid T, von Knethen A, Weigert A. Redox Control of Inflammation in Macrophages. Antioxid Redox Signal. 2013 doi: 10.1089/ars.2012.4785. [DOI] [PMC free article] [PubMed] [Google Scholar]
- Cao S, Zhang X, Edwards JP, Mosser DM. NF-kappaB1 (p50) homodimers differentially regulate pro- and anti-inflammatory cytokines in macrophages. J Biol Chem. 2006;281:26041–50. doi: 10.1074/jbc.M602222200. [DOI] [PMC free article] [PubMed] [Google Scholar]
- Chatterjee S, Ehrenshaft M, Bhattacharjee S, Deterding LJ, Bonini MG, Corbett J, Kadiiska MB, Tomer KB, Mason RP. Immuno-spin trapping of a post-translational carboxypeptidase B1 radical formed by a dual role of xanthine oxidase and endothelial nitric oxide synthase in acute septic mice. Free Radic Biol Med. 2009;46:454–61. doi: 10.1016/j.freeradbiomed.2008.10.046. [DOI] [PMC free article] [PubMed] [Google Scholar]
- Cheret C, Gervais A, Lelli A, Colin C, Amar L, Ravassard P, Mallet J, Cumano A, Krause KH, Mallat M. Neurotoxic activation of microglia is promoted by a nox1-dependent NADPH oxidase. J Neurosci. 2008;28:12039–51. doi: 10.1523/JNEUROSCI.3568-08.2008. [DOI] [PMC free article] [PubMed] [Google Scholar]
- Chhor V, Le Charpentier T, Lebon S, Ore MV, Celador IL, Josserand J, Degos V, Jacotot E, Hagberg H, Savman K, et al. Characterization of phenotype markers and neuronotoxic potential of polarised primary microglia in vitro. Brain Behav Immun. 2013 doi: 10.1016/j.bbi.2013.02.005. [DOI] [PMC free article] [PubMed] [Google Scholar]
- Choi SH, Aid S, Kim HW, Jackson SH, Bosetti F. Inhibition of NADPH oxidase promotes alternative and anti-inflammatory microglial activation during neuroinflammation. J Neurochem. 2012;120:292–301. doi: 10.1111/j.1471-4159.2011.07572.x. [DOI] [PMC free article] [PubMed] [Google Scholar]
- Clement HW, Vazquez JF, Sommer O, Heiser P, Morawietz H, Hopt U, Schulz E, von Dobschutz E. Lipopolysaccharide-induced radical formation in the striatum is abolished in Nox2 gp91phox-deficient mice. J Neural Transm. 2010;117:13–22. doi: 10.1007/s00702-009-0327-5. [DOI] [PubMed] [Google Scholar]
- Durafourt BA, Moore CS, Zammit DA, Johnson TA, Zaguia F, Guiot MC, Bar-Or A, Antel JP. Comparison of polarization properties of human adult microglia and blood-derived macrophages. Glia. 2012;60:717–27. doi: 10.1002/glia.22298. [DOI] [PubMed] [Google Scholar]
- Gao HM, Hong JS, Zhang W, Liu B. Synergistic dopaminergic neurotoxicity of the pesticide rotenone and inflammogen lipopolysaccharide: relevance to the etiology of Parkinson’s disease. J Neurosci. 2003;23:1228–36. doi: 10.1523/JNEUROSCI.23-04-01228.2003. [DOI] [PMC free article] [PubMed] [Google Scholar]
- Harms AS, Tansey MG. Isolation of murine postnatal brain microglia for phenotypic characterization using magnetic cell separation technology. Methods Mol Biol. 2013;1041:33–9. doi: 10.1007/978-1-62703-520-0_5. [DOI] [PMC free article] [PubMed] [Google Scholar]
- Harry GJ. Microglia during development and aging. Pharmacol Ther. 2013 doi: 10.1016/j.pharmthera.2013.04.013. [DOI] [PMC free article] [PubMed] [Google Scholar]
- Hsu H, Xiong J, Goeddel DV. The TNF receptor 1-associated protein TRADD signals cell death and NF-kappa B activation. Cell. 1995;81:495–504. doi: 10.1016/0092-8674(95)90070-5. [DOI] [PubMed] [Google Scholar]
- Hu X, Li P, Guo Y, Wang H, Leak RK, Chen S, Gao Y, Chen J. Microglia/macrophage polarization dynamics reveal novel mechanism of injury expansion after focal cerebral ischemia. Stroke. 2012;43:3063–70. doi: 10.1161/STROKEAHA.112.659656. [DOI] [PubMed] [Google Scholar]
- Hutson CB, Lazo CR, Mortazavi F, Giza CC, Hovda D, Chesselet MF. Traumatic brain injury in adult rats causes progressive nigrostriatal dopaminergic cell loss and enhanced vulnerability to the pesticide paraquat. J Neurotrauma. 2011;28:1783–801. doi: 10.1089/neu.2010.1723. [DOI] [PMC free article] [PubMed] [Google Scholar]
- Innamorato NG, Lastres-Becker I, Cuadrado A. Role of microglial redox balance in modulation of neuroinflammation. Curr Opin Neurol. 2009;22:308–14. doi: 10.1097/WCO.0b013e32832a3225. [DOI] [PubMed] [Google Scholar]
- Ishikawa H, Claudio E, Dambach D, Raventos-Suarez C, Ryan C, Bravo R. Chronic inflammation and susceptibility to bacterial infections in mice lacking the polypeptide (p)105 precursor (NF-kappaB1) but expressing p50. J Exp Med. 1998;187:985–96. doi: 10.1084/jem.187.7.985. [DOI] [PMC free article] [PubMed] [Google Scholar]
- Jang E, Lee S, Kim JH, Seo JW, Lee WH, Mori K, Nakao K, Suk K. Secreted protein lipocalin-2 promotes microglial M1 polarization. FASEB J. 2013;27:1176–90. doi: 10.1096/fj.12-222257. [DOI] [PubMed] [Google Scholar]
- Kabe Y, Ando K, Hirao S, Yoshida M, Handa H. Redox regulation of NF-kappaB activation: distinct redox regulation between the cytoplasm and the nucleus. Antioxid Redox Signal. 2005;7:395–403. doi: 10.1089/ars.2005.7.395. [DOI] [PubMed] [Google Scholar]
- Lee DC, Ruiz CR, Lebson L, Selenica ML, Rizer J, Hunt JB, Jr, Rojiani R, Reid P, Kammath S, Nash K, et al. Aging enhances classical activation but mitigates alternative activation in the central nervous system. Neurobiol Aging. 2013;34:1610–20. doi: 10.1016/j.neurobiolaging.2012.12.014. [DOI] [PMC free article] [PubMed] [Google Scholar]
- Levesque S, Taetzsch T, Lull ME, Kodavanti U, Stadler K, Wagner A, Johnson JA, Duke L, Kodavanti P, Surace MJ, et al. Diesel exhaust activates and primes microglia: air pollution, neuroinflammation, and regulation of dopaminergic neurotoxicity. Environ Health Perspect. 2011;119:1149–55. doi: 10.1289/ehp.1002986. [DOI] [PMC free article] [PubMed] [Google Scholar]
- Levesque S, Wilson B, Gregoria V, Thorpe LB, Dallas S, Polikov VS, Hong JS, Block ML. Reactive microgliosis: extracellular micro-calpain and microglia-mediated dopaminergic neurotoxicity. Brain. 2010;133:808–21. doi: 10.1093/brain/awp333. [DOI] [PMC free article] [PubMed] [Google Scholar]
- Liao B, Zhao W, Beers DR, Henkel JS, Appel SH. Transformation from a neuroprotective to a neurotoxic microglial phenotype in a mouse model of ALS. Exp Neurol. 2012;237:147–52. doi: 10.1016/j.expneurol.2012.06.011. [DOI] [PMC free article] [PubMed] [Google Scholar]
- Ling Z, Zhu Y, Tong C, Snyder JA, Lipton JW, Carvey PM. Progressive dopamine neuron loss following supra-nigral lipopolysaccharide (LPS) infusion into rats exposed to LPS prenatally. Exp Neurol. 2006;199:499–512. doi: 10.1016/j.expneurol.2006.01.010. [DOI] [PubMed] [Google Scholar]
- Mason RP. Using anti-5,5-dimethyl-1-pyrroline N-oxide (anti-DMPO) to detect protein radicals in time and space with immuno-spin trapping. Free Radic Biol Med. 2004;36:1214–23. doi: 10.1016/j.freeradbiomed.2004.02.077. [DOI] [PubMed] [Google Scholar]
- McCoy MK, Martinez TN, Ruhn KA, Szymkowski DE, Smith CG, Botterman BR, Tansey KE, Tansey MG. Blocking soluble tumor necrosis factor signaling with dominant-negative tumor necrosis factor inhibitor attenuates loss of dopaminergic neurons in models of Parkinson’s disease. J Neurosci. 2006;26:9365–75. doi: 10.1523/JNEUROSCI.1504-06.2006. [DOI] [PMC free article] [PubMed] [Google Scholar]
- McGeer PL, Itagaki S, Boyes BE, McGeer EG. Reactive microglia are positive for HLA-DR in the substantia nigra of Parkinson’s and Alzheimer’s disease brains. Neurology. 1988;38:1285–91. doi: 10.1212/wnl.38.8.1285. [DOI] [PubMed] [Google Scholar]
- Mills CD. M1 and M2 macrophages: oracles of health and disease. Crit Rev Immunol. 2012;32:463–88. doi: 10.1615/critrevimmunol.v32.i6.10. [DOI] [PubMed] [Google Scholar]
- Oeckinghaus A, Hayden MS, Ghosh S. Crosstalk in NF-kappaB signaling pathways. Nat Immunol. 2011;12:695–708. doi: 10.1038/ni.2065. [DOI] [PubMed] [Google Scholar]
- Pereira SG, Oakley F. Nuclear factor-kappaB1: regulation and function. Int J Biochem Cell Biol. 2008;40:1425–30. doi: 10.1016/j.biocel.2007.05.004. [DOI] [PubMed] [Google Scholar]
- Porta C, Rimoldi M, Raes G, Brys L, Ghezzi P, Di Liberto D, Dieli F, Ghisletti S, Natoli G, De Baetselier P, et al. Tolerance and M2 (alternative) macrophage polarization are related processes orchestrated by p50 nuclear factor kappaB. Proc Natl Acad Sci U S A. 2009;106:14978–83. doi: 10.1073/pnas.0809784106. [DOI] [PMC free article] [PubMed] [Google Scholar]
- Qin L, Liu Y, Hong JS, Crews FT. NADPH oxidase and aging drive microglial activation, oxidative stress, and dopaminergic neurodegeneration following systemic LPS administration. Glia. 2013;61:855–68. doi: 10.1002/glia.22479. [DOI] [PMC free article] [PubMed] [Google Scholar]
- Qin L, Liu Y, Wang T, Wei SJ, Block ML, Wilson B, Liu B, Hong JS. NADPH oxidase mediates lipopolysaccharide-induced neurotoxicity and proinflammatory gene expression in activated microglia. J Biol Chem. 2004;279:1415–21. doi: 10.1074/jbc.M307657200. [DOI] [PubMed] [Google Scholar]
- Qin L, Wu X, Block ML, Liu Y, Breese GR, Hong JS, Knapp DJ, Crews FT. Systemic LPS causes chronic neuroinflammation and progressive neurodegeneration. Glia. 2007;55:453–62. doi: 10.1002/glia.20467. [DOI] [PMC free article] [PubMed] [Google Scholar]
- Rajendrasozhan S, Chung S, Sundar IK, Yao H, Rahman I. Targeted disruption of NF-{kappa}B1 (p50) augments cigarette smoke-induced lung inflammation and emphysema in mice: a critical role of p50 in chromatin remodeling. Am J Physiol Lung Cell Mol Physiol. 2010;298:L197–209. doi: 10.1152/ajplung.00265.2009. [DOI] [PMC free article] [PubMed] [Google Scholar]
- Ramirez DC, Gomez-Mejiba SE, Mason RP. Immuno-spin trapping analyses of DNA radicals. Nat Protoc. 2007;2:512–22. doi: 10.1038/nprot.2007.5. [DOI] [PMC free article] [PubMed] [Google Scholar]
- Ramirez DC, Mason RP. Immuno-spin trapping: detection of protein-centered radicals. Curr Protoc Toxicol. 2005;Chapter 17(Unit 17):7. doi: 10.1002/0471140856.tx1707s24. [DOI] [PubMed] [Google Scholar]
- Rolova T, Puli L, Magga J, Dhungana H, Kanninen K, Wojciehowski S, Salminen A, Tanila H, Koistinaho J, Malm T. Complex regulation of acute and chronic neuroinflammatory responses in mouse models deficient for nuclear factor kappa B p50 subunit. Neurobiol Dis. 2014;64:16–29. doi: 10.1016/j.nbd.2013.12.003. [DOI] [PubMed] [Google Scholar]
- Saijo K, Winner B, Carson CT, Collier JG, Boyer L, Rosenfeld MG, Gage FH, Glass CK. A Nurr1/CoREST pathway in microglia and astrocytes protects dopaminergic neurons from inflammation-induced death. Cell. 2009;137:47–59. doi: 10.1016/j.cell.2009.01.038. [DOI] [PMC free article] [PubMed] [Google Scholar]
- Saldana M, Mullol J, Aguilar E, Bonastre M, Marin C. Nuclear factor kappa-B p50 and p65 subunits expression in dementia with Lewy bodies. Neuropathol Appl Neurobiol. 2007;33:308–16. doi: 10.1111/j.1365-2990.2007.00806.x. [DOI] [PubMed] [Google Scholar]
- Schilling T, Eder C. Amyloid-beta-induced reactive oxygen species production and priming are differentially regulated by ion channels in microglia. J Cell Physiol. 2011;226:3295–302. doi: 10.1002/jcp.22675. [DOI] [PubMed] [Google Scholar]
- Schreck R, Rieber P, Baeuerle PA. Reactive oxygen intermediates as apparently widely used messengers in the activation of the NF-kappa B transcription factor and HIV-1. EMBO J. 1991;10:2247–58. doi: 10.1002/j.1460-2075.1991.tb07761.x. [DOI] [PMC free article] [PubMed] [Google Scholar]
- Schwarz JM, Smith SH, Bilbo SD. FACS analysis of neuronal-glial interactions in the nucleus accumbens following morphine administration. Psychopharmacology (Berl) 2013;230:525–35. doi: 10.1007/s00213-013-3180-z. [DOI] [PMC free article] [PubMed] [Google Scholar]
- Sha WC, Liou HC, Tuomanen EI, Baltimore D. Targeted disruption of the p50 subunit of NF-kappa B leads to multifocal defects in immune responses. Cell. 1995;80:321–30. doi: 10.1016/0092-8674(95)90415-8. [DOI] [PubMed] [Google Scholar]
- Siraki AG, Bonini MG, Jiang J, Ehrenshaft M, Mason RP. Aminoglutethimide-induced protein free radical formation on myeloperoxidase: a potential mechanism of agranulocytosis. Chem Res Toxicol. 2007;20:1038–45. doi: 10.1021/tx6003562. [DOI] [PMC free article] [PubMed] [Google Scholar]
- Snapper CM, Zelazowski P, Rosas FR, Kehry MR, Tian M, Baltimore D, Sha WC. B cells from p50/NF-kappa B knockout mice have selective defects in proliferation, differentiation, germ-line CH transcription, and Ig class switching. J Immunol. 1996;156:183–91. [PubMed] [Google Scholar]
- Staal FJ, Roederer M, Herzenberg LA. Intracellular thiols regulate activation of nuclear factor kappa B and transcription of human immunodeficiency virus. Proc Natl Acad Sci U S A. 1990;87:9943–7. doi: 10.1073/pnas.87.24.9943. [DOI] [PMC free article] [PubMed] [Google Scholar]
- Tieu K, Ischiropoulos H, Przedborski S. Nitric oxide and reactive oxygen species in Parkinson’s disease. IUBMB Life. 2003;55:329–35. doi: 10.1080/1521654032000114320. [DOI] [PubMed] [Google Scholar]
- Wang S, Yan JY, Lo YK, Carvey PM, Ling Z. Dopaminergic and serotoninergic deficiencies in young adult rats prenatally exposed to the bacterial lipopolysaccharide. Brain Res. 2009;1265:196–204. doi: 10.1016/j.brainres.2009.02.022. [DOI] [PubMed] [Google Scholar]
- Wessells J, Baer M, Young HA, Claudio E, Brown K, Siebenlist U, Johnson PF. BCL-3 and NF-kappaB p50 attenuate lipopolysaccharide-induced inflammatory responses in macrophages. J Biol Chem. 2004;279:49995–50003. doi: 10.1074/jbc.M404246200. [DOI] [PubMed] [Google Scholar]
- Zhou D, Huang C, Lin Z, Zhan S, Kong L, Fang C, Li J. Macrophage polarization and function with emphasis on the evolving roles of coordinated regulation of cellular signaling pathways. Cell Signal. 2014;26:192–7. doi: 10.1016/j.cellsig.2013.11.004. [DOI] [PubMed] [Google Scholar]
- Zhou W, Hurlbert MS, Schaack J, Prasad KN, Freed CR. Overexpression of human alpha-synuclein causes dopamine neuron death in rat primary culture and immortalized mesencephalon-derived cells. Brain Res. 2000;866:33–43. doi: 10.1016/s0006-8993(00)02215-0. [DOI] [PubMed] [Google Scholar]
Associated Data
This section collects any data citations, data availability statements, or supplementary materials included in this article.