Abstract
The purpose of this study is to determine the behavioral and proteomic consequences of shock-induced stress in zebrafish (Danio rerio) as a vertebrate model. Here we describe the behavioral effects of exposure to predictable and unpredictable electric shock, together with quantitative tandem mass tag isobaric labeling workflow to detect altered protein candidates in response to shock exposure. Behavioral results demonstrate a hyperactivity response to electric shock and a suppression of activity to a stimulus predicting shock. On the basis of the quantitative changes in protein abundance following shock exposure, eight proteins were significantly up-regulated (HADHB, hspa8, hspa5, actb1, mych4, atp2a1, zgc:86709, and zgc:86725). These proteins contribute crucially in catalytic activities, stress response, cation transport, and motor activities. This behavioral proteomic driven study clearly showed that besides the rapid induction of heat shock proteins, other catalytic enzymes and cation transporters were rapidly elevated as a mechanism to counteract oxidative stress conditions resulting from elevated fear/anxiety levels.
Keywords: zebrafish, stress, quantitative proteomics, fear, behavior, conditioning, TMT, MudPIT
1. Introduction
Zebrafish have been a popular model organism in genetics and developmental research for decades and have more recently attracted the interest of scientists studying behavior as well.1 They present a number of advantages relative to rodent models, most notably their amenity to forward genetic screening and the relative simplicity of the system, which nonetheless shares good degree of homology with other vertebrates including humans.1 One emerging area of translational research for which zebrafish have been proposed as an excellent model is the study of stress. The zebrafish stress system appears to be quite comparable to the hypothalamic-pituitary-adrenal (HPA) axis in mammalian models, with homologies between corticotrophin-releasing factor (CRF), adrenocorticotropic hormone (ACTH), and cortisol function in zebrafish and in mammals.2 Researchers have used a wide variety of stimuli to induce stress in adult zebrafish, including restraint or confinement, social crowding and isolation, heat and cold stress, predator cue exposure, handling or netting, water or tank changes, and mild electric shock.2−5 Indices of stress have included cortisol and CRF measures,6,7 as well as behaviors such as diving, locomotor activity (including both hyperactivity and immobility), turn angle, shoal cohesion, and scototaxis.3,5
The majority of stress research with zebrafish has involved unpredictable stressors, administered either acutely in a single session or chronically over several days (chronic unpredictable stress: CUS). Results from studies by Ghisleni et al.6 and Champagne et al.3 indicate that acute restraint stress increases whole-body cortisol levels and behavioral measures of locomotor activity, without any changes in diving behavior. In contrast, Chakravarty et al.4 found that CUS led to an increased diving response and suppression of locomotor activity. Piato et al.5 also report increased diving and suppressed locomotion as a response to CUS as well as reduced shoal cohesion. It therefore appears that acute and CUS may induce quite different behavioral signatures, although they have not yet been compared directly.
While unpredictable stressors clearly induce a variety of behavioral and physiological effects in zebrafish, it is not yet known how predictable stress may differ from unpredictable stress. On one hand, it is possible that predictability attenuates stress, leading to reduced effects of treatment. On the other hand, it could be that stimuli predictive of stress become stressors themselves, leading to an exaggerated effect of treatment. Our goal with this experiment was to examine the behavioral and proteomic effects of predictable and unpredictable stress on adult zebrafish.
Fear conditioning, one of the most commonly used techniques for the study of learning in rodent models, is basically a predictable stress procedure. Standard fear conditioning is a classical conditioning procedure in which an initially neutral light or tone (CS) is paired with an electric shock (US). Although classical fear conditioning has not been widely used with adult zebrafish (but see refs (8−10)), electric shock appears to be an effective aversive stimulus for fish. In this study, the use of electric shock as a stressor was appealing for two primary reasons. First, the variety of stressors often used to induce chronic stress (such as crowding, heat, and predator exposure) is difficult to control temporally in relation to a predictive stimulus and almost by definition introduce a degree of unpredictability. Second, using a variety of stressors is likely to produce a range of proteomic effects due directly to stimulus exposure rather than stress per se. Although electric shock may also produce direct effects unrelated to the subsequent stress response, the use of a single highly controllable stressor minimizes this problem.
In the current experiment, zebrafish were exposed to 16 trials across 4 days of training. The behavior and proteome of an experimental group, which received a standard fear conditioning treatment in which a light predicted shock exposure, and an unpaired group, in which the light was not predictive of shock exposure, were compared with that of a control group receiving only light exposure. Following behavioral training, animals were sacrificed, and their whole proteomes were analyzed and compared across groups.
2. Materials and Methods
2.1. Subjects
Subjects were 28 adult wild-type zebrafish (50:50 male/female, age 6–9 months) purchased from a local aquarium supply store (Aquatic Warehouse, San Diego, CA). Subjects were housed in an Aquaneering table-top housing rack, with a recirculating filtration system using mechanical, biological, and chemical filtration. Prior to the experiment, all animals were housed together in a single 10 L tank; during the experiment, animals were separated into pairs in 1.8 L tanks within the same housing system. The temperature of the tanks was held at 26 °C, and the room was maintained on a 14:10 h light/dark cycle. Subjects were fed twice daily on a mixed diet of live brine shrimp (Artemia franciscana), freeze-dried brine shrimp (San Francisco Bay Brand, San Francisco, CA), and Tetra-Min (Tetra, Melle, Germany) flake food. The housing conditions and experimental protocols were approved by the University of San Diego Institutional Animal Care and Use Committee.
2.2. Behavioral Testing
2.2.1. Apparatus
The conditioning apparatus was a small rectangular tank made of opaque white acrylic (12 cm × 6 cm × 6 cm; length × width × depth), with a black cover opaque to visible light but transparent to infrared light. The tank was filled with water from the housing system to a depth of 4 cm. There was a bank of white LED lights along one of the shorter walls of the tank that served as a CS. Each of the two longer walls was lined with a grid of silver wire; the grid along one wall was grounded, and the other opposite grid was connected to a shock scrambler that administered a 7 V electric shock through the entire tank. The magnitude of electric shock was primarily selected based on pilot data, indicating this to be the lowest shock level that reliably produced a measurable behavioral response in the fish, which is consistent with other reports in the literature.11 The electric shock served as the US. An infrared video camera suspended ∼40 cm above the testing tanks was used in conjunction with a bank of infrared lights beneath the apparatus to monitor the location and activity of the fish. The video camera fed into a desktop computer using ViewPoint Videotrack v3.2 to control stimulus administration and to track the locomotor activity of the fish. An illustration of the conditioning apparatus appears in Figure 1.
Figure 1.
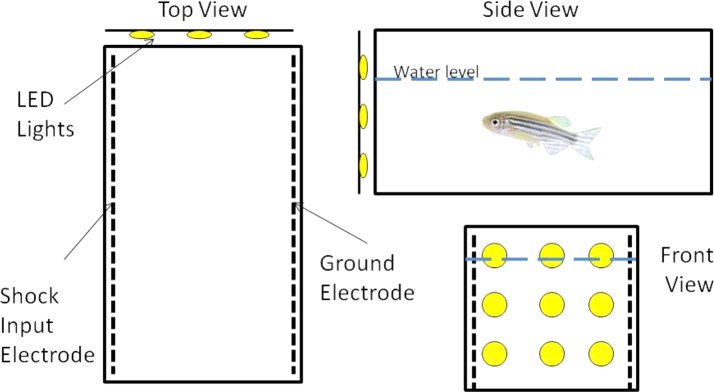
Experimental Apparatus. Circles represent the LED lights used as a conditioned stimulus, and the heavy dashed lines represent electrodes used to administer the unconditioned stimulus shock.
2.2.2. Procedure
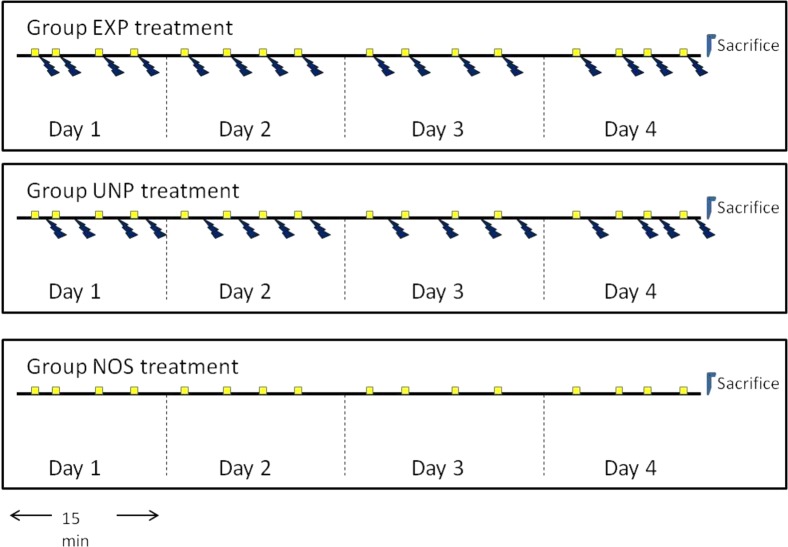
Animals were divided randomly into three groups of 8–10 subjects each: experimental (EXP), unpaired (UNP), and no shock control (NOS). Subjects in all groups were given 16 trials, distributed across 4 days with four trials each day (Figure 2). Intertrial intervals (ITIs) were variable with a mean of 180 s (±60 s). The CS was a 15 s white light, and the US was a 5 s shock train (1 shock/s). At the beginning of training, each subject was placed individually into the experimental tank and given 30 s to acclimate prior to the start of the session. Subjects in group EXP then received four trials per day in which the CS and US were paired; after a variable ITI, the CS light came on for 10 s, and the US was presented during the final 5 s of CS exposure, with light and shock train coterminating. Subjects in group UNP received four exposures per day to the 15 s CS and the 5 s US, but the two were not presented concurrently. The CS were presented according to the same schedule used in group EXP, with US occurring between 30 and 175 s (varying pseudorandomly) after the CS (and at least 30 s prior to the subsequent CS). Subjects in group NOS received four exposures per day to the 15 s CS but did not receive any US exposures. The CS group was presented according to the same schedule used in both EXP and UNP. Activity during the ITI, the CS, and the US, was monitored using video-tracking software. Following each training session, each animal was removed from the experimental tank and returned to its home tank. At the last session, four randomly selected animals from each group were anaesthetized in an ice bath and immediately decapitated within 10 min of completion of behavioral testing and processed for proteome samples immediately. A diagram of the experimental procedure is presented in Figure 2.
Figure 2.
Experimental Design. Overview of the experimental treatments for each group: experimental (EXP), unpaired (UNP), and no shock control (NOS). Subjects received paired light (conditioned stimuli; CS) and shock (unconditioned stimuli; US) for 4 days as previously described. (See Section 2.2.2.) Squares represent presentations of the CS light, and the bolt signifies the US shock.
2.3. Sample Preparation for Quantitative Proteomics
Zebrafish (4/group) were decapitated and rinsed with ice-cold PBS containing protease inhibitor cocktail tablet (Roche, Indianapolis, IN); then, the whole fish was placed in 3 mL of lysis buffer containing 8 M urea, 500 mM Tris (hydroxyethylamine), pH 8.5 and protease inhibitors cocktail (Roche, Indianapolis, IN). Precellys 24 tissue homogenizer (Bertin technologies) was for protein extraction by adding 2.8 ceramic beads (zirconium oxide) to tubes and homogenizing at 6000 rpm for 30 s at 4 °C under electrostatic condition,12 followed by BCA protein quantification13,14 (Sigma-Aldrich, St. Louis, MO).
2.3.1. Recovery of Short Peptides and Protein Pellets Digestion
Five hundred micrograms of protein extract from each animal were acetone-precipitated.15,16 The precipitated protein pellet was resuspended in 2%SDS and 0.1 M triethylammonium bicarbonate (TEAB) dissolution buffer, followed by reduction with 200 mM tris(2-carboxyethyl)phosphine (TCEP) and alkylation with 375 mM iodoacetamide. For endopeptidase digestion, modified trypsin (Promega, Madison, WI) was added at 50:1 (protein/protease mass ratio) along with 1 mM CaCl2 and incubated overnight in a thermoshaker at 600 rpm at 37 °C.17 To recover short peptides that did not undergo acetone precipitation, 1.3 mL of cold methanol and 15 μL of acetic acid were mixed with the supernatant and spun down briefly at 18 000g for 15 min. Delipidation was performed by adding 200 μL of ethyl acetate to the sample, followed by pellet drying and resuspending in 0.1 M TEAB.18
2.3.2. Tandem Mass Tag Isobaric Labeling
The tandem mass tag (TMT) labeling was performed according to the manufacturer’s instructions (Thermo Fisher Scientific, Rockford, IL) with some modifications.19 The TMT reagents (0.8 mg) were dissolved in 100 μL of anhydrous acetonitrile (ACN).17 For the triplex experiment, each of the labeling reaction mixtures contained 25 μL of the TMT reagent and 75 μL (50 μg) of the tryptic digest in TEAB buffer to ensure that the organic (ACN) content was between 25 and 30% (v/v) for the reagent’s stability. Aliquots of the tryptic digest were derivatized with triplex chemical labels 126.127, 128.134, and 130.141 Th (Thomson).17,20 After the labeling, reaction mixtures were incubated at room temperature for 1 h, and 15 μL of 5% hydroxylamine solution in water was added to quench the labeling reaction. Each TMT-modified digest from triplex was then combined into one sample and vacuum-dried. The lyophilized TMT-labeled peptides were reconstituted with 500 μL of buffer A (0.1% FA, 5% ACN in water) centrifuged at 14 000 rpm for 30 min to remove particulates prior to loading into the multidimensional protein identification technology (MudPIT) trapping column. Three MS runs comprising three technical replicates were performed by loading 150 μg of the TMT-modified digest into the MudPIT column.21,22
2.3.4. Multidimensional Protein Identification Technology (MudPIT) Analysis
Mass spectrometric (MS) analysis of TMT triplex samples was performed using MudPIT technology.21 Capillary columns were prepared in-house from particle slurries in methanol. An analytical RPLC column was generated by pulling a 100 μm ID/360 μm OD capillary (Polymicro Technologies, Phoenix, AZ) to 3 μm ID tip. The pulled column was packed with reverse-phase particles (Aqua C18, 3 μm diameter, 90 Å pores, Phenomenex, Torrance, CA) until it was 12 cm long. A MudPIT trapping column was prepared by creating a Kasil frit at one end of an undeactivated 250 μm ID/360 μm OD capillary (Agilent Technologies, Santa Clara, CA), which was then successively packed with 2.5 cm strong cation exchange particles (Partisphere SCX, 5 μm dia, 100 Å pores, Phenomenex) and 2.5 cm reverse-phase particles (Aqua C18, 5 μm dia., 90 Å pores, Phenomenex).23 The MudPIT trapping column was equilibrated using buffer A prior to sample loading. After sample loading and prior to MS analysis, the resin-bound peptides were desalted with 1 mL of buffer A by letting it flow through the biphasic trap column. MudPIT and analytical columns were assembled using a zero-dead volume union (Upchurch Scientific, Oak Harbor, WA).
2.3.5. Liquid Chromatography–Mass Spectrometry
LC–MS/MS analysis was performed on Q-Exactive (Thermo Scientific, San Jose, CA) interfaced at the front end with EASY-nLC II HPLC pump (Thermo Scientific) using an in-house built electrospray stage.17,24 Electrospray was performed directly from the analytical column by applying the ESI voltage at a tee (150 μm ID, Upchurch Scientific) directly downstream of a 1:1000 split flow used to reduce the flow rate to 250 nL/min through the columns. A fully automated 11-step MudPIT run was performed on the combined sample using a three mobile phase system consisting of buffer A (5% ACN; 0.1% formic acid (FA) (Sigma-Aldrich), buffer B (80% ACN, 0.1% FA), and buffer C (500 mM ammonium acetate, 5% ACN, 0.1% FA). The first step was 60 min, whereas subsequent steps were 135 min each. Each MudPIT run includes steps 0, 10, 20, 30, 40, 50, 60, 70, 80, 90, and 100% buffer C run for 4 min at the beginning of the gradient.20,25
As peptides were eluted from the microcapillary column, they were electrosprayed directly into a mass spectrometer with the application of a distal 2.4 kV spray voltage. Peptides were analyzed using a top-10 data-dependent acquisition method. For each cycle, survey full-scan MS spectra (m/z 400–1800) were acquired in the Orbitrap with a mass resolution of 30 000 at m/z 400 and an automatic gain control (AGC) target of 1 × 10⁶ ions with a maximal injection time of 250 ms. Each full scan was followed by the selection of the most intense ions, up to 10, for higher-energy collisional dissociation (HCD)–MS/MS analysis in the Orbitrap. From our experience, HCD fragmentation is optimum for quantifying labeled peptides based on their reporter ion intensity. In all cases, one microscan was recorded. MS/MS scans were acquired in the Orbitrap with a mass resolution of 17000. The selected peptide ions were dynamically excluded from further analysis for 120 s to allow for the selection of lower-abundance ions for subsequent fragmentation and detection using the setting for repeat count = 1, repeat duration = 30 ms, and exclusion list size = 500. Ions with unassigned or singly charge states were rejected. The minimum MS signal for triggering MS/MS was set to 5000, and an activation time of 0.1 ms was used. The m/z isolation width for MS/MS fragmentation was set to 2 Th. For MS/MS, precursor ions were activated using 45% normalized collision energy.
2.4. Data Analysis
Tandem mass spectra were extracted from raw files using RawExtract 1.9.920 and searched with the ProLuCID algorithm26 against Danio rerio UniProtKB/TrEMBL database with reversed sequences (56 285 entries). The search space included all fully and semitryptic peptide candidates (at least 6 amino acids). Carbamidomethylation of cysteine (+57.02146 amu) was considered as a static modification as well as N-terminal and lysine modification (+229.1629 amu) for triplex TMT labels analysis. The search parameter includes 10 ppm precursor mass tolerance, 0.6 Da peptide mass tolerance. Exported ProLuCID files were assembled and filtered using the DTASelect2.0,27 which combines XCorr and DeltaCN values using a quadratic discriminate function to compute a confidence score. The false discovery rate (FDR) was kept at 1% at the protein level. For quantitative analysis, Census28 was used to extract the relative intensities of reporter ions for each peptide from the identified tandem mass spectra for normalization.
2.5. Biostatistics
Statistical analysis for both behavioral and proteomic analysis werewas performed using repeated-measures analyses of variance (ANOVA) with Tukey’s post hoc test. P ≤ 0.05 was considered statistically significant. For each result, ProLuCID, XCorr, DeltaCN, and ZScore values were used to generate a Bayesian discriminator. Outlier points in the two distributions having a Mahalanobis distance greater than four were discarded. Peptide expression alteration (fold changes), log values, and confidence were calculated based on reporter ion peak intensities generated from the MS analysis after extracting confident protein spectra with P < 0.01. For TMT analysis, the relative quantification between experimental groups in the triplex experiment was derived from the average ratio of the designated reporter ion of one group over the reporter ion of the corresponding group.20 The statistical computing and graphics including dendrogram and cluster analysis were performed using R environment, Bioconductor, SPSS, and Graphpad Prism 5.
3. Results
3.1. Behavioral Changes Produced by Predictable and Unpredictable Shock
Four behavioral measures were obtained from the video-tracking data. The first was total distance traveled (centimeters) in each 5 s time interval. The second was the total distance traveled at high velocity (>4 cm/s) in each 5 s time interval. The third was the duration traveling at high velocity (seconds) in each 5 s time interval. The final measure was the duration spent immobile (seconds) in each 5 s time interval. Results were averaged across 5 s time intervals for analysis. These measures were taken during the presentation of the CS, during the ITI, and during the US.
3.1.1. Overall Activity
There were no significant changes across days in the total distance moved, but there was a significant difference between Groups (F(2, 25) = 50.72, p ≤ 0.001), with group EXP producing the highest total distance and group NOS producing the lowest. There was a significant reduction across days in high-velocity distance (F(3, 75) = 3.51, p ≤ 0.05), with no main effect of Group and no Group × Day interaction. There was also a significant effect of Day (F(3, 75) = 2.96, p ≤ 0.05) on duration traveling at high velocity, again with less high-velocity activity across days, and no effect of Group. There were no significant effects of Day or Group on duration immobile. These results indicate that there was, in general, a reduction in high-velocity activity across days for all groups, likely reflecting habituation to the experimental context.
3.1.2. Intertrial Interval
There were no significant effects of Group on any of the behavioral measures during the ITI. There was a significant main effect of Day on distance traveled at high velocity during the ITI: overall, there was more high-velocity activity in the first 2 days than in the second 2 (F(3, 75) = 2.96, p ≤ 0.05). However, none of the other behaviors varied by Day. There were no Day × Group interactions for any behavior, so the reduction of activity across days did not differ across groups. Therefore, there were no apparent differences between the three groups in baseline locomotor activity.
3.1.3. Shock (Unconditioned Response)
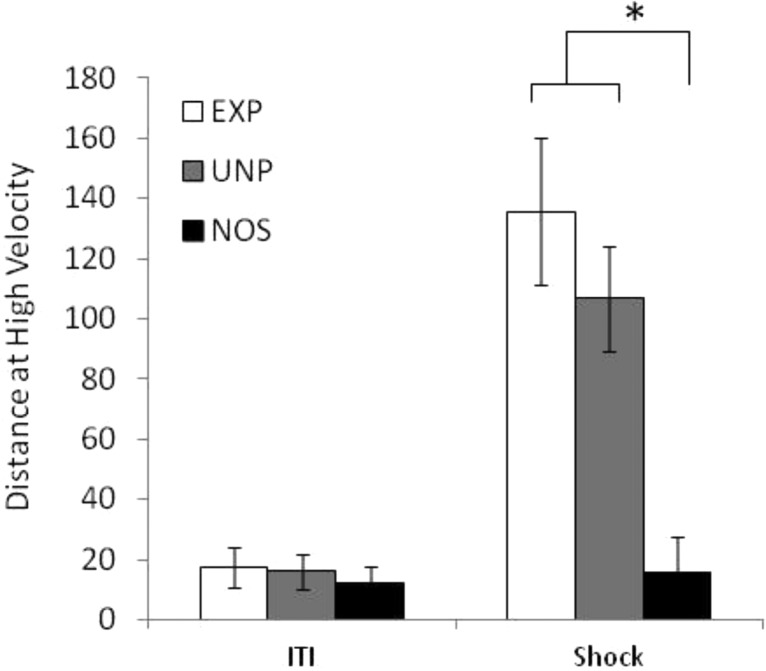
As expected, the two groups receiving a shock US (EXP and UNP) exhibited a pronounced unconditioned hyperactivity response during the presentation of the shock. There was a significant main effect of Group on the total distance moved (F(1, 25) = 24.41, p ≤ 0.001), on distance at high velocity (F(1, 25) = 14.38, p ≤ 0.001), on duration at high velocity (F(1, 25) = 25.98, p ≤ 0.001), and on duration immobile (F(1, 25) = 17.67, p ≤ 0.001). Both distance at high velocity and duration at high velocity also exhibited a main effect of Day (F(3, 75) = 3.06, p ≤ 0.05 and F(3, 75) = 4.077, p ≤ 0.01), with a reduction in high-velocity swimming across days, but there was no Day × Group interaction. Overall, these results indicate that the two shocked groups show more high-velocity swimming and less immobility than group NOS (Figure 3). They suggest the possibility of some long-term habituation to the shock across days, although evidence of this possibility is weakened by the lack of a significant Day × Group interaction.
Figure 3.
Behavioral response to shock (unconditioned response). Distance moved at high velocity on Day 1 of training. The three groups produced similarly low levels of high velocity swimming during the ITI, indicating that baseline locomotor activity was comparable across the three groups. The two groups receiving electrical shock (experimental, EXP, unpaired, UNP) produced a vigorous high-velocity swimming response when the shock was presented. Y scale represents distance moved in centimeters. Error bars represent standard error, and * represents significance at p ≤ 0.05 (n = 8–10 in each group).
3.1.4. Light (Conditioned Response)
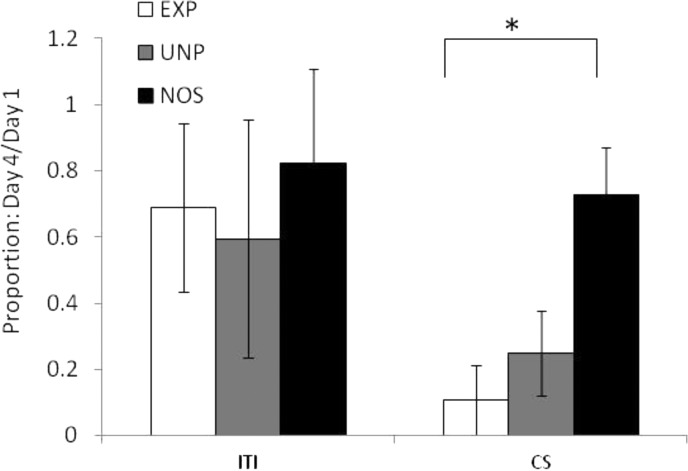
There were no significant differences in total distance moved during the light CS. There was no main effect of Group on high-velocity distance, but there was a significant effect of Day (F(3, 75) = 5.66, p ≤ 0.001), with an overall reduction of activity across days, and a significant Day × Group interaction (F(6, 75) = 2.56, p ≤ 0.05), with group EXP suppressing activity the most across days, moderate suppression by group UNP, and no suppression by group NOS. There was no main effect of Group on duration at high velocity, but there was a significant effect of Day (F(3, 75) = 6.17, p ≤ 0.001), again with less activity across days, and a significant Day × Group interaction (F(6, 75) 2.40, p ≤ 0.05). There were no significant effects of Day or Group on duration immobile during the CS. Posthoc analysis indicates that group EXP showed a significant reduction of high-velocity activity across days relative to group NOS, while group UNP did not differ significantly from either EXP or NOS. These results indicate that while absolute levels of activity during the CS did not differ between groups, group EXP exhibited significant suppression of activity across days relative to the control group. (See Figure 4.)
Figure 4.
Behavioral response to light (conditioned response). Conditioned response is presented in terms of the proportion of distance moved at high velocity on Day 4 relative to that on Day 1. A proportion of 1.0 represents no change in response to the conditioned stimuli (CS) across days of training. All three groups exhibited a similarly small reduction in activity during the intertrial intervals (ITI) across days. Group no shock control (NOS) showed a similar pattern of response to the CS, with relatively little change across days. Both groups unpaired (UNP) and NOS suppressed activity during the CS somewhat on Day 4 relative to Day 1, with the most suppression of activity by group experimental (EXP). Error bars represent standard error, and * represents significance at p ≤ 0.05 (n = 8–10 in each group).
3.2. Proteomic Changes Produced by Predictable and Unpredictable Shock
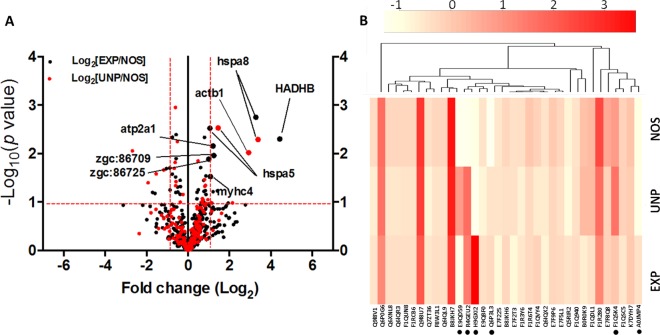
To investigate the consequences of the shock exposure on the proteome profiles of the experimental groups, we evaluated both protein and peptide identifications with 1% FDR. Global proteome screening identified an average of 295, 280, and 337 nonredundant protein candidates in EXP, UNP, and NOS groups, respectively (see Supplement 3 in the Supporting Information). As shown in Figure 5A, the normalized intensities of most proteins were closely similar between groups. However, 27 proteins were dysregulated (up- or down-regulated) in stressed groups (EXP and UNP) compared with the NOS control group (data not shown). On the peptide level, a modest increase (P < 0.05) in peptide frequencies was detected when EXP and UNP groups were compared with the control NOS group (Figure 5B).
Figure 5.
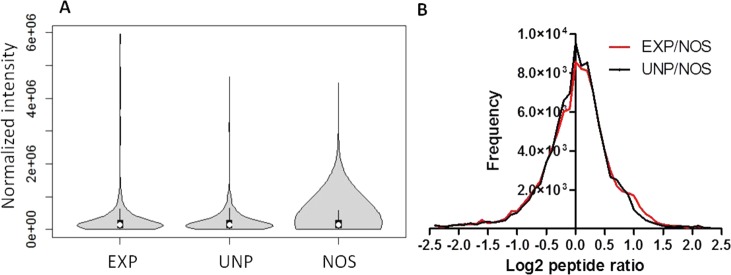
Quantitative proteome profiling of the experimental groups. (A) Violin plot of normalized protein abundance showing box plot overlaid with kernel density distribution. Dots represent mean, and lines within the box plot represent interquartile range. (B) Peptide ratio and frequency of matched peptides between EXP/NOS (black) and UNP/NOS (red). Experimental, EXP; unpaired, UNP; NOS, no shock control group.
3.2.1. Identification of Significantly Adaptive Proteins in Response to Shock
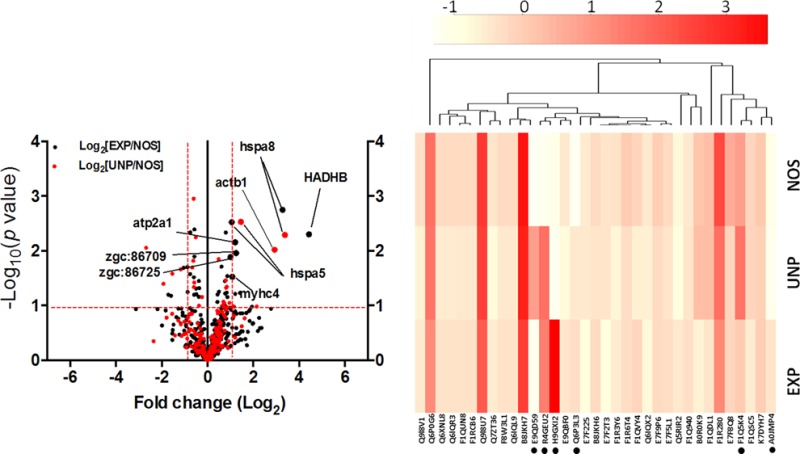
We further quantified the significant proteins between experimental groups based on the reporter ion intensity of the TMT-labeled tags. This precise method enables accurate protein quantification and overcome technical variability, such as LC retention, time draft, and nanospray instability. To properly view protein changes as a result of stress conditioning, we used Log-transformed data (based on reported ion intensity) to obtain a Guassian distribution of protein abundances and plotted against probability scores29 (Figure 6A). Among the identified candidate proteins, eight proteins passed the filtering process (at least one-fold difference and P < 0.05) and were believed to be up-regulated significantly in stressed groups compared with control NOS group. (See Table 1 and Supplement 4 in the Supporting Information.) These proteins are trifunctional enzyme subunit beta (HADHB), heat shock 70 kDa protein 8 (hspa8) and 5 (hspa5), actin beta 1 (actb1), myosin heavy chain 4 (myhc4), calcium-transporting ATPase (atp2a1), and two novel actin proteins [zgc:86709 and zgc:86725]. Additionally, heat map and hierarchical cluster analysis were used to identify proteins with certain patterns of changes under different stresses. The differentially regulated proteins were clustered according to similarities in change profiles across all conditions, as shown in Figure 6B.
Figure 6.
Stress-induced proteins in zebrafish. (A) Volcano plot showing significance and magnitude of fold change of the same protein hit between EXP and NOS (in black dots) and UNP and NOS (in red dots) based on quantitative reporter ion intensity of TMT labeled peptides. (B) Heat map and hierarchical display of top 30 differentially expressed proteins between experimental groups. Color scale represents intensity based on TMT experiment. Asterisks shown represent proteins passed filtering threshold (at least one-fold difference and P < 0.05) excluding the two novel proteins. The differentially regulated proteins were clustered according to similarities in change profiles across all conditions. Trifunctional enzyme subunit beta (HADHB), heat shock 70 kDa protein 8 (hspa8) and 5 (hspa5), actin beta 1 (actb1), myosin heavy chain 4 (myhc4), calcium-transporting ATPase (atp2a1), and two novel actin proteins [zgc:86709 and zgc:86725].
Table 1. List of the Eight Proteins Identified As Differentially Regulated between Experimental Groups of Zebrafish Proteome.
| accession | protein name | gene symbol | sequence length | theoretical pI/Mw | peptide number | EXP norm int m/z_126 | UNP norm int m/z_128 | NOS norm int m/z_130 | EXP/NOS | UNP/NOS |
|---|---|---|---|---|---|---|---|---|---|---|
| tr|H9GXI2 | trifunctional enzyme subunit β | HADHB | 471 | 9.62/50.2 | 14 | 737502 | 171601 | 165911 | 4.445 | 1.034 |
| tr|R4GEU2 | heat shock 70 kDa protein 8 | hspa8 | 161 | 9.58/18.2 | 2 | 81959 | 83382.5 | 24920 | 3.288 | 3.346 |
| tr|E9QD59 | actin β 1 | actb1 | 303 | 4.96/33.6 | 74 | 302396.2 | 720443.2 | 308296.0 | 0.980 | 2.336 |
| tr|Q6P3L3 | heat shock protein 5 | hspa5 | 650 | 5.04/71.9 | 3 | 281328.6 | 194499.3 | 190411 | 1.477 | 1.021 |
| tr|F1Q5K4 | myosin heavy chain 4 | myhc4 | 1937 | 5.54/222.3 | 512 | 472239.0 | 471003.3 | 426715.8 | 1.106 | 1.103 |
| tr|A0JMP4 | ATPase, Ca transporting fast twitch 1 | atp2a1 | 991 | 5.05/108.9 | 69 | 361075.9 | 292749.8 | 297892.3 | 1.212 | 0.982 |
| tr|Q6IQL9 | novel actin protein | zgc:86709 | 377 | 5.22/42.0 | 221 | 1221361.9 | 971884.1 | 1031675 | 1.183 | 0.942 |
| tr|A2BG19 | novel actin protein skeletal α-actin 1 | zgc:86725 | 378 | 5.18/42.0 | 222 | 1057235.2 | 967801.6 | 1027266 | 1.029 | 0.942 |
Proteins were TMT-labeled, quantified, and listed along with their accession numbers, gene symbol, sequence length, theoretical isoelectric point (pI), and molecular weight (Mw) in kilodaltons, peptide number, normalized intensity of corresponding reporter ions, fold changes of EXP and UNP in relation with NOS control. EXP, experimental; UNP, unpaired; NOS, no shock control group.
3.2.2. Biological Inferences of Altered Protein Expressions
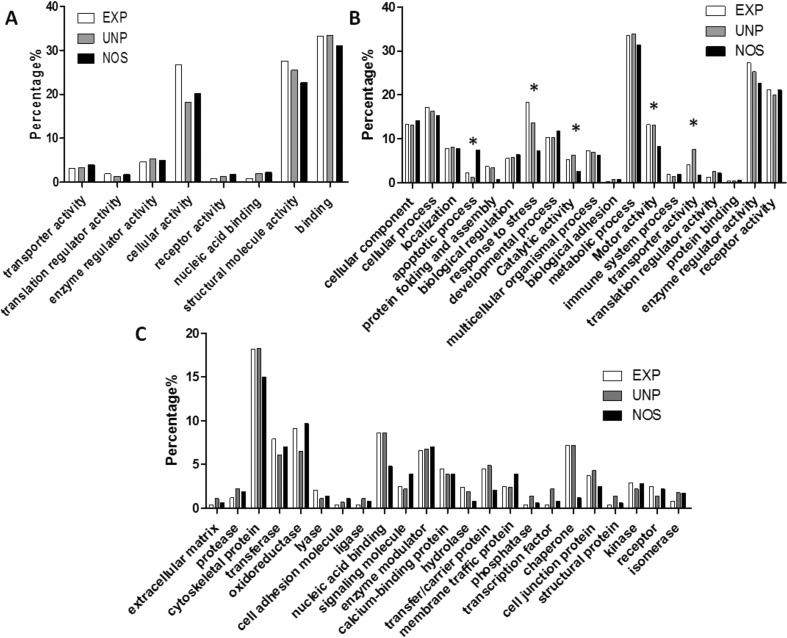
To access the major biological themes perturbed by stress in zebrafish, we performed a gene ontology (GO) analysis for the output proteome of the experimental groups.30−32 The GO annotation was extracted using Panther33 and searched against Danio rerio reference genome database (ZFIN).34 Illustration of protein molecular function, biological process, and protein classes are shown in Figure 7. Interestingly, compared with control NOS group, both EXP and UNP groups showed overrepresentation of proteins related to stress response (hspa8 and hspa5), catalytic activity (HADHB), cation transport (atp2a1), and motor activity (actb1 and myhc4). In addition, two novel actin proteins (zgc:86709, and zgc:86725) were significantly up-regulated and have ATPase-like activity.
Figure 7.
Gene ontology (GO) of experimental groups in TMT analysis. (A) Molecular function, (B) biological processes, and (C) protein classes.* p ≤ 0.05.
4. Discussion
The goal of this study was to investigate the behavioral and proteomic effects of predictable and unpredictable stress in zebrafish. Overall, our results indicate that exposure to electric shock produces a behavioral hyperactivity response and induces proteomic changes related to locomotor activity and oxidative stress in experimental groups relative to control. Additionally, although differences between the group EXP and UNP were minor, there were some indications that predictable shock produced a behavioral response to the predictive stimulus. However, this behavioral response was not reflected significantly on the proteome level, at least under the current experimental condition.
All three groups showed a reduction in high-velocity swimming across the 4 days of testing. (See Supplement 1 in the Supporting Information.) This suggests that either animals habituated to the experimental context across days and therefore exhibited less escape behavior or handling and transportation stress caused animals to sensitize to the experimental setting and suppress activity across days. Although further experimentation is needed to determine whether a reduction in locomotor activity indicates habituation of exploration, escape, or sensitization of anxiety to a novel context, because this effect was observed in all three groups, it is not central to our current question. This result is, however, consistent with observations by other researchers that chronic stress may produce a global suppression of locomotor activity.4,5
Our behavioral results showed a clear unconditioned response to shock in groups UNP and EXP, with animals exhibiting a roughly nine-fold increase in high-velocity swimming and doubling their total swim distance during the shock interval. This increase is apparent within subjects relative to activity during the ITI and also between-subjects relative to the no-shock comparison group (NOS); see Figure 3. Behaviorally, there were no differences in response to the shock between the two groups, indicating that the presence of a predictive cue (in group EXP) did not significantly affect response to the shock itself. (See Supplement 1 in the Supporting Information.)
It is likely that these behavioral effects are reflected on the proteome profile of EXP and UNP groups by the increase in motor (cytoskeletal) proteins such as actb1 and myhc4. Interestingly, these two proteins are homologous to mammalian fast skeletal muscle isoforms that are recruited for very short-duration high-intensity bursts of power and thought to be up-regulated to accommodate the required fast escaping behavior during shock intervals. Again, both proteins have ATPase-like activities that hydrolyze ATP for energy production. The increase in high velocity swimming was also correlated with elevation in the sarcoplasmic/endoplasmic reticulum calcium ATPase (atp2a1; 1.2 fold), which catalyzes the hydrolysis of ATP coupled to the translocation of calcium from the cytosol to the sarcoplasmic reticulum lumen to regulate muscular excitation and contraction.
As expected, we also reported a significant up-regulation of both heat shock proteins 8 and 5 (hspa8, hspa5) with ∼3.3 and ∼1.4 fold, respectively, in both EXP and UNP groups. (See Table 1 and Figure 6.) The up- regulation of heat shock proteins (HSPs) during cellular stress has been well-defined.35−39 These molecular chaperones were shown to function in different cellular processes such as protein folding, actin remodeling, reduction of oxidative stress,40 and their ability to help cells survive under stress conditions.39 Therefore, the release of HSP detected in this study is believed to protect the cells from damage caused by oxidative stress and acts as part of the cell’s internal repair mechanism to maintain homeostasis.
Although both groups receiving shock exhibited a comparable behavioral response to shock and similar proteomic profiles, group EXP did exhibit some effects not observed in group UNP. Behaviorally, the two groups differed in their conditioned response to the CS light. Group EXP exhibited significant suppression of activity during the CS across days of training (relative to NOS), suggesting a conditioned fear response analogous to that observed in rodents. (See Figure 4.) The unpaired control group (UNP) showed a moderate suppression of swimming during the CS light, likely due to cross-sensitization from the shock, but this suppression was not significant in comparison with group NOS, which exhibited no change in response to the light at all. Some unique effects of the predictable shock might also be apparent in the proteomic data. In a clear unambiguous fashion, we detected a significantly high level of trifunctional enzyme subunit beta (HADHB; 4.4 fold) in the EXP group. This enzyme catalyzes three out of the four steps in the mitochondrial beta-oxidation cycle for energy production. The cascade of mitochondrial fatty acid oxidation is believed to be a central energy generating process particularly during long fasting, infection, and stress.41 In addition, a positive relationship between beta-oxidation and stress tolerance has been recently defined. For instance, Drosophila melanogaster over-expressing fatty acid beta-oxidation component shows substantial resistance to oxidative stress. Taken all together, the prominent increase in HADHB quantified in the current study might be an attempt to overcome oxidative stress conditions resulting from elevated fear/anxiety levels during the CS light. This observation requires additional experimentation. We also observed the involvement of two up-regulated proteins in the EXP group: novel actin-like protein [zgc:86709] and a novel protein similar to alpha actin1 [zgc:86725]. On the basis of their sequence homology, these proteins might be implicated in ATP-binding activities.34 These two protein identifications should be viewed as putative until confirmed using alternative experimental techniques.
Although groups UNP and EXP differed somewhat, the clearest behavioral differences were between group NOS and the two groups receiving shock. Likewise, global GO screening of the experimental group proteomes did not reveal significant differences between EXP and UNP groups, suggesting undetectable/minimal effect of the predictive cue on the protein levels, at least under the current experimental condition. (See Figure 7.) In contrast, the significant alteration in the pattern of protein expression between both shocked groups versus group NOS receiving light only indicates the rapid induction of stress response proteins, catalytic enzymes, and locomotor proteins to counteract possible stress consequences. The sample size in this study was not large enough to establish meaningful correlations between individual subjects’ behavioral and proteomic outcomes (see Supplement 1 in the Supporting Information), but this would be an interesting question for future research. Finally, it is noteworthy to mention that we could not detect any significant neuropeptide regulation in this study probably due to their low abundance or analysis of the whole fish instead of brains only. Additional experiments targeting the zebrafish brain should be considered in the future to disclose neuropeptide changes that might exist.
5. Conclusions
To our knowledge, this is the first study to directly examine the effects of stress on both the behavior and the whole-body proteome of zebrafish. The overall pattern of results is consistent with elevated fear/stress levels in both groups EXP and UNP relative to group NOS, with some indication of additional effects based on shock predictability in group EXP.
Acknowledgments
We thank Daveyuanna Muhammad-Menzies, Michelle Crawford, and Carolina Bellizzi, University of San Diego for their assistance with data collection for this study.
Supporting Information Available
Supplement 1. Supplementary Figure 1: Locomotor activity across days. Supplementary Figure 2: Behavioral response to shock. Supplementary Figure 3: Number of identified proteins in each individual. Supplementary Figure 4. Protein coverage, protein spectral count, and emPAI identified in experimental groups. Supplementary Figure 5. Spareman’s correlation between total distances against protein spectral count and emPAI or between total distance traveled at high velocity against protein spectral count and emPAI. Supplement 2. Detailed locomotor activity measures across days and response to shock. Supplement 3. Protein list generated from experimental groups. Supplement 4: TMT quantification data. This material is available free of charge via the Internet at http://pubs.acs.org.
This work was supported by JSPS (Japan Society for Promotion of Science) Grant-in-Aid for JSPS fellow to S.M. (26.04 105) from Ministry of Education, Culture, Sports, Science and Technology of Japan and by the Center of Innovation Program from Japan Science and Technology Agency, JST to T.Y. Partial funding has been provided by National Institutes of Health grants P41 GM103533, R01 MH067880, UCLA/NHLBI Proteomics Centers (HHSN268201000035C), and V19 AI063603to J.R.Y. The funders had no role in study design, data collection and analysis, decision to publish, or preparation of the manuscript.
The authors declare no competing financial interest.
Funding Statement
National Institutes of Health, United States
Supplementary Material
References
- Gerlai R. Zebra fish: an uncharted behavior genetic model. Behav. Genet. 2003, 335461–468. [DOI] [PubMed] [Google Scholar]
- Steenbergen P. J.; Richardson M. K.; Champagne D. L. The use of the zebrafish model in stress research. Prog. Neuro-Psychopharmacol. Biol. Psychiatry 2011, 3561432–1451. [DOI] [PubMed] [Google Scholar]
- Champagne D. L.; Hoefnagels C.; de Kloet R. E.; Richardson M. K. Translating rodent behavioral repertoire to zebrafish (Danio rerio): Relevance for stress research. Behav. Brain Res. 2010, 2142332–342. [DOI] [PubMed] [Google Scholar]
- Chakravarty S.; Reddy B. R.; Sudhakar S. R.; Saxena S.; Das T.; Meghah V.; Swamy C. V. B.; Kumar A.; Idris M. M. Chronic unpredictable stress (CUS)-induced anxiety and related mood disorders in a zebrafish model: altered brain proteome profile implicates mitochondrial dysfunction. PLoS One 2013, 85e63302. [DOI] [PMC free article] [PubMed] [Google Scholar]
- Piato Â. L.; Capiotti K. M.; Tamborski A. R.; Oses J. P.; Barcellos L. J.; Bogo M. R.; Lara D. R.; Vianna M. R.; Bonan C. D. Unpredictable chronic stress model in zebrafish (Danio rerio): Behavioral and physiological responses. Prog. Neuro-Psychopharmacol. Biol. Psychiatry 2011, 352561–567. [DOI] [PubMed] [Google Scholar]
- Ghisleni G.; Capiotti K. M.; Da Silva R. S.; Oses J. P.; Piato Â. L.; Soares V.; Bogo M. R.; Bonan C. D. The role of CRH in behavioral responses to acute restraint stress in zebrafish. Prog. Neuro-Psychopharmacol. Biol. Psychiatry 2012, 361176–182. [DOI] [PubMed] [Google Scholar]
- Cachat J.; Stewart A.; Grossman L.; Gaikwad S.; Kadri F.; Chung K. M.; Wu N.; Wong K.; Roy S.; Suciu C. Measuring behavioral and endocrine responses to novelty stress in adult zebrafish. Nat. Protoc 2010, 5111786–1799. [DOI] [PubMed] [Google Scholar]
- Valente A.; Huang K.-H.; Portugues R.; Engert F. Ontogeny of classical and operant learning behaviors in zebrafish. Learn. Mem. 2012, 194170–177. [DOI] [PMC free article] [PubMed] [Google Scholar]
- Aizenberg M.; Schuman E. M. Cerebellar-Dependent Learning in Larval Zebrafish. J. Neurosci. 2011, 31248708–8712. [DOI] [PMC free article] [PubMed] [Google Scholar]
- Agetsuma M.; Aizawa H.; Aoki T.; Nakayama R.; Takahoko M.; Goto M.; Sassa T.; Amo R.; Shiraki T.; Kawakami K. The habenula is crucial for experience-dependent modification of fear responses in zebrafish. Nat. Neurosci. 2010, 13111354–1356. [DOI] [PubMed] [Google Scholar]
- Xu X.; Scott-Scheiern T.; Kempker L.; Simons K. Active avoidance conditioning in zebrafish (Danio rerio). Neurobiol. Learn. Mem. 2007, 87172–77. [DOI] [PubMed] [Google Scholar]
- Xu B.; Zhang Y.; Zhao Z.; Yoshida Y.; Magdeldin S.; Fujinaka H.; Ismail T. A.; Yaoita E.; Yamamoto T. Usage of electrostatic eliminator reduces human keratin contamination significantly in gel-based proteomics analysis. J. Proteomics 2011, 7471022–1029. [DOI] [PubMed] [Google Scholar]
- Enany S.; Yoshida Y.; Magdeldin S.; Zhang Y.; Bo X.; Yamamoto T. Extensive proteomic profiling of the secretome of European community acquired methicillin resistant Staphylococcus aureus clone. Peptides 2012, 371128–137. [DOI] [PubMed] [Google Scholar]
- Smith P. K.; Krohn R. I.; Hermanson G. T.; Mallia A. K.; Gartner F. H.; Provenzano M. D.; Fujimoto E. K.; Goeke N. M.; Olson B. J.; Klenk D. C. Measurement of protein using bicinchoninic acid. Anal. Biochem. 1985, 150176–85. [DOI] [PubMed] [Google Scholar]
- Magdeldin S.; Li H.; Yoshida Y.; Enany S.; Zhang Y.; Xu B.; Fujinaka H.; Yaoita E.; Yamamoto T. Comparison of two dimensional electrophoresis mouse colon proteomes before and after knocking out Aquaporin 8. J. Proteomics 2010, 73102031–2040. [DOI] [PubMed] [Google Scholar]
- Enany S.; Yoshida Y.; Magdeldin S.; Bo X.; Zhang Y.; Enany M.; Yamamoto T. Two dimensional electrophoresis of the exo-proteome produced from community acquired methicillin resistant Staphylococcus aureus belonging to clonal complex 80. Microbiol Res. 2013, 1688504–511. [DOI] [PubMed] [Google Scholar]
- Magdeldin S.; Yamamoto K.; Yoshida Y.; Xu B.; Zhang Y.; Fujinaka H.; Yaoita E.; Yates J. R. 3rd; Yamamoto T. Deep Proteome Mapping of Mouse Kidney Based on OFFGel Prefractionation Reveals Remarkable Protein Post- Translational Modifications. J. Proteome Res. 2014, 1331636–1646. [DOI] [PMC free article] [PubMed] [Google Scholar]
- Soloviev M.; Andrén P.; Shaw C.. Peptidomics: Methods and Applications; Wiley: Hoboken, NJ, 2007. [Google Scholar]
- Thompson A.; Schafer J.; Kuhn K.; Kienle S.; Schwarz J.; Schmidt G.; Neumann T.; Johnstone R.; Mohammed A. K.; Hamon C. Tandem mass tags: a novel quantification strategy for comparative analysis of complex protein mixtures by MS/MS. Anal. Chem. 2003, 7581895–1904. [DOI] [PubMed] [Google Scholar]
- Rauniyar N.; Gao B.; McClatchy D. B.; Yates J. R. 3rd. Comparison of protein expression ratios observed by sixplex and duplex TMT labeling method. J. Proteome Res. 2013, 1221031–1039. [DOI] [PMC free article] [PubMed] [Google Scholar]
- Delahunty C. M.; Yates J. R. 3rd. MudPIT: multidimensional protein identification technology. Biotechniques 2007, 435563–565567 passim. [PubMed] [Google Scholar]
- Kislinger T.; Gramolini A. O.; MacLennan D. H.; Emili A. Multidimensional protein identification technology (MudPIT): technical overview of a profiling method optimized for the comprehensive proteomic investigation of normal and diseased heart tissue. J. Am. Soc. Mass Spectrom. 2005, 1681207–1220. [DOI] [PubMed] [Google Scholar]
- Magdeldin S.; Moser A.. Affinity Chromatography: Principles and Applications; InTech: Rijeka, Croatia, 2012 [Google Scholar]
- Magdeldin S.; Moresco J. J.; Yamamoto T.; Yates J. R. Off-Line Multidimensional Liquid Chromatography and Auto Sampling Result in Sample Loss in LC/LC-MS/MS. J. Proteome Res. 2014, 1383826–3836. [DOI] [PMC free article] [PubMed] [Google Scholar]
- Magdeldin S.Gel Electrophoresis – Principles and Basics; InTech: Rijeka, Croatia, 2012; Vol. 1. [Google Scholar]
- Xu T.; Wong C. C.; Kashina A.; Yates J. R. 3rd. Identification of N-terminally arginylated proteins and peptides by mass spectrometry. Nat. Protoc. 2009, 43325–332. [DOI] [PMC free article] [PubMed] [Google Scholar]
- Tabb D. L.; McDonald W. H.; Yates J. R. 3rd. DTASelect and Contrast: tools for assembling and comparing protein identifications from shotgun proteomics. J. Proteome Res. 2002, 1121–26. [DOI] [PMC free article] [PubMed] [Google Scholar]
- Park S. K.; Venable J. D.; Xu T.; Yates J. R. 3rd. A quantitative analysis software tool for mass spectrometry-based proteomics. Nat. Methods 2008, 54319–322. [DOI] [PMC free article] [PubMed] [Google Scholar]
- Motorykin I.; Traber M. G.; Tanguay R. L.; Maier C. S. Proteome-Driven Elucidation of Adaptive Responses to Combined Vitamin E and C Deficiency in Zebrafish. J. Proteome Res. 2014, 1331647–1656. [DOI] [PMC free article] [PubMed] [Google Scholar]
- Ashburner M.; Ball C. A.; Blake J. A.; Botstein D.; Butler H.; Cherry J. M.; Davis A. P.; Dolinski K.; Dwight S. S.; Eppig J. T.; Harris M. A.; Hill D. P.; Issel-Tarver L.; Kasarskis A.; Lewis S.; Matese J. C.; Richardson J. E.; Ringwald M.; Rubin G. M.; Sherlock G. Gene ontology: tool for the unification of biology. The Gene Ontology Consortium. Nat. Genet. 2000, 25125–29. [DOI] [PMC free article] [PubMed] [Google Scholar]
- Zhang Y.; Yoshida Y.; Xu B.; Magdeldin S.; Fujinaka H.; Liu Z.; Miyamoto M.; Yaoita E.; Yamamoto T. Comparison of human glomerulus proteomic profiles obtained from low quantities of samples by different mass spectrometry with the comprehensive database. Proteome Sci. 2011, 9147. [DOI] [PMC free article] [PubMed] [Google Scholar]
- Magdeldin S.; Yoshida Y.; Li H.; Maeda Y.; Yokoyama M.; Enany S.; Zhang Y.; Xu B.; Fujinaka H.; Yaoita E.; Sasaki S.; Yamamoto T. Murine colon proteome and characterization of the protein pathways. BioData Min. 2012, 5111. [DOI] [PMC free article] [PubMed] [Google Scholar]
- Mi H.; Muruganujan A.; Thomas P. D. PANTHER in 2013: modeling the evolution of gene function, and other gene attributes, in the context of phylogenetic trees. Nucleic Acids Res. 2013, 41Database issueD377–D386. [DOI] [PMC free article] [PubMed] [Google Scholar]
- Bradford Y.; Conlin T.; Dunn N.; Fashena D.; Frazer K.; Howe D. G.; Knight J.; Mani P.; Martin R.; Moxon S. A.; Paddock H.; Pich C.; Ramachandran S.; Ruef B. J.; Ruzicka L.; Bauer Schaper H.; Schaper K.; Shao X.; Singer A.; Sprague J.; Sprunger B.; Van Slyke C.; Westerfield M. ZFIN: enhancements and updates to the Zebrafish Model Organism Database. Nucleic Acids Res. 2011, 39Database issueD822–D829. [DOI] [PMC free article] [PubMed] [Google Scholar]
- Rupik W.; Jasik K.; Bembenek J.; Widlak W. The expression patterns of heat shock genes and proteins and their role during vertebrate’s development. Comp. Biochem. Physiol., Part A: Mol. Integr. Physiol. 2011, 1594349–366. [DOI] [PubMed] [Google Scholar]
- Seit-Nebi A. S.; Datskevich P.; Gusev N. B. Commentary on paper: Small heat shock proteins and the cytoskeleton: an essential interplay for cell integrity? (Wettstein et al.). Int. J. Biochem. Cell Biol. 2013, 452344–346. [DOI] [PubMed] [Google Scholar]
- Shen M. C.; Ozacar A. T.; Osgood M.; Boeras C.; Pink J.; Thomas J.; Kohtz J. D.; Karlstrom R. Heat-shock-mediated conditional regulation of hedgehog/gli signaling in zebrafish. Dev. Dyn. 2013, 2425539–549. [DOI] [PubMed] [Google Scholar]
- Stricher F.; Macri C.; Ruff M.; Muller S. HSPA8/HSC70 chaperone protein: structure, function, and chemical targeting. Autophagy 2013, 9121937–1954. [DOI] [PubMed] [Google Scholar]
- Wettstein G.; Bellaye P. S.; Micheau O.; Bonniaud P. Small heat shock proteins and the cytoskeleton: an essential interplay for cell integrity?. Int. J. Biochem. Cell Biol. 2012, 44101680–1686. [DOI] [PubMed] [Google Scholar]
- Lam P. Y.; Harvie E. A.; Huttenlocher A. Heat shock modulates neutrophil motility in zebrafish. PLoS One 2013, 812e84436. [DOI] [PMC free article] [PubMed] [Google Scholar]
- Li H.; Fukuda S.; Hasegawa Y.; Kobayashi H.; Purevsuren J.; Mushimoto Y.; Yamaguchi S. Effect of heat stress and bezafibrate on mitochondrial beta-oxidation: comparison between cultured cells from normal and mitochondrial fatty acid oxidation disorder children using in vitro probe acylcarnitine profiling assay. Brain Dev. 2010, 325362–370. [DOI] [PubMed] [Google Scholar]
Associated Data
This section collects any data citations, data availability statements, or supplementary materials included in this article.


