

Abstract
Fluorescent proteins are powerful reporters in biology, but most require O2 for chromophore maturation, making them inherently difficult to use in anaerobic bacteria. Clostridium difficile, a strict anaerobe with a genomic GC content of only 29%, is the leading cause of hospital-acquired diarrhea in developed countries, and new methods for studying this pathogen are sorely needed. We recently demonstrated that a cyan fluorescent protein called CFPopt that has been codon optimized for production in low-GC bacteria can be used to study protein localization in C. difficile provided the cells are fixed prior to exposure to air. We describe here a codon-optimized variant of mCherry (mCherryOpt) that exhibits faster acquisition of fluorescence and a better signal-to-noise ratio than CFPopt. We utilized mCherryOpt to construct plasmids for studying protein localization (pRAN473) and gene expression (pDSW1728) in C. difficile. Plasmid pRAN473 is an mCherryOpt fusion vector with a tetracycline-inducible promoter. To document its biological utility, we demonstrated septal localization of two cell division proteins, MldA and ZapA. Plasmid pDSW1728 is designed for cloning a promoter of interest upstream of mCherryOpt. As proof of principle, we studied the expression of the pdaV operon, which is required for lysozyme resistance. In confirmation and extension of previous reports, we found that expression of the pdaV operon requires the alternative sigma factor σv and that induction by lysozyme is dose dependent and uniform across the population of lysozyme-treated cells.
INTRODUCTION
Clostridium difficile is a low-GC, spore-forming bacterium that is burdening the health care systems of developed countries (1–3). While genetic techniques to study C. difficile are becoming increasingly available, the repertoire of tools remains limited. This is due in part to the strictly anaerobic environment required to grow C. difficile.
Green fluorescent protein (GFP) can be produced in cells grown anaerobically, but it is unable to fluoresce because chromophore maturation requires O2 for dehydration reactions that introduce double bonds into amino acids (4). Nevertheless, GFP produced in an anaerobic environment can mature and fluoresce upon subsequent exposure to air (4, 5). We recently took advantage of this observation to show that GFP can be used to localize cell division proteins in anaerobically grown Escherichia coli (6). Similarly, we showed that a derivative of cyan fluorescent protein named CFPopt (because it has been codon optimized for low-GC bacteria) can be used to localize cell division proteins in anaerobically grown C. difficile (6). In both organisms, it was necessary to fix cells anaerobically to preserve their architecture and then expose them to air overnight to allow chromophore maturation, which required many hours. Fixation was necessary in the case of E. coli to ensure that the localization observed reflected anaerobic conditions rather than subsequent adaptation to air. In the case of C. difficile, fixation was necessary because cells lyse soon after transfer to air. Moreover, O2 poisons energy metabolism in C. difficile and the divisome disassembles quickly (<2 min) when cells become depleted of energy (7–9).
One limitation of GFP and CFP for work in C. difficile is that the organism has considerable intrinsic green and blue autofluorescence. In contrast, there is virtually no red autofluorescence. We characterize here a codon-optimized allele of the gene encoding red fluorescent protein mCherry that we call “mCherryOpt.” An alternative red fluorescent protein, tdTOMATO, has been used with limited success as a reporter in C. difficile; however, requirements for its use have not been extensively investigated (10). We focused our efforts on mCherry because it is half the size and folds much faster than tdTOMATO, although it is reported to be less bright (11). We show here that mCherryOpt produced in C. difficile is fully fluorescent within 2 h of exposure to air and that interference from intrinsic background fluorescence is negligible. We also describe plasmids that facilitate using mCherryOpt as a reporter of protein localization and gene expression in C. difficile. We hope that the availability of these plasmids and mCherryOpt will promote studies of the basic biology of C. difficile and other low-GC Gram-positive bacteria.
MATERIALS AND METHODS
Strains, media, and growth conditions.
Bacterial strains are listed in Table 1. All C. difficile strains are derived from the erythromycin-sensitive JIR8094 isolate, which is in turn derived from the 630 sequenced strain (12, 13). E. coli OmniMAX 2 T1R and XL1-Blue were used for cloning, and HB101/pRK24 was used for conjugations. Tryptone yeast extract (TY) medium consisted of 3% tryptone, 2% yeast extract, and 0.1% l-cysteine, plus 2% agar for plates. Luria-Bertani (LB) medium contained 10% tryptone, 5% yeast extract, and 1% NaCl, plus 1.5% agar for plates. C. difficile was grown in TY medium supplemented as needed with thiamphenicol (Thi) at 10 μg/ml, kanamycin at 50 μg/ml, or cefoxitin at 16 μg/ml. Genes under the control of the Ptet promoter were induced with anhydrotetracycline hydrochloride (aTet; Sigma, St. Louis, MO). C. difficile strains were maintained at 37°C in an anaerobic chamber (Coy Laboratory Products, Grass Lake, MI) in an atmosphere of 10% H2, 5% CO2, and 85% N2. E. coli strains were grown at 37°C in LB medium supplemented as needed with ampicillin at 200 μg/ml or chloramphenicol at 20 μg/ml.
TABLE 1.
Strains used in this study
| Strain | Genotype and/or descriptiona | Source or reference |
|---|---|---|
| E. coli | ||
| OmniMAX-2 T1R | F′ [proAB+ lacIq lacZΔM15 Tn10(Tetr) Δ(ccdAB)] mcrA Δ(mrr-hsdRMS-mcrBC) ϕ80lacZΔM15 Δ(lacZYA-argF)U169 endA1 recA1 supE44 thi-1 gyrA96 relA1 tonA panD | Invitrogen |
| XL1-Blue | endA1 gyrA96(Nalr) thi-1 recA1 relA1 lac glnV44 [F′ proAB+ lacIq Δ(lacZ)M15] hsdR17(rK− mK+) Tn10(Tetr)] | Agilent |
| HB101/pRK24 | F− mcrB mrr hsdS20(rB− mB−) recA13 leuB6 ara-14 proA2 lacY1 galK2 xyl-5 mtl-1 rpsL20 | 47 |
| EC3272 | XL1-Blue/pDSW1728 (Ptet::mCherryOpt cat) | This study |
| RAN473 | OmniMAX/pRAN473 (Ptet::mCherryOpt–MCS cat) | This study |
| C. difficile | ||
| JIR8094 | Spontaneous Ems derivative of strain 630 | 12 |
| TCD20 | csfV mutant | 35 |
| RAN346 | JIR8094/pRAN334 (Ptet::cfpopt cat) | 6 |
| RAN347 | JIR8094/pRAN332 (Ptet::gfpmut2 cat) | This study |
| RAN429 | JIR8094/pRAN416 (Ptet::mldA cat) | This study |
| RAN433 | JIR8094/pRPF185 (Ptet::gusA cat) | 6 |
| RAN445 | JIR8094/pDSW1728 (Ptet::mCherryOpt cat) | This study |
| RAN538 | JIR8094/pRAN534 (Ptet::mCherryOpt–zapACd cat) | This study |
| RAN539 | JIR8094/pRAN535 (Ptet::mCherryOpt–mldA cat) | This study |
| RAN829 | JIR8094/pRAN738 (PpdaV::mCherryOpt cat) | This study |
| RAN836 | TCD20/pRAN738 (PpdaV::mCherryOpt cat) | This study |
Nalr, nalidixic acid resistant; Tetr, tetracycline resistant; Ems, erythromycin sensitive.
Plasmid and strain construction.
The oligonucleotide primers used in the present study are listed in Table 2 and were synthesized by Integrated DNA Technologies (Coralville, IA). All plasmids are listed in Table 3. Newly constructed plasmids for the present study were derived from pRPF185, which has a tetracycline-inducible promoter upstream of the gusA gene (14). To replace gusA with gfpmut2, primers RP157 and RP158 were used to amplify gfpmut2 from pGFPmut2 (15) by PCR. The resulting PCR product was digested with SacI and BamHI and ligated into the same sites of pRPF185 to generate pRAN332. mCherryOpt was synthesized by GeneArt (Life Technologies, Grand Island, NY) and delivered in a high-copy-number plasmid named pMA-T-mCherryOpt. This plasmid was digested with SacI and BamHI, and the 735-bp fragment encoding mCherryOpt was ligated into SacI/BamHI-digested pRPF185 to generate pDSW1728. To create a derivative with an in-frame multiple-cloning site (MCS) suitable for making gene fusions, mCherryOpt was amplified by PCR with pDSW1728 as the template and primers RP204 and RP203, the latter of which encodes the MCS. The resulting PCR product was digested with SacI and BamHI and then ligated into the same sites of pRPF185 to create pRAN473. PCR was used to amplify a zapA homolog (cd0701) from the JIR8094 chromosome with primers RP176 and RP177. The resulting PCR fragment was digested with SphI and AscI and then ligated into pRAN357 (6) to create pRAN409 (Ptet::cfpopt-zapACd). Digestion of pRAN409 with SphI and AscI yielded a zapA restriction fragment that was ligated into SphI/AscI-digested pRAN473 to create pRAN534 (Ptet::mCherryOpt-zapACd). To create pRAN535 (Ptet::mCherryOpt-mldA), mldA was moved as a SphI/AscI restriction fragment from pRAN410 (Ptet::cfpopt-mldA) (6) into pRAN473. To construct pRAN738, the pdaV promoter was amplified from JIR8094 chromosomal DNA using the primers RP306 and RP307. The PCR product was digested with NheI and SacI and ligated into pRPF185 digested with the same enzymes. The resulting plasmid carries sequences extending from positions −320 to −29 with respect to the A of the ATG start codon of pdaV. All plasmids were introduced into C. difficile strains by conjugation from strain HB101/pRK24 and selecting for thiamphenicol resistance (16, 17).
TABLE 2.
Oligonucleotide primers used in this study
| Oligonucleotide | Purpose | Sequence (5′-3′)a |
|---|---|---|
| RP157 | Cloning gfpmut2 into pRPF185 | GGGGAGCTCCTGCAGTAAAGGAGAAAATTTTATGAGTAAAGGAGAAGAACTTTTCACTGG |
| RP158 | Cloning gfpmut2 into pRPF185 | CCCGGATCCTTATTTGTATAGTTCATCCATGCCATGTG |
| RP176 | Cloning zapA into pRAN357 | AAAGCATGCATGAACAAAGTAATGGTTAAAATCCATGG |
| RP177 | Cloning zapA into pRAN357 | TTTGGCGCGCCTTATTCCACATTTTTTGCATCATTATTTAACC |
| RP204 | Cloning mCherryOpt with MCS into pRPF185 | GGGGAGCTCCTGCAGTAAAGGAGAAAATTTTATGG |
| RP203 | Cloning mCherryOpt with MCS into pRPF185 | GGCGGATCCGGCGCGCCTCAGCTGTTTAATTAAGTCGACGCATGCGTTCATTTTATATAATTCATCCATACCTCC |
| RP206 | mCherryOpt sequencing primer | CAAATTCATGTCCATTAACAGATCCTTCC |
| RP207 | mCherryOpt sequencing primer | GCATATAATGTTAATATTAAATTAGATATAAC |
| RP306 | Cloning pdaV promoter in front of mCherryOpt | AAAAGCTAGCATGTGGCAAATAGTTGTTTTGCTATTTATTATTTG |
| RP307 | Cloning pdaV promoter in front of mCherryOpt | TTTGAGCTCTACATTTATATTTTTGTAGTATTTTATCCCAAAAATTTACAC |
| TEQ009 | qPCR primer for rpoB | AAGAGCTGGATTCGAAGTGCGTGA |
| TEQ010 | qPCR primer for rpoB | ACCGATATTTGGTCCCTCTGGAGT |
| RP314 | qPCR primer for catR | GAAGGTTGACCACGGTATCAT |
| RP315 | qPCR primer for catR | CGCAACGGTATGGAAACAATC |
| RP316 | qPCR primer for mldA | AGTGGTTATTGTTGGTGTAGGA |
| RP317 | qPCR primer for mldA | GCTTGTTGCTGAGTTGATGA |
| RP376 | qPCR primer for pdaV | TGTTCGCGTCAGCTCTTT |
| RP377 | qPCR primer for pdaV | ACTTGGCCCTTTACTAACTTCT |
| RP378 | qPCR primer for mCherryOpt | AGAAGGAGAAGGAGAAGGAAGA |
| RP379 | qPCR primer for mCherryOpt | AATGGTAATGGACCACCTTTAGT |
Restriction sites are underlined.
TABLE 3.
Plasmids used in this study
| Plasmid | Relevant features | Source or reference |
|---|---|---|
| pGFPmut2 | gfpmut2 | 15 |
| pMA-T-mCherryOpt | Synthesized mCherryOpt | This study |
| pRPF185 | E. coli-C. difficile shuttle vector with tetracycline-inducible promoter; Ptet::gusA cat CD6ori RP4oriT-traJ pMB1ori | 14 |
| pDSW1728 | Ptet::mCherryOpt cat | This study |
| pRAN332 | Ptet::gfpmut2 cat | This study |
| pRAN334 | Ptet::cfpopt cat | 6 |
| pRAN357 | Ptet::cfpopt–MCS cat | 6 |
| pRAN409 | Ptet::cfpopt-zapACd | This study |
| pRAN410 | Ptet::cfpopt-mldA | 6 |
| pRAN416 | Ptet::mldA | 6 |
| pRAN473 | Ptet::mCherryOpt–MCS cat | This study |
| pRAN534 | Ptet::mCherryOpt–zapACd cat | This study |
| pRAN535 | Ptet::mCherryOpt-mldA cat | This study |
| pRAN738 | PpdaV::mCherryOpt cat | This study |
Bioinformatics.
Codon usage was analyzed with the Codon Usage Database at http://www.kazusa.or.jp/codon/cgi-bin/showcodon.cgi?species=272563 (18). ZapA sequences were aligned using Clustal Omega (19).
Comparison of mCherryOpt, CFPopt, and GFPmut2.
To compare different fluorescent proteins, C. difficile JIR8094 containing various plasmids was grown overnight in TY with 10 μg of Thi/ml. The next morning, these cultures were diluted 1:100 into the same medium containing aTet at 400 ng/ml to induce expression of plasmid-borne genes. Cultures were grown to an optical density at 600 nm (OD600) of 0.6, and then cells from 500 μl of culture were fixed as described below, washed, suspended in 30 μl of phosphate-buffered saline (PBS), and processed for microscopy as described previously (6, 20). For convenience, fluorescence was typically allowed to develop during an overnight (∼16 h) exposure to air, although much shorter incubations are sufficient for mCherryOpt.
Kinetics of fluorescence acquisition.
To determine the rate of mCherryOpt maturation, cultures were grown and processed as described above except that, as a control, an aliquot of cells was processed without fixation. Fluorescence was monitored by microscopy or using an Infinite M200 Pro plate reader (Tecan, Research Triangle Park, NC). To monitor fluorescence in the plate reader, 20 μl of cells in PBS was added to 180 μl of PBS and transferred to the well of a flat-bottom 96-well microtiter plate (AS Plate-PS-96-F-C; AG Advangene, IL). Fluorescence was recorded at 15-min intervals (excitation, 554 nm; emission, 610 nm; gain setting, 100) with a 10-s shake and a 20-s pause immediately prior to each reading. The cell density (OD600) was recorded at the start and end of the experiment to correct for cell number but not more often in order to minimize the bleaching of mCherryOpt.
Protein localization.
For studies of protein localization, we recommend inducing at a variety of aTet concentrations for a variety of times because each fusion protein is unique. We observed convincing septal localization of mCherryOpt fusions to MldA and ZapA using the simple induction protocol described above wherein an overnight culture is diluted 1:100 into TY containing aTet and grown to mid-log phase before fixation. However, the micrographs shown in the present study were obtained by diluting overnight cultures 1:100 into TY containing a low level of aTet (20 ng/ml) and grown to an OD600 of 0.3. A higher concentration of aTet (80 to 160 ng/ml; it varied from day to day) was then added to boost the expression of plasmid-borne gene fusions. After 1 h, the cells were fixed and processed for microscopy as described below and elsewhere (6).
Quantifying expression of PpdaV::mCherryOpt.
To monitor the induction of PpdaV::mCherryOpt by lysozyme, overnight cultures grown in TY containing 10 μg of Thi/ml were diluted 1:100 into the same medium. To determine the effect of a 4-h induction, lysozyme (or water, as a control) was added when the OD600 reached 0.05, and incubation was continued for 4 h until the OD600 reached 0.8. To determine the effect of a 1-h induction, lysozyme (or water) was added at an OD600 of 0.4, and incubation was continued for 1 h until the OD600 reached 0.8. An aliquot of each culture was transferred to ethanol-acetone, and the mRNA levels were determined by quantitative reverse transcription-PCR (qRT-PCR) as described previously (6, 17) using Superscript III and Sybr green master mix (Life Technologies, Carlsbad, CA) with the following gene-specific primer pairs: rpoB, TEQ009 and TEQ010; pdaV, RP376 and RP377; and mCherryOpt, RP378 and RP379. A second aliquot of each culture was fixed with paraformaldehyde-glutaraldehyde, and mCherryOpt fluorescence was measured using a Tecan plate reader as described above.
Fixation protocol.
Cells were fixed for microscopy by adapting procedures developed for Bacillus subtilis (20). A 16% (wt/vol) paraformaldehyde aqueous solution (methanol-free; catalog no. AA433689M) was obtained from Alfa Aesar (Ward Hill, MA). A 25% glutaraldehyde aqueous solution (catalog no. 16220) was obtained from Electron Microscopy Services (Hatfield, PA). A 5× fixation cocktail was prepared fresh each day and consisted (per sample) of 20 μl of 1 M NaPO4 buffer (pH 7.4), 100 μl of 16% paraformaldehyde, and 4 μl of 25% glutaraldehyde. The cocktail was transferred into the anaerobic chamber immediately prior to use, and 120-μl aliquots were dispensed to 1.5-ml microcentrifuge tubes that had been in the chamber for at least 24 h. A 500-μl aliquot of cells (OD600 ∼ 0.6) in growth medium was added directly to a microcentrifuge tube containing 120 μl of the fixation cocktail, mixed by pipetting up and down three times, and then allowed to sit for 30 min, at which time the sample was removed from the chamber and incubated on ice for 60 min. Fixed cells were washed three times with PBS, resuspended in 30 μl of PBS, and left in the dark at room temperature to allow chromophore maturation. Because the fixation step was typically not completed until late in the afternoon, fluorescence microscopy was usually not performed until the next morning but, as shown below, exposure to air for 2 h appears to be sufficient for mCherryOpt to reach maximum fluorescence. Shorter fixation times (e.g., 15 min at room temperature plus 30 min on ice) and removal of the samples from the anaerobic chamber immediately after mixing with the fixation cocktail yielded similar results (not shown).
Microscopy.
For imaging, the cells were immobilized on thin agarose pads. Phase-contrast and fluorescence micrographs were recorded on an Olympus BX60 microscope equipped with a ×100 UPlanApo objective (numerical aperture, 1.35). Images were captured using a black-and-white Spot 2-cooled charge-coupled device camera (Diagnostic Instruments, Sterling Heights, MI) with a KAF1400E chip (class 2), a Uniblitz shutter, and a personal computer with Image-Pro software version 4.1 (Media Cybernetics, Silver Spring, MD). Filter sets for fluorescence imaging were from Chroma Technology Corp. (Brattleboro, VT). The GFP filter set (catalog no. 41017) comprised a 450- to 490-nm excitation filter, a 495-nm dichroic mirror (long pass), and a 500- to 550-nm emission filter. The CFPopt filter (catalog no. 31044v2) comprised a 426- to 446-nm excitation filter, a 455-nm dichroic mirror (long pass), and a 460- to 500-nm emission filter (band pass). For mCherryOpt the filter set (catalog no. 41004) comprised a 538- to 582-nm excitation filter, a 595-nm dichroic mirror (long pass), and a 582- to 682-nm emission filter.
Fluorescence micrographs were captured using 3-s exposure times and identical display range settings in all cases, so the images can be compared directly. Black level subtraction and chip defect correction were “on”; all other processing options were “off.” To ensure comparability of fluorescence images, the display range option was adjusted identically for all images. Micrographs were cropped, and figures were assembled in Adobe Illustrator (Adobe Systems, Inc., San Jose, CA).
Plasmid copy number.
Real-time qRT-PCR experiments were performed as previously described (17) using Sybr green master mix (Applied Biosystems) and the following gene-specific primer pairs: rpoB, TEQ009 and TEQ010; catR, RP314 and RP315; and mldA, RP316 and RP317. C. difficile chromosomal DNA was harvested from cells grown to mid-log phase. Cells were lysed as described previously (17), except that the lysozyme step was omitted. The DNA was extracted using a phenol-chloroform protocol (21).
Plasmid stability.
Plasmid maintenance was determined using a protocol similar to that described by Heap et al. (22). Briefly, JIR8094 containing various plasmids was grown overnight in TY medium with Thi at 10 μg/ml. Residual Thi was removed by pelleting cells from 1 ml of the culture and suspending the pellet in 1 ml of TY medium without antibiotic. Washed cells were diluted 1:100 into TY medium without antibiotic every 12 h for 3.5 days, for a total of seven passages, at which point dilutions of the cultures were plated on TY without antibiotic. At least 50 colonies were patched onto TY medium ± 10 μg Thi/ml to determine the fraction of cells that contained the plasmid. Strain JIR8094 (This) was patched as a negative control. Assuming cultures return to maximum cell density in 12 h, there are 6.64 doublings per 12-h growth period (i.e., 26.64 = 100), which corresponds to 46 generations after seven passages. Segregational stability per generation was calculated using R1/n, where n is the number of generations, and R is the fraction of Thir colonies.
Nucleotide sequence accession number.
The DNA sequence of codon-optimized mCherry (mCherryOpt) has been submitted to GenBank and is available under the accession number KM983420.
RESULTS
mCherryOpt is superior to CFP in C. difficile.
Many factors go into determining which fluorescent protein is “best” for any particular use (23). The monomeric red fluorescent protein mCherry has a generally favorable combination of brightness, photostability, and rapid maturation, but it has a relatively high GC content because it has been codon optimized for expression in mammalian cells (11, 23). The GC content of the C. difficile 630 chromosome is only 29% (13). Analysis of the DNA sequence of mCherry revealed that it is 62% GC and that >90% of the codons are not commonly used in endogenous C. difficile genes (see Table S1 in the supplemental material). Sastalla et al. showed that production of fluorescent proteins in low-GC Gram-positive bacteria is greatly improved by modifying the genes to make them more AT-rich (24). We therefore designed a synthetic mCherry gene that was codon optimized for expression in C. difficile (see Fig. S1 in the supplemental material). The modified gene, which we will refer to as mCherryOpt, is 30% GC, and only 1% of the codons are unfavorable for C. difficile (see Table S1 in the supplemental material).
We constructed pDSW1728 by cloning mCherryOpt into pRPF185 (14), an E. coli-C. difficile shuttle vector with a tetracycline-inducible promoter (Fig. 1). Exconjugants of C. difficile were bright red when grown in TY medium containing anhydrotetracycline (aTet) and visualized by fluorescence microscopy (Fig. 2). Half-maximal fluorescence intensity was obtained after ∼1 h of exposure to air and did not require fixation (Fig. 3). However, there was extensive lysis in the unfixed samples (data not shown), so fixation is necessary for studies that require preservation of cellular architecture. Importantly, control cells carrying the empty vector pRPF185 had essentially no detectable fluorescence in the red channel. (The bright spots visible in Fig. 2D come from debris and were useful for aligning the fluorescence and phase images.) Although C. difficile strains producing CFPopt or GFPmut2 were fluorescent in the blue and green channels, respectively, the corresponding pRPF185 controls had considerable background fluorescence, particularly in the green channel. Thus, at least in C. difficile, mCherryOpt has a significantly better signal-to-noise ratio than the other two fluorescent proteins.
FIG 1.
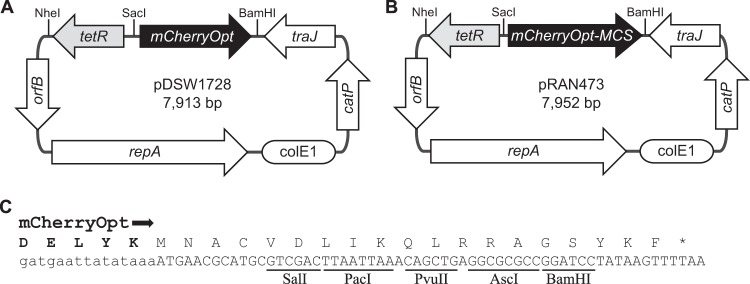
Genetic maps of C. difficile mCherryOpt plasmids. (A) pDSW1728, for studies of gene expression. Expression of mCherryOpt is under Ptet control, but the promoter-regulatory region can be replaced using the NheI and SacI restriction sites. (B) pRAN473, for studies of protein localization. (C) Multicloning site (MCS) in pRAN473. The last five amino acids derived from mCherryOpt are shown in boldface above the DNA sequence. Both plasmids are derivatives of pRPF185. Features depicted: mCherryOpt or mCherryOpt-MCS encodes mCherryOpt protein codon optimized for expression in low-GC bacteria; tetR encodes the Tet repressor from Tn10; orfB and repA, the replication region; ColE1 ori, replication region of the E. coli plasmid pBR322 modified for higher copy number; catP, the chloramphenicol acetyltransferase gene from Clostridium perfringens, conferring resistance to thiamphenicol in C. difficile or chloramphenicol in E. coli; traJ, encodes a conjugation transfer protein from plasmid RP4.
FIG 2.

Comparison of fluorescent proteins and autofluorescence. The top row of micrographs shows C. difficile exconjugants producing mCherryOpt from pDSW1728 (A), CFPopt from pRAN334 (B), or GFPmut2 from pRAN332 (C). Cells were photographed using filters appropriate for each protein as indicated above the images. The middle row shows C. difficile carrying pRPF185, which does not produce any fluorescent protein, photographed with the same filter sets (D, red; E, blue; F, green). The bottom row shows phase-contrast micrographs corresponding to images D to F.
FIG 3.
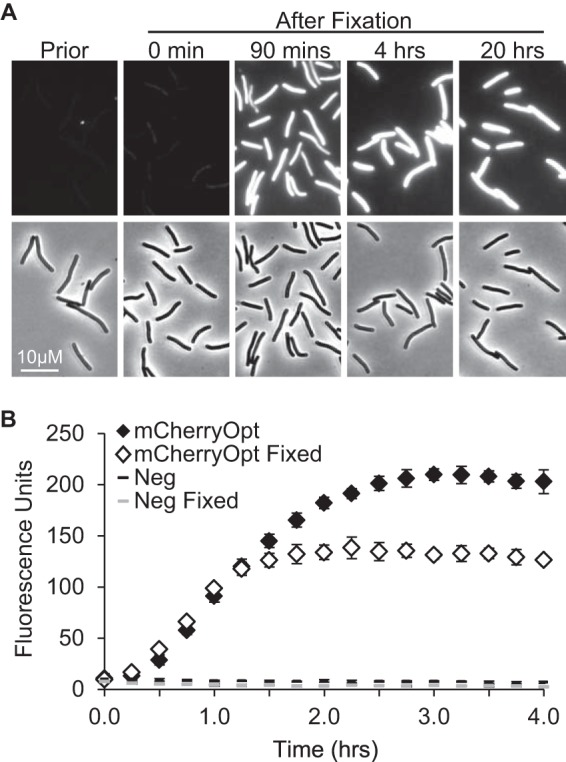
Time course of fluorescence development. (A) C. difficile exconjugants producing mCherryOpt from pDSW1728 were induced with 400 ng of aTet per ml, fixed, removed from the anaerobic chamber, and photographed at the times indicated. “Prior” refers to an unfixed sample photographed immediately after removal from the anaerobic chamber. (B) C. difficile/pDSW1728 (mCherryOpt) or C. difficile/pRPF185 (Neg) were grown and induced as described above. Cells were fixed or not as indicated, transferred to PBS, and removed from the anaerobic chamber. Fluorescence (red filter) was recorded using a plate reader at 15-min intervals and normalized to the OD600 at time zero. The data points represent the means and standard deviations of three independent cultures per group, all grown and processed on the same day. These results are representative of three experiments.
Application of mCherryOpt to protein localization.
We constructed pRAN473 by introducing an in-frame MCS at the 3′ end of mCherryOpt to facilitate fusing mCherryOpt to the N terminus of proteins of interest (Fig. 1). As proof of principle, we fused mCherryOpt to MldA (locus tag CD2717), a recently described cell division protein found only in C. difficile and a few of its closest relatives (6). We reported previously that a CFPopt-MldA fusion localized to the division site in ∼35% of cells growing in TY (6). Similar results were obtained with mCherryOpt-MldA, with septal localization apparent in 41% ± 3% of the population (mean ± the standard deviation, n = three independent experiments with >100 cells scored per experiment) (Fig. 4).
FIG 4.

Septal localization of mCherryOpt fusions to the division proteins MldA and ZapA. C. difficile cells harboring pRAN535 (mCherryOpt-MldA) or pRAN534 (mCherryOpt-ZapACd) were fixed, removed from the anaerobic chamber, and photographed the next morning. (A and B) Phase-contrast images. (A′ and B′) Fluorescence images. Arrows indicate examples of septal localization. (C and D) Quantitation of fluorescence intensity along transects through the cells marked with an asterisk in panels A′ and B′. The transects begin ∼1 μm before each cell (i.e., the end with the asterisk) and extend ∼1 μm beyond each cell. As noted elsewhere (6) and as documented in Fig. S3 in the supplemental material, C. difficile does not always divide precisely at the midcell.
Next, we sought to determine whether mCherryOpt could be used to verify the identity of a predicted C. difficile cell division protein. ZapA is a widely conserved FtsZ-binding protein that has been studied primarily in E. coli and Bacillus subtilis, where it localizes sharply to the septal ring (25–30). ZapA proteins have two domains, a globular head that binds FtsZ and a C-terminal coiled-coil that mediates tetramerization (31, 32). In C. difficile 630, locus CD0701 is annotated as a “putative cell division protein” based on its similarity to ZapA (13, 33), and we will refer to it henceforth as ZapACd. However, whether ZapACd is in fact a ZapA ortholog is not completely clear based on bioinformatic approaches alone; ZapACd is ∼100 amino acids longer than ZapAEc or ZapABs, and amino acid identity in the region of overlap is modest, e.g., 14% identity to ZapAEc and 33% identity to ZapABs (see Fig. S2 in the supplemental material) (19). Nevertheless, we found that an mCherryOpt-ZapACd fusion protein localized near the midcell in 38% ± 3% of C. difficile cells (n = three independent experiments with >100 cells scored per experiment) (Fig. 4). Because not all mCherryOpt-ZapACd bands were precisely at the midcell, we sought independent evidence that they correspond to division sites. Measurements of the distance from the cell poles to the bands revealed most are at or near the midcell, and their spatial distribution mimics division septa as determined by staining with the membrane dye FM4-64 (see Fig. S3 in the supplemental material). These findings are consistent with the prediction that CD0701 is a ZapA ortholog. The anomaly of ZapACd being ∼100 amino acids longer than ZapAEc or ZapABs can be attributed to a much longer predicted coiled-coil domain (Pfam version 27.0 [34]).
Application of mCherryOpt as a reporter of gene expression.
In C. difficile the pdaV promoter (PpdaV) directs transcription of a seven-gene operon necessary for resistance to lysozyme (17, 35). One of the genes in the operon is csfV, which codes for an extracytoplasmic function (ECF) sigma factor required for transcription from PpdaV (35). To test the suitability of mCherryOpt as a gene expression reporter in C. difficile, we replaced the Ptet promoter-regulatory region in pDSW1728 with an ∼300-bp DNA fragment carrying the promoter-regulatory region for the pdaV operon. The resulting PpdaV::mCherryOpt reporter plasmid is designated pRAN738.
C. difficile exconjugants harboring pRAN738 were grown to mid-log phase in TY medium, exposed to lysozyme for 1 h, and then fixed and exposed to air overnight to allow for chromophore maturation. Fluorescence microscopy revealed the expected lysozyme-dependent increase in fluorescence intensity, which was completely dependent upon the ECF sigma CsfV (Fig. 5A and B). Fluorescence was relatively uniform from cell to cell, indicating the plasmid is well maintained and that lysozyme reaches all cells in the population. The fact that the wild-type reporter strain exhibited faint fluorescence even in the absence of lysozyme, whereas the csfV mutant background did not, confirms basal transcription at PpdaV requires σV (17, 35). Quantifying fluorescence with a plate reader revealed that there was a 9.4-fold induction of PpdaV::mCherryOpt (Fig. 5C; 0 versus 20 μg of lysozyme/ml).
FIG 5.
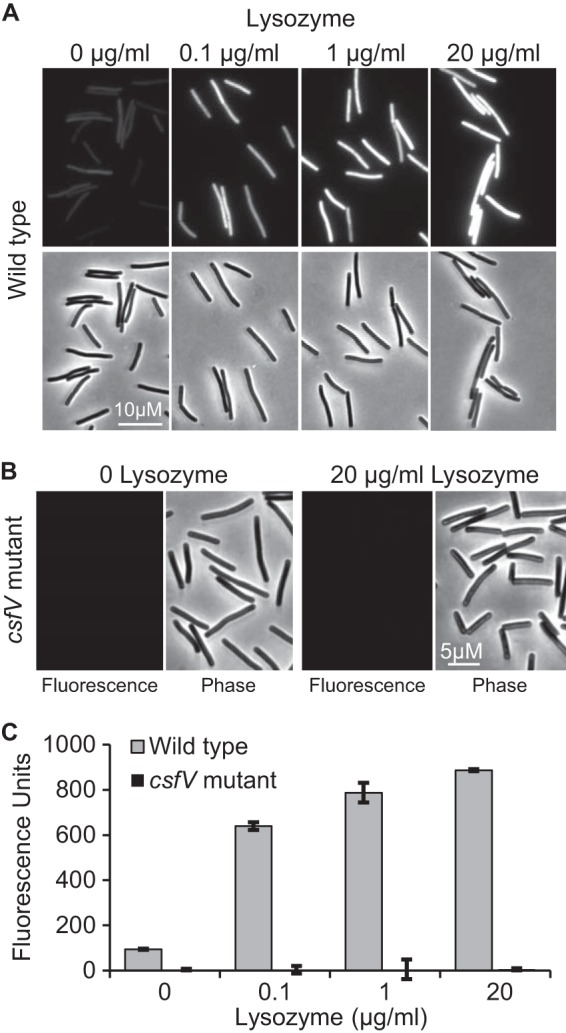
Use of mCherryOpt to monitor induction of the pdaV promoter by lysozyme. Wild-type (A) or csfV mutant (B) strains of C. difficile containing pRAN738 (PpdaV::mCherryOpt) were grown to an OD600 of 0.3, exposed to lysozyme for 1 h, fixed, and removed from the anaerobic chamber. Fluorescence and phase contrast micrographs were obtained 16 h later. (C) Same as in panels A and B, except that fluorescence was quantified using a plate reader and normalized to the OD600.
Fluorescent proteins require considerable time to fold and mature, so mCherryOpt might under-report induction if a significant fraction of the protein fails to become fluorescent. We explored this possibility by using both qRT-PCR and fluorescence to measure gene expression after cells had been exposed to lysozyme for 1 or 4 h. At the 1-h time point, PpdaV::mCherryOpt was induced 5-fold as measured by fluorescence but 28-fold as measured by qRT-PCR (see Fig. S4 in the supplemental material). This is a ∼6-fold difference. At the 4-h time point, the two methods gave more similar results: 45-fold induction by qRT-PCR and 30-fold induction by fluorescence (see Fig. S4 in the supplemental material). Collectively, these data indicate mCherryOpt tends to under-report induction, particularly if the protein has not had several hours to mature prior to fixation. Thus, like all proxies for gene expression, the results obtained using mCherryOpt must be interpreted with caution.
Plasmid stability and copy number.
Our mCherryOpt vectors contain a pCD6 replicon. Although pCD6-based plasmids are widely used in C. difficile, the published estimates of their segregational stability vary widely (22, 36, 37), and we could not find any published estimates of copy number. To assess plasmid stability, we passaged JIR8094 exconjugates containing pRPF185, pDSW1728, and pRAN738 in TY media without antibiotic selection. After 46 generations, ∼70% of the cells in the culture could form a colony on TY plates containing Thi at 10 μg/ml (Table 4). This corresponds to a rate of plasmid loss of <1% per generation, assuming progeny grew at equal rates with or without the plasmids.
TABLE 4.
Plasmid stability
| Plasmid | Mean % ± SDa |
|
|---|---|---|
| Thir | Stability | |
| pRAN738 | 80.9 ± 1.6 | 99.5 ± 0.0 |
| pDSW1728 | 78.9 ± 2.9 | 99.5 ± 0.1 |
| pRPF185 | 66.8 ± 20.5 | 99.1 ± 0.7 |
Thir, the fraction of cells resistant to thiamphenicol; stability, the fraction of daughter cells that retain the plasmid after each cycle of cell division, as calculated based on Thir data (see Materials and Methods). The means for three experiments are shown.
To determine the plasmid copy number, C. difficile cells containing either pRPF185 or pRAN416 (a pRPF185 derivative with mldA) were grown in TY medium with thiamphenicol to an OD600 of ∼0.6. Total plasmid and chromosomal DNA were extracted using phenol-chloroform, and the relative amounts of various plasmid-borne and chromosomal genes were determined by qPCR. Three primer sets were used to target three genes: rpoB encodes a subunit of RNA polymerase and resides on the chromosome, cat confers resistance to thiamphenicol and resides on the plasmids, and mldA codes for a C. difficile cell division protein and is found on the chromosome and one of the plasmids, pRAN416. The ratio of cat to rpoB ranged from 4 to 7, while the ratio of mldA to rpoB was closer to 10 (Table 5). Thus, we estimate that the plasmids are present at approximately 4 to 10 copies per chromosome during exponential growth in TY.
TABLE 5.
Plasmid copy number
| Target genes | Mean ratio ± SDa |
|
|---|---|---|
| RAN433 | RAN429 | |
| catR and rpoB | 4.5 ± 0.3 | 7.3 ± 0.9 |
| mldA and rpoB | 1.4 ± 0.9 | 9.6 ± 0.9 |
| catR and mldA | 4.0 ± 2.3 | 0.76 ± 0.1 |
The means for three biological replicates are shown, each assayed with three technical replicates. RAN433 harbors pRPF185: cat is on the plasmid, and both rpoB and mldA are chromosomal. RAN429 harbors pRAN416: cat is on the plasmid, rpoB is on the chromosome, and mldA is on both the plasmid and the chromosome.
DISCUSSION
GFP and related fluorescent proteins are powerful tools for studying gene expression and protein localization in a wide variety of organisms, but the fact that these reporters require O2 for chromophore maturation has hampered their use in strict anaerobes. Nevertheless, we recently used cyan fluorescent protein (CFP) to demonstrate septal localization of three new cell division proteins in C. difficile (6). This application was made possible by our discovery that CFP produced during anaerobic growth can acquire fluorescence even after cells are fixed to preserve their architecture. We show here that a codon-optimized mCherry red fluorescent protein is superior to CFP because it matures quickly and there is less interference from the intrinsic fluorescence of C. difficile.
We also constructed and characterized two plasmids that we think will prove generally useful to the C. difficile community (Fig. 1). pDSW1728 is designed to be used as a reporter of gene expression because unique restriction sites for NheI and SacI facilitate placing mCherryOpt under the control of essentially any promoter-regulatory region of interest. pRAN473 is designed for protein localization studies and has an in-frame MCS that can be used for fusing mCherryOpt to the N terminus of target proteins. The copy number of these plasmids is in the range of 4 to 10 per genome, and they are stably maintained even in the absence of antibiotic selection.
For studies of promoter activity, mCherryOpt has a couple of advantages that should make it a useful complement to alternatives such as the gus reporter and RT-PCR. First, mCherryOpt is convenient because no manipulations are necessary beyond a 2-h (or less) exposure of the culture to air. The fact that fixation can be omitted for mCherryOpt should facilitate some experiments, such as high-throughput screening of small-molecule libraries to identify potential new drugs. However, to observe native patterns of protein localization fixation is essential because C. difficile dies and lyses after exposure to air. Second, when mCherryOpt is visualized by microscopy it can be used to ask whether gene expression is uniform across all cells in a population. Although this is often the case, there are well-documented exceptions that would be difficult to study using gus or RT-PCR, such as bistable regulatory switches and the spatial variation of gene expression in biofilms (38–41).
Despite the clear utility of mCherryOpt, investigators need to be mindful of its limitations. We found that mCherryOpt underestimated PpdaV transcription, particularly when cells were analyzed after 1 h of induction. Fluorescent proteins are generally not well suited for monitoring the kinetics of changes in gene expression because they fold slowly and have long half-lives (e.g., >24 h for wild-type GFP and 40 to 190 min for “unstable” GFP variants developed to facilitate studies of transient gene expression in bacteria [42]). When using fluorescent proteins to study protein localization, it should be remembered that heterologous tags can perturb protein function, sometimes in ways that are difficult to recognize (43). In addition, the requirement for O2 precludes use of mCherryOpt for studies of dynamic protein localization in live C. difficile cells, although this should not be a problem in anaerobes that tolerate transient exposure to air (44). Some alternative fluorescent labels currently under development are smaller and do not require O2, so they may overcome these limitations (45, 46). The limitations of mCherryOpt notwithstanding, our findings suggest it will prove to be a useful addition to the C. difficile molecular biology toolbox.
Supplementary Material
ACKNOWLEDGMENTS
This research was supported by National Institutes of Health grants GM-083975 to D.S.W. and AI-087834 to C.D.E.
We thank Neil Fairweather for pRPF185, Inka Sastalla and Stephen H. Leppla for CFPopt, Michael A. Apicella for access to a plate reader, and members of the Ellermeier and Weiss laboratories for helpful discussions.
Footnotes
Supplemental material for this article may be found at http://dx.doi.org/10.1128/AEM.03446-14.
REFERENCES
- 1.Centers for Disease Control and Prevention. 2013. Antibiotic resistance threats in the United States, 2013. Centers for Disease Control and Prevention, Atlanta, GA. [Google Scholar]
- 2.Rupnik M, Wilcox MH, Gerding DN. 2009. Clostridium difficile infection: new developments in epidemiology and pathogenesis. Nat Rev Microbiol 7:526–536. doi: 10.1038/nrmicro2164. [DOI] [PubMed] [Google Scholar]
- 3.Jones AM, Kuijper EJ, Wilcox MH. 2013. Clostridium difficile: a European perspective. J Infect 66:115–128. doi: 10.1016/j.jinf.2012.10.019. [DOI] [PubMed] [Google Scholar]
- 4.Heim R, Prasher DC, Tsien RY. 1994. Wavelength mutations and posttranslational autoxidation of green fluorescent protein. Proc Natl Acad Sci U S A 91:12501–12504. doi: 10.1073/pnas.91.26.12501. [DOI] [PMC free article] [PubMed] [Google Scholar]
- 5.Zhang C, Xing XH, Lou K. 2005. Rapid detection of a gfp-marked Enterobacter aerogenes under anaerobic conditions by aerobic fluorescence recovery. FEMS Microbiol Lett 249:211–218. doi: 10.1016/j.femsle.2005.05.051. [DOI] [PubMed] [Google Scholar]
- 6.Ransom EM, Williams KB, Weiss DS, Ellermeier CD. 2014. Identification and characterization of a gene cluster required for proper rod shape, cell division, and pathogenesis in Clostridium difficile. J Bacteriol 196:2290–2300. doi: 10.1128/JB.00038-14. [DOI] [PMC free article] [PubMed] [Google Scholar]
- 7.Rueda S, Vicente M, Mingorance J. 2003. Concentration and assembly of the division ring proteins FtsZ, FtsA, and ZipA during the Escherichia coli cell cycle. J Bacteriol 185:3344–3351. doi: 10.1128/JB.185.11.3344-3351.2003. [DOI] [PMC free article] [PubMed] [Google Scholar]
- 8.Anderson DE, Gueiros-Filho FJ, Erickson HP. 2004. Assembly dynamics of FtsZ rings in Bacillus subtilis and Escherichia coli and effects of FtsZ-regulating proteins. J Bacteriol 186:5775–5781. doi: 10.1128/JB.186.17.5775-5781.2004. [DOI] [PMC free article] [PubMed] [Google Scholar]
- 9.Strahl H, Hamoen LW. 2010. Membrane potential is important for bacterial cell division. Proc Natl Acad Sci U S A 107:12281–12286. doi: 10.1073/pnas.1005485107. [DOI] [PMC free article] [PubMed] [Google Scholar]
- 10.Barra-Carrasco J, Olguin-Araneda V, Plaza-Garrido A, Miranda-Cardenas C, Cofre-Araneda G, Pizarro-Guajardo M, Sarker MR, Paredes-Sabja D. 2013. The Clostridium difficile exosporium cysteine (CdeC)-rich protein is required for exosporium morphogenesis and coat assembly. J Bacteriol 195:3863–3875. doi: 10.1128/JB.00369-13. [DOI] [PMC free article] [PubMed] [Google Scholar]
- 11.Shaner NC, Campbell RE, Steinbach PA, Giepmans BN, Palmer AE, Tsien RY. 2004. Improved monomeric red, orange and yellow fluorescent proteins derived from Discosoma sp. red fluorescent protein. Nat Biotechnol 22:1567–1572. doi: 10.1038/nbt1037. [DOI] [PubMed] [Google Scholar]
- 12.O'Connor JR, Lyras D, Farrow KA, Adams V, Powell DR, Hinds J, Cheung JK, Rood JI. 2006. Construction and analysis of chromosomal Clostridium difficile mutants. Mol Microbiol 61:1335–1351. doi: 10.1111/j.1365-2958.2006.05315.x. [DOI] [PubMed] [Google Scholar]
- 13.Sebaihia M, Wren BW, Mullany P, Fairweather NF, Minton N, Stabler R, Thomson NR, Roberts AP, Cerdeno-Tarraga AM, Wang H, Holden MT, Wright A, Churcher C, Quail MA, Baker S, Bason N, Brooks K, Chillingworth T, Cronin A, Davis P, Dowd L, Fraser A, Feltwell T, Hance Z, Holroyd S, Jagels K, Moule S, Mungall K, Price C, Rabbinowitsch E, Sharp S, Simmonds M, Stevens K, Unwin L, Whithead S, Dupuy B, Dougan G, Barrell B, Parkhill J. 2006. The multidrug-resistant human pathogen Clostridium difficile has a highly mobile, mosaic genome. Nat Genet 38:779–786. doi: 10.1038/ng1830. [DOI] [PubMed] [Google Scholar]
- 14.Fagan RP, Fairweather NF. 2011. Clostridium difficile has two parallel and essential Sec secretion systems. J Biol Chem 286:27483–27493. doi: 10.1074/jbc.M111.263889. [DOI] [PMC free article] [PubMed] [Google Scholar]
- 15.Cormack BP, Valdivia RH, Falkow S. 1996. FACS-optimized mutants of the green fluorescent protein (GFP). Gene 173:33–38. doi: 10.1016/0378-1119(95)00685-0. [DOI] [PubMed] [Google Scholar]
- 16.Heap JT, Kuehne SA, Ehsaan M, Cartman ST, Cooksley CM, Scott JC, Minton NP. 2010. The ClosTron: mutagenesis in Clostridium refined and streamlined. J Microbiol Methods 80:49–55. doi: 10.1016/j.mimet.2009.10.018. [DOI] [PubMed] [Google Scholar]
- 17.Ho TD, Ellermeier CD. 2011. PrsW is required for colonization, resistance to antimicrobial peptides, and expression of extracytoplasmic function sigma factors in Clostridium difficile. Infect Immun 79:3229–3238. doi: 10.1128/IAI.00019-11. [DOI] [PMC free article] [PubMed] [Google Scholar]
- 18.Nakamura Y, Gojobori T, Ikemura T. 2000. Codon usage tabulated from international DNA sequence databases: status for the year 2000. Nucleic Acids Res 28:292. doi: 10.1093/nar/28.1.292. [DOI] [PMC free article] [PubMed] [Google Scholar]
- 19.Sievers F, Wilm A, Dineen D, Gibson TJ, Karplus K, Li W, Lopez R, McWilliam H, Remmert M, Soding J, Thompson JD, Higgins DG. 2011. Fast, scalable generation of high-quality protein multiple sequence alignments using Clustal Omega. Mol Syst Biol 7:539. doi: 10.1038/msb.2011.75. [DOI] [PMC free article] [PubMed] [Google Scholar]
- 20.Pogliano K, Harry E, Losick R. 1995. Visualization of the subcellular location of sporulation proteins in Bacillus subtilis using immunofluorescence microscopy. Mol Microbiol 18:459–470. doi: 10.1111/j.1365-2958.1995.mmi_18030459.x. [DOI] [PubMed] [Google Scholar]
- 21.Bouillaut L, McBride SM, Sorg JA. 2011. Genetic manipulation of Clostridium difficile. Curr Protoc Microbiol Chapter 9:Unit 9A.2. doi: 10.1002/9780471729259.mc09a02s20. [DOI] [PMC free article] [PubMed] [Google Scholar]
- 22.Heap JT, Pennington OJ, Cartman ST, Minton NP. 2009. A modular system for Clostridium shuttle plasmids. J Microbiol Methods 78:79–85. doi: 10.1016/j.mimet.2009.05.004. [DOI] [PubMed] [Google Scholar]
- 23.Shaner NC, Steinbach PA, Tsien RY. 2005. A guide to choosing fluorescent proteins. Nat Methods 2:905–909. doi: 10.1038/nmeth819. [DOI] [PubMed] [Google Scholar]
- 24.Sastalla I, Chim K, Cheung GY, Pomerantsev AP, Leppla SH. 2009. Codon-optimized fluorescent proteins designed for expression in low-GC gram-positive bacteria. Appl Environ Microbiol 75:2099–2110. doi: 10.1128/AEM.02066-08. [DOI] [PMC free article] [PubMed] [Google Scholar]
- 25.Gueiros-Filho FJ, Losick R. 2002. A widely conserved bacterial cell division protein that promotes assembly of the tubulin-like protein FtsZ. Genes Dev 16:2544–2556. doi: 10.1101/gad.1014102. [DOI] [PMC free article] [PubMed] [Google Scholar]
- 26.Johnson JE, Lackner LL, Hale CA, de Boer PA. 2004. ZipA is required for targeting of DMinC/DicB, but not DMinC/MinD, complexes to septal ring assemblies in Escherichia coli. J Bacteriol 186:2418–2429. doi: 10.1128/JB.186.8.2418-2429.2004. [DOI] [PMC free article] [PubMed] [Google Scholar]
- 27.Small E, Marrington R, Rodger A, Scott DJ, Sloan K, Roper D, Dafforn TR, Addinall SG. 2007. FtsZ polymer-bundling by the Escherichia coli ZapA orthologue, YgfE, involves a conformational change in bound GTP. J Mol Biol 369:210–221. doi: 10.1016/j.jmb.2007.03.025. [DOI] [PubMed] [Google Scholar]
- 28.Scheffers DJ. 2008. The effect of MinC on FtsZ polymerization is pH dependent and can be counteracted by ZapA. FEBS Lett 582:2601–2608. doi: 10.1016/j.febslet.2008.06.038. [DOI] [PubMed] [Google Scholar]
- 29.Galli E, Gerdes K. 2010. Spatial resolution of two bacterial cell division proteins: ZapA recruits ZapB to the inner face of the Z-ring. Mol Microbiol 76:1514–1526. doi: 10.1111/j.1365-2958.2010.07183.x. [DOI] [PubMed] [Google Scholar]
- 30.Buss J, Coltharp C, Huang T, Pohlmeyer C, Wang SC, Hatem C, Xiao J. 2013. In vivo organization of the FtsZ-ring by ZapA and ZapB revealed by quantitative super-resolution microscopy. Mol Microbiol 89:1099–1120. doi: 10.1111/mmi.12331. [DOI] [PMC free article] [PubMed] [Google Scholar]
- 31.Low HH, Moncrieffe MC, Lowe J. 2004. The crystal structure of ZapA and its modulation of FtsZ polymerisation. J Mol Biol 341:839–852. doi: 10.1016/j.jmb.2004.05.031. [DOI] [PubMed] [Google Scholar]
- 32.Roach EJ, Kimber MS, Khursigara CM. 2014. Crystal structure and site-directed mutational analysis reveals key residues involved in Escherichia coli ZapA function. J Biol Chem 289:23276–23286. doi: 10.1074/jbc.M114.561928. [DOI] [PMC free article] [PubMed] [Google Scholar]
- 33.Monot M, Boursaux-Eude C, Thibonnier M, Vallenet D, Moszer I, Medigue C, Martin-Verstraete I, Dupuy B. 2011. Reannotation of the genome sequence of Clostridium difficile strain 630. J Med Microbiol 60:1193–1199. doi: 10.1099/jmm.0.030452-0. [DOI] [PubMed] [Google Scholar]
- 34.Finn RD, Bateman A, Clements J, Coggill P, Eberhardt RY, Eddy SR, Heger A, Hetherington K, Holm L, Mistry J, Sonnhammer EL, Tate J, Punta M. 2014. Pfam: the protein families database. Nucleic Acids Res 42:D222–D230. doi: 10.1093/nar/gkt1223. [DOI] [PMC free article] [PubMed] [Google Scholar]
- 35.Ho TD, Williams KB, Chen Y, Helm RF, Popham DL, Ellermeier CD. 2014. Clostridium difficile extracytoplasmic function sigma factor sigmaV regulates lysozyme resistance and is necessary for pathogenesis in the hamster model of infection. Infect Immun 82:2345–2355. doi: 10.1128/IAI.01483-13. [DOI] [PMC free article] [PubMed] [Google Scholar]
- 36.Cartman ST, Minton NP. 2010. A mariner-based transposon system for in vivo random mutagenesis of Clostridium difficile. Appl Environ Microbiol 76:1103–1109. doi: 10.1128/AEM.02525-09. [DOI] [PMC free article] [PubMed] [Google Scholar]
- 37.Purdy D, O'Keeffe TA, Elmore M, Herbert M, McLeod A, Bokori-Brown M, Ostrowski A, Minton NP. 2002. Conjugative transfer of clostridial shuttle vectors from Escherichia coli to Clostridium difficile through circumvention of the restriction barrier. Mol Microbiol 46:439–452. doi: 10.1046/j.1365-2958.2002.03134.x. [DOI] [PubMed] [Google Scholar]
- 38.Dubnau D, Losick R. 2006. Bistability in bacteria. Mol Microbiol 61:564–572. doi: 10.1111/j.1365-2958.2006.05249.x. [DOI] [PubMed] [Google Scholar]
- 39.Maamar H, Raj A, Dubnau D. 2007. Noise in gene expression determines cell fate in Bacillus subtilis. Science 317:526–529. doi: 10.1126/science.1140818. [DOI] [PMC free article] [PubMed] [Google Scholar]
- 40.Lequette Y, Greenberg EP. 2005. Timing and localization of rhamnolipid synthesis gene expression in Pseudomonas aeruginosa biofilms. J Bacteriol 187:37–44. doi: 10.1128/JB.187.1.37-44.2005. [DOI] [PMC free article] [PubMed] [Google Scholar]
- 41.Stewart PS, Franklin MJ. 2008. Physiological heterogeneity in biofilms. Nat Rev Microbiol 6:199–210. doi: 10.1038/nrmicro1838. [DOI] [PubMed] [Google Scholar]
- 42.Andersen JB, Sternberg C, Poulsen LK, Bjorn SP, Givskov M, Molin S. 1998. New unstable variants of green fluorescent protein for studies of transient gene expression in bacteria. Appl Environ Microbiol 64:2240–2246. [DOI] [PMC free article] [PubMed] [Google Scholar]
- 43.Margolin W. 2012. The price of tags in protein localization studies. J Bacteriol 194:6369–6371. doi: 10.1128/JB.01640-12. [DOI] [PMC free article] [PubMed] [Google Scholar]
- 44.Hartman AH, Liu H, Melville SB. 2011. Construction and characterization of a lactose-inducible promoter system for controlled gene expression in Clostridium perfringens. Appl Environ Microbiol 77:471–478. doi: 10.1128/AEM.01536-10. [DOI] [PMC free article] [PubMed] [Google Scholar]
- 45.Mukherjee A, Schroeder CM. 2014. Flavin-based fluorescent proteins: emerging paradigms in biological imaging. Curr Opin Biotechnol 31C:16–23. doi: 10.1016/j.copbio.2014.07.010. [DOI] [PubMed] [Google Scholar]
- 46.Hinner MJ, Johnsson K. 2010. How to obtain labeled proteins and what to do with them. Curr Opin Biotechnol 21:766–776. doi: 10.1016/j.copbio.2010.09.011. [DOI] [PubMed] [Google Scholar]
- 47.Trieu-Cuot P, Arthur M, Courvalin P. 1987. Origin, evolution and dissemination of antibiotic resistance genes. Microbiol Sci 4:263–266. [PubMed] [Google Scholar]
Associated Data
This section collects any data citations, data availability statements, or supplementary materials included in this article.