

We present data on cell-to-cell variability (“‘noise”') of gene expression in human cells, obtained through a combination of single-molecule mRNA FISH and single-cell volume measurements. We find that noise in terms of mRNA numbers exceeds the noise in terms of mRNA concentration. This study provides an improved method to determine gene expression noise.
Abstract
Transcriptional stochasticity can be measured by counting the number of mRNA molecules per cell. Cell-to-cell variability is best captured in terms of concentration rather than molecule counts, because reaction rates depend on concentrations. We combined single-molecule mRNA counting with single-cell volume measurements to quantify the statistics of both transcript numbers and concentrations in human cells. We compared three cell clones that differ only in the genomic integration site of an identical constitutively expressed reporter gene. The transcript number per cell varied proportionally with cell volume in all three clones, indicating concentration homeostasis. We found that the cell-to-cell variability in the mRNA concentration is almost exclusively due to cell-to-cell variation in gene expression activity, whereas the cell-to-cell variation in mRNA number is larger, due to a significant contribution of cell volume variability. We concluded that the precise relationship between transcript number and cell volume sets the biological stochasticity of living cells. This study highlights the importance of the quantitative measurement of transcript concentrations in studies of cell-to-cell variability in biology.
INTRODUCTION
Spontaneous fluctuations in the activities of molecular processes cause heterogeneity in the molecular composition of isogenic cells (Ozbudak et al., 2002; Elowitz et al., 2002; Sigal et al., 2006). Cell-to-cell variability, often referred to as “noise,” has been observed in mRNA (Golding et al., 2005; Raj et al., 2006; Zenklusen et al., 2008) and protein levels (Ozbudak et al., 2002; Elowitz et al., 2002; Sigal et al., 2006; Yu et al., 2006), in the timing of molecular processes (Amir et al., 2007; Di Talia et al., 2007), and in cellular growth rates (Boulineau et al., 2013). The causes of molecular noise involve molecules occurring at low numbers per cell, such as transcription factors or mRNAs, that tend to show large, spontaneous deviations relative to their mean number within the cell population (Paulsson, 2004). These deviations (fluctuations) can be caused by cell division (Huh and Paulsson, 2011), transcription bursting (Suter et al., 2011), or transient imbalances between molecular synthesis and degradation rates that occur spontaneously through thermal noise (“intrinsic” noise) or due to fluctuations in the number of regulators (“extrinsic” noise) (Thattai and van Oudenaarden, 2001; Elowitz et al., 2002; Swain et al., 2002; Paulsson, 2004). Extrinsic noise indicates that fluctuations can propagate through the entire molecular network of a cell (Pedraza and Paulsson, 2008). As a result, the molecular composition of cells can be highly variable and cause heterogeneity in differentiation decisions (Wernet et al., 2006), stress response magnitude (Veening et al., 2005), and the survival prospects of cells after drug exposure (Spencer et al., 2009). Two highly informative reviews covering gene expression noise and its consequences were written by Kaern et al. (2005) and Raj and van Oudenaarden (2008).
Early studies on stochastic gene expression relied on fluorescent proteins to assess protein noise by either taking snapshots (Elowitz et al., 2002; Ozbudak et al., 2002) or by using real-time fluorescence imaging (Rosenfeld et al., 2005; Sigal et al., 2006). More recently, single-molecule mRNA counting has been introduced as a method for absolute quantification of mRNA number (Golding et al., 2005; Raj et al., 2006, 2008). The advantage of single-transcript counting with single-molecule RNA fluorescence in situ hybridization (smFISH) is that it does not require genetic engineering (Raj et al., 2006, 2008; Zenklusen et al., 2008; Youk et al., 2010). Specific DNA probes tagged with fluorescent dyes are used to visualize individual mRNA molecules within fixed cells (Figure 1A).
FIGURE 1:

Statistics of single-cell mRNA numbers. (A) Schematic overview of the smFISH method applied to our reporter gene mRNA. Colocalization of the mRNA molecules with the DAPI counter staining identified spots as nuclear mRNA (mN); others are cytoplasmic mRNA (mc). (B) Statistics of the mRNA molecules in the cell (m), nucleus (mN), and cytoplasm (mc) for the three different clones (color coded: Clone I is shown in red, Clone II is shown in blue, and Clone III is shown in green). Notation: μ = mean; σ = SD; cv = coefficient of variation; Δσ = the fraction of samples between μ - σ and μ + σ; ρ = correlation between mc and mN; and *p < 0.001 The 95% confidence intervals of the statistics are given in Supplemental Figure S15. (C) For a specific cell volume (V), the mean mRNA number is calculated from the data. This conditional mean displays linear scaling with respect to volume, indicating homeostasis in mRNA concentration. The gray histogram in the background shows the total number of cells per volume bin for all three clones (bin size = 100 〈m|V〉). Higher counts indicate higher reliability of the corresponding determination of σ. A least-squares linear fit is shown for all three clones. The explained fraction of the variance in 〈m|V〉 with this fit is 0.80, 0.77, and 0.84 for clones I, II, and III, respectively. Supplemental Figure S9 shows the single-cell relation between cell volume and mRNA number. The conditional variances of the data are given in Supplemental Figure S10. (D) Representative confocal images of a cell, with Z1 to Z12 corresponding to subsequent optical sections (z-slices) of the cell. The mRNA molecules are shown in red; the DAPI-stained nucleus is shown in blue. Additional images are given in Supplemental Figure S2. (E–G) Scatter plots of mc and mN for the three different clones. Marginal histograms show the distribution of mc (top) and mN (right). The measured number of cells is given by n.
SmFISH has great potential in cell biology for assessing the role of stochasticity in cell behaviors such as differentiation and drug response. Cell-to-cell variability (noise) is best captured by concentrations of molecules, because reaction rates depend on concentrations. Single-molecule counting accompanied by cell volume measurements provides a reliable way to assess the biological noise of single cells. Such data have so far not been reported for transcripts.
In this study, we determined single-cell mRNA concentrations by quantifying the volumes of single cells and their mRNA numbers using confocal microscopy. We studied three human cell line variants that express the same constitutively expressed gene from a different genomic location to identify gene location–dependent effects. To attain robust statistics of the volume dependency of the mRNA number statistics, we studied nearly 1000 single cells of each clone. We found that transcript number noise overestimates biological noise (in concentration units) by a factor that depends on the cell volume variability and the correlation of transcript number with cell volume.
RESULTS
Single-cell transcript data indicate gene location–dependent mRNA expression
We analyzed three clones derived from the same human cell line (HEK293; described in Gierman et al., 2007). Each clone has a single random insertion of the same green fluorescent protein (GFP) reporter gene controlled by a constitutive phosphoglucokinase (PGK) promoter (Gierman et al., 2007). We determined the statistics of the GFP mRNA levels in single cells with smFISH (Figure 1A). The probe set contained 35 probes of 17–18 nucleotides coupled with a fluorescent label (Supplemental Information 7). Images of single cells were obtained with confocal microscopy on smFISH-treated cells counterstained with 4′,6-diamidino-2-phenylindole (DAPI). Individual cells were recorded as 52 z-stack images (300 nm/slice; Figure 1D and Supplemental Figure S2). Laminar staining confirmed that the DAPI staining correctly identifies the nuclear envelope (Supplemental Figure S1). On the basis of the colocalization with the DAPI signal, we assigned each mRNA molecule to be either nuclear or cytoplasmic. An overview of the transcript statistics is given in Figure 1B and Supplemental Figure S14, and the mRNA distributions are shown in Figure 1, E–G, and Supplemental Figure S13. Supplemental Figure S15 provides a 95% confidence interval for the measurements discussed below.
For cell clone I, the number of mRNA molecules expressed per cell (m) was, on average, 45.7 mRNA transcripts obtained from a data set containing 838 cells. The coefficient of variation indicates that the SD is ∼45% of the mean. Approximately 72% of the cells have mRNA numbers that deviate less than one SD from the mean mRNA number. The symmetry of the mRNA number distribution is indicated by the 13.8 and 13.9% of the cells deviating more than one SD of the mean on the left and right sides of the distribution, respectively.
Colocalization of an mRNA spot with the DAPI signal enabled us to calculate the mRNA number in the nuclei of these cells. The mean number of mRNAs per nucleus (mN) was 9.7 with an SD of 5.4. The cytoplasmic mRNA number (mc) follows directly from (m – mN) and is 36.0 mRNA transcripts. The number of mRNA transcripts appears to be lower in the nucleus than in the cytoplasm, indicating that the lifetime of the mRNA in the cytoplasm is higher than the residence time in the nucleus. Compared with the coefficient of variation of the mRNA in the nucleus, which is 56%, the cytoplasmic mRNA numbers are less noisy, with an SD of ∼48% of the mean. The higher noise in nuclear mRNA numbers is mostly explained by the higher intrinsic noise contribution (1/µn) in the nucleus. The fact that (σ/µ)2 exceeds (1/µn) for nuclear mRNA indicates that part of the gene expression noise derives from extrinsic gene expression noise (Paulsson, 2004). The correlation coefficient (ρ) between the nuclear and cytoplasmic mRNA numbers per cell indicates a moderate correlation (ρ = 0.57) between the nuclear and cytoplasmic mRNA numbers.
The same analysis for the other two clones yields very similar results. The combined data of the three clones allow for a comparison of the different genomic integration sites. The mean expression level between the three clones differs (analysis of variance [ANOVA], p < 0.0001, Supplemental Information 2) on average by 20% and maximally by 40%. These numbers correlate with the protein expression data of the clones (Gierman et al., 2007; Supplemental Figure S8). The cell-to-cell variability in mRNA number per cell, measured as the coefficient of variation, is significantly different (ANOVA, p < 0.03, Supplemental Information 2 and Supplemental Figures S3 and S4) among the three clones. Because the three clones differ only in their genomic location of the reporter gene, these differences demonstrate the influence of gene location on expression stochasticity (Becskei et al., 2005; Dar et al., 2012; Viñuelas et al., 2012). Additionally, an increase in the mean expression level does not necessarily cause an increase in the SD when comparing the different clones. This indicates that the mean expression level and the variability can be independently regulated, as previously observed for protein expression data (Viñuelas et al., 2012).
Volume statistics of single cells
To assess biological mRNA noise, we require, in addition to mRNA number per cell, the volume of each cell. The same confocal z-stack images used for smFISH were used to determine the whole-cell, cytoplasmic, and nuclear volumes of the cells by tracing the contours of these compartments (Figure 2A). This allows us to obtain mRNA number, volume, and concentration data for each cell.
FIGURE 2:

Statistics of single-cell volumes. (A) Overview of the determination of the cell volumes. The background intensity was used to track the contour of the cell, and the DAPI signal provides the nuclear contour. The three-dimensional cell image was reconstructed by combining the contours of subsequent z-slices. (B) Statistics of the volumes of the cell (V), nucleus (VN), and cytoplasm (Vc) for the three different clones (color coded). Notation: μ = mean; σ = SD; cv = coefficient of variation; Δσ = the fraction of samples between μ – σ and μ + σ; ρ = correlation between mc and mN; and *p < 0.001 (H0: ρ = 0).The 95% confidence intervals of the statistics are given in Supplemental Figure S15. (C–E) Scatter plots of Vc and VN for the three different clones. Marginal histograms show the distribution of Vc (top) and VN (right). Supplemental Figure S5 gives the distributions of V. The measured number of cells is given by n.
The measured volume distributions for the whole cell (Supplemental Figure S5), as well as the cytoplasmic and nuclear volume distributions (Figure 2C), are positively skewed, which means there are, relative to the mean, more small than large cells. Similarly shaped distributions have previously been reported for stationary, growing cell populations (Tzur et al., 2009). These positively skewed distributions are due to the formation of two (smaller) daughter cells from each (large) mother cell. The cell volume distributions can be well approximated by theoretical cell volume distributions derived from balanced, exponential growth of the cells (Supplemental Information 3.3 and Supplemental Figure S7).
The obtained volume measurements are summarized in Figure 2B. The mean cell volume (V) for clone I is 1800 µm3, with a larger nucleus (979 µm3), on average, than cytoplasm (822 µm3). For the volume distribution of clone I, 70% of the cells have a volume deviation maximally one SD of the mean. The correlation coefficients between the nuclear and the cytoplasmic volumes indicate a weak but significant positive correlation, indicating growth of both the nuclear and cytoplasmic volume during cell maturation.
Because the clones are isogenic, except for the integration site of the construct, the measured volume statistics would be expected to be similar. Figure 2B and Supplemental Figure S5 confirm this expectation for the three volume distributions measured.
mRNA concentration statistics of single cells indicate mRNA concentration homeostasis
Next we combined the mRNA number and volume data of each cell to determine the statistics of cellular, cytoplasmic, and nuclear mRNA concentrations (Figure 3A). Figure 3B shows that the mean mRNA concentration differs among the three clones, indicating the dependence of expression levels on the gene location (Supplemental Information 2). Scaling of the mean and SD are independent. We observe higher mRNA concentrations in the cytoplasm than in the nucleus. Similar conclusions can be drawn from the mRNA numbers.
FIGURE 3:

Statistics of single-cell mRNA concentrations. (A) The previously obtained mRNA number (Figure 1) and volume data (Figure 2) were used to determine the concentration of mRNA in single cells (c), in their nuclei (cN), and in their cytoplasm (cc). (B) Statistics of the different mRNA concentrations for the three different clones (color coded). Notation: μ = mean; σ = SD; cv = coefficient of variation; Δσ = the fraction of samples between μ – σ and μ + σ; ρ = correlation between mc and mN; and *p < 0.001 (H0: ρ = 0). The 95% confidence intervals of the statistics are given in Supplemental Figure S15. (C) For a specific cell volume (V), the mean mRNA concentration (〈c|V〉) is calculated. This conditional mean is constant with respect to volume. The gray histogram in the background shows the number of cells considered per volume bin (bin size = 100 μm3). Higher counts indicate higher reliability of the corresponding determination of A least-squares linear fit is shown for all three clones, indicating mRNA concentration homeostasis. The conditional variances of the data set are shown in Supplemental Figure S10. (D–F) Scatter plots of (cN) and (cc) for the three different clones. Marginal histograms show the distribution of (cc) (top) and (cN) (right). The given concentration (number per cubic micrometer) can be converted to picomoles (pM) by multiplying with a conversion factor of 1660. The sample size is given by n. The bin size for the marginal histograms is 0.001 #/μm3.
The comparison of the mRNA concentration and mRNA number in terms of the coefficient of variation indicates that the concentration displays smaller cell-to-cell variability across all clones. Thus mRNA number noise overestimates the biological mRNA noise of the cells. The concentration variability is smaller because of the positive correlation of the cell volume with mRNA number per cell. This is indicated in Figure 1C, showing a linear dependency of the mean mRNA number (at a specific volume) with volume. The dependency of the mean mRNA number on volume is proportional, such that a doubling in cell volume is accompanied by a doubling in the mRNA number. The cellular mRNA concentration conditional on the cell volume is therefore constant, indicating homeostasis of the mRNA concentration (Figure 3C). The same proportionality of the mRNA numbers and homeostasis of the mRNA concentrations is observed in the nucleus (Supplemental Figure S11) and cytoplasm (Supplemental Figure S12) of the cells.
The volume scaling of the mRNA concentration statistics explains the concentration variability
To address the origins of the differences between the mRNA concentration (c) and the mRNA number (m) noise, we apply the law of total variance (Supplemental Information 3.1 and Supplemental Figure S6). This relation decomposes the mRNA number and mRNA concentration noise, each in a term that captures the volume-induced noise and another that quantifies gene expression noise (here x denotes either m or c):
 (1) (1)
|
Figure 4B makes the same decomposition for the experimental data. It shows that the gene expression noise term accounts for ∼70% of the mRNA number noise and for greater than 95% of the mRNA concentration noise. This indicates that mRNA number noise has a large contribution that derives from the scaling of the number of transcripts per cell with the cell volume.
FIGURE 4:

The theoretical and experimental relations between mRNA concentration and mRNA number noise and their dependency on volume. (A) Overview of theoretical relation used to analyze the data. The mRNA number noise  and mRNA concentration noise
  can be decomposed into two terms; the volume-dependent noise
  and gene-expression noise
  (see Eq. 1). When there is homeostasis of mRNA concentration, the relation between
  and
and  depends on the scaling of the variance in the conditional mRNA numbers. Under these conditions, the volume-dependent noise in mRNA numbers
  equals the noise in the volume distribution
  . (B) Experimental data of the relation shown in the theoretical section (A). The different colors give the corresponding measures for the three different clones. The circle graphs show how the total mRNA number and mRNA concentration noise are decomposed. mRNA number noise is higher than concentration noise, mainly due to its volume contribution. The scaling of var(m|V) with volume for clone III is shown. The observed scaling is linear or quadratic, resulting in a deviation of ± 4% between
  and
and  . The scaling of var(m|V) with volume for clones I and II can be found in Supplemental Figure S10.
The volume-induced noise contribution to the mRNA number noise can be estimated using the experimentally observed homeostasis relation (Figure 1C): 〈m/V〉 = αV, with α as a positive constant that equals the mRNA concentration (c). As a consequence, we obtain 〈m〉 = c〈V〉, var(〈m|V〉) = c2var(V), and var(〈m/V〉)/m2 = var(V)/〈V〉2. This means that the noise in cell volume (var(V)/〈V〉2) equals the volume-induced noise contribution to mRNA number noise. For an idealized model of cell growth in which cells divide at fixed intervals and into exactly equal halves, the noise in cell volume can be calculated to be ∼0.04 (Supplemental Information 3.3), which provides a lower bound for the volume-dependent noise in the mRNA numbers. The overview of the variances of the experimental data in Figure 4B shows that this volume-dependent noise is indeed close to the theoretical estimate of 0.04 and is almost equal to the noise directly calculated from the experimental volume distributions  . The small deviations are likely due to volume variation at fixed cell ages. The volume-dependent term explains 29.5, 28.4, and 30% of the mRNA number noise in clones I, II, and III, respectively.
Owing to mRNA concentration homeostasis, the volume-dependent term of the concentration noise equals zero; that is, var(〈c|V〉)/c2 = 0, which is also indicated by the experimental data (Figure 3C and  in Figure 4B). Thus the mRNA concentration noise is entirely determined by gene expression noise.
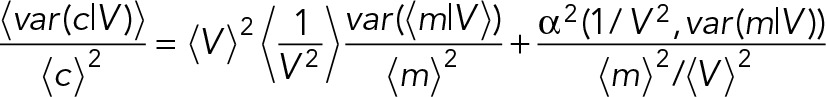
The experimental data indicate that the gene expression contributions to mRNA concentration and mRNA number noise are similar in absolute values (Figure 4B). Because volume-derived noise in mRNA concentration is close to zero, the mRNA concentration noise is approximately equal to the gene expression–derived noise in mRNA numbers. It turns out that this is a direct consequence of the observed mRNA concentration homeostasis and, in addition, the scaling of the conditional mRNA number variance, var(x|V), with cell volume. At mRNA concentration homeostasis, the exact relationship between the gene expression–induced mRNA number and concentration noise is given by (Supplemental Information 3.5)
 (2) (2)
|
with α2(x,y) denoting the covariance between x and y. Because we observe that var(m/v) increases with volume (Figure 4B and Supplemental Figure S9), the covariance will be negative. Therefore  is an upper bound for the relative deviation between the conditional noise in mRNA concentration and mRNA number in cases of concentration homeostasis. This upper bound is reached when the covariance equals zero. From the volume probability distribution,
  is estimated to be 1.12 (Supplemental Information 3.6). The deviation between
  requires the calculation of the covariance from the volume-scaling relation of the mRNA number variance conditional on volume, that is, from var (m|v) = βVγ. The experimental data (Supplemental Figure S9) indicate that this scaling is maximally quadratic with volume. The volume growth model predicts that, in cases of linear dependence, 〈var(c | V)〉 is 4% higher than 〈var(c | V)〉; in cases of quadratic dependence, it is 4% lower; and only when (var(m|V)) = βVγ0 is the maximal deviation of 12% achieved (Supplemental Information 4.6). As can be seen from Figure 4B, the relative difference between the two conditional noise terms indeed is close to the ± 4% region, as predicted by theory in combination with the experimentally observed volume scaling.
As a result of these relations, we can conclude that, for our data, the difference between mRNA concentration noise  and mRNA number noise
  is dominated by the contribution of the volume-dependent noise term, which is zero for concentrations but equals values between 0.04 and 0.06 for mRNA numbers. Under conditions of mRNA concentration homeostasis, this term is expected to be independent of the average expression level. The relative difference between mRNA number and concentration noise then depends on the magnitude of the volume-independent noise contribution. For the three clones we investigated, this amounted to differences of 36, 33, and 45% between mRNA concentration and mRNA number noise for I, II, and III, respectively. Thus biologically relevant mRNA concentration noise differs greatly from mRNA number noise, indicating the importance of the combined measurement of mRNA numbers and volumes of single cells.
DISCUSSION
Single-molecule RNA FISH is a powerful method for assessing cell-to-cell variation in gene expression. It does not require genetic engineering, and it gives the exact number of mRNA molecules per cell. In this study, we combined smFISH with cell volume measurements to obtain insight into the cell-to-cell variation of the mRNA concentration per cell. We studied three clones that only differed in the location of an identical reporter construct controlled by a constitutive PGK promoter. The differences in the mRNA statistics of these clones indicate gene location dependency, which presumably results from the different genomic contexts at the integration site. We found that mRNA number noise overestimates cell-to-cell variation. Noise in the mRNA concentration circumvents this problem by taking into account the correlation of mRNA number with cell volume. One candidate source of this correlation is cell growth.
We found that the mean mRNA number conditional on volume, 〈m|V〉, scaled linearly with volume, that is, 〈m|V〉 = cV, which indicates a constant mRNA concentration (c) as a function of cell volume (homeostasis). This we interpret as a constant mRNA concentration while the cell volume grows. In addition, we found that the mRNA number variance conditional on the volume, var(m|V), displayed a stronger than linear scaling with volume, that is,  . The latter scaling explained the difference between the volume-independent mRNA concentration and mRNA number noise, that is, between
  , which maximally amounts to a relative deviation of ±4% according to theory and in agreement with the experimental data (Figure 4). Taken together, these findings allow for a simple estimation of mRNA concentration noise based on mRNA number noise under conditions of mRNA concentration homeostasis:
  . We emphasize that the observed homeostasis of the mRNA concentration as function of the cellular volume may not apply to all genes. However, we do expect it to be a rather widespread phenomenon, in particular for the expression of constitutive genes during steady-state exponential growth of cells.
Our results indicate that constitutive gene expression is not completely understood at the level of a single cell. For homeostasis to occur during volume growth of the cell requires that  with ks and kd as zero-order and first-order rate constants for mRNA synthesis and degradation, respectively. (The half-life of the mRNA is ∼8 h [ Rowe et al., 2007], i.e., much shorter than the generation time of ∼24 h.) In other words, either the transcription rate or the degradation rate of mRNA are volume dependent or both such that the net effect leads to the proportionality of 〈m|V〉 with volume. This suggests a coupling between the net rate of increase in the transcript number and the cell volume. It is not clear how this results from the combined influences of mRNA decay, replication, and cell volume dynamics. Coupling between the rate of transcription and cell growth was previously shown by Zhurinsky and colleagues 2010). Their data indicate a global mechanism that determines the rate of transcription of most genes and the cellular growth rate.
The close to second-order scaling of var (m|V) with volume hints at another not yet understood detail of constitutive gene expression. We observed the volume scaling of 〈m|V〉 and var(m|V) with the same construct expressed from different genomic locations, and therefore the volume scaling is not likely to be a genome location–dependent phenomenon. The observed volume scaling of mRNA numbers is not likely to be a property of our reporter construct, as several other studies reported similar effects Rosenfeld et al., 2005; Sigal et al., 2006; Cohen et al., 2009; Cookson et al., 2010). Cookson et al. (2010) found in yeast a peak dependency of a GFP expressed from a constitutive promoter as function of cell volume, which is indicative of constant synthesis and an accelerating growth of cell volume as a function of the cell cycle. Similar data were reported for several human proteins (Sigal et al., 2006).
The three clones investigated show 36, 33, and 45% differences between mRNA concentration and mRNA number noise for I, II, and III, respectively. We conclude that functional mRNA noise differs greatly from mRNA number noise, indicating the importance of measuring mRNA noise in terms of concentrations. For inducible or cell cycle–dependent promoters, the assessment of mRNA concentration noise is even more relevant. For such systems, a nonlinear relation between volume growth and mRNA synthesis is expected. This would introduce much larger differences between the mRNA number and mRNA concentration noise than reported in this study, which is limited to a constitutive promoter.
Real-time monitoring of mRNA number (e.g., by using MS2 labeling; Fusco et al., 2003) and volume growth of single cells for a set of (classical) constitutive or inducible promoters could provide more information about the origins and effects of the volume-scaling relations of the mean and variance of the transcript numbers. A downside is that such studies would require the tracking of several hundred cell divisions to obtain robust statistics on the volume dependencies of mRNA number statistics. To attain robust statistics in our experiments, we used a confocal microscopy setup and had to study roughly 1000 cells per cell clone.
Single-molecule methods are a great addition to single-cell biology. They are quantitative and exact, as they give insight into the actual molecular composition of individual cells. In addition, they directly relate to stochastic theory and model predictions, giving deep insight into how cells exploit the inherent stochasticity of molecular processes to diversify isogenic populations. In this study, we have shown that, in order to profit fully from the exactness of single-molecule methods in cell biology, these methods should ideally be combined with single-cell volume measurements. This finding is highly relevant, because concentration noise captures biological noise.
MATERIALS AND METHODS
Cell clones and cell culture
Experiments were performed on human embryonic kidney cells (HEK293) with a single integration of a phosphoglycerate kinase (PGK)-driven GFP gene construct obtained from Gierman et al. (2007). We analyzed three different clones with the integration at different genomic locations: clone I (HG19:chr1:225684028, within the ENAH gene), clone II (HG19:chr1:150379508, within the RPRD2 gene), and clone III (HG19:chr1:150664232, within the GOLPH3L gene). The cells were cultured in DMEM (31965023; Life Technologies, Carlsbad, CA) supplemented with 10% (vol/vol) fetal calf serum (16140; Life Technologies) and 100 U/ml penicillin–streptomycin (15140; Life Technologies). Incubation was at 37°C in a humidified 5% CO2 atmosphere. Before any experiments, the cells were grown for at least 2 wk after thawing to achieve steady-state cell growth and steady-state expression statistics for the integrated construct.
Single-molecule RNA FISH
Samples were treated according to the Protocol for Adherent Mammalian Cell Lines for the Custom Stellaris FISH probes. Cells were cultured for 3 h in Lab-Tek chambered coverglasses (155380; Lab-Tek, Waltham, MA) before fixation. EtOH permeabilization was done overnight at 4°C. For hybridization, we used a 125-nM probe in the hybridization buffer and overnight incubation at 37°C. Imaging was done without using anti-fade. The cells were counterstained with 5 ng/ml DAPI. The sequence of the probe targeting the eGFP insertion can be found in Supplemental Information 7. The DNA probes were coupled to CAL Fluor Red 590 fluorophores by the manufacturer (Biosearch Technologies, Petaluma, CA).
Image acquisition
Samples were imaged using a Nikon Ti-E scanning-laser confocal inverted microscope (A1) with a 60× oil objective in combination with Nikon NIS-Elements imaging software. Excitation was by 561.5-nm diode-pumped solid-state and 402.1-nm diode lasers. Detection was via 595-50 nm and 450-50 nm band-pass filters. Optical sections were captured at 0.300-μm intervals and a resolution of 256 by 256 pixels and a zoom factor of 6.8, resulting in a voxel size of 0.0047 μm3 (0.1243 μm × 0.1243 μm × 0.3 μm). Averaging was used four times to reduce photon and camera noise.
Image analysis
Image analysis software was adapted from Raj et al. (2008). Images are filtered with a semi–three-dimensional Laplacian of Gaussian filter that removes noise and enhances the signal-to-noise ratio (filter width = 1.5). The number of mRNA spots was found by applying a threshold for which the number of mRNA was least sensitive to changes in this threshold. The threshold was determined by using a window function calculating the average spot numbers over 7 constitutive thresholds divided by the sum of the SD of these spot counts and a constant α (= 10; Itzkovitz et al., 2012). To measure the cell volume, we performed the following operations on all individual z-slices: 1) median filtering (20 × 20 pixels), 2) image thresholding (graythresh, Otsu's method; Otsu, 1979), 3) fill image regions and holes, and 4) morphological closing with a disk (radius = 4 pixels). The nuclear volume was obtained from the processed images of the DAPI channel (Supplemental Information 1). The cell volume is defined by the presence of signal from either the nucleus (DAPI), the cytoplasm (red channel), or both. The cytoplasmic size is given by the difference between nuclear and cell volume. The obtained pixel size was multiplied by the voxel size of 0.0047 μm3 to provide the cell size in cubic micrometers.
Supplementary Material
Acknowledgments
F.J.B. and P.J.V. acknowledge systems biology funding from the Science Faculty of the University of Amsterdam and funding from the Netherlands Dutch Research Organisation (NWO-VIDI 864.11.011 to F.J.B.; NWO-Meervoud 837.000.001 to P.J.V.). H.K., A.S., P.J.V., and F.J.B. thank the Netherlands Institute for Systems Biology and the Centre for Mathematics and Computer Science for funding. We thank the van Leeuwenhoek Center for Advanced Microscopy, Swammerdam Institute of Life Sciences, University of Amsterdam, for the use of their microscope facility and expertise; H. J. Gierman (Stanford University) and R. Versteeg (Amsterdam, AMC) for providing us with the cell clones; and B. van Steensel for providing the mCherry-LMNB construct. We thank Hans Westerhoff, Bas Teusink, Yves Bollen, Klaas Krab, Wouter Suring, Lisette Anink, and the members of the Synthetic Systems Biology and Nuclear Organization Group for critical discussions.
Abbreviations used:
- ANOVA
analysis of variance
- DAPI
4′,6-diamidino-2-phenylindole
- GFP
green fluorescent protein
- PGK
phosphoglycerate kinase.
Footnotes
This article was published online ahead of print in MBoC in Press (http://www.molbiolcell.org/cgi/doi/10.1091/mbc.E14-08-1296) on December 17, 2014.
REFERENCES
- Amir A, Kobiler O, Rokney A, Oppenheim AB, Stavans J. Noise in timing and precision of gene activities in a genetic cascade. Mol Syst Biol. 2007;3:71. doi: 10.1038/msb4100113. [DOI] [PMC free article] [PubMed] [Google Scholar]
- Becskei A, Kaufmann BB, van Oudenaarden A. Contributions of low molecule number and chromosomal positioning to stochastic gene expression. Nat Genet. 2005;37:937–944. doi: 10.1038/ng1616. [DOI] [PubMed] [Google Scholar]
- Boulineau S, Tostevin F, Kiviet DJ, ten Wolde PR, Nghe P, Tans SJ. Single-cell dynamics reveals sustained growth during diauxic shifts. PLoS One. 2013;8:e61686. doi: 10.1371/journal.pone.0061686. [DOI] [PMC free article] [PubMed] [Google Scholar]
- Cohen AA, Kalisky T, Mayo A, Geva-Zatorsky N, Danon T, Issaeva I, Kopito RB, Perzov N, Milo R, Sigal A, Alon U. Protein dynamics in individual human cells: experiment and theory. PLoS One. 2009;4:e4901. doi: 10.1371/journal.pone.0004901. [DOI] [PMC free article] [PubMed] [Google Scholar]
- Cookson NA, Cookson SW, Tsimring LS, Hasty J. Cell cycle-dependent variations in protein concentration. Nucleic Acids Res. 2010;38:2676–2681. doi: 10.1093/nar/gkp1069. [DOI] [PMC free article] [PubMed] [Google Scholar]
- Dar RD, Razooky BS, Singh A, Trimeloni TV, McCollum JM, Cox CD, Simpson ML, Weinberger LS. Transcriptional burst frequency and burst size are equally modulated across the human genome. Proc Natl Acad Sci USA. 2012;109:17454–17459. doi: 10.1073/pnas.1213530109. [DOI] [PMC free article] [PubMed] [Google Scholar]
- Di Talia S, Skotheim JM, Bean JM, Siggia ED, Cross FR. The effects of molecular noise and size control on variability in the budding yeast cell cycle. Nature. 2007;448:947–951. doi: 10.1038/nature06072. [DOI] [PubMed] [Google Scholar]
- Elowitz MB, Levine AJ, Siggia ED, Swain PS. Stochastic gene expression in a single cell. Science. 2002;297:1183–1186. doi: 10.1126/science.1070919. [DOI] [PubMed] [Google Scholar]
- Fusco D, Accornero N, Lavoie B, Shenoy SM, Blanchard JM, Singer RH, Bertrand E. Single mRNA molecules demonstrate probabilistic movement in living mammalian cells. Curr Biol. 2003;13:161–167. doi: 10.1016/s0960-9822(02)01436-7. [DOI] [PMC free article] [PubMed] [Google Scholar]
- Gierman HJ, Indemans MH, Koster J, Goetze S, Seppen J, Geerts D, van Driel R, Versteeg R. Domain-wide regulation of gene expression in the human genome. Genome Res. 2007;17:1286–1295. doi: 10.1101/gr.6276007. [DOI] [PMC free article] [PubMed] [Google Scholar]
- Golding I, Paulsson J, Zawilski SM, Cox EC. Real-time kinetics of gene activity in individual bacteria. Cell. 2005;123:1025–1036. doi: 10.1016/j.cell.2005.09.031. [DOI] [PubMed] [Google Scholar]
- Huh D, Paulsson J. Random partitioning of molecules at cell division. Proc Natl Acad Sci USA. 2011;108:15004–15009. doi: 10.1073/pnas.1013171108. [DOI] [PMC free article] [PubMed] [Google Scholar]
- Itzkovitz S, Blat IC, Jacks T, Clevers H, van Oudenaarden A. Optimality in the development of intestinal crypts. Cell. 2012;148:608–619. doi: 10.1016/j.cell.2011.12.025. [DOI] [PMC free article] [PubMed] [Google Scholar]
- Kaern M, Elston T, Blake W, Collins J. Stochasticity in gene expression: from theories to phenotypes. Nat Rev Genet. 2005;6:451–464. doi: 10.1038/nrg1615. [DOI] [PubMed] [Google Scholar]
- Otsu N. A threshold selection method from gray-level histograms. IEEE Trans Syst Man Cybern. 1979;9:62–66. [Google Scholar]
- Ozbudak EM, Thattai M, Kurtser I, Grossman AD, van Oudenaarden A. Regulation of noise in the expression of a single gene. Nat Genet. 2002;31:69–73. doi: 10.1038/ng869. [DOI] [PubMed] [Google Scholar]
- Paulsson J. Summing up the noise in gene networks. Nature. 2004;427:415–418. doi: 10.1038/nature02257. [DOI] [PubMed] [Google Scholar]
- Pedraza JM, Paulsson J. Effects of molecular memory and bursting on fluctuations in gene expression. Science. 2008;319:339–343. doi: 10.1126/science.1144331. [DOI] [PubMed] [Google Scholar]
- Raj A, Peskin CS, Tranchina D, Vargas DY, Tyagi S. Stochastic mRNA synthesis in mammalian cells. PLoS Biol. 2006;4:e309. doi: 10.1371/journal.pbio.0040309. [DOI] [PMC free article] [PubMed] [Google Scholar]
- Raj A, van den Bogaard P, Rifkin SA, van Oudenaarden A, Tyagi S. Imaging individual mRNA molecules using multiple singly labeled probes. Nat Methods. 2008;5:877–879. doi: 10.1038/nmeth.1253. [DOI] [PMC free article] [PubMed] [Google Scholar]
- Raj A, van Oudenaarden A. Nature, nurture, or chance: stochastic gene expression and its consequences. Cell. 2008;135:216–226. doi: 10.1016/j.cell.2008.09.050. [DOI] [PMC free article] [PubMed] [Google Scholar]
- Rosenfeld N, Young JW, Alon U, Swain PS, Elowitz MB. Gene regulation at the single-cell level. Science. 2005;307:1962–1965. doi: 10.1126/science.1106914. [DOI] [PubMed] [Google Scholar]
- Rowe M, Glaunsinger B, van Leeuwen D, Zuo J, Sweetman D, Ganem D, Middeldorp J, Wiertz EJ, Ressing ME. Host shutoff during productive Epstein-Barr virus infection is mediated by bglf5 and may contribute to immune evasion. Proc Natl Acad Sci USA. 2007;104:3366–3371. doi: 10.1073/pnas.0611128104. [DOI] [PMC free article] [PubMed] [Google Scholar]
- Sigal A, Milo R, Cohen A, Geva-Zatorsky N, Klein Y, Liron Y, Rosenfeld N, Danon T, Perzov N, Alon U. Variability and memory of protein levels in human cells. Nature. 2006;444:643–646. doi: 10.1038/nature05316. [DOI] [PubMed] [Google Scholar]
- Spencer SL, Gaudet S, Albeck JG, Burke JM, Sorger PK. Nongenetic origins of cell-to-cell variability in TRAIL-induced apoptosis. Nature. 2009;459:428–432. doi: 10.1038/nature08012. [DOI] [PMC free article] [PubMed] [Google Scholar]
- Suter DM, Molina N, Gatfield D, Schneider K, Schibler U, Naef F. Mammalian genes are transcribed with widely different bursting kinetics. Science. 2011;332:472–474. doi: 10.1126/science.1198817. [DOI] [PubMed] [Google Scholar]
- Swain PS, Elowitz MB, Siggia ED. Intrinsic and extrinsic contributions to stochasticity in gene expression. Proc Natl Acad Sci USA. 2002;99:12795–12800. doi: 10.1073/pnas.162041399. [DOI] [PMC free article] [PubMed] [Google Scholar]
- Thattai M, van Oudenaarden A. Intrinsic noise in gene regulatory networks. Proc Natl Acad Sci USA. 2001;98:8614–8619. doi: 10.1073/pnas.151588598. [DOI] [PMC free article] [PubMed] [Google Scholar]
- Tzur A, Kafri R, LeBleu VS, Lahav G, Kirschner MW. Cell growth and size homeostasis in proliferating animal cells. Science. 2009;325:167–171. doi: 10.1126/science.1174294. [DOI] [PMC free article] [PubMed] [Google Scholar]
- Veening JW, Hamoen LW, Kuipers OP. Phosphatases modulate the bistable sporulation gene expression pattern in Bacillus subtilis. Mol Microbiol. 2005;56:1481–1494. doi: 10.1111/j.1365-2958.2005.04659.x. [DOI] [PubMed] [Google Scholar]
- Viñuelas J, Kaneko G, Coulon A, Beslon G, Gandrillon O. Towards experimental manipulation of stochasticity in gene expression. Prog Biophys Mol Biol. 2012;110:44–53. doi: 10.1016/j.pbiomolbio.2012.04.010. [DOI] [PubMed] [Google Scholar]
- Wernet MF, Mazzoni EO, Celik A, Duncan DM, Duncan I, Desplan C. Stochastic spineless expression creates the retinal mosaic for colour vision. Nature. 2006;440:174–180. doi: 10.1038/nature04615. [DOI] [PMC free article] [PubMed] [Google Scholar]
- Youk H, Raj A, van Oudenaarden A. Imaging single mRNA molecules in yeast. Methods Enzymol. 2010;470:429–446. doi: 10.1016/S0076-6879(10)70017-3. [DOI] [PubMed] [Google Scholar]
- Yu J, Xiao J, Ren X, Lao K, Xie XS. Probing gene expression in live cells, one protein molecule at a time. Science. 2006;311:1600–1603. doi: 10.1126/science.1119623. [DOI] [PubMed] [Google Scholar]
- Zenklusen D, Larson DR, Singer RH. Single-RNA counting reveals alternative modes of gene expression in yeast. Nat Struct Mol Biol. 2008;15:1263–1271. doi: 10.1038/nsmb.1514. [DOI] [PMC free article] [PubMed] [Google Scholar]
- Zhurinsky J, Leonhard K, Watt S, Marguerat S, Bähler J, Nurse P. A coordinated global control over cellular transcription. Curr Biol. 2010;20:2010–2015. doi: 10.1016/j.cub.2010.10.002. [DOI] [PubMed] [Google Scholar]
Associated Data
This section collects any data citations, data availability statements, or supplementary materials included in this article.