Abstract
During plant growth, dividing cells in meristems must coordinate transitions from division to expansion and differentiation, thus generating three distinct developmental zones: the meristem, elongation zone and differentiation zone1. Simultaneously, plants display tropisms, rapid adjustments of their direction of growth to adapt to environmental conditions. It is unclear how stable zonation is maintained during transient adjustments in growth direction. In Arabidopsis roots, many aspects of zonation are controlled by the phytohormone auxin and auxin-induced PLETHORA (PLT) transcription factors, both of which display a graded distribution with a maximum near the root tip2-12. In addition, auxin is also pivotal for tropic responses13,14. Here, using an iterative experimental and computational approach, we show how an interplay between auxin and PLTs controls zonation and gravitropism. We find that the PLT gradient is not a direct, proportionate readout of the auxin gradient. Rather, prolonged high auxin levels generate a narrow PLT transcription domain from which a gradient of PLT protein is subsequently generated through slow growth dilution and cell-to-cell movement. The resulting PLT levels define the location of developmental zones. In addition to slowly promoting PLT transcription, auxin also rapidly influences division, expansion and differentiation rates. We demonstrate how this specific regulatory design in which auxin cooperates with PLTs through different mechanisms and on different timescales enables both the fast tropic environmental responses and stable zonation dynamics necessary for coordinated cell differentiation.
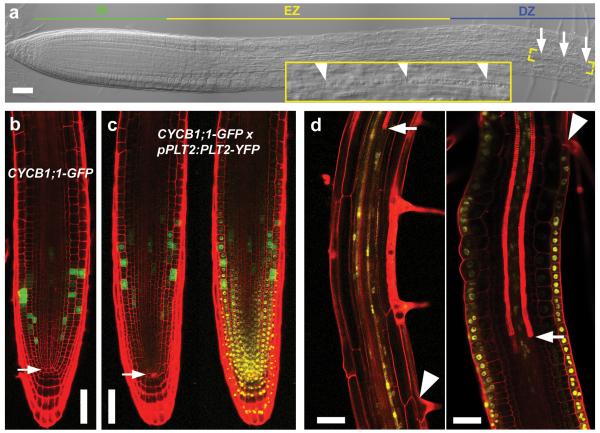
We have previously shown that four PLT transcription factors with graded distribution (PLT1, PLT2, PLT3 and BBM (also known as PLT4)) are necessary for stem cell maintenance and cell division in the root8,9. Furthermore, correlation of PLT protein levels with the developmental transitions that define root zonation (Fig. 1a) suggests a dosage-dependent control by PLTs9. However, two issues remain unresolved.
Figure 1. PLT levels define zonation boundaries.
a, Zonation of 4-day-old wild-type root. Arrows and arrowheads indicate youngest protoxylem cell. b, c, Frequent cell division, monitored by the G2/M-phase cell cycle marker CYCB1;1–GFP, occurs close to the quiescent centre (arrow) in wild-type meristem (b). This domain shifts shootward with increased PLT2 dosage (that is, homozygote pPLT2:PLT2-YFP in Col background; green and green/yellow channels shown) (c). d, Twenty-four hours induction of PLT2–YFP in the vascular tissue (left) locally inhibits xylem differentiation (arrow, first xylem element), while PLT2–YFP induction in epidermis (right) inhibits root hair formation (arrowhead, first root hair). Propidium iodide highlights cell wall and protoxylem in b–d. Scale bars, 50 μm.
First, the precise relationship between PLT dosage and the location and size of the stem cell domain has not been established. Therefore, we investigated whether different PLT levels mediate the distinction between slowly dividing stem cells and fast dividing transit amplifying cells. The addition of extra copies of PLT2 led to an enlarged meristem and shootward shift of the high-division-rate domain (Fig. 1b, c and Extended Data Fig. 1a, b), indicating that the highest dose of PLT2 slows down division rates as observed in the stem cell niche, while medium levels trigger high division rates shootward from the stem cell region.
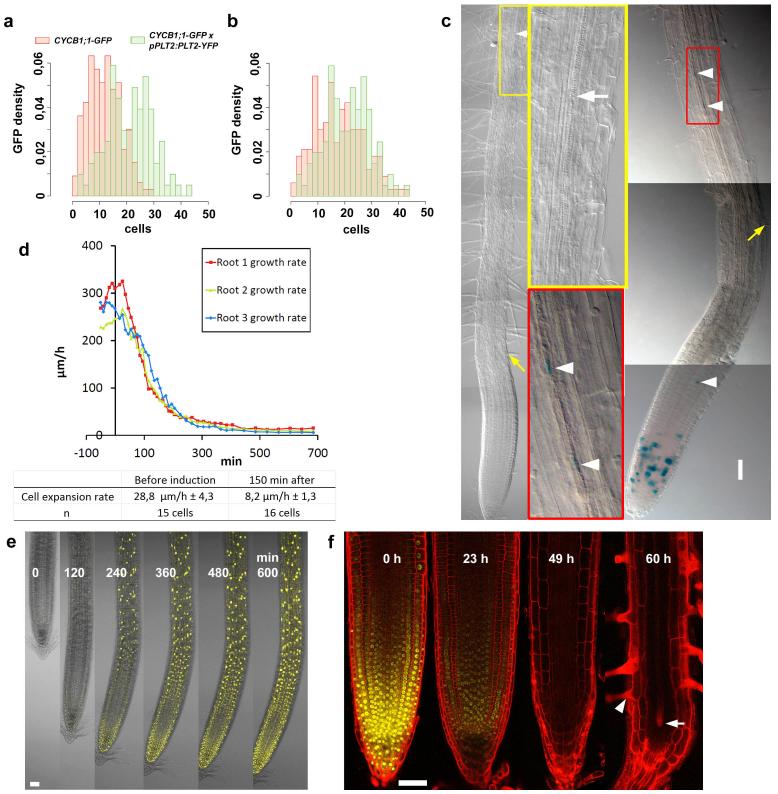
Second, it remained to be established whether, similar to stem cell factors in the animal kingdom, PLT transcription factors repress differentiation. In that case, expression of PLT2 in one cell type should be sufficient to block differentiation locally while allowing differentiation of other cell types. To test this, we induced yellow fluorescent protein (YFP)-tagged PLT2 using either a protoxylem and the associated pericycle-specific promoter pAHP6 (ref. 15) or an epidermal/lateral root cap promoter pWER16. pAHP6:XVE>>PLT2-YFP induction inhibited protoxylem differentiation and caused local ectopic cell proliferation while root hair differentiation proceeded normally. Reciprocally, pWER:XVE>>PLT2-YFP induction triggered local inhibition of root hair differentiation and ectopic cell division while protoxylem differentiation proceeded normally (Fig. 1d and Extended Data Fig. 1c). Furthermore, induction of PLT2 inhibited cell expansion, which is generally considered to be an early step in cell differentiation. The speed at which PLTs control expansion suggests that the decline in PLT levels along the gradient determines the transition to differentiation (Supplementary Notes and Extended Data Fig. 1d, e). Finally, we tested whether this differentiation threshold was imposed also by physiologically relevant PLT concentrations. Reduction of PLT2 by inducible RNA interference (RNAi) in the plt1,3,4 mutant, which solely depends on PLT2 to form functional meristems9, indeed triggered meristem cell expansion and differentiation (Extended Data Fig. 1f). Taken together, our results show that the PLT protein gradient shape defines the location of at least two boundaries: the boundary between slowly and rapidly cycling cells, and the shootward boundary of the meristem.
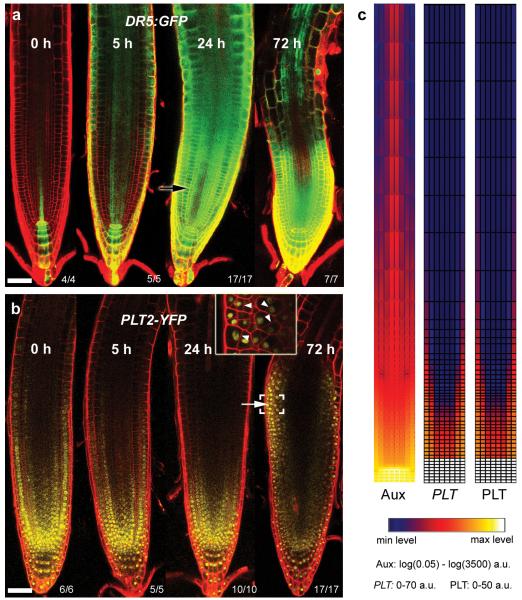
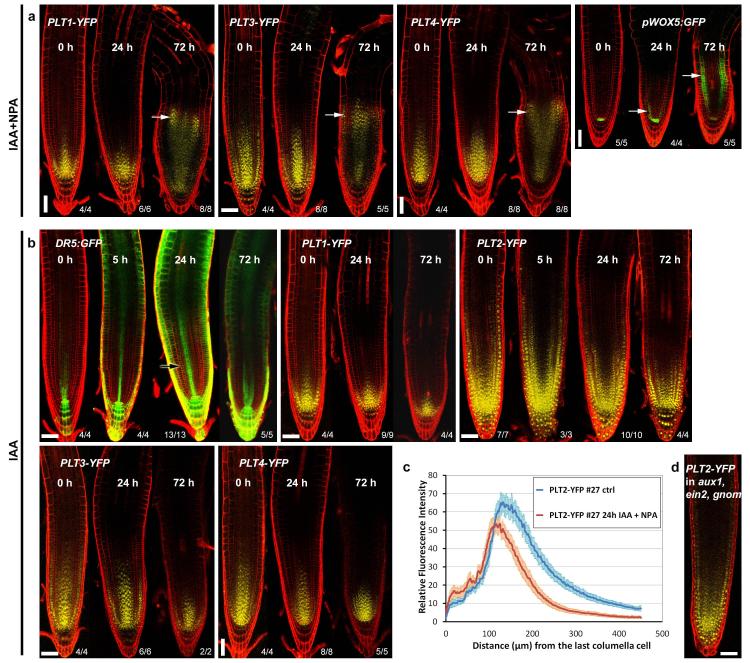
PLT gradients have been considered to be generated at the transcriptional level, based on the similarity of transcriptional and translational PLT–fluorescent protein fusion gradients9. PLT transcription requires AUXIN RESPONSE FACTORs (ARFs)8,12, and since auxin is also present in a graded pattern4,5, it was postulated that the PLT gradient may be a readout of the auxin gradient. To study in detail how PLT protein gradients are defined, we first investigated the timescale and levels at which PLT expression is controlled by auxin. Prolonged auxin (indole acetic acid, (IAA)) treatment rapidly induced the auxin response marker DR5:GFP17, especially when combined with the auxin transport inhibitor, 1-N-Naphthylphthalamic acid (NPA), but the expression domain of PLTs failed to expand rapidly (Fig. 2a, b and Extended Data Fig. 2a–c). Only after prolonged IAA plus NPA treatment (24–72 h) did expression of PLT–YFPs and the quiescent centre stem cell organizer marker pWOX5:GFP shift shootward, mostly in the meristematic ground tissue (Fig. 2b and Extended Data Fig. 2a–c). This was associated with morphological changes, suggesting that the new PLT expression domain correlated with cell fate changes similar to those described for prolonged NPA treatment3. Our experiments thus indicated that PLT induction requires prolonged high auxin levels. To test the implications of these findings, we developed a simulation model of root zonation. The model incorporates a description of root tissue architecture, a generalized PLT–ARF gene regulatory network, root PIN-FORMED (PIN) protein patterns governing auxin transport, and cell growth, division, expansion and differentiation. The resulting model (‘initial’ model; see Supplementary Notes, Supplementary Methods and Extended Data Fig. 3) predicts a PLT gradient with shorter range due to its dependence on high auxin levels, in disagreement with experimental observations (Fig. 2c, Supplementary Video 1 and Extended Data Fig. 4). Moreover, aux1,ein2,gnom triple mutants, which display a more shallow auxin gradient along the root tip as inferred from direct auxin and auxin response measurements18, nevertheless possess a normal range PLT2–YFP gradient (Extended Data Fig. 2d). Together, this demonstrates that the PLT protein gradient is not a direct readout of the auxin gradient.
Figure 2. The PLT2 gradient is not a fast readout of the auxin gradient.
a, b, Four-day-old seedlings transferred to agar plates containing 20 μM NPA plus 5 μM IAA for the indicated times. Auxin response reporter DR5:erGFP (a) rapidly responds to treatment whereas pPLT2:PLT2-YFP (b) accumulates later (white arrow), associated with repatterning (inset in b, magnified image of bracketed region with altered cell division planes at arrowheads). Black arrow indicates fluorescent region after NPA plus IAA treatment (a), but not after IAA treatment (Extended Data Fig. 2b). Observed phenotypes/number of roots analysed is indicated in the right bottom corners. c, Failure of PLT gradient formation in the initial model. Snapshots of auxin (Aux), PLT transcription (PLT) and PLT protein (PLT) profiles under steady-state root growth dynamics are displayed. a.u., arbitrary units. Scale bars, 50 μm.
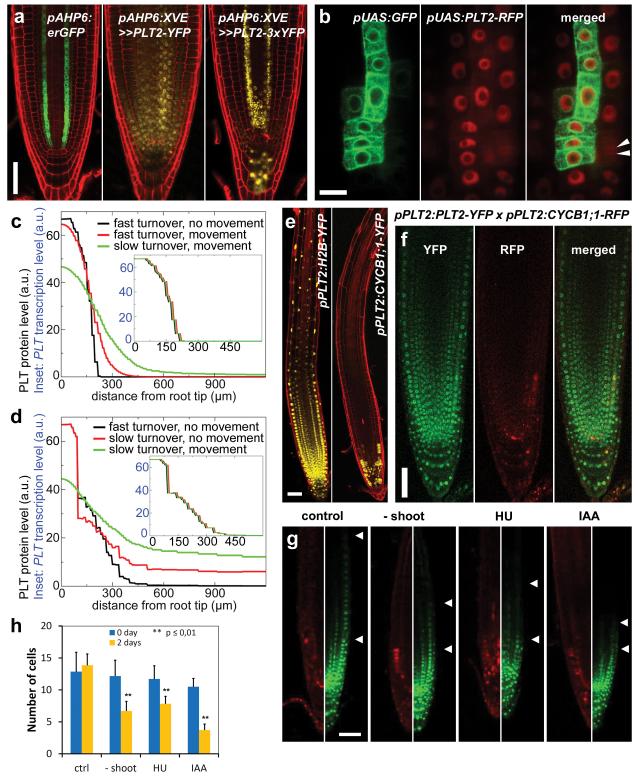
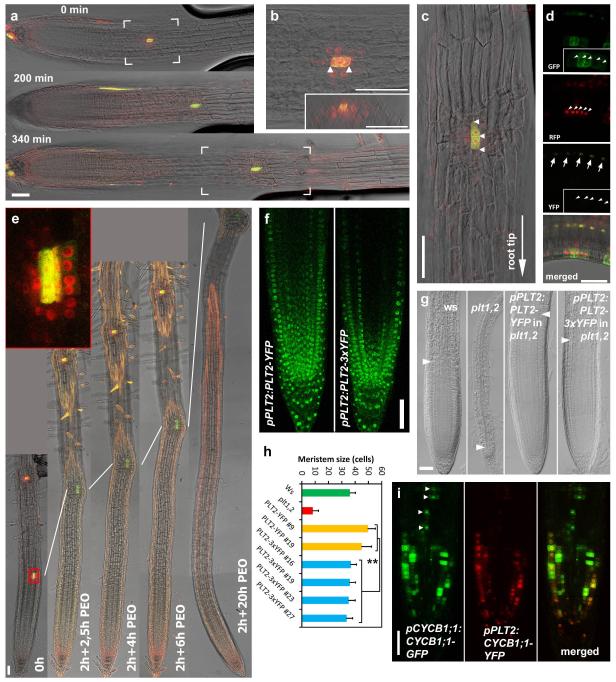
We investigated how the experimentally observed long PLT protein gradient could arise despite the narrow, non-graded expression domain predicted by our model. One potential explanation emerged when we noticed that PLT2–YFP expression in pAHP6:XVE>>PLT2-YFP lines did not only appear in the narrow AHP6 transcription domain (erGFP in Fig. 3a), but also in the neighbouring cells (PLT2–YFP in Fig. 3a), suggesting that the protein might influence gradient shape by acting as a mobile plant transcription factor (for a review of this topic, see ref. 19). To ascertain this, we introduced red fluorescent protein (RFP)-tagged PLT2 into a clonal activation system20 and generated small clones of PLT2–RFP-expressing cells in the meristem. After induction, PLT2–RFP not only resided in clones (marked with green fluorescence) but also in 1–2 cells surrounding the clones (Fig. 3b). When the clones entered the elongation zone, the cells in the clone and the adjacent PLT2–RFP cells remained meristematic and failed to expand (n = 7), while cells shootward and rootward from the clone ceased cell division and expanded (Extended Data Fig. 5a–e and Fig. 3b). These data demonstrate that either PLT2 protein or PLT2 transcript moves to the adjacent cells, yielding translocated functional PLT2–RFP. In addition, the clonal data demonstrate that the inhibition of cell expansion is not the result of a community effect, in which cells in a larger longitudinal region collectively determine whether to expand, but an effect of local PLT levels within the cell file. Fusion of three copies of YFP to PLT2 significantly constrained intercellular movement (Fig. 3a), and when PLT2–3×YFP was expressed under the PLT2 promoter it complemented the stem cell defect of plt1,2, but led to a shorter meristem than when PLT2–YFP was used, indicating that PLT cell-to-cell movement contributes to meristem size (Supplementary Notes and Extended Data Fig. 5f–h).
Figure 3. Gradient formation by PLT2 cell-to-cell movement and mitotic segregation.
a, AHP6 promoter-erGFP fusion is consistently active in two vascular strands (and occasionally in columella). PLT2-YFP driven under inducible AHP6 promoter spreads from its transcription domain, especially in the stem cell region, whereas the movement-deficient version, PLT2-3×YFP, is predominantly confined to the AHP6 transcription domain, although weak signal resides in the stem cell region and between the two vascular strands. b, PLT2–RFP moves from clone (marked with GFP) to neighbouring cells. Arrowheads indicate recently divided nuclei. c, d, Influence of PLT cell-to-cell movement and turnover dynamics on vascular PLT protein profiles (main graph) and transcription profiles (inset) in the initial model in the absence (c) or presence (d) of growth. e, The stability of reporter protein fusion determines the expression pattern driven by the PLT2 promoter. Stable H2B–YFP extends into the differentiation zone, whereas labile CYCB1;1–YFP is confined to the meristem. f, PLT2 transcription is in proximal meristem only (red), whereas PLT2 protein (green) resides in the whole meristem. g, h, Division inhibition by shoot removal (‘No shoot’), HU and IAA treatments shorten PLT2–3×YFP gradient. The number of visible YFP-only cells between two arrowheads in g are presented in h. Ctrl, control. n = 7 roots for all treatments, except 6 roots for IAA. Error bars show standard deviation (s.d.). **P ≤ 0.01, two-way ANOVA with Bonferroni correction. Scale bars, 50 μm, except in b, 10 μm.
We next performed simulations to analyse how cell-to-cell movement contributed to the PLT gradient. We first simulated PLT movement in the absence of growth and found that, for effective movement, PLT proteins needed to have slow turnover dynamics (Fig. 3c, simulated half-life of ~16 h; see Supplementary Notes and Supplementary Methods). Next, we reinstated root growth. Interestingly, the model predicted that slow PLT turnover in itself substantially contributes to the spread of PLT protein through growth dilution (Fig. 3d).
These new data and previous findings21 about a regulator of PLT stability highlight a role for protein stability in gradient formation. The previously reported similarity between translational and transcriptional reporter fusion gradients9 may therefore rather be explained by similar stability of the PLT proteins fused to fluorescence reporters or reporters on their own. To test the influence of protein stability on gradient formation, we used stable and labile proteins fused to the YFP reporter. Histone 2B (H2B), a component of nucleosomes, was used as a stabilizing protein tag, while CYCB1;1, which is degraded from anaphase to S phase22 in rapidly dividing meristem cells, was employed as a labile protein tag. When driven by the PLT2 promoter, H2B–YFP displayed fluorescence well into the differentiation zone with a shallow gradient, whereas CYCB1;1–YFP was only present in a punctuate pattern close to the stem cell niche (Fig. 3e). Our data imply that PLT genes are transcribed proximal to the stem cell niche, in line with our model predictions, and that retention of PLT proteins in more shootward cells depends critically on their stability. By crossing pPLT2:CYCB1;1-RFP with pPLT2:PLT2-YFP, we estimated that the PLT2 transcription domain encompasses approximately one-third of the visible PLT2 protein gradient (Fig. 3f). A subset of the cells in the remaining two-thirds of the PLT2 gradient underwent mitosis, indicating that cells containing PLT2 protein but not transcribing PLT2 themselves are still capable of dividing (Supplementary Notes and Extended Data Fig. 5i). Our modelling predicted that besides cell-to-cell movement, growth dilution of PLT2 by cell division also has a role in the formation of the gradient. To test this, we blocked cell division using IAA (Supplementary Notes), hydroxyurea (HU)23 or by removing the shoot4 in pPLT2:CYCB1;1-RFP × pPLT2:PLT2–3×YFP double reporter lines. We discovered that while the PLT2 transcription domain remained essentially unaltered, the domain only containing PLT2–3×YFP protein was reduced (Fig. 3g, h), confirming a role for growth dilution in gradient formation.
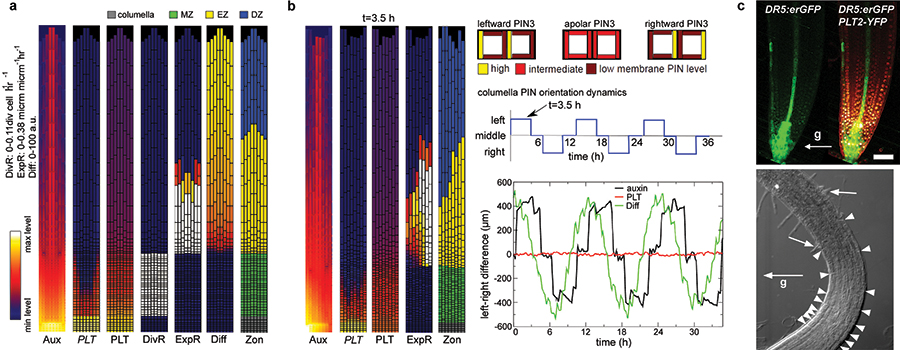
In our simulation model, the incorporation of both root growth and PLT intercellular movement with realistic parameter values was necessary to generate a smooth PLT gradient capable of dosage-dependent control of root zonation similar to our experimental observations (Fig. 4a and Supplementary Video 2). Interestingly, a similar gradient-forming mechanism functions in vertebrate axial patterning. There, polarized growth creates a gradient of stable FGF8 messenger RNA, with diffusion-mediated spread of the FGF8 protein smoothing and further extending the protein gradient24, and FGF8 itself controlling the growth process25. This regulatory architecture, in which growth controls gradient formation and gradient formation controls growth, has been suggested as a robust means to coordinate growth and patterning in polar growing tissues26, possibly explaining why it evolved independently in both plants and animals.
Figure 4. Root zonation under normal growth and gravitropism.
a, Zonation dynamics in the PLT-spread model under normal growth conditions. Snapshots of the auxin distribution (Aux), PLT transcription (PLT), PLT protein (PLT), division rate (DivR, measured as number of divisions per cell per hour), cell expansion rate (ExpR, measured as growth (μm) per unit tissue (μm) per hour), differentiation level (Diff) and zonation dynamics (Zon) profiles. b, Root zonation dynamics in the gravitropism model under dynamic gravitropism. Left, snapshots of auxin, PLT transcription, PLT protein, expansion rate and zonation for leftward oriented gravity vector. (For downward and rightward oriented gravity vector see Extended Data Fig. 9a.) Right, dynamics of left–right differences in auxin, differentiation level and PLT protein distribution. Depicted are the used columella PIN orientation patterns, the applied 12 h cycle of PIN orientation changes, and the resulting auxin, differentiation level and PLT left–right distribution differences (see Supplementary Methods).‘t’ indicates the time point at which the snapshot was taken. c, DR5 and PLT expression in the same root (top) after gravitropic stimulation resulting in left–right difference in appearance of the first root hair (bottom). Arrows with ‘g’, gravity vector; white arrowheads, individual cells in the elongation zone; white arrows, youngest root hairs. Scale bar, 50 μm.
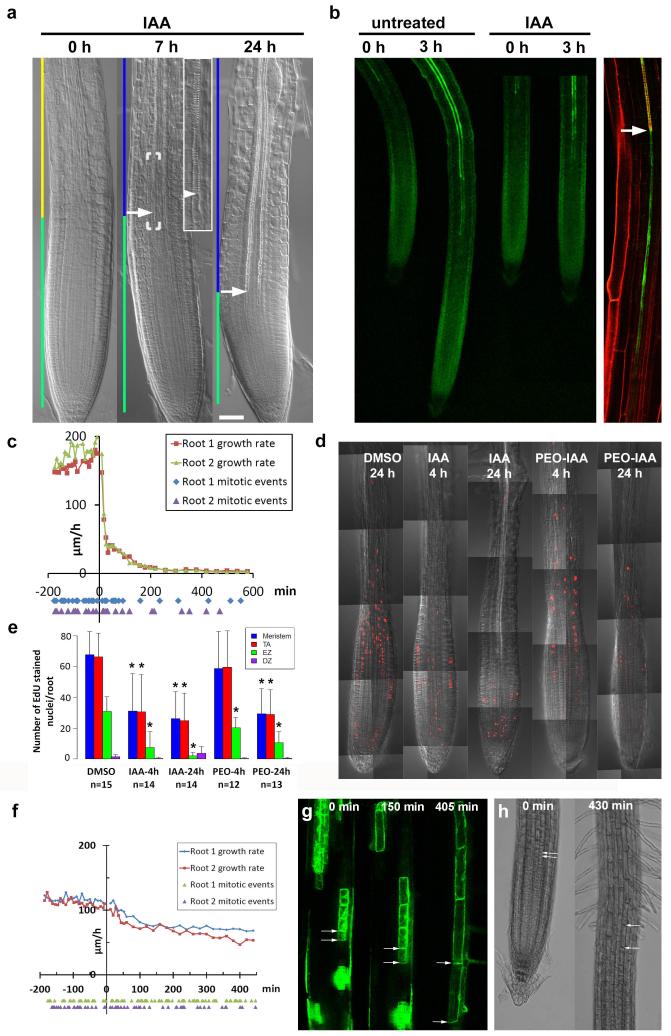
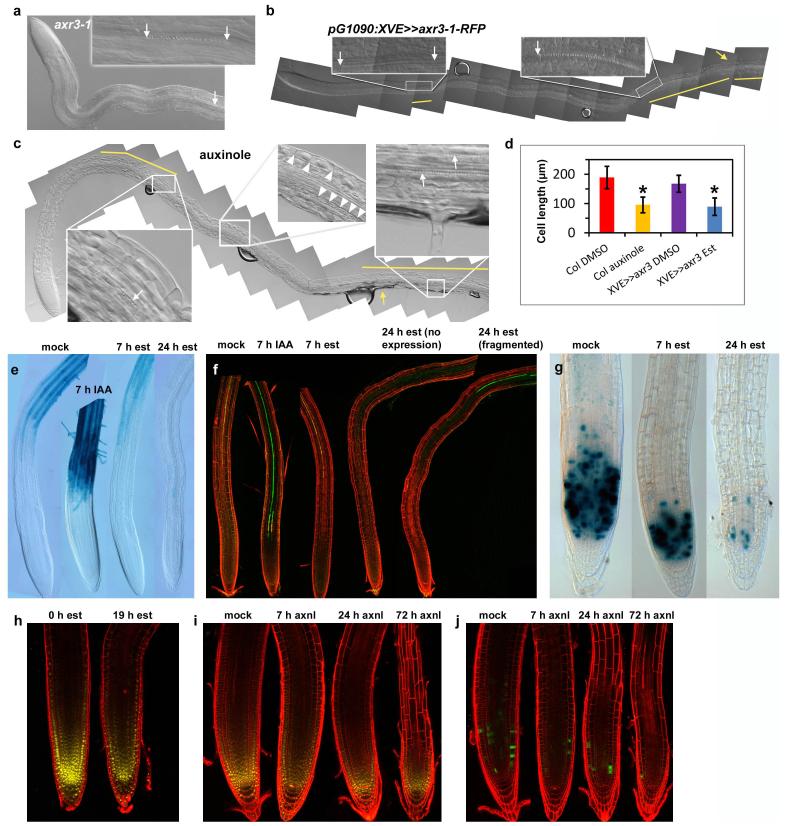
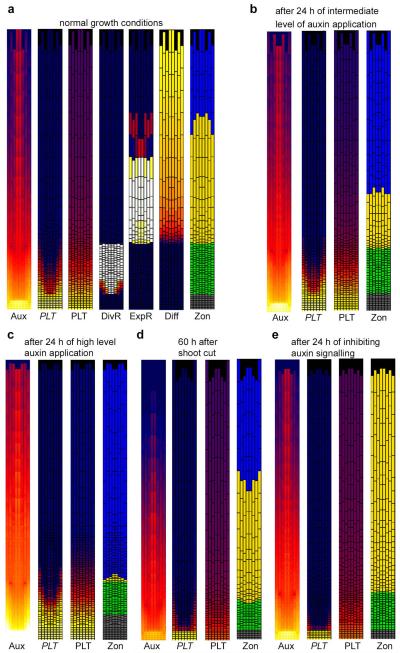
Previous studies have suggested roles for auxin in cell division, expansion and differentiation. However, the role of auxin in these processes could only be indirect, through regulation of PLT levels. To test this hypothesis, we next investigated whether there is also a direct role for auxin in controlling root zonation dynamics. To focus on direct effects of auxin, we considered short timescales insufficient to lead to changes in PLT expression. Auxin addition, application of the auxin antagonist auxinole27, and inhibition of auxin signalling by inducing the stable ARF-signalling repressor axr3-1 (ref. 28) experiments all confirmed that auxin rapidly regulates all zonation processes. Cell division and expansion rates depended on optimum auxin levels, with different thresholds, whereas differentiation required a minimum level of auxin (see Supplementary Notes, Supplementary Videos 3, 4 and Extended Data Fig. 6, 7). Our computational model could readily be extended with these auxin-dependent rates (‘auxin model’), reproducing both normal zonation and the experiments described earlier (see Supplementary Notes, Supplementary Methods and Extended Data Fig. 8).
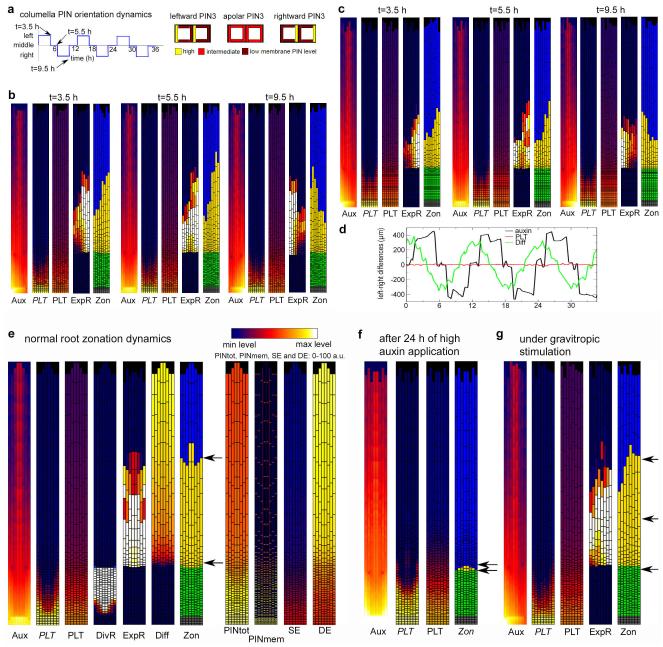
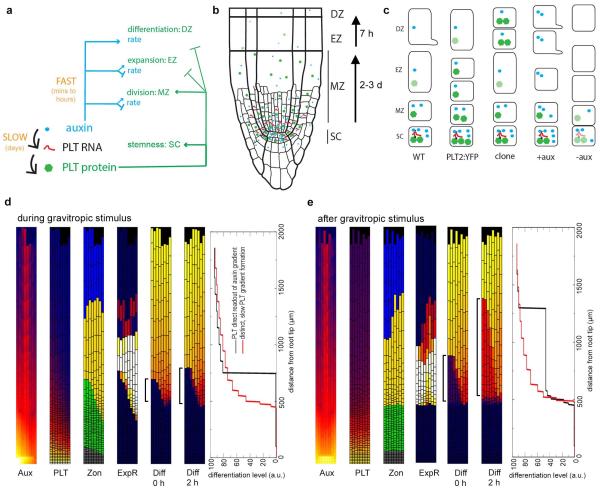
Thus, our study uncovered a regulatory architecture in which auxin: (1) rapidly influences rates of developmental processes within zones without directly affecting PLT levels (minutes to hours timescale); and (2) influences the size and location of differentiation zones slowly through regulating PLT transcription (timescale of days). A subtle coupling between these processes occurs because auxin influences PLT growth dilution through division and expansion rates (timescale of hours) and hence the location of the division and expansion thresholds (Extended Data Figs 2c, 6a, 8c, Supplementary Notes and Supplementary Methods). The coexistence of slow, PLT-mediated and rapid, direct auxin effects on zonation made us wonder why such an elaborate control system has evolved. To investigate this, we analysed gravitropism, an auxin-mediated process operating at a faster timescale than the generation of the PLT gradient. Gravity stimuli drive PIN protein reorientation-mediated asymmetric auxin accumulation on the lower side of the root within 5 min (refs 13, 14), causing inhibition of cell expansion, and bending of the root towards the new gravity vector within 6 h (refs 13, 14) (Fig. 4c). When PIN protein reorientation caused by alternating gravitropic stimuli was simulated in our model (‘gravitropism model’, Fig. 4b), elevated auxin levels alternated from left to right in the root and induced the differential expansion that drives root bending, while PLT levels stayed constant (Fig. 4b, Supplementary Video 5 and Extended Data Fig. 9a–d). The predicted constant PLT levels were confirmed experimentally (Fig. 4c). Thus, this regulatory design allows for a partial separation of timescales that enables rapid auxin-mediated tropic responses, essential for sessile plants to respond to environmental challenges, while maintaining stable PLT-mediated developmental zonation (Extended Data Fig. 10a–c and Supplementary Discussion). If, in contrast, as was previously thought, PLT expression were a relatively direct and proportionate readout of auxin levels, both auxin and PLT patterns would fluctuate under tropisms, resulting in variable zonation patterns and loss of coordinated differentiation (Extended Data Fig. 10d, e and Supplementary Discussion).
We uncover the auxin–PLT network as a core module on which other factors, such as other phytohormones (for a review, see ref. 29), can act to regulate growth. Our study prompts two directions for future exploration. First, recently uncovered positive feedbacks from PLT back to auxin biosynthesis and transport9,10,30 do not notablyaffect the behaviour of our model (Extended Data Fig. 9e–g). We speculate that these feedbacks may have a role only during the generation of new primordia, when robust, localized auxin and PLT maxima need to be established. Second, the dominant role of PLT gradients in controlling zonation dynamics challenges the role of an auxin gradient as a dose-dependent instructive signal. Indeed, recent studies suggest that the auxin profile may not be a simple gradient6,11. While our results support a role for auxin levels in zonation, they leave undecided whether a specific gradient-shaped auxin distribution is required.
Extended Data
Extended Data Figure 1. PLTs are dose-dependent drivers of zonation.
a, b, The domain of frequent cell division, monitored by cell cycle marker CYCB1;1–GFP in Fig. 1b, c, shifts shootward with increased PLT2 dosage (that is, homozygote pPLT2:PLT2-YFP in Col background). Histogram in a shows the distribution of the CYCB1;1–GFP-positive cells along the meristem at a given distance from the quiescent centre. x-Axis indicates the distance from the quiescent centre as number of cortical cells, and y-axis label ‘GFP density’ refers to the proportion of CYCB1;1–GFP-containing cells at the given distance from the quiescent centre. Shootward shift of the distance of the cell division events in the presence of increased PLT2 (green histogram) dosage compared to wild-type (red histogram) is significant (t-test for mean P << 0.001, Wilcoxon test for median P << 0.001, Kolmogorov–Smirnov for difference of distributions P << 0.001). b, Histogram presenting rescaled data to show that the distribution of the high cell division domain shifted shootward when PLT2 dosage was increased. A null hypothesis was that shootward shift is due to higher dispersion of the distribution observed under increased PLT2 dosage. To test this hypothesis, the control CYCB1;1–GFP data were rescaled to match the maximum values of PLT2 data. The null hypothesis was rejected (t-test P = 0.001, Wilcoxon test P = 0.0012, Kolmogorov–Smirnov P = 0.0026), indicating that the shootward shift of the high division domain in the presence of increased PLT2 dosage is significant, and not due to dispersion. The bin width in histograms is two cells (that is, 1st bar, 1 and 2 cells; 2nd, 3 and 4, and so on). c, Induction of pAHP6:XVE>>PLT2-YFP inhibits xylem differentiation (left) (white arrow indicates the first protoxylem element) and triggers ectopic cell divisions illustrated by CYCB1;1–GUS activity (right) (arrowheads), whereas root hairs develop normally (yellow arrows). Insets show magnifications from the designated areas. d, PLT2–YFP induction (t = 0) rapidly inhibits root growth (top) and cell expansion (bottom) in three roots. Expansion rates as shown as averages ± s.d. e, Inhibition of growth coincides with appearance of PLT2–YFP signal after induction. f, Induction of PLT2 RNAi (in plt1,3,4; pPLT2:PLT2-YFP) abolishes the PLT2–YFP signal by 49 h and consequently promotes expansion and differentiation of the meristem cells, as indicated by the appearance of expanded cells as well as protoxylem (arrow) and root hairs (arrowhead) in the meristem. Images from the same root using identical confocal microscopy settings for the yellow channel. Scale bars, 50 μm.
Extended Data Figure 2. PLT expression patterns respond only to long-term auxin accumulation in the meristem.
a, PLT expression shifts shootward only when prolonged auxin application is accompanied with polar auxin transport inhibitor (NPA) treatment. Four-day-old seedlings were transferred to an agar plate containing 20 μM NPA plus 5 μM IAA for the time periods indicated in the images. The expression of pPLT1:PLT1-YFP, pPLT3:PLT3-YFP and pPLT4:PLT4-YFP spreads shootward (white arrows) by 72 h of NPA plus IAA treatment. b, PLT expression patterns are insensitive for auxin-only treatments. Four-day-old seedlings were transferred to an agar plate containing 5 μM IAA for the time periods indicated in the images. The auxin response reporter DR5:erGFP rapidly responded to the treatment whereas the expression domains of pPLT1:PLT1-YFP, pPLT2:PLT2-YFP, pPLT3:PLT3-YFP and pPLT4:PLT4-YFP failed to expand. Black arrow indicates the region in meristem that is absent of DR5:erGFP fluorescence after IAA treatment but is filled with fluorescence after NPA plus IAA treatment (Fig. 2a). Observed phenotypes/number of roots analysed are indicated in the right bottom corners. c, Twenty-four hours of NPA plus IAA treatment fails to expand the PLT2–YFP gradient shootward. In fact, the treatment leads to transient shortening of the PLT2–YFP gradient, probably due to inhibition of growth dilution of PLT2–YFP in the meristematic cells (see Fig. 3g, h). P << 0.001, Kolmogorov–Smirnov test; error bars indicate 95% confidence intervals. n = 20 (dimethylsulphoxide (DMSO)) and 23 (NPA plus IAA). d, Graded pPLT2:PLT2-YFP expression despite shallow auxin gradient in aux1,ein2,gnom; representative image from three independent lines. Scale bars, 50 μm.
Extended Data Figure 3. Composition of the zonation model.
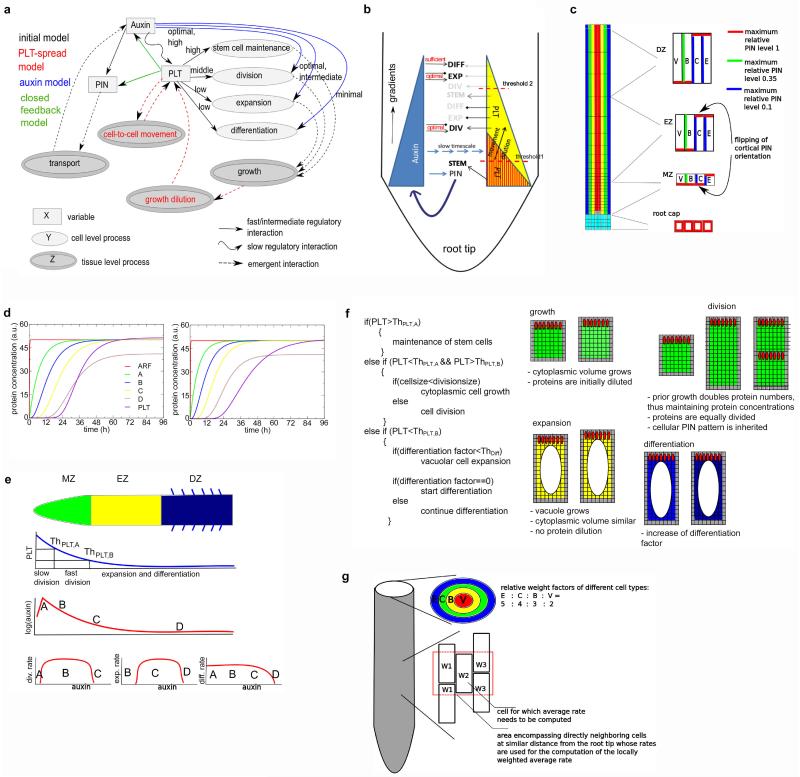
a, Overview of the initial, PLT-spread, auxin and closed feedback models. Relationships between model variables (grid-based auxin levels, cell-based PIN and PLT levels), growth processes (stem cell maintenance, division, expansion and differentiation), PIN-mediated auxin transport, cell-to-cell PLT movement and their emerging consequences for auxin and PLT levels are shown, with different colours indicating from which model onward they are incorporated (models are in order of increasing complexity). Variables are indicated in rectangles, processes are indicated in ovals. A distinction is made between cell-level and tissue-level processes. Direct regulatory interactions are indicated with arrows, and a distinction is made between fast to intermediate speed versus slow interactions, and between the levels of the ‘input’ variable needed for a particular process to occur. Emergent feedbacks, with processes influencing variable levels other than through a direct regulatory effect (for example, growth spreading PLT and hence influencing its levels) are indicated as dashed arrows. b, Spatially explicit overview of the interplay between the variables and processes and how these generate the auxin and PLT gradients and control root zonation dynamics in the auxin model. Stem cells and slow division (STEM), fast division (DIV), expansion (EXP) and differentiation (DIF) processes are indicated in black if the local auxin and PLT levels permit these processes, and in grey if the local auxin and PLT levels prevent these processes from occurring. Similarly, black arrows indicate that local auxin or PLT levels cause promotion or repression of a process, grey arrows indicate that auxin or PLT in principle has a particular effect on a process but that local levels do not allow for this effect to occur. Blue arrows indicate transcriptional effects. The broad dark blue arrow indicates PIN-mediated auxin transport. c, Layout of the root tissue and PIN distribution pattern used in the simulations. The simulated tissue contains columella cells (cyan), quiescent centre cells (grey), epidermal cells (blue), cortical cells (green), border cells (yellow) and vasculature cells (red). For the PIN distribution pattern, four levels are distinguished: no PINs, a maximum relative level of 0.1, 0.35, and 1. These maximum relative levels are multiplied with the cellular PIN protein level to determine a membrane segment’s actual PIN level. The rootward–shootward flip of PIN polarity in cortex cells is indicated with arrows. d, Time course of free ARF levels, and protein levels of transcription factors A, B, C, D and PLT under a constant auxin application (level 100). Left, fast PLT protein turnover; right, slow PLT protein turnover. e, Schematic overview of root zonation and its dependence on PLT and auxin gradients. Top panel, location of the meristem (MZ), expansion (EZ) and differentiation (DZ) zones. Second panel, PLT concentration profile along the length of the root. PLT levels dictate the location of stem cell maintenance and slow division, fast division and expansion and differentiation domains, with the first threshold demarcating the boundary between stem cell and fast division domains and the second threshold demarcating the boundary between fast division and expansion and differentiation domains. Third panel, auxin profile along the root. Fourth panel, dependence of division, expansion and differentiation rates on auxin levels. A,B,C and D correspond to different auxin levels; for comparison purposes it is shown where these levels occur both in the auxin gradient profile (third panel) and where these levels occur in the division, expansion and differentiation auxin rate dependency functions (fourth panel). f, Pseudocode of the algorithm used in the program to determine whether cells will grow, divide, expand or differentiate. In addition, a cartoon version of the consequences of growth, division, expansion and differentiation processes on gene expression levels, differentiation levels, cell size and PIN pattern is shown. g, Schematic depiction of the neighbouring cells and weighting factors used to calculate weighted, locally averaged growth and expansion rates. B, boundary cells; C, cortex cells; E, epidermal cells; V, vascular cells.
Extended Data Figure 4. The requirement of high auxin levels produces narrow, non-graded PLT profiles.
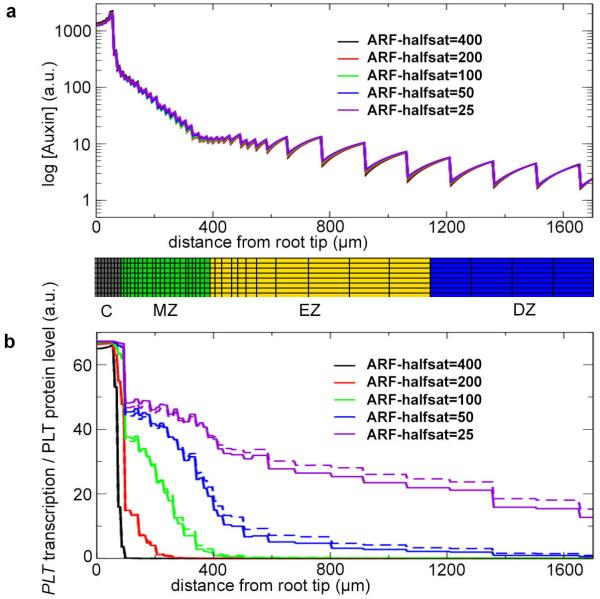
a, Vascular auxin concentration profiles under root zonation dynamics in the initial model for different half-saturation values for free ARF. Note: the curves are practically superimposed. A snapshot image of the zonation below the graph illustrates the location of the root zones. Columella (C), meristem (MZ), expansion (EZ) and differentiation (DZ) zones are shown. b, Vascular PLT transcription (continuous lines) and protein profiles (dashed lines) for the same parameter settings as in a.
Extended Data Figure 5. PLT2 protein persistence and mobility maintain meristematic characteristics without elevating auxin response.
a, A single cell clone expressing PLT2–RFP exiting the meristem (0 min) and travelling through the expansion zone towards the differentiation zone (200 min and 340 min). b, Magnification of the marked area in a (0 min), demonstrating that the clone (marked with green fluorescence, appearing as yellow when overlapped with PLT2–RFP red fluorescence) consists originally of a single cell (white arrowheads). Note that PLT2–RFP (red nuclear fluorescence) is present both in the clone and the surrounding cells. Inset shows optical cross-section at the position of the clone. c, Magnification of the marked area in a (340 min) showing that the clone has divided once while being in the expansion zone (arrowheads mark two clonal cells), and that PLT2–RFP-expressing cells do not expand, whereas cells produced before and after generation of the clone have expanded. d, Auxin response sensor DR5:nYFP (yellow nuclear fluorescence)31 is not elevated in the PLT2–RFP cells (white arrowheads) but shows normal response in vasculature (white arrows). e, Anti-auxin, α-(phenylethyl-2-oxo)-IAA (PEO-IAA) inhibits root hair formation, but fails to promote cell expansion in the PLT2–RFP clones. A PLT2–RFP clone exiting the meristem (0 h) and travelling through the elongation zone towards the differentiation zone. PEO-IAA (30 μM) was applied to the medium 2 h after taking the first (0 h) image. Then images were taken 2.5 h, 4 h, 6 h and 20 h after PEO-IAA application. Note: root hair production is inhibited after PEO-IAA application. Inset, magnification of the marked area in the 0 h image, showing the clone (marked with green fluorescence) and that PLT2–RFP (red nuclear fluorescence) is present both in the clone and the surrounding cells. f, PLT2-3×YFP shows reduced expression in the stele. g, h, The movement-deficient version, PLT2-3×YFP, complements the plt1,2 mutant, although the meristem is shorter than when PLT2-YFP is used. Seedlings were 7 days old. Asterisks in h, Wilcoxon test (P < 0.001); meristem size of PLT2-3×YFP lines significantly reduced. Error bars show s.d. i, Cells shootward from the stem cell niche are proliferating without PLT2 transcription (arrowheads, cells with GFP but no RFP).
Extended Data Figure 6. High auxin levels rapidly inhibit cell division and expansion, but not differentiation.
a, First signs of expansion zone differentiation 7 h after 5 μM IAA application marked by appearance of protoxylem elements (arrow). By 24 h ubiquitous differentiation of the expansion zone is evident. 0 h image used from Fig. 1a. Scale bar, 50 μm. b, Auxin application rapidly inhibits growth while xylem differentiation, monitored by green fluorescence of S18 marker32, proceeds towards meristem. Snapshots from a video of the same root before and after application. Right panel, S18 signal is tightly associated with protoxylem differentiation (arrow). c, Root growth (μm h−1) and mitosis (below the x-axis) of two roots over time (min). IAA applied at t = 0. d, e, Application of 5 μM IAA and inhibition of auxin signalling by 30 μM PEO-IAA leads to decreased accumulation of 5-Ethynyl-2′-deoxyuridine (EdU) stain (red fluorescence), marking DNA replication. Asterisks in e, Mann-Whitney U test P < 0.05, after Bonferroni correction of multiple comparisons; reduction of number of EdU-stained nuclei compared with DMSO control. Error bars show s.d. f, Application of moderate levels of IAA (30 nM) still inhibited cell expansion (Supplementary Notes) but did not inhibit cell division. Root growth (μm h−1) and mitotic events (below the x-axis) of two roots over time (min). IAA (30 nM) was applied at t = 0. g, h, To measure the duration of the differentiation process, individual cells were followed as they left the meristem, expanded and entered the differentiation zone. g, Tracking of a GFP clone20 consisting of four cells. Arrows highlight a cell just entering the expansion zone in the first panel and in the last panel the same cell entering the differentiation zone. For this particular cell it took approximately 6 h 45 min to travel through the expansion zone. Six clones located in six roots were followed through the expansion zone, and it took 6–8 h for these clones to travel through the expansion zone. h, Snapshots from a video recording the growth of wild-type root in the presence of 30 nM IAA. The cells entering the expansion zone (arrows in left panel) were traced in the video to record the time it takes to enter the differentiation zone (arrows in the right panel). For the marked cell it took approximately 7 h 10 min to travel through the expansion zone. Tracking of cells through the expansion zone was carried out for nine cells located in three different roots, and it took 6–8 h for these cells to travel through the expansion zone.
Extended Data Figure 7. Auxin is required for cell division, expansion and differentiation.
a, Protoxylem differentiation is inhibited in the axr3-1 mutant. First protoxylem is highlighted with an arrow. Higher up in the root protoxylem differentiation is often sporadic (inset, arrows indicate a stretch of a single protoxylem element). b, Twenty-four hour induction of pG1090:XVE>>axr3-1-RFP with 17β-oestradiol (est) inhibits xylem differentiation and root hair outgrowth. Left inset, a single protoxylem vessel highlighted with two arrows. Right inset, the arrow highlights the beginning of a more continuous protoxylem strand, which was probably already present before the induction of axr3-1-RFP. Yellow bars in b, c show the areas in the root in which visible protoxylem are present. Yellow arrow in b, c marks the first root hair. Est, 5 μM 17β-oestradiol. c, Twenty-hour treatment of 4-day old wild-type root (Col) with 25 μM auxinole (auxin antagonist) inhibits xylem differentiation, cell expansion and root hair outgrowth. Xylem is typically differentiated as short, sporadic stretches. Left inset, arrow shows the end of a stretch of a xylem strand comprising approximately six protoxylem elements; right inset, higher up in the root two continuous protoxylem strands appear (arrows). These strands were probably already present before auxinole application. The middle inset shows the presence of short cells (marked with arrowheads) high up in the root, indicating that cell expansion was defective. The cell length typically varied along the root. d, Bar plot shows that the final length of cortex cells is shorter when auxin signalling is inhibited by auxinole (n = 35 cells in 6 roots) or inducible pG1090:XVE>>axr3-1-RFP (n = 47 cells in 6 roots) when compared with differentiation zone cells in the control roots (n = 51 cells in 7 roots and n = 38 cells in 7 roots, respectively) located at a similar distance from the root tip. Asterisks, Mann–Whitney U test (P < 0.001). Error bars show s.d. e–j, The consequence of auxin application or inhibition of auxin signalling on marker gene expression. e, f, Auxin application (5 μM IAA) rapidly leads to expression of the root hair differentiation marker pEXP7:GUS (ref. 33) (e) and the xylem differentiation marker S18 (ref. 32) (f) in the elongation zone. Note: high auxin levels (such as 5 μM IAA) are inhibitory for root hair elongation. Therefore, even though the root hair marker pEXP7:GUS rapidly spreads into the elongation zone, root hair elongation is less pronounced there. e–g, Twenty-four hour induction of pG1090:XVE>>axr3-1-RFP (est) inhibits the expression of root hair differentiation marker pEXP7:GUS (e) and the xylem differentiation marker S18 (ref. 32) (f), as well as cell division marker CYCB1;1-GUS22 (g). Note: both the signal intensity and the number of CYCB1;1–GUS-expressing cells are decreased in g. Twenty-four hour induction of XVE>>axr3-1 leads either to disappearance of S18 fluorescence (no expression in f), or S18 was present in short fragments (fragmented). h,i, Expression of PLT2–YFP continued to mark the shortened meristem after auxin signalling was inhibited by induction of pG1090:XVE>>axr3-1-RFP (est) (h) or by treatment of the seedlings with 25 μM auxinole (axnl) (i). j, Auxinole rapidly inhibits cell division as indicated by reduction of the number of CYCB1;1–GFP-expressing cells after auxinole treatment.
Extended Data Figure 8. Simulation of zonation dynamics in the auxin model under normal conditions and conditions of perturbed auxin (signalling).
a, Zonation dynamics under normal growth conditions. b, Zonation dynamics after 24 h of intermediate level auxin application. c, Zonation dynamics after 24 h of high level auxin application. d, Zonation dynamics 60 h after shoot cut. e, Zonation dynamics after 24 h of inhibited auxin signalling. Shown are snapshots of auxin (Aux), PLT transcription (PLT), PLT protein (PLT) and zonation (Zon) profiles. In addition, for the normal growth conditions, snapshots of division rates (DivR), expansion rates (ExpR) and differentiation levels (Diff) are shown.
Extended Data Figure 9. Simulation of zonation under a dynamic gravistimulus protocol and in the closed feedback model.
a, Left, 12 h period in which leftward, apolar and rightward columella PIN orientations are interchanged to simulate dynamic gravitropism. Right, schematic depiction of the used leftward, apolar and rightward columella PIN orientations. b, Root zonation dynamics for the gravitropism model. Snapshots of auxin, PLT transcription, PLT protein, expansion rate and resulting zonation dynamics are shown for t = 3.5 h when PIN orientation is leftward (left), at t = 5.5 h when PIN orientation is apolar (middle) and at t = 9.5 h when PIN orientation is rightward (right). c, Root zonation dynamics for the simplified gravitropism model. In the simplified gravitropism model, cellular division and differentiation rates are again constant (as in the minimal model) rather than ARF level dependent (as in the auxin and normal gravitropism models). Only expansion rates are ARF level dependent, such that they decrease from their maximum value for higher than optimal ARF levels. Similar snapshots as in b are shown. d, Dynamics of left–right differences in auxin, differentiation level and PLT protein distribution in the simplified gravitropism model. e–g, Simulations with positive feedbacks from PLT back to auxin biosynthesis and transport. e, Zonation dynamics under standard growth conditions. In addition to the panels shown for other model versions, gene expression patterns of the genes dependent on PLT levels are shown. PINtot refers to total cellular PIN levels, PINmem to membrane PIN levels, SE to a general auxin synthesizing enzyme and DE to a general auxin degrading enzyme. Note that membrane PIN levels are a product of cellular PIN protein levels and the superimposed cell type and zone dependent membrane PIN pattern (which determines the locations and ratios of PINs deposited on the different membrane faces of the cell). f, Zonation dynamics after 24 h of high auxin application. g, Zonation dynamics under dynamic gravitropic stimulation.
Extended Data Figure 10. Structure and function of the auxin–PLETHORA regulatory architecture.
a, Regulatory architecture controlling root zonation dynamics and tropisms. Slow induction of the PLTs by auxin (black arrows) defines the pathway that operates through regulating PLT levels (green arrows). Parallel to this, auxin can also control zonation rapidly without directly affecting PLT levels (blue arrows). b, Schematic overview of root developmental zones where local concentrations of auxin, PLT transcript and PLT proteins are represented by symbol density. c, Overview of the auxin, PLT transcript and PLT protein profiles and corresponding zonation dynamics under the following conditions: wild-type (WT), extra PLT2 copy in wild type (PLT2:YFP), clonal ectopic expression of PLT in the expansion zone (clone), short-term auxin addition (+aux) or inhibition of auxin signalling (−aux). Expansion is indicated by longer cell shape, differentiation by root hair bulge. d, e, Auxin, PLT, zonation, and expansion rate profiles during (d) and after (e) a gravitropic stimulus for a simulation in which PLT levels are a direct readout of auxin levels, and in which partly differentiated cells dedifferentiate upon re-entering the meristem. Differentiation snapshots are shown with 2 h intervals during and after the gravitropic stimulus. Brackets highlight the developmental progression of the cells that dedifferentiated under the gravitropic stimulus. Differentiation graphs show differentiation levels in the leftmost epidermal row of cells (corresponding to the side of the root towards the gravity vector) in the PLT as direct auxin readout model (black) compared to that of the model developed in this study (red), for 2 h after the (end of the) gravitropic stimulus.
Supplementary Material
Acknowledgements
We thank M. Grebe, P. Benfey and K.-i. Hayashi for materials; the Light Microscopy Unit (Institute of Biotechnology), S. El-Showk, A.-M. Bågman, J. van Amerongen and F. Kindt for technical advice or assistance. This work is supported by a Human Frontier Science Program fellowship (A.P.M.), European Research Council Advanced Investigator Fellowship SysArc (B.S.), SPINOZA award (B.S., K.t.T., K.P.), ALW-ERAPG grant 855.50.017 (S.D.-T.), the Academy of Finland (A.P.M., R.S., O.S., J.S.), Biocentrum Helsinki and University of Helsinki (A.P.M., R.S., O.S.), Integrative Life Science Doctoral Program (R.S.), Marie Curie Intra-European Fellowship (IEF-2008-237643) (S.D.-T.), The Netherlands Organisation for Scientific Research (NWO)-Horizon grant (R.H.), NWO-ALW grant (G.W.), and EMBO Long-term fellowship (A.P.M., K.P.).
Footnotes
Supplementary Information is available in the online version of the paper.
The authors declare no competing financial interests.
Readers are welcome to comment on the online version of the paper.
References
- 1.Dolan L, et al. Cellular organisation of the Arabidopsis thaliana root. Development. 1993;119:71–84. doi: 10.1242/dev.119.1.71. [DOI] [PubMed] [Google Scholar]
- 2.Beemster GT, Baskin TI. Stunted plant 1 mediates effects of cytokinin, but not of auxin, on cell division and expansion in the root of Arabidopsis. Plant Physiol. 2000;124:1718–1727. doi: 10.1104/pp.124.4.1718. [DOI] [PMC free article] [PubMed] [Google Scholar]
- 3.Sabatini S, et al. An auxin-dependent distal organizer of pattern and polarity in the Arabidopsis root. Cell. 1999;99:463–472. doi: 10.1016/s0092-8674(00)81535-4. [DOI] [PubMed] [Google Scholar]
- 4.Grieneisen VA, Xu J, Maree AF, Hogeweg P, Scheres B. Auxin transport is sufficient to generate a maximum and gradient guiding root growth. Nature. 2007;449:1008–1013. doi: 10.1038/nature06215. [DOI] [PubMed] [Google Scholar]
- 5.Petersson SV, et al. An auxin gradient and maximum in the Arabidopsis root apex shown by high-resolution cell-specific analysis of IAA distribution and synthesis. Plant Cell. 2009;21:1659–1668. doi: 10.1105/tpc.109.066480. [DOI] [PMC free article] [PubMed] [Google Scholar]
- 6.Brunoud G, et al. A novel sensor to map auxin response and distribution at high spatio-temporal resolution. Nature. 2012;482:103–106. doi: 10.1038/nature10791. [DOI] [PubMed] [Google Scholar]
- 7.Ishida T, et al. Auxin modulates the transition from the mitotic cycle to the endocycle in Arabidopsis. Development. 2010;137:63–71. doi: 10.1242/dev.035840. [DOI] [PubMed] [Google Scholar]
- 8.Aida M, et al. The PLETHORA genes mediate patterning of the Arabidopsis root stem cell niche. Cell. 2004;119:109–120. doi: 10.1016/j.cell.2004.09.018. [DOI] [PubMed] [Google Scholar]
- 9.Galinha C, et al. PLETHORA proteins as dose-dependent master regulators of Arabidopsis root development. Nature. 2007;449:1053–1057. doi: 10.1038/nature06206. [DOI] [PubMed] [Google Scholar]
- 10.Blilou I, et al. The PIN auxin efflux facilitator network controls growth and patterning in Arabidopsis roots. Nature. 2005;433:39–44. doi: 10.1038/nature03184. [DOI] [PubMed] [Google Scholar]
- 11.Band LR, et al. Systems analysis of auxin transport in the Arabidopsis root apex. Plant Cell. 2014;26:862–875. doi: 10.1105/tpc.113.119495. [DOI] [PMC free article] [PubMed] [Google Scholar]
- 12.Hofhuis H, et al. Phyllotaxis and rhizotaxis in Arabidopsis are modified by three PLETHORA transcription factors. Curr. Biol. 2013;23:956–962. doi: 10.1016/j.cub.2013.04.048. [DOI] [PubMed] [Google Scholar]
- 13.Friml J, Wisniewska J, Benkova E, Mendgen K, Palme K. Lateral relocation of auxin efflux regulator PIN3 mediates tropism in Arabidopsis. Nature. 2002;415:806–809. doi: 10.1038/415806a. [DOI] [PubMed] [Google Scholar]
- 14.Band LR, et al. Root gravitropism is regulated by a transient lateral auxin gradient controlled by a tipping-point mechanism. Proc. Natl Acad. Sci. USA. 2012;109:4668–4673. doi: 10.1073/pnas.1201498109. [DOI] [PMC free article] [PubMed] [Google Scholar]
- 15.Mähönen AP, et al. Cytokinin signaling and its inhibitor AHP6 regulate cell fate during vascular development. Science. 2006;311:94–98. doi: 10.1126/science.1118875. [DOI] [PubMed] [Google Scholar]
- 16.Lee MM, Schiefelbein J. WEREWOLF, a MYB-related protein in Arabidopsis, is a position-dependent regulator of epidermal cell patterning. Cell. 1999;99:473–483. doi: 10.1016/s0092-8674(00)81536-6. [DOI] [PubMed] [Google Scholar]
- 17.Friml J, et al. Efflux-dependent auxin gradients establish the apical–basal axis of Arabidopsis. Nature. 2003;426:147–153. doi: 10.1038/nature02085. [DOI] [PubMed] [Google Scholar]
- 18.Fischer U, et al. Vectorial information for Arabidopsis planar polarity is mediated by combined AUX1, EIN2, and GNOM activity. Curr. Biol. 2006;16:2143–2149. doi: 10.1016/j.cub.2006.08.091. [DOI] [PubMed] [Google Scholar]
- 19.Wu S, Gallagher KL. Transcription factors on the move. Curr. Opin. Plant Biol. 2012;15:645–651. doi: 10.1016/j.pbi.2012.09.010. [DOI] [PubMed] [Google Scholar]
- 20.Heidstra R, Welch D, Scheres B. Mosaic analyses using marked activation and deletion clones dissect Arabidopsis SCARECROW action in asymmetric cell division. Genes Dev. 2004;18:1964–1969. doi: 10.1101/gad.305504. [DOI] [PMC free article] [PubMed] [Google Scholar]
- 21.Matsuzaki Y, Ogawa-Ohnishi M, Mori A, Matsubayashi Y. Secreted peptide signals required for maintenance of root stem cell niche in Arabidopsis. Science. 2010;329:1065–1067. doi: 10.1126/science.1191132. [DOI] [PubMed] [Google Scholar]
- 22.Colón-Carmona A, You R, Haimovitch-Gal T, Doerner P. Technical advance: spatio-temporal analysis of mitotic activity with a labile cyclin–GUS fusion protein. Plant J. 1999;20:503–508. doi: 10.1046/j.1365-313x.1999.00620.x. [DOI] [PubMed] [Google Scholar]
- 23.Culligan K, Tissier A, Britt A. ATR regulates a G2-phase cell-cycle checkpoint in Arabidopsis thaliana. Plant Cell. 2004;16:1091–1104. doi: 10.1105/tpc.018903. [DOI] [PMC free article] [PubMed] [Google Scholar]
- 24.Yu SR, et al. Fgf8 morphogen gradient forms by a source-sink mechanism with freely diffusing molecules. Nature. 2009;461:533–536. doi: 10.1038/nature08391. [DOI] [PubMed] [Google Scholar]
- 25.Wilson V, Olivera-Martinez I, Storey KG. Stem cells, signals and vertebrate body axis extension. Development. 2009;136:1591–1604. doi: 10.1242/dev.021246. [DOI] [PubMed] [Google Scholar]
- 26.Ibañes M, Kawakami Y, Rasskin-Gutman D, Izpisua Belmonte JC. Cell lineage transport: a mechanism for molecular gradient formation. Mol. Syst. Biol. 2006;2:57. doi: 10.1038/msb4100098. [DOI] [PMC free article] [PubMed] [Google Scholar]
- 27.Hayashi K, et al. Rational design of an auxin antagonist of the SCFTIR1 auxin receptor complex. ACS Chem. Biol. 2012;7:590–598. doi: 10.1021/cb200404c. [DOI] [PubMed] [Google Scholar]
- 28.Rouse D, Mackay P, Stirnberg P, Estelle M, Leyser O. Changes in auxin response from mutations in an AUX/IAA gene. Science. 1998;279:1371–1373. doi: 10.1126/science.279.5355.1371. [DOI] [PubMed] [Google Scholar]
- 29.Vanstraelen M, Benkova E. Hormonal interactions in the regulation of plant development. Annu. Rev. Cell Dev. Biol. 2012;28:463–487. doi: 10.1146/annurev-cellbio-101011-155741. [DOI] [PubMed] [Google Scholar]
- 30.Pinon V, Prasad K, Grigg SP, Sanchez-Perez GF, Scheres B. Local auxin biosynthesis regulation by PLETHORA transcription factors controls phyllotaxis in Arabidopsis. Proc. Natl Acad. Sci. USA. 2013;110:1107–1112. doi: 10.1073/pnas.1213497110. [DOI] [PMC free article] [PubMed] [Google Scholar]
References for Extended Data Figures
- 31.Heisler MG, et al. Patterns of auxin transport and gene expression during primordium development revealed by live imaging of the Arabidopsis inflorescence meristem. Curr. Biol. 2005;15:1899–1911. doi: 10.1016/j.cub.2005.09.052. [DOI] [PubMed] [Google Scholar]
- 32.Lee JY, et al. Transcriptional and posttranscriptional regulation of transcription factor expression in Arabidopsis roots. Proc. Natl Acad. Sci. USA. 2006;103:6055–6060. doi: 10.1073/pnas.0510607103. [DOI] [PMC free article] [PubMed] [Google Scholar]
- 33.Cho HT, Cosgrove DJ. Regulation of root hair initiation and expansin gene expression in Arabidopsis. Plant Cell. 2002;14:3237–3253. doi: 10.1105/tpc.006437. [DOI] [PMC free article] [PubMed] [Google Scholar]
Associated Data
This section collects any data citations, data availability statements, or supplementary materials included in this article.


