

Abstract
The ash of C. polygonoides (locally called balanza) was collected from Lakki Marwat, Khyber Pakhtunkhwa, Pakistan, and was utilized as biosorbent for methylene blue (MB) removal from aqueous solution. The ash was used as biosorbent without any physical or chemical treatment. The biosorbent was characterized by using various techniques such as Fourier transform infrared spectroscopy (FTIR), thermogravimetric analysis (TGA), and scanning electron microscopy (SEM). The particle size and surface area were measured using particle size analyzer and Brunauer-Emmett-Teller equation (BET), respectively. The SEM and BET results expressed that the adsorbent has porous nature. Effects of various conditions such as initial concentration of methylene blue (MB), initial pH, contact time, dosage of biosorbent, and stirring rate were also investigated for the adsorption process. The rate of the adsorption of MB on biomass sample was fast, and equilibrium has been achieved within 1 hour. The kinetics of MB adsorption on biosorbent was studied by pseudo-first- and pseudo-second-order kinetic models and the pseudo-second-order has better mathematical fit with correlation coefficient value (R 2) of 0.999. The study revealed that C. polygonoides ash proved to be an effective, alternative, inexpensive, and environmentally benign biosorbent for MB removal from aqueous solution.
1. Introduction
Environmental pollution is a serious and challenging problem all over the world because of the rapid progress in society, science, technology, and industries. The industrial effluent containing both inorganic and organic toxic material which discharging into surface water that seriously affect biodiversity, ecosystem functioning and natural activities of aquatic system. Among these pollutants one such pollutant is the synthetic dyes which are considered to be the most common and toxic water pollutants [1–5]. The dye compounds have been extensively used in various industries to colorize the products, such as in papers and pulp, textiles, plastics, wool, paints, rubber manufacturing, printing, cottons, cosmetic products, foods, and pharmaceuticals. The extensive use of dyes and dyes containing compounds disturb the aquatic system by inhibiting the sunlight from reaching water and thus reducing photosynthesis and increasing the biological oxygen demand (BOD) and chemical oxygen demand (COD) values [1–3, 5]. Among these dyes some cause depletion of the dissolved oxygen content of water thus affecting aquatic life badly. In addition, certain textile dyes are carcinogenic and toxic to living organisms and have adverse effect on human health, domestic animals, and wildlife [6].
Among the dyeing agents, methylene blue (MB) which is a heterocyclic aromatic chemical compound is widely used in the textile industries [6–9]. MB and MB like other textile dyes can cause eye burns in humans and animals, skin irritation, dyspnea, convulsions, cyanosis, tachycardia, and dyspnea, and if ingested can cause gastrointestinal tract irritation, nausea, vomiting, also diarrhea, and so forth [10–12]. Due to these toxicological and hazardous effects of dyes on environment and subsequently on living organism, the removal of these dyes from wastewater is a key challenging task for researchers and an important area of research directed towards a better life [10, 13–15].
There are various physical and chemical methods used for removal of textile dyes from aqueous media. These include ion exchange, membrane filtration, electrochemical destruction, ozonation, flotation, chemical coagulation, biological and chemical oxidation, precipitation, and electrokinetic and adsorption methods [16–19]. However most of these methods have some major drawbacks, such as the applicability at relative high concentration of dye, insufficient dye removal, high cost and production of extra waste [20]. Similarly, the biological methods often demand a very strict control of experimental conditions and especially the pH and the decontamination process is usually very slow. Alike, in chemical oxidation methods, the biodegradation products are often carcinogenic and toxic in nature which affects the aquatic life.
Activated carbon has been extensively used as an adsorbent for the removal of dyes because of the acidic nature and showed pores nature of its surface [21–23]. However, the activated carbon is costly and challenging in regeneration which raises the cost of waste water treatment [24, 25]. Thus, there is a great demand for such type of adsorbent which is cheaper and still has high adsorption capability towards pollutants and dyes without any additional expensive pretreatment. Presently cellulose and lignocellulosic biomass have got considerable attraction because of the abundance, effectiveness, low cost, and environmentally friendly nature of these biopolymers. Thus biosorption has been proved to be the most effective technique for the removal of MB from the aqueous solution [16, 26–29].
In this research work C. polygonoides (locally called balanza, which is used as fuel for domestic cooking purposes and in bricks kiln industry) was collected from Lakki Marwat, Khyber Pakhtunkhwa, Pakistan, and utilized as biosorbent for MB removal from aqueous solution without any physical or chemical treatment. The utilization of this alternative, abundant, low cost, and environment friendly bioadsorbent will effectively reduce both the waste disposal problem and the cost of waste decontamination.
2. Materials and Methods
2.1. Methylene Blue
All the chemicals used in the present research work were of analytical grade and purchased from Sigma-Aldrich, BDH, and Merck. MB with chemical formula C16H18ClN3S3H2O (Table 1) was used as model adsorbent to study the adsorption capacity of biosorbent. The stock solution of 1000 ppm of MB was prepared and subsequently their solutions of desired concentration were prepared by applying the dilution formula (M 1 V 1 = M 2 V 2).
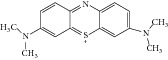
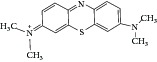
Table 1.
Resonance structure and some important physical properties of MB (3, 7-bis(dimethyl amino)phenothiazine-5-ium chloride) [30].
|
|
|||
|---|---|---|---|---|
| Mw (g/mol) | Size (nm) | S (g/L) | logK ow | T m (°C) |
| 319.85 | 1.69 × 0.74 × 0.38 | 43.60 | 5.58 | 100–110 |
Mw molecular weight.
S water solubility at 25°C.
K ow octanol water partition coefficient.
T m melting point.
2.2. Preparation of Biosorbent
The Calligonum polygonoides ash was washed with double distilled water to remove soluble impurities and then dried in oven at 110°C for 5 hours. The powdered material thus obtained was sieved through 45 μm sieve using Retsch AS 200 basic and was stored in air tight glass bottle for further experimental study (Figure 1).
Figure 1.

Digital photographs of C. polygonoides and its ash.
2.3. Characterization of Biosorbent
2.3.1. Scanning Electronic Microscopic (SEM) Analysis
The surface structure of biosorbent was analyzed using scanning electron microscopy (JMT-300, JEOL).
2.3.2. Surface Area Analysis
The surface area of C. polygonoides ash sample was determined using Brunauer-Emmett-Teller (BET) method and the pore size diameter was obtained by BJH method from the adsorption/desorption isotherm of nitrogen gas, at 77.0 K, employing Micromeritics ASAP 2010 apparatus.
2.3.3. Fourier Transform Infrared Spectroscopy
The chemical structure and nature of functional groups C. polygonoides ash were studied using FTIR transmission spectra on a Perkin Elmer Spectrum One. For FTIR spectra measurement, sample was mixed with KBr in the ratio of 1/1000 and pressed into the pellet using a Perkin Elmer hydraulic pump. FTIR spectrum was recorded in the wave number range from 4000 to 450 cm−1 with resolution of 5 cm−1.
2.3.4. TGA Analysis
To investigate the thermal characteristic or weight-loss profiles of C. polygonoides ash, a thermogravimetric analyzer (Pyris-1, Perkin Elmer, Shelton, CT) was used over the temperature range from 50°C to 800°C at heating rate 10°C/min. The analysis was conducted under N2 gas with flow rate of 50 mL/min and weight of samples taken was around 5–7 mg.
2.3.5. Particle Size Analysis
The particle size distributions were measured using Mastersizer 2000 ver. 5.54, serial number: Mal 18486 (Malvern Ltd., UK). For particles size distribution measurement, 0.5 g of C. polygonoides ash was loaded into the tray and dispersed by compress air to bring sample into laser beam for measurement of the particle size distributions.
2.4. Experiments for Dye Adsorption
The biosorption experiment of MB was conducted by adding 100 mg of biosorbent to 25 mL of aqueous solution of MB dye (4–10 mg/L) in 50 mL of conical flask and shaken at 300 rpm in orbital shaker at 298 K. After specific interval of time, sample aliquots were withdrawn and centrifuged to separate the dye loaded from dye solution. The remaining concentration of MB was measured spectrophotometrically by measuring the absorbance of the supernatant (dye solution) left after centrifugation. To find the optimum experimental conditions for MB removal, for MB removal, the effect of time (10–120 min), initial dye concentration (2 mg/L–10 mg/L), biosorbent loading (20–100 mg), and shaking velocity (100–600 rpm) were thoroughly studied.
The color removal efficiency (R) and adsorption capacity of C. polygonoides ash were measured by applying the following equations:
| (1) |
| (2) |
| (3) |
where q e and q t (mg/g) are the amount of MB adsorbed at time t and equilibrium, respectively; C 0, C t, and C e (mg/L) are concentration of MB at initial, time t, and equilibrium, respectively; V is the solution volume and m (g) is the mass of biosorbent.
2.5. Kinetic Study and Model Fitting
To study the adsorption mechanism of MB on biosorbent pseudo-first- and pseudo-second-order kinetic models were used.
2.5.1. The Pseudo-First-Order Equation
The pseudo-first-order kinetic model or Lagergren kinetic equation is generally expressed as follows:
| (4) |
where q e is the amounts adsorbed (mg/g) at equilibrium, q t is the amounts adsorbed (mg/g) at any time, and k 1 is the adsorption rate constant for pseudo-first-order (s−1).
2.5.2. The Pseudo-Second-Order Model
If the rate of sorption is a second-order mechanism, the pseudo-second-order kinetic rate equation is used and it is expressed as
| (5) |
By integration of (3) for the boundary conditions when t = 0 and q t = q i
| (6) |
where k 2 (g/mg·min) is the rate constant of pseudo-second-order:
| (7) |
If t/q t is plotted against t, it gives a straight line, which means that the adsorption follows pseudo-second-order kinetics. This model is based upon the assumption, if the rate limiting step may be chemisorption which involve valence forces due to the electron sharing or exchange of electron between the adsorbent and adsorbate.
3. Results and Discussion
3.1. Particle Size Distributions
After thermal treatment, the particle size of adsorbent decreases. Decrease in particles size of adsorbent usually results in enhanced adsorption of dye because the adsorption capacity of the adsorbent is directly proportional to the exposed surface area and inversely related to the particle diameter of nonporous material [42]. By increasing the particle size, the number of particles per given mass decreases which results in decrease in specific surface area and hence the adsorption capacity. The particle size distribution of pure C. polygonoides powder changed from (0.1) 12.39 μm, (0.5) 120.79 μm, and (0.9) 480.309 μm to (0.1) 2.36 μm, (0.5) 27.90 μm, and (0.9) 382.84 μm, respectively, after burning. The C. polygonoides ash sample becomes black in color with some gray particles, resulting from different stages of carbon combustion during burning process of the biomass. The amount of black particles decreases with increasing the calcination time and temperature.
3.2. Surface Area (BET)
The process of adsorption is a multistep complex phenomenon and therefore many factors affect the phenomenon. Among these factors, the pore size of adsorbent significantly affects the adsorption process. Pores size is generally classified into various groups such as micropores (<2 nm diameter), mesopores (2–50 nm), and macropores (>50 nm). The surface chemistry of adsorbent and its pores structure considerably affect the adsorption of big molecules like MB into its structure. MB has molecular cross-sectional diameter of about 0.8 nm and cannot easily penetrate material with pores smaller than 1.3 nm. The surface area of C. polygonoides ash depends on the amorphous carbon content. During the dye adsorption process, the diffusion of dye molecules to the active sites takes place first, which is followed by attachment of these dye molecules to the active sites. The pore size and total pore volume thus play a decisive role in the adsorption process.
C. polygonoides ash has significant surface area and wide pore size distribution. The BET surface area of C. polygonoides ash is 4.3810 m2/g, whereas BJH adsorption/desorption surface area of pores of C. polygonoides ash is 4.119/4.7108 m2/g. For C. polygonoides ash the single point total pore volume of pores (d C. polygonoides < 3166 Å) is found to be 0.016691 cm3/g. The cumulative adsorption/desorption pore volume of the pores (17 Å < d < 3000 Å) of C. polygonoides ash is 0.019823/.019556 cm3/g (Table 2). The C. polygonoides ash, thus, is found to consist of mesopores predominantly. This is what is desirable for the liquid phase adsorptive removal of metal ions and dyes.
Table 2.
Surface properties of C. polygonoides ash.
| Surface properties | Values |
|---|---|
| BET surface area | 4.3810 m2·g−1 |
| Average pores volume | 0.016691 cm3·g−1 |
| Average pore diameter | 152.56 Å |
3.3. Fourier Transform Infrared Spectroscopy
It is important to know the exact chemical structure of the adsorbent in order to understand the adsorption process. FTIR spectroscopy was thus employed to characterize the chemical structure of C. polygonoides before and after thermal treatment (Figure 2). The broad band around 3400 cm−1 can be assigned to the stretching vibration of O–H and N–H groups. This peak is broad because of the complex vibrational modes due to participation of –OH group in hydrogen bonding. This peak represents the presence of hydroxyl group and chemisorbed water in the adsorbent [43, 44]. Beside this, the vibrational modes in this area also correspond to inter- and intramolecular hydrogen bonding. The presence of a peak at 2910 cm−1 shows the symmetric and asymmetric C–H stretching due to the existence of methyl and/or methylene groups [45]. The peak located at 1380 cm−1 is indicative of –CH3 group. The sharp intense peak at about 1637 cm−1 corresponds to O–H bending vibration of secondary adsorbed water molecules. The bands at 1528 and 1445 cm−1 confirm the presence of C=C bond of alkene and aromatic ring [46]. The FTIR spectra showed the presence of another peak at 1100 cm−1 which may tentatively be assigned to Si–O–Si and –C–O–H stretching and –OH deformation. The absorption peaks in region from 1000 to 1200 cm−1 represented the main skeleton of cellulose. The presence of peak at 1035 cm−1 represents stretching vibration of cellulose/hemicellulose and ary-OH group in lignin. The presence of polar groups on the surface is likely to give considerable cation exchange capacity to the adsorbents. The occurrence of peaks at about 793 shows the existence of Si–H [35]. The presence of adsorption band in region from 1300 to 900 cm−1 represents the carbonyl component (i.e., alcohols, esters, carboxylic acid, or ethers) [16, 47]. The presence of absorbance peaks in region from 900 cm−1 shows O–H stretching vibrations which represented aromatic groups. In C. polygonoides ash, the peak (900 cm−1) of secondary adsorbed water is not present because of thermal treatment. The appearance of peak at 3700 cm−1 in C. polygonoides ash is related to stretching of free O–H functional group [35]. The presence of polar groups on the surface is likely to give considerable cation exchange capacity to the adsorbents.
Figure 2.
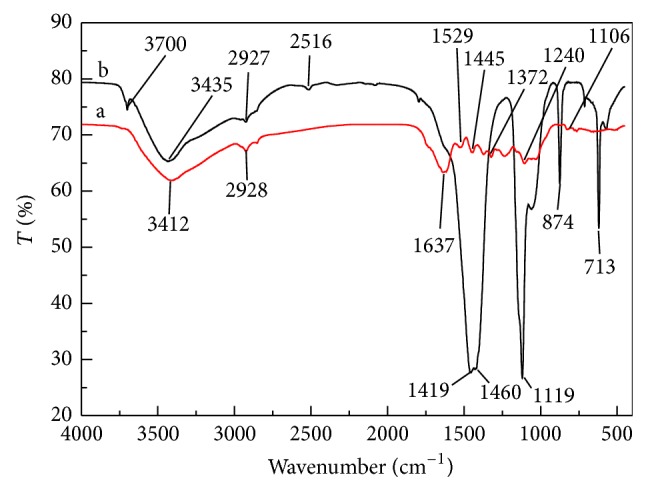
FTIR spectra of (a) C. polygonoides and (b) C. polygonoides ash.
3.4. Morphology of Adsorbent
Scanning electronic microscopy (SEM) study is one the most popular, primary, and widely used characterization techniques applied for the study of surface properties and morphology of biosorbent material. Moreover, SEM study also tells about porosity and texture of biosorbent material [25, 44, 48, 49]. Figure 3 shows that C. polygonoides ash has small cavities on surface and has a porous texture that may provide large surface for the adsorption of the dye molecules.
Figure 3.
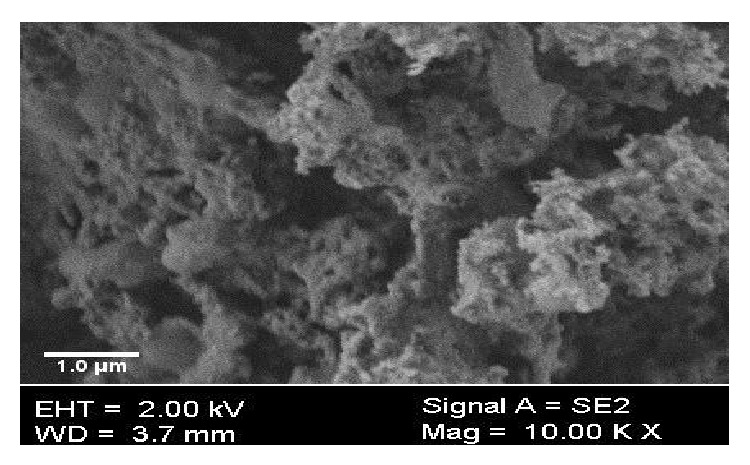
SEM analysis of C. polygonoides ash.
3.5. Thermogravimetric Analysis
Thermogravimetric analysis (TGA) is an important analytical technique used to study the thermal characteristics of carbonaceous materials. The TGA provide information on the degradation process of material occurring at different temperatures and under different atmosphere.
The C. polygonoides ash was subjected to TGA under argon atmosphere. Figures 4(a) and 4(b) show the TGA and differential thermal analysis (DTA) curves for C. polygonoides ash, respectively. TGA result of C. polygonoides ash shows a typical three-stage mass loss.
The first mass decomposition occurred below 100°C, which could attribute to water elimination/desorption which are physically absorbed in C. polygonoides ash. The DTA graph also shows an endothermic peak at 100°C. In this region the loss of very small amount of volatile compounds may also be contributed to the weight loss.
The second mass loss which appeared around 300°C is due to the thermal decomposition of cellulose/hemicellulose/lignin degradation.
The third mass decomposition occurred between 350 and 550°C, corresponding to the burning of carbonaceous residues [50].
Figure 4.
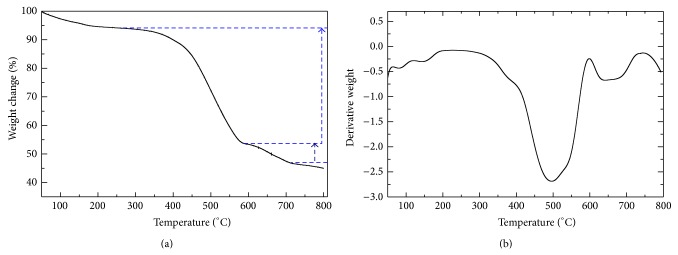
(a) TGA curve of C. polygonoides ash. (b) DTA curve of C. polygonoides ash.
4. Optimizations of Parameters
4.1. Effect of Contact Time and Initial Concentration of Dye
The time of contact between the dye and adsorbent and also the concentration of dye can affect the adsorption process. Figures 5(a) and 5(b) show adsorption with respect to contact time and initial concentration of MB on the surface of C. polygonoides ash, respectively. The % removal efficiency and adsorption capacity of MB increased with increase of contact time and reached equilibrium after 60 min. Increase in contact time after 60 min cannot enhance the adsorption of MB on C. polygonoides ash [50]. In the beginning, the % removal of dye is very rapid due to the adsorption of more molecules of dye on the unsaturated external surface of adsorbent. After 60 min the surface pores of adsorbent are covered and it becomes difficult for dyes molecule to enter into the interior of adsorbent. The initial rapid % removal of dye may be due presence of more binding sites for adsorption of dye molecules and the slow removal of dye in the last stages may be due to occupation/saturation of these binding sites with dyes molecules [51]. The equilibrium time required for the adsorption of different dye concentration is independent of their initial concentration. The result shows that for all of the initial concentration the equilibrium was reached in the same time. Khattri and Sing also obtained the same observation during adsorption of MG on neem sawdust [35, 44, 50]. It was found that with increase of the concentration of dye from 4 to 10 mg/L the rate of adsorption and thus % removal and adsorption capacity increase. It is very common practice in the adsorption of dyes molecules that with increase of initial concentration of dyes the capacity of adsorption increases because of strong driving force and transfers of more dye molecules from aqueous phase to solid phase increase [15].
Figure 5.

(a) Effect of contact time on adsorption of MB on C. polygonoides ash. (b) Adsorption capacity plot for adsorption of various concentration of MB on C. polygonoides ash.
Tables 3(a) and 3(b) show a comparison of % removal and adsorption capacity of C. polygonoides ash with that of other adsorbents reported in the literature. It becomes clear that the adsorption capacity of the C. polygonoides ash is higher than many of the reported adsorbents.
Table 3.
(a) Comparison of contact time for dye adsorption. (b) Comparison of adsorption capacity of C. polygonoides with other reported adsorbents.
(a).
(b).
| Adsorbent | Adsorption capacity | References |
|---|---|---|
| (mg/g) | ||
| C. polygonoides | 24.72 | This work |
| NaOH treated raw kaolin | 16.34 | [36] |
| NaOH treated pure kaolin | 20.49 | [36] |
| Beech sawdust pretreated with CaCl2 | 13.02 | [37] |
| Calotropisprocera leaf | 4.17 | [38] |
| Orange peel | 14.3 | [39] |
| Jute fiber carbon | 27.99 | [40] |
| Sawdust | 37.83 | [41] |
4.2. Effect of Shaking Speed
To investigate the effect of stirring speed on the adsorption of MB on C. polygonoides ash, the experiments were carried using different stirring speed from 100 to 600 using dye concentration of 10 mg/L, contact time was 60 min, and the temperature was 298 K. Figure 6 shows the effect of shaking speed on the MB adsorption. With increasing of the shaking speed the adsorption or % removal of dye from aqueous solution was increased. This increase in adsorption reached a maximum at 300 rpm and after this there is no such considerable increase in the adsorption of dyes. This increase in adsorption reached a maximum at 300 rpm and, further increase in speed had no significant effect on the adsorption of the dye. The increase in adsorption of MB may be to the decrease in the thickness of diffuse layer around the surface of adsorbent with increasing the stirring speed [13].
Figure 6.
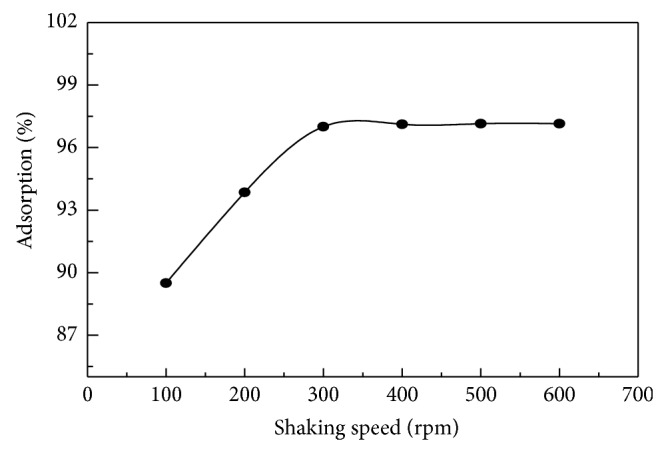
Effect of shaking speed on adsorption of MB on C. polygonoides ash.
4.3. Effect of Adsorbent Dose
The amount of adsorbent greatly affects the removal of dye from aqueous solution. The effect of C. polygonoides ash amount on MB adsorption was investigated in the range from 20 mg to 100 mg. Figure 7 shows that with increase of C. polygonoides ash amount, the % adsorption capacity of MB is increased [52]. This increase in adsorption of MB with the increase of C. polygonoides ash amount is due to the increase in the availability of more and more surface area and active sites. Similarly by increasing the surface area more and more adsorption pores are available for MB adsorption [53]. Further increase in concentration of both C. polygonoides ash beyond 100 mg the adsorption of MB cannot increase; this may be due to saturation of vacant spaces or the aggregation/agglomeration of biosorbent particles with each other. In the present study therefore 100 mg of C. polygonoides ash was optimized. Similar results have been reported by other researchers for other dye adsorptions [54].
Figure 7.
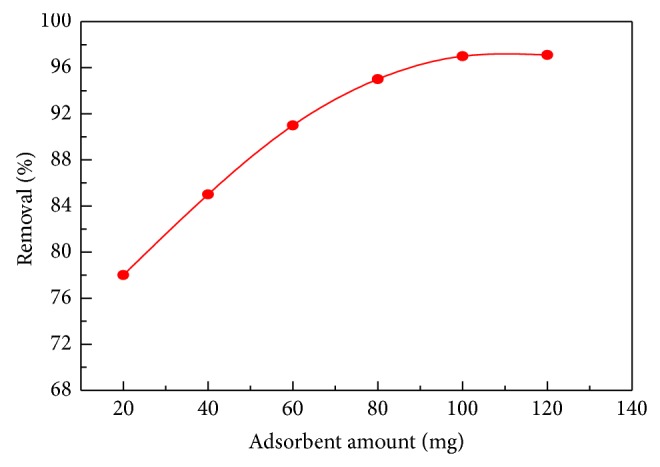
Effect of adsorption dose on MB adsorption on C. polygonoides ash.
4.4. Kinetics of Adsorption and Model Fittings
The adsorption mechanism process of MB on C. polygonoides ash was evaluated by using pseudo-first-order and pseudo-second-order kinetic models [55] (Table 4). From Figure 8 and Tables 5 and 6 it is clear that the adsorption of MB on C. polygonoides can be fitted in the pseudo-second-order kinetics with regression coefficient (R 2) 0.999.
Table 4.
Pseudo-first-order kinetics data for adsorption of MB on C. polygonoides ash.
| Conc.: mg/L | Intercept | Slope | R 2 |
|---|---|---|---|
| 4 | −0.711 | −0.0220 | 0.99953 |
| 6 | −0.6242 | −0.0272 | 0.9839 |
| 8 | −0.5695 | −0.0298 | 0.9522 |
| 10 | −0.4653 | −0.0361 | 0.8851 |
Figure 8.
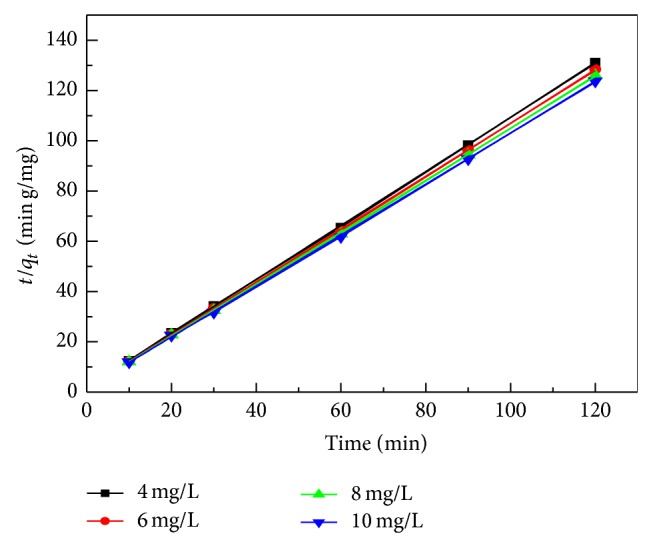
Pseudo-second-order kinetics plot for adsorption of MB on C. polygonoides ash.
Table 5.
Pseudo-second-order kinetics data for adsorption of MB C. polygonoides ash.
| Conc.: mg/L | Intercept | Slope | R 2 |
|---|---|---|---|
| 4 | 1.68 | 1.07 | 0.9998 |
| 6 | 1.75 | 1.05 | 0.9999 |
| 8 | 1.73 | 1.03 | 0.9998 |
| 10 | 1.67 | 1.01 | 0.999 |
Table 6.
Pseudo-second-order kinetic parameters of various kinetics parameters for the adsorption of MB onto C. polygonoides at different initial dye concentrations.
| Conc.: | q 2 | k 2 | h | R 2 |
|---|---|---|---|---|
| mg/L | (mg g−1) | (g mg−1 min−1) | (mg g−1 min−1) | |
| 4 | 0.93 | 0.46 | 0.402 | 0.9999 |
| 6 | 0.95 | 0.51 | 0.467 | 0.9999 |
| 8 | 0.96 | 0.54 | 0.507 | 0.9998 |
| 10 | 0.98 | 0.58 | 0.567 | 0.9999 |
4.5. Intraparticle and Liquid Film Diffusion Model
The diffusivity of the solute molecules plays an important role in the determination of overall rate of an adsorption process. Although the pseudo-second-order equation was found to the best fitted order for present experimental data, the results obtained from this model are not sufficient to predict the diffusion mechanism. During a solid/liquid adsorption process, adsorbate transfer was usually governed by liquid phase mass transport (boundary-layer diffusion), or intraparticle mass diffusion, or both. The slowest step, which might be either film diffusion or pore diffusion, would obviously be the overall rate-controlling step of the adsorption process. The intraparticle and liquid film diffusion models are represented by
| (8) |
Figure 9 shows the interparticle diffusion model fitting for the adsorption of various concentration of MB. The result shows that the plot of q versus t 0.5 is not very linear for whole time and can be divided into two regions. The multilinearity of the plot for MB adsorption shows the multistage adsorption of MB on the C. polygonoides. Normally if the plot of q t versus t 0.5 passed through origin this indicates the interparticle diffusion is only the rate limiting step. However in this study it is clear that the plot of q versus t 0.5 is not passing through the origin, which shows that the intraparticle diffusion is not involved in the adsorption process; therefore it is not a sole rate-controlling step. This result confirms that the adsorption process is followed by two or more than two phases [4, 56].
Figure 9.
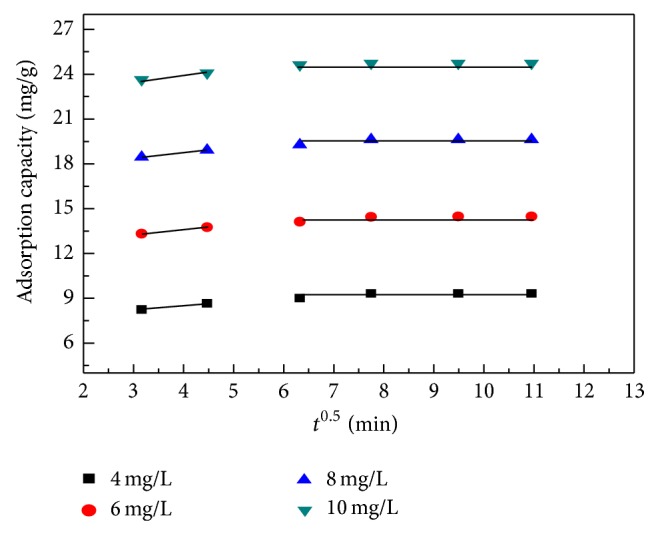
Plot of intraparticle diffusion model for MB adsorption by C. polygonoides ash at different initial dye concentrations.
In the first region the plot is linear due to mass transfer, which allows the MB molecules to be transported to the external surface of biomass through film diffusion. In this portion the adsorption is very first because of the strong interaction between the MB molecules and the external surface of the adsorbent.
After boundary-layer diffusion, the MB molecules entered through pores to the interior of the biomass by intraparticle diffusion, as reflected by the second linear portion of the plot. The stage of gradual adsorption whose rate was controlled by intraparticle diffusion was followed by a final equilibrium stage during which the intraparticle diffusion started to slow and become stagnant as the adsorbate molecules occupied all of the active sites of the adsorbent and the maximum adsorption was attained. Although all of the intraparticle diffusion plots for different initial dye concentrations provided a linear relationship, none of the line segments passed through the origin. The nonzero intercepts of the plots indicate that intraparticle diffusion is involved in the adsorption process but is not the sole rate-controlling step for the adsorption of MB. The increment of k id with increasing initial MB concentration simplifies that the increased driving force at high initial concentrations promotes intraparticle diffusion of the adsorbate onto the adsorbent.
4.6. Adsorption Mechanism of Dye
The adsorption mechanism depends on the structure of dye molecule and also the surface of adsorbent. The MB is cationic dye having amine group in its structure formula and while dissolving in water its molecule dissociated into MB+ and Cl−1. The FTIR result shows that the C. polygonoides ash has –OH group which is more exposed and has strong chemical interaction between dye ions and adsorbent and interacts mechanically because of easy penetration of dye ions to the microstructure of adsorbent.
The mechanism for adsorption of MB on adsorbent may be involving the following major steps.
(a) Migration of Dye Molecules. In this step the passage of MB molecules from bulk of the solution occurred to the surface of the adsorbent.
(b) Diffusion of Dye Molecules. In this step the diffusion of dye molecules can take place through the boundary layer to the surface of the adsorbent.
(c) Adsorption of Dye Molecules. In this step there is formation of surface hydrogen bonding between the nitrogen atom of MB and hydroxyl group of C. polygonoides ash. Figure 10 shows the proposed possible mechanism for adsorption of MB molecules on the surface of C. polygonoides ash
| (9) |
Figure 10.

Mechanism of adsorption of MB molecules on biosorbent.
(d) Intraparticle Diffusion of Dye. In this final step the dye molecules get approached inside the pores of adsorbent.
5. Conclusions
From this present research work the following main conclusions are investigated.
C. polygonoides ash is proved to be the promising biosorbent for removal of MB from aqueous solution. The percentage of removal of dye on these biosorbents is fast and adsorption equilibrium is achieved in about 60 min. More than 97% removal of MB was approached in first 60 min after that no increase in adsorption was taking place. Dye adsorption increased with the increase in the amount of adsorbate. The adsorption of MB on C. polygonoides ash adsorbent followed the pseudo-second-order kinetics models which are indicated by correlation coefficient values. A comparison of adsorption capacity of C. polygonoides ash with many other biosorbents reported in the literature indicates far better performance of C. polygonoides. Due to its low cost, high adsorption capacity, and environmentally friendly nature, C. polygonoides ash could be used as a promising adsorbent in future for effective large scale removal of MB from aqueous solution on a large scale.
Supplementary Material
Figure 1: Particle size analysis.
Figure 2: Surface area (BET).
Acknowledgments
The authors acknowledge the Department of Chemistry, University of Science and Technology, Bannu 28100, Khyber Pakhtunkhwa, Pakistan, for supporting this research work and also thankful to the Deanship of Scientific Research, King Saud University, Riyadh, for funding the work through the collaborative research work with research group Project no. RGP-210.
Conflict of Interests
The authors declare that there is no conflict of interests regarding the publication of this paper.
References
- 1.Martín-González M. A., González-Díaz O., Susial P., et al. Reuse of phoenix canariensis palm frond mulch as biosorbent and as precursor of activated carbons for the adsorption of Imazalil in aqueous phase. Chemical Engineering Journal. 2014;245:348–358. doi: 10.1016/j.cej.2014.02.050. [DOI] [Google Scholar]
- 2.Mohammed R. R., Chong M. F. Treatment and decolorization of biologically treated Palm Oil Mill Effluent (POME) using banana peel as novel biosorbent. Journal of Environmental Management. 2014;132:237–249. doi: 10.1016/j.jenvman.2013.11.031. [DOI] [PubMed] [Google Scholar]
- 3.Yagub M. T., Sen T. K., Afroze S., Ang H. M. Dye and its removal from aqueous solution by adsorption: a review. Advances in Colloid and Interface Science. 2014;209:172–184. doi: 10.1016/j.cis.2014.04.002. [DOI] [PubMed] [Google Scholar]
- 4.Roy A., Adhikari B., Majumder S. B. Equilibrium, kinetic, and thermodynamic studies of azo dye adsorption from aqueous solution by chemically modified lignocellulosic jute fiber. Industrial and Engineering Chemistry Research. 2013;52(19):6502–6512. doi: 10.1021/ie400236s. [DOI] [Google Scholar]
- 5.Christie R. Environmental Aspects of Textile Dyeing. New York, NY, USA: Elsevier; 2007. [Google Scholar]
- 6.Rafatullah M., Sulaiman O., Hashim R., Ahmad A. Adsorption of methylene blue on low-cost adsorbents: a review. Journal of Hazardous Materials. 2010;177(1–3):70–80. doi: 10.1016/j.jhazmat.2009.12.047. [DOI] [PubMed] [Google Scholar]
- 7.Chatterjee S., Kumar A., Basu S., Dutta S. Application of response surface methodology for methylene blue dye removal from aqueous solution using low cost adsorbent. Chemical Engineering Journal. 2012;181-182:289–299. doi: 10.1016/j.cej.2011.11.081. [DOI] [Google Scholar]
- 8.Kannan C., Muthuraja K., Devi M. R. Hazardous dyes removal from aqueous solution over mesoporous aluminophosphate with textural porosity by adsorption. Journal of Hazardous Materials. 2013;244-245:10–20. doi: 10.1016/j.jhazmat.2012.11.016. [DOI] [PubMed] [Google Scholar]
- 9.Chen Z., Zhang J., Fu J., et al. Adsorption of methylene blue onto poly(cyclotriphosphazene-co-4,4′-sulfonyldiphenol) nanotubes: kinetics, isotherm and thermodynamics analysis. Journal of Hazardous Materials. 2014;273:263–271. doi: 10.1016/j.jhazmat.2014.03.053. [DOI] [PubMed] [Google Scholar]
- 10.Gouamid M., Ouahrani M. R., Bensaci M. B. Adsorption equilibrium, kinetics and thermodynamics of methylene blue from aqueous solutions using date palm leaves. Energy Procedia. 2013;36:898–907. [Google Scholar]
- 11.Luo X., Zhang S., Lin X. New insights on degradation of methylene blue using thermocatalytic reactions catalyzed by low-temperature excitation. Journal of Hazardous Materials. 2013;260:112–121. doi: 10.1016/j.jhazmat.2013.05.005. [DOI] [PubMed] [Google Scholar]
- 12.Zhou C., Lee S., Dooley K., Wu Q. A facile approach to fabricate porous nanocomposite gels based on partially hydrolyzed polyacrylamide and cellulose nanocrystals for adsorbing methylene blue at low concentrations. Journal of Hazardous Materials. 2013;263, part 2:334–341. doi: 10.1016/j.jhazmat.2013.07.047. [DOI] [PubMed] [Google Scholar]
- 13.Pavan F. A., Lima E. C., Dias S. L. P., Mazzocato A. C. Methylene blue biosorption from aqueous solutions by yellow passion fruit waste. Journal of Hazardous Materials. 2008;150(3):703–712. doi: 10.1016/j.jhazmat.2007.05.023. [DOI] [PubMed] [Google Scholar]
- 14.de Oliveira Brito S. M., Andrade H. M. C., Soares L. F., de Azevedo R. P. Brazil nut shells as a new biosorbent to remove methylene blue and indigo carmine from aqueous solutions. Journal of Hazardous Materials. 2010;174(1–3):84–92. doi: 10.1016/j.jhazmat.2009.09.020. [DOI] [PubMed] [Google Scholar]
- 15.Han X., Wang W., Ma X. Adsorption characteristics of methylene blue onto low cost biomass material lotus leaf. Chemical Engineering Journal. 2011;171(1):1–8. doi: 10.1016/j.cej.2011.02.067. [DOI] [Google Scholar]
- 16.Zhang Y.-Z., Jin Y.-Q., Lü Q.-F., Cheng X.-S. Removal of copper ions and methylene blue from aqueous solution using chemically modified mixed hardwoods powder as a biosorbent. Industrial and Engineering Chemistry Research. 2014;53(11):4247–4253. doi: 10.1021/ie402370d. [DOI] [Google Scholar]
- 17.Mittal A., Gupta V. K., Malviya A., Mittal J. Process development for the batch and bulk removal and recovery of a hazardous, water-soluble azo dye (Metanil Yellow) by adsorption over waste materials (Bottom Ash and De-Oiled Soya) Journal of Hazardous Materials. 2008;151(2-3):821–832. doi: 10.1016/j.jhazmat.2007.06.059. [DOI] [PubMed] [Google Scholar]
- 18.Nieto L. M., Alami S. B. D., Hodaifa G., et al. Adsorption of iron on crude olive stones. Industrial Crops and Products. 2010;32(3):467–471. doi: 10.1016/j.indcrop.2010.06.017. [DOI] [Google Scholar]
- 19.Karthikeyan S., Gupta V. K., Boopathy R., Titus A., Sekaran G. A new approach for the degradation of high concentration of aromatic amine by heterocatalytic Fenton oxidation: Kinetic and spectroscopic studies. Journal of Molecular Liquids. 2012;173:153–163. doi: 10.1016/j.molliq.2012.06.022. [DOI] [Google Scholar]
- 20.Ahluwalia S. S., Goyal D. Microbial and plant derived biomass for removal of heavy metals from wastewater. Bioresource Technology. 2007;98(12):2243–2257. doi: 10.1016/j.biortech.2005.12.006. [DOI] [PubMed] [Google Scholar]
- 21.Ai L., Zhang C., Liao F., et al. Removal of methylene blue from aqueous solution with magnetite loaded multi-wall carbon nanotube: kinetic, isotherm and mechanism analysis. Journal of Hazardous Materials. 2011;198:282–290. doi: 10.1016/j.jhazmat.2011.10.041. [DOI] [PubMed] [Google Scholar]
- 22.Kurniawan A., Ismadji S. Potential utilization of Jatropha curcas L. press-cake residue as new precursor for activated carbon preparation: application in methylene blue removal from aqueous solution. Journal of the Taiwan Institute of Chemical Engineers. 2011;42(5):826–836. doi: 10.1016/j.jtice.2011.03.001. [DOI] [Google Scholar]
- 23.Ai L., Jiang J. Removal of methylene blue from aqueous solution with self-assembled cylindrical graphene-carbon nanotube hybrid. Chemical Engineering Journal. 2012;192:156–163. doi: 10.1016/j.cej.2012.03.056. [DOI] [Google Scholar]
- 24.Gupta V. K., Agarwal S., Saleh T. A. Chromium removal by combining the magnetic properties of iron oxide with adsorption properties of carbon nanotubes. Water Research. 2011;45(6):2207–2212. doi: 10.1016/j.watres.2011.01.012. [DOI] [PubMed] [Google Scholar]
- 25.Chen J. P., Wu S., Chong K. H. Surface modification of a granular activated carbon by citric acid for enhancement of copper adsorption. Carbon. 2003;41(10):1979–1986. doi: 10.1016/S0008-6223(03)00197-0. [DOI] [Google Scholar]
- 26.Gupta V. K., Mittal A., Kurup L., Mittal J. Adsorption of a hazardous dye, erythrosine, over hen feathers. Journal of Colloid and Interface Science. 2006;304(1):52–57. doi: 10.1016/j.jcis.2006.08.032. [DOI] [PubMed] [Google Scholar]
- 27.Wang Y., Wang X. J., Liu M., et al. Cr(VI) removal from water using cobalt-coated bamboo charcoal prepared with microwave heating. Industrial Crops and Products. 2012;39(1):81–88. doi: 10.1016/j.indcrop.2012.02.015. [DOI] [Google Scholar]
- 28.Yagub M. T., Sen T. K., Ang M. Removal of cationic dye methylene blue (MB) from aqueous solution by ground raw and base modified pine cone powder. Environmental Earth Sciences. 2014;71(4):1507–1519. doi: 10.1007/s12665-013-2555-0. [DOI] [Google Scholar]
- 29.Ofomaja A. E., Pholosi A., Naidoo E. B. Kinetics and competitive modeling of cesium biosortion onto chemically modified pine cone powder. Journal of the Taiwan Institute of Chemical Engineers. 2013;44(6):943–951. doi: 10.1016/j.jtice.2013.02.001. [DOI] [Google Scholar]
- 30.Zhang Z.-Y., Xu X.-C. Wrapping carbon nanotubes with poly (sodium 4-styrenesulfonate) for enhanced adsorption of methylene blue and its mechanism. Chemical Engineering Journal. 2014;256:85–92. doi: 10.1016/j.cej.2014.06.020. [DOI] [Google Scholar]
- 31.Nasuha N., Hameed B. H. Adsorption of methylene blue from aqueous solution onto NaOH-modified rejected tea. Chemical Engineering Journal. 2011;166(2):783–786. doi: 10.1016/j.cej.2010.11.012. [DOI] [Google Scholar]
- 32.Uddin M. T., Rukanuzzaman M., Khan M. M. R., Islam A. Jackfruit (Artocarpus heterophyllus) leaf powder: an effective adsorbent for removal of methylene blue from aqueous solutions. Indian Journal of Chemical Technology. 2009;16(2):142–149. [Google Scholar]
- 33.Hameed B. H., Mahmoud D. K., Ahmad A. L. Sorption of basic dye from aqueous solution by pomelo (Citrus grandis) peel in a batch system. Colloids and Surfaces A: Physicochemical and Engineering Aspects. 2008;316(1–3):78–84. doi: 10.1016/j.colsurfa.2007.08.033. [DOI] [Google Scholar]
- 34.Hameed B. Removal of cationic dye from aqueous solution using jackfruit peel as non-conventional low-cost adsorbent. Journal of Hazardous Materials. 2009;162(1):344–350. doi: 10.1016/j.jhazmat.2008.05.045. [DOI] [PubMed] [Google Scholar]
- 35.Khattri S., Singh M. Removal of malachite green from dye wastewater using neem sawdust by adsorption. Journal of Hazardous Materials. 2009;167(1–3):1089–1094. doi: 10.1016/j.jhazmat.2009.01.101. [DOI] [PubMed] [Google Scholar]
- 36.Ghosh D., Bhattacharyya K. G. Adsorption of methylene blue on kaolinite. Applied Clay Science. 2002;20(6):295–300. doi: 10.1016/S0169-1317(01)00081-3. [DOI] [Google Scholar]
- 37.Batzias F. A., Sidiras D. K. Dye adsorption by calcium chloride treated beech sawdust in batch and fixed-bed systems. Journal of Hazardous Materials. 2004;114(1–3):167–174. doi: 10.1016/j.jhazmat.2004.08.014. [DOI] [PubMed] [Google Scholar]
- 38.Ali H., Muhammad S. K. Biosorption of crystal violet from water on leaf biomass of Calotropis procera . Journal of Environmental Science and Technology. 2008;1:143–150. [Google Scholar]
- 39.Annadurai G., Juang R. S., Lee D. J. Use of cellulose-based wastes for adsorption of dyes from aqueous solutions. Journal of Hazardous Materials. 2002;92(3):263–274. doi: 10.1016/S0304-3894(02)00017-1. [DOI] [PubMed] [Google Scholar]
- 40.Porkodi K., Kumar K. V. Equilibrium, kinetics and mechanism modeling and simulation of basic and acid dyes sorption onto jute fiber carbon: Eosin yellow, malachite green and crystal violet single component systems. Journal of Hazardous Materials. 2007;143(1-2):311–327. doi: 10.1016/j.jhazmat.2006.09.029. [DOI] [PubMed] [Google Scholar]
- 41.Parab H., Sudersanan M., Shenoy N., Pathare T., Vaze B. Use of agro-industrial wastes for removal of basic dyes from aqueous solutions. Clean—Soil, Air, Water. 2009;37(12):963–969. doi: 10.1002/clen.200900158. [DOI] [Google Scholar]
- 42.Said A., Abd El-Wahab M., Soliman S. A., Aly A. Potential application of propionic acid modified sugarcane bagasse for removal of basic and acid dyes from industrial wastewater. Proceedings of the International Conference on Environmental Engineering and Applications (ICEEA '10); September 2010; pp. 154–156. [DOI] [Google Scholar]
- 43.Daifullah A. A. M., Girgis B. S., Gad H. M. H. Utilization of agro-residues (rice husk) in small waste water treatment plans. Materials Letters. 2003;57(11):1723–1731. doi: 10.1016/S0167-577X(02)01058-3. [DOI] [Google Scholar]
- 44.Lim L. B. L., Priyantha N., Tennakoon D. T. B., Chieng H. I., Dahri M. K., Suklueng M. Breadnut peel as a highly effective low-cost biosorbent for methylene blue: equilibrium, thermodynamic and kinetic studies. Arabian Journal of Chemistry. 2014 doi: 10.1016/j.arabjc.2013.12.018. [DOI] [Google Scholar]
- 45.Lü Q.-F., Huang Z.-K., Liu B., Cheng X. Preparation and heavy metal ions biosorption of graft copolymers from enzymatic hydrolysis lignin and amino acids. Bioresource Technology. 2012;104:111–118. doi: 10.1016/j.biortech.2011.10.055. [DOI] [PubMed] [Google Scholar]
- 46.Natarajan E., Sundaram E. G. Pyrolysis of rice husk in a fixed bed reactor. World Academy of Science, Engineering and Technology. 2009;56(32):504–508. [Google Scholar]
- 47.Gong R., Jin Y., Chen F., Chen J., Liu Z. Enhanced malachite green removal from aqueous solution by citric acid modified rice straw. Journal of Hazardous Materials. 2006;137(2):865–870. doi: 10.1016/j.jhazmat.2006.03.010. [DOI] [PubMed] [Google Scholar]
- 48.Bhattacharyya K. G., Sharma A. Azadirachta indica leaf powder as an effective biosorbent for dyes: a case study with aqueous Congo Red solutions. Journal of Environmental Management. 2004;71(3):217–229. doi: 10.1016/j.jenvman.2004.03.002. [DOI] [PubMed] [Google Scholar]
- 49.Akkaya G., Güzel F. Bioremoval and recovery of Cu(II) and Pb(II) from aqueous solution by a novel biosorbent watermelon (Citrullus lanatus) seed hulls: kinetic study, equilibrium isotherm, SEM and FTIR analysis. Desalination and Water Treatment. 2013;51(37–39):7311–7322. doi: 10.1080/19443994.2013.815685. [DOI] [Google Scholar]
- 50.AlOthman Z. A., Habila M. A., Ali R., Abdel Ghafar A., El-din Hassouna M. S. Valorization of two waste streams into activated carbon and studying its adsorption kinetics, equilibrium isotherms and thermodynamics for methylene blue removal. Arabian Journal of Chemistry. 2013 doi: 10.1016/j.arabjc.2013.05.007. [DOI] [Google Scholar]
- 51.Vieira A. P., Santana S. A. A., Bezerra C. W. B., et al. Kinetics and thermodynamics of textile dye adsorption from aqueous solutions using babassu coconut mesocarp. Journal of Hazardous Materials. 2009;166(2-3):1272–1278. doi: 10.1016/j.jhazmat.2008.12.043. [DOI] [PubMed] [Google Scholar]
- 52.Unuabonah E. I., Adie G. U., Onah L. O., Adeyemi O. G. Multistage optimization of the adsorption of methylene blue dye onto defatted Carica papaya seeds. Chemical Engineering Journal. 2009;155(3):567–579. doi: 10.1016/j.cej.2009.07.012. [DOI] [Google Scholar]
- 53.Nair V., Panigrahy A., Vinu R. Development of novel chitosan-lignin composites for adsorption of dyes and metal ions from wastewater. Chemical Engineering Journal. 2014;254:491–502. doi: 10.1016/j.cej.2014.05.045. [DOI] [Google Scholar]
- 54.Guo J.-Z., Li B., Liu L., Lv K. Removal of methylene blue from aqueous solutions by chemically modified bamboo. Chemosphere. 2014;111:225–231. doi: 10.1016/j.chemosphere.2014.03.118. [DOI] [PubMed] [Google Scholar]
- 55.Ho Y. S., Ng J. C. Y., McKay G. Kinetics of pollutant sorption by biosorbents: review. Separation and Purification Methods. 2000;29(2):189–232. doi: 10.1081/SPM-100100009. [DOI] [Google Scholar]
- 56.Gupta V. K., Pathania D., Kothiyal N. C., Sharma G. Polyaniline zirconium (IV) silicophosphate nanocomposite for remediation of methylene blue dye from waste water. Journal of Molecular Liquids. 2014;190:139–145. doi: 10.1016/j.molliq.2013.10.027. [DOI] [Google Scholar]
Associated Data
This section collects any data citations, data availability statements, or supplementary materials included in this article.
Supplementary Materials
Figure 1: Particle size analysis.
Figure 2: Surface area (BET).