

Abstract
Background
Avocados are a nutrient‐dense source of monounsaturated fatty acids (MUFA) that can be used to replace saturated fatty acids (SFA) in a diet to lower low density lipoprotein cholesterol (LDL‐C). Well‐controlled studies are lacking on the effect of avocado consumption on cardiovascular disease (CVD) risk factors.
Methods and Results
A randomized, crossover, controlled feeding trial was conducted with 45 overweight or obese participants with baseline LDL‐C in the 25th to 90th percentile. Three cholesterol‐lowering diets (6% to 7% SFA) were fed (5 weeks each): a lower‐fat diet (LF: 24% fat); 2 moderate‐fat diets (34% fat) provided similar foods and were matched for macronutrients and fatty acids: the avocado diet (AV) included one fresh Hass avocado (136 g) per day, and the moderate‐fat diet (MF) mainly used high oleic acid oils to match the fatty acid content of one avocado. Compared with baseline, the reduction in LDL‐C and non‐high‐density lipoprotein (HDL) cholesterol on the AV diet (−13.5 mg/dL, −14.6 mg/dL) was greater (P<0.05) than the MF (−8.3 mg/dL, −8.7 mg/dL) and LF (−7.4 mg/dL, −4.8 mg/dL) diets. Furthermore, only the AV diet significantly decreased LDL particle number (LDL‐P, −80.1 nmol/L, P=0.0001), small dense LDL cholesterol (LDL3+4, −4.1 mg/dL, P=0.04), and the ratio of LDL/HDL (−6.6%, P<0.0001) from baseline.
Conclusions
Inclusion of one avocado per day as part of a moderate‐fat, cholesterol‐lowering diet has additional LDL‐C, LDL‐P, and non‐HDL‐C lowering effects, especially for small, dense LDL. Our results demonstrate that avocados have beneficial effects on cardio‐metabolic risk factors that extend beyond their heart‐healthy fatty acid profile.
Clinical Trial Registration
URL: http://www.clinicaltrials.gov. Unique identifier: NCT01235832.
Keywords: avocados, cardiovascular disease, diet, fatty acids, lipids, lipoproteins, MUFA
Introduction
A heart healthy diet is recommended for primary and secondary prevention of CVD. The 2013 AHA/ACC Guideline on Lifestyle Management to Reduce Cardiovascular Risk recommends a healthy dietary pattern with 5% to 6% of calories from SFA for lowering LDL‐C, a primary target for CVD risk reduction.1 Both MUFA and PUFA are recommended as the dietary replacement for SFA.2 The food sources of MUFA in the Mediterranean diet provide many micronutrients and bioactives that also may confer cardioprotective benefits. The PREDIMED (Prevención con Dieta Mediterránea) trial reported that a Mediterranean diet supplemented with MUFA‐rich foods that included either extra‐virgin olive oil or mixed nuts (walnuts, almonds, hazelnuts) reduced the incidence of major CVD events by ≈30% after approximately 5 years in men and women (50 to 80 years of age) at high risk for CVD.3 Avocados are another nutrient‐dense source of MUFA, rich in vitamins, minerals, fiber, phytosterols and polyphenols that have not been studied extensively. The Hass variety, which is mainly consumed in the United States, is relatively high in MUFA and other fat‐soluble vitamins. One Hass avocado (136 g, without skin and the seed) contains ≈13 g of oleic acid, which is similar to the amount of oleic acid in 1.5 oz (42 g) almonds or 2 tablespoons (23 g) of olive oil.4 Based on their fatty acid and nutrient profile, avocados would be expected to beneficially affect CVD risk.
Evidence about the beneficial effects of avocados on the lipid/lipoprotein profile is based on relatively few diet studies. Studies with avocados (0.5 to 2 avocados per day) have reported similar or greater TG, LDL‐C, and TC‐lowering effects while maintaining HDL‐C compared with low‐fat, cholesterol‐lowering diets.5–10 There are several limitations, however, of previous studies that include the presence of diabetes, CVD, and other illnesses in some participants,5–8,5–11 weight‐loss during the feeding period,11 lack of control of the background diet, and variations in the diet interventions,8–9,8–12 including the length of the feeding period and diet design,6,9,12 as well as a small sample size.5,7,9–10,12 Furthermore, in these studies, avocados were a source of MUFA that was substituted for other macronutrients to evaluate only the effect of fat content on lipids and lipoproteins.
The present study evaluated the effects of avocados on traditional and novel lipid risk factors by replacing SFA with carbohydrate (CHO) or MUFA from avocados or high oleic acid oils. This diet design also enabled us to evaluate the effects of a lower fat and 2 moderate fat diets, the latter of which differed in nutrients and bioactive components provided by avocados. Therefore, we were able to further evaluate the nutrients and bioactive compounds in avocados beyond MUFA on established and emerging cardio‐metabolic risk factors.
Methods
Study Protocol
A randomized, 3‐period crossover study design was implemented. A 2‐week “run‐in” average American diet (AAD: 34% fat, 51% CHO, 16% protein [PRO]) was fed to participants before they were randomly assigned to a treatment sequence of 3 diet periods (5 weeks each) with a 2 week compliance break between diet periods. Participants were assigned to random treatment sequences that were generated by balanced permutations. The study design is presented in Figure 1. The nutrient profile and major food groups for the LF, MF, and AV diets are shown in Table 1. The LF diet was designed by replacing 6 to 7% of energy from SFA with CHO (from grains that were incorporated in the diet in place of SFA) in the AAD. Likewise, the AV and MF diets were designed by replacing 6 to 7% of energy from SFA with MUFA using either one Hass avocado (≈136 g fruit pulp, ≈13 g MUFA) per day (for the AV diet) or high oleic acid oils (eg, sunflower oil and canola oil, for the MF diet) as the main sources of MUFA. To match the macronutrients and fatty acids in the MF and AV diets, and to adjust for the different calorie levels, high oleic acid oils, low‐fat cheese, and nuts were used in both diets. About 90% of foods in the 2 diets were identical. Thus, the major difference between the nutrient profiles of the AV and MF diets were due to the bioactives from one avocado beyond its fatty acid profile.
Figure 1.

Study design: randomized, crossover controlled feeding. AAD indicates average American diet; AV, avocado diet; LF, lower‐fat diet; MF, moderate‐fat diet.
Table 1.
Nutrient Profile and Food Groups of Study Diets
| AAD | LF | MF | AV | |
|---|---|---|---|---|
| Nutrient* | ||||
| Total fat* | 34 | 24 | 34 | 34 |
| SFA* | 13 | 7 | 6 | 6 |
| MUFA* | 12 | 11 | 17 | 17 |
| PUFA* | 7 | 6 | 9 | 9 |
| Carbohydrate* | 51 | ≈59 | ≈49 | ≈49 |
| Protein* | 16 | 16 to 17 | 16 to 17 | 16 to 17 |
| Fiber* | 17 | 25 | 26 | 35 |
| Cholesterol* | 336 | <200 | <200 | <200 |
| Food groups | ||||
| Fruits, cups | 0.9 | 2.3 | 2.4 | 3.3 |
| Vegetables, cups | 0.8 | 1.4 | 1.7 | 1.7 |
| Grains, oz. | 7.2 | 7.6 | 5.5 | 5.3 |
| Whole grains, oz. | 0.5 | 4.8 | 2.6 | 2.6 |
| Meat, oz. | 2.1 | 1.6 | 1.6 | 1.6 |
| Poultry and eggs, oz. | 2.0 | 2.8 | 2.8 | 2.8 |
| Legumes, soy, nuts, and peanut butter, oz. | 1.2 | 0.6 | 1.4 | 1.4 |
| Low‐fat dairy products, cups | 1.2 | 2.3 | 2.3 | 2.0 |
| Fats and oils, oz | 0.6 | 0.33 | 0.83 | 0.53 |
AAD indicates average American diet; AV, avocado diet; LF, lower‐fat diet; MF, moderate‐fat diet; MUFA, monounsaturated fatty acids; PUFA, polyunsaturated fatty acids; SFA, saturated fatty acids.
Based on 2100 kcals/day.
% of total calories.
Grams/day.
mg/day.
Menus (6‐day rotating) were developed using Food Processor SQL software (ESHA Research, Salem, OR) for 7 calorie levels (1800 to 3600 kcals) to meet participants’ energy requirements. The Harris‐Benedict equation with a physical activity factor was used to estimate each participant's basal metabolic rate (BMR) and daily energy requirements. During the 2‐week run‐in, calorie levels were adjusted to maintain body weight. A sample menu of the 4 diets is shown in Table 2. The 3 experimental diets met current food‐based dietary recommendations13 except for dairy products in lower calorie levels (1600 to 2100 kcals), which provided around 2 servings per day. Participants were weighed daily (Monday through Friday) to assess diet compliance and ensure that body weight was maintained. Participants were asked to maintain their habitual level of physical activity throughout the study. At the end of each diet period, fasting blood samples were collected on 2 consecutive days. Serum and EDTA plasma were collected and stored at −80°C until the end of the study.
Table 2.
One Day LF, MF and AV Diet Menus*
| LF | MF | AV |
|---|---|---|
| Breakfast | ||
| Cereal, farina | Cereal, oatmeal | Cereal, oatmeal |
| Blueberries | Blueberries | Blueberries |
| Brown sugar | Almonds (sliced) | Almonds (sliced) |
| Skim milk | Skim milk | Skim milk |
| Orange juice | Orange juice | Orange juice |
| Low fat yogurt | Nonfat yogurt | Nonfat yogurt |
| Lunch | ||
| Chicken salad (roasted chicken breast, celery, dried cranberries, red bell pepper, onion, canola oil mayonnaise dressing) | Chicken salad (roasted chicken breast, celery, dried cranberries, red bell pepper, onion, canola oil mayonnaise dressing) | Chicken salad with half avocado (roasted chicken breast, celery, dried cranberries, red bell peppers, onion, fat free mayonnaise dressing, half fresh avocado) |
| Whole wheat bread | Crackers | Crackers |
| Peaches, slices | Pears | Pears |
| Dinner | ||
| Pretzels | Carrots | Carrots |
| Cereal bar | Cereal bar | Cereal bar |
| Turkey taco (Turkey patty, tortilla chips, taco seasoning, yellow sweet corn, cheddar cheese, unsalted butter) | Turkey taco (Turkey patty, tortilla chips, taco seasoning, yellow sweet corn, cheddar cheese, unsalted butter, high oleic sunflower oil) | Turkey Taco with half avocado (Turkey patty, tortilla chips, taco seasoning, yellow sweet corn, cheddar cheese, unsalted butter, half fresh avocado) |
| Snack | ||
| Apple | Apple | Apple |
| English muffin | English muffin | English muffin |
| Margarine | Margarine | Margarine |
| Jelly | ||
AV indicates avocado diet; LF, lower‐fat diet; MF, moderate‐fat diet.
One of the 6 rotating menus used in the study; all menus have 7 calorie levels (1800 to 3600 kcal).
The Institutional Review Board at the Pennsylvania State University approved the experimental protocol, and all participants signed a written informed consent.
Participants
Healthy, overweight men and women (21 to 70 years old, BMI 25 to 35 kg/m2) with LDL‐C in the 25th to 90th percentile (NHANES; 105 to 194 mg/dL for males; 98 to 190 mg/dL for females) and normal blood pressure (≤140/90 mm Hg) or well controlled with blood pressure‐lowering medication were recruited. All participants were nonsmokers, free of CVD, diabetes, liver, or renal disease, and not taking lipid‐lowering medications or supplements. After clinical screening, 54 participants were eligible and enrolled in the study. Nine participants were excluded during the 2‐week run‐in diet due to a schedule conflict, personal health issue, or inability to comply. Five participants dropped out during the study but completed as least one diet treatment (Figure 2). Study participants were predominantly Caucasian and non‐Hispanic (n=41) with 3 Asians and 1 African American. Baseline characteristics of study participants (n=45, 27 males and 18 females) are shown in Table 3. Participants’ atherosclerotic cardiovascular disease (ASCVD) risk and metabolic syndrome (MetS) criteria at baseline are shown in Table 4.
Figure 2.
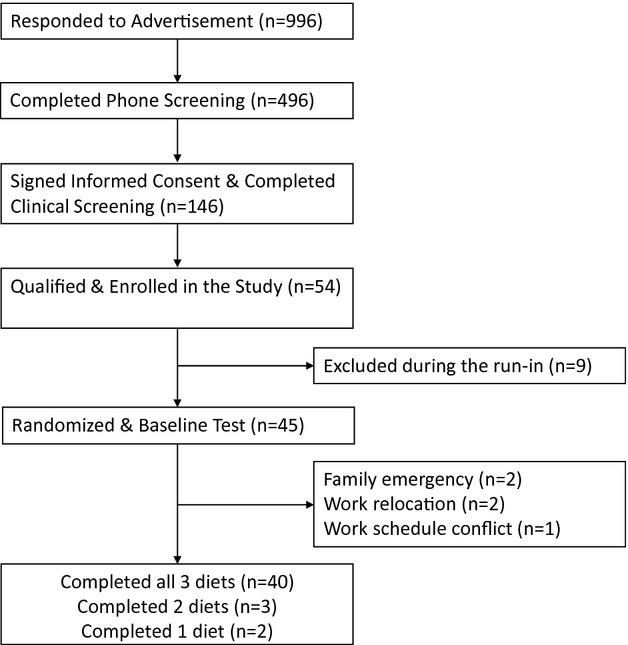
Participant recruitment flow.
Table 3.
Baseline Characteristics of Study Participants (n=45)*
| Characteristics | Mean±SD (n=45) |
|---|---|
| Age, y | 45±13.3 |
| BMI, kg/m2 | 28.2±2.4 |
| TC, mg/dL | 199.9±32.4 |
| LDL‐C, mg/dL | 128.1±26.1 |
| HDL‐C, mg/dL | 48.7±12.1 |
| TG, mg/dL | 114.0±39.6 |
| Glucose, mg/dL | 92.2±8.0 |
| Insulin, μIU/mL* | 3.5 (1.6, 6.0) |
| hsCRP, mg/L* | 0.9 (0.5, 2.4) |
| DBP, mm Hg | 79.2±7.4 |
| SBP, mm Hg | 117.2±10.4 |
BMI indicates body mass index; DBP, diastolic blood pressure; HDL‐C, high‐density lipoprotein cholesterol; hsCRP, high sensitivity C‐reactive protein; LDL‐C, low‐density lipoprotein cholesterol; SBP, systolic blood pressure; TC, total cholesterol.
Baseline values were obtained before randomization, at the end of 2 weeks run‐in AAD. All values were reported as means±SD, except for insulin and hsCRP.
hsCRP and insulin are reported as median with 25% and 75% percentile values.
Table 4.
Participants’ ASCVD Risk and MetS Criteria at Baseline
| Risk Categories | Participants at Baseline (n) |
|---|---|
| Estimated ASCVD 10‐year risk (%) (for 40 to 69 years old participants)* | |
| <5 | 18 |
| 5 to 10 | 5 |
| 10 to 20 | 3 |
| Estimated ASCVD lifetime risk (%) (for 20 to 59 years old participants)* | |
| 5 to 10 | 7 |
| 10 to 30 | 6 |
| 30 to 50 | 26 |
| MetS risk factors (n) | |
| 0 | 13 |
| 1 to 2 | 30 |
| 3 to 4 | 2 |
ASCVD risk estimate is calculated using the web based risk estimator tools. AVCSD indicates atherosclerotic cardiovascular disease; MetS, metabolic Syndrome.
The ASCVD 10‐year risk is only calculated for the 40 to 79 year range.
lifetime risk is only calculated for the 20 to 59 year range.
Laboratory Measurements
Endpoint visits took place in the Clinical Research Center (CRC) at Pennsylvania State University. Serum lipid, lipoprotein subclasses cholesterol, and apolipoproteins were assayed using Vertical Auto Profile (VAP II) (Atherotech Diagnostics Lab, Birmingham, AL), which directly measures cholesterol in all lipoprotein classes.14 Plasma lipoprotein particle number and size were assessed by a proton magnetic resonance spectroscopy assay (NMR LipoProfile III; LipoScience, Raleigh, NC), which measures the particle concentrations of lipoprotein subclasses and average particle size of lipoproteins.15
Serum high sensitivity C‐reactive protein (hsCRP) was determined by a nephelometric method utilizing latex particles coated with monoclonal antibodies; the analytical sensitivity was 0.2 mg/dL (Quest Diagnostics; assay CV <8%). Plasma fasting insulin was measured by immunoassay; fasting glucose was measured by spectrophotometry (Quest Diagnostics; assay CV was <8% for both). Blood pressure was measured 3 times by a standard mercury stadiometer (W. A. Baum Co, Copiague, NY) after sitting for 5 minutes (before the blood draw) and the average of the second and third measurements was used for the final value.
Statistical Analyses
Statistical analyses were performed with SAS (version 9.2; SAS Institute Inc) and Minitab software (version 16; Minitab Inc). The mixed models procedure (PROC MIXED) was used comparing the effects of 3 diets on the change value (from baseline) of all outcome variables. Potential carryover effects were assessed by including diet sequence, period and diet‐period interaction as a fixed effect in the model; age, BMI, sex, diet‐sex interaction were included as covariates. The Shapiro‐Wilk test was used to assess normality of residuals in the mixed model. Tukey post‐hoc test was used to adjust for multiple comparisons of 3 diets. Correlations between lipoprotein endpoints were determined using Pearson correlation coefficient analysis. Fisher's Z‐transformation was used to compare the correlations between lipid biomarkers in different diets. Non‐parametric ANOVA model were used to measure endpoints without normal distribution. Age, sex, BMI, diet sequence also were adjusted in non‐parametric models. ASCVD 10‐year and lifetime risk was calculated using the online ASCVD Risk Estimator tool (http://tools.cardiosource.org/ASCVD-Risk-Estimator/) for every participant at baseline and at the end of each diet period. The change in risk score for each diet was estimated as the median with 95% CI by the Wilcoxon Signed Rank Test. The ASCVD risk estimate is based on each participant's age, gender, race, smoking status, diabetes status, hypertension treatment, blood pressure, total cholesterol, and HDL‐C. Due to the large variation in previous avocado studies, we determined sample size based on a pistachio study that used a similar diet design (similar difference in macronutrients between the low‐fat diet and the moderate‐fat, pistachio diet).16 Using the SAS procedure PROCPOWER with PAIREDMEANS statement, a final sample size of 37 was needed to provide 95% power to detect a 10% decrease in LDL‐C by the avocado diet versus the lower‐fat diet with a 2‐tailed α=0.05. Considering a 10% to 20% dropout rate, we needed to recruit approximately 45 participants.
Results
Diet compliance was very good. Based on self‐reported monitoring, adherence for all participants was 90% as assessed by the number of days participants consumed all study foods and no non‐study foods. All participants maintained body weight during each diet period (± 2 kg).
All 3 diets significantly decreased LDL‐C and total cholesterol (TC) versus baseline (Table 5, Figure 3). Compared with the run‐in AAD diet, the LF and MF diets reduced LDL‐C (LF: −5.3%, P=0.004; MF: −5.8%; P=0.0004) and TC (LF: −4%; MF: −4.7%; P<0.01 for both) similarly. However, the reduction in LDL‐C and TC by the AV diet (−10% and −8%; P<0.0001 for both) was significantly greater (P<0.05) than the LF and MF diets. HDL‐C decreased less (P<0.05) on the MF diet and AV diet versus the LF diet. Also, the LF diet significantly increased TG and VLDL‐C by 17.6% and 10.9%, respectively (P<0.001 for both), while the MF and AV diets did not. The MF and AV diets decreased non‐HDL‐C (−5.1% and −9.3%, P<0.01 for both), but the LF diet did not. Furthermore, the AV diet elicited a greater (P=0.01) reduction in non‐HDL‐C (−9.3%, P<0.0001) versus the MF diet (−5.1%, P=0.01). TC/HDL‐C and LDL‐C/HDL‐C significantly decreased after the AV diet (−4.9% and −6.6%) and were significantly lower (P=0.04 and P<0.0001) than after the MF and LF diets. The LF diet also increased TG/HDL‐C by 27.3% (P<0.0001) from baseline, whereas the MF and AV diets had no effect on TG/HDL‐C and were significantly lower (P<0.01) than the LF diet. The AV and MF diets decreased apoB‐100 from baseline, whereas the LF diet did not. ApoA1 decreased similarly on the 3 diets. The ratio of apoB/apoA1 was decreased by the AV diet but was not affected by the MF and LF diets (Table 5, Figure 3).
Table 5.
Effect of Diets on Lipids, Lipoproteins, Apolipoproteins, Glucose, Insulin, CRP, and Blood Pressure
| Baseline AAD (n=45) | LF (n=43) | MF (n=42) | AV (n=43) | Treatment Effect (P Value) | |
|---|---|---|---|---|---|
| Cholesterol, mg/dL | |||||
| TC | 199.9±4.8 | 190.7±5.1a* | 188.7±4.4a* | 182.2±4.3b* | 0.005 |
| Non‐HDL‐C | 151.2±4.3 | 145.9±4.6a | 141.5±4.0a* | 135.3±3.8b* | <0.0001 |
| LDL‐C | 128.1±3.9 | 120.5±4.2a* | 119.0±3.7a* | 113.7±3.4b* | 0.005 |
| IDL‐C | 15.7±0.7 | 15.8±0.7a | 14.7±0.8b | 13.7±0.7b* | <0.0001 |
| LP(a) | 6.6±0.7 | 6.0±0.7a* | 6.3±0.8a,b* | 6.4±0.7b | 0.02 |
| VLDL‐C | 23.3±0.9 | 25.6±1.3a* | 22.6±0.8b | 21.7±0.9b | <0.0001 |
| HDL‐C | 48.7±1.8 | 44.8±1.5a* | 47.2±1.5b* | 46.9±1.6b* | 0.02 |
| TG, mg/dL | 114.0±5.9 | 134.3±9.8a* | 111.1±5.8b | 108.6±7.2b | 0.0005 |
| Lipoprotein ratios | |||||
| TC:HDL‐C | 4.29±0.15 | 4.41±0.16a* | 4.15±0.15b | 4.00±0.13c* | <0.0001 |
| LDL:HDL‐C | 2.78±0.12 | 2.79±0.13a | 2.64±0.12b | 2.52±0.11c* | <0.0001 |
| TG:HDL‐C | 2.54±0.17 | 3.27±0.30a* | 2.53±0.18b | 2.46±0.19b | 0.0003 |
| Apolipoproteins, mg/L | |||||
| ApoB | 101.1±2.8 | 99.0±2.9a | 95.3±2.5b* | 92.4±2.5b* | <0.0001 |
| ApoA1 | 144.6±3.0 | 138.4±2.4* | 141.8±2.7* | 140.9±2.6* | 0.08 |
| ApoB:ApoA1 | 0.71±0.02 | 0.72±0.02a | 0.68±0.02b | 0.67±0.02b* | <0.0001 |
| Glucose, mg/dL | 92.2±1.2 | 91.5±1.0 | 92.8±1.2 | 91.0±0.9 | 0.3 |
| Insulin, μIU/mL | 4.31±0.43 | 4.30±0.50 | 4.26±0.43 | 4.13±0.41 | 0.8 |
| hsCRP, mg/L | 1.48±0.23 | 1.66±0.29 | 1.43±0.25 | 1.49±0.23 | 0.3 |
| HOMA | 0.99±0.11 | 0.98±0.12 | 0.97±0.10 | 0.94±0.10 | 0.6 |
| Blood pressure, mmHg | |||||
| SBP | 117.2±1.6 | 115.0±1.3 | 115.4±1.5 | 116.6±1.5 | 0.6 |
| DBP | 79.2±1.1 | 77.7±1.1 | 78.4±1.2 | 78.0±1.1 | 0.9 |
All values are means±SEMs. AAD indicates average American diet; AV, avocado diet; DBP, diastolic blood pressure; hsCRP, high sensitive C‐reactive protein; HDL‐C, high‐density lipoprotein cholesterol; HOMA, homeostatic model assessment; IDL‐C, intermediate‐density lipoprotein cholesterol; LDL‐C, low‐density lipoprotein cholesterol; LF, lower‐fat diet; LP(a), lipoprotein(a); MF, moderate‐fat diet; SBP, systolic blood pressure; TC, total cholesterol; VLDL‐C, very‐low‐density lipoprotein cholesterol.
Significant change compared to baseline AAD, P<0.05. Values in diet treatments with different superscript letters (a, b, and c) are significantly different (Tukey post‐hoc test by SAS, P<0.05).
Figure 3.
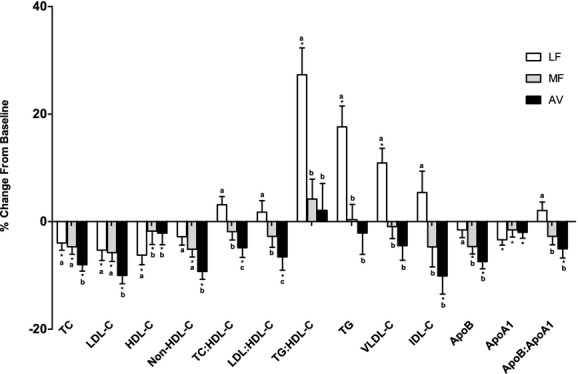
Percent change in lipids, lipoproteins, and apolipoproteins (mean±SEM) from baseline. *Represents values that are significantly different from the baseline (P<0.05). Values with different letters (a, b, and c) are significantly different (Tukey post‐hoc test by SAS, P<0.05). AV indicates avocado diet; apoA1, apolipoprotein A1; apoB, apolipoprotein B; HDL‐C, high‐density lipoprotein cholesterol; IDL‐C, intermediate‐density lipoprotein cholesterol; LDL‐C, low‐density lipoprotein cholesterol; LF, lower‐fat diet; MF, moderate‐fat diet; TC, total cholesterol; TG, triglycerides; VLDL, very‐low‐density lipoprotein.
Although LDL‐C was reduced on all three diets, the number of LDL particles (LDL‐P) did not decrease significantly after the LF and MF diets (Figure 4, Table 6). There was a trend for a reduction in LDL‐P by the MF diet (−38 nmol/L, P=0.07), however, this was significantly less (P=0.05) than the reduction by the AV diet (−80.1 nmol/L, P=0.001). The difference was due to the increase in small LDL‐P by the LF and MF diets (Table 6). Similar reductions from baseline (P<0.001 for all) in large LDL‐P were observed on the LF, MF, and AV diets. Mean LDL particle size decreased on all 3 diets: LF (−0.24 nm, P<0.0001), MF (−0.21 nm, P<0.0001), and AV (−0.12 nm, P=0.008). LDL particle size was significantly larger (P=0.03) after the AV diet compared with the LF diet (Table 6). The change in LDL particle size was highly correlated with the change in large LDL‐P (r=0.68, P<0.0001), and the change in total LDL‐P was highly correlated with the change in small LDL‐P (r=0.62, P<0.0001) (Figure 5).
Figure 4.
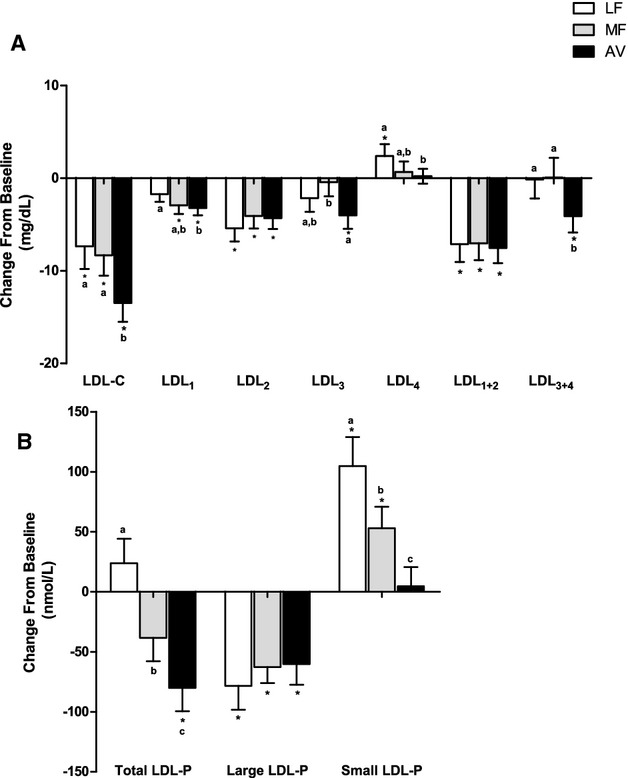
Change in LDL subclasses from baseline (mean±SEM). (A) Change in LDL subclasses cholesterol; (B) change in total, large and small LDL particle numbers. *Represents values that are significantly different from the baseline (P<0.05). Values with different letters (a, b, and c) are significantly different (Tukey post‐hoc test by SAS, P<0.05). AV indicates avocado diet; LDL‐C, low‐density lipoprotein cholesterol; LDL‐P, low‐density lipoprotein number; LF, lower‐fat diet; MF, moderate‐fat diet.
Table 6.
Effect of Diets on Lipoprotein Particle Size and Subclasses (Particle Number From NMR Lipoprofile)
| Lipoprotein Particle | Baseline AAD (n=45) | LF (n=43) | MF (n=42) | AV (n=43) | Treatment Effect (P Value) |
|---|---|---|---|---|---|
| LDL‐P, nmol/L | |||||
| Total | 1145.7±32.5 | 1168.1±38.3a | 1099.7±32.3b | 1054.6±31.4c* | <0.0001 |
| Large | 476.8±25.9 | 399.7±28.8* | 407.0±26.4* | 408.6±20.2* | 0.7 |
| Small | 557.3±32.5 | 666.5±41.5a* | 615.9±34.7b* | 561.5±31.6c | <0.0001 |
| IDL‐P, nmol/L | 111.6±8.7 | 102.0±9.3a | 76.8±6.2b* | 84.4±7.9b* | 0.0005 |
| VLDL‐P, nmol/L | |||||
| Total | 62.2±3.9 | 66.7±4.4a | 59.6±3.9a,b | 55.2±4.3b | 0.02 |
| Large | 2.9±0.4 | 4.5±0.8a* | 2.5±0.3b | 2.7±0.4b | 0.001 |
| Medium | 24.2±2.3 | 31.3±3.1a* | 24.3±2.5b | 23.5±3.1b | 0.02 |
| Small | 35.2±2.1 | 30.9±2.2* | 32.9±2.0* | 29.0±2.1* | 0.1 |
| HDL‐P, nmol/L | |||||
| Total | 30.7±0.7 | 31.3±0.7 | 31.4±0.7 | 31.4±0.6 | 0.7 |
| Large | 5.1±0.4 | 4.3±0.3* | 4.6±0.4* | 4.6±0.3* | 0.2 |
| Medium | 10.3±0.6 | 12.2±0.8* | 11.0±0.7* | 10.9±0.7* | 0.5 |
| Small | 15.3±0.5 | 14.8±0.6a | 15.9±0.5b | 15.9±0.6a,b | 0.04 |
| Average particle size, nm | |||||
| LDL | 20.87±0.08 | 20.62±0.09a* | 20.65±0.08a,b* | 20.74±0.08b* | 0.03 |
| VLDL | 44.62±0.73 | 47.18±0.98a* | 45.04±0.62b | 45.41±0.68a,b | 0.02 |
| HDL | 9.04±0.06 | 8.96±0.05* | 8.94±0.06* | 8.98±0.06* | 0.1 |
All values are means±SEMs. AAD indicates average American diet; AV, avocado diet; HDL‐P, high‐density lipoprotein particle number; IDL‐P, intermediate‐density lipoprotein particle number; LDL‐P, low‐density lipoprotein particle number; LF, lower‐fat diet; MF, moderate‐fat diet; VLDL‐P, very‐low‐density lipoprotein particle number.
Significant change compared to baseline AAD, P<0.05; Values in diet treatments with different superscript letters (a, b, and c) are significantly different (Tukey post‐hoc test by SAS, P<0.05).
Figure 5.

(A) Correlation between the change in small LDL‐P and the change in total LDL‐P; (B) correlation between the change in large LDL‐P and the change in total LDL‐P; (C) correlation between the change in small LDL‐P and the change in LDL particle size; (D) correlation between the change in large LDL‐P and the change in LDL particle size. AV indicates avocado diet; LDL‐P, low‐density lipoprotein particle number; LF, lower‐fat diet; MF, moderate‐fat diet.
The LDL subclass results from NMR and VAP profile generally concurred: We observed similar reductions in the large, buoyant LDL cholesterol (LDL1+2) on the LF, MF, and AV diets compared with baseline (P<0.0001 for all) (Table 7, Figure 4). However, only the AV diet reduced small, dense LDL cholesterol (LDL3: −4.0 mg/dL, P=0.01; LDL3+4: −4.1 mg/dL, P=0.04). The MF diet did not affect LDL3 and LDL4 whereas the LF diet increased LDL4 from baseline (Table 7). VAP LDL peak max time (lower value represents higher density of LDL particles) also decreased from baseline by the LF and MF diet, but not with the AV diet. The levels of LDL1+2 and large LDL‐P, LDL3+4 and small LDL‐P were highly correlated at baseline (r=0.71 and 0.70, P<0.0001 for both); their change values on the diets also were correlated (r=0.42 and 0.36, P<0.0001 for both) (Figure 6).
Table 7.
Effect of Diets on Lipoprotein Subclasses (Cholesterol Concentration From VAP Test)
| Baseline AAD (n=45) | LF (n=43) | MF (n=42) | AV (n=43) | Treatment Effect (P Value) | |
|---|---|---|---|---|---|
| LDL‐C, mg/dL | |||||
| LDL1 | 21.3±1.2 | 19.4±1.1a | 18.4±0.9a,b* | 17.9±1.0b* | 0.03 |
| LDL2 | 29.7±2.0 | 24.7±2.5* | 25.2±2.1* | 25.4±2.2* | 0.6 |
| LDL3 | 44.5±2.4 | 42.2±2.3a,b | 43.4±1.9b | 40.0±2.0a* | 0.01 |
| LDL4 | 10.4±1.3 | 12.6±1.6a* | 11.2±1.4a,b | 10.5±1.3b | 0.04 |
| LDL1+2 | 51.0±2.8 | 44.1±3.3* | 43.6±2.7* | 43.2±2.9* | 0.9 |
| LDL3+4 | 55.0±3.3 | 54.9±3.5a | 54.6±3.0a | 50.5±3.1b* | 0.01 |
| LDL peak max time, s | 117.0±0.5 | 115.8±0.6* | 116.2±0.5* | 116.4±0.6 | 0.4 |
| HDL‐C, mg/dL | |||||
| HDL2 | 11.6±0.7 | 10.5±0.6* | 10.9±0.6* | 10.8±0.6* | 0.6 |
| HDL3 | 36.9±1.1 | 34.2±0.9a* | 36.1±1.0b | 36.0±1.0b | 0.01 |
| VLDL‐C, mg/dL | |||||
| VLDL1+2 | 9.9±0.5 | 11.3±0.8a* | 9.5±0.5b | 9.1±0.5b | <0.0001 |
| VLDL3 | 13.3±0.4 | 14.2±0.5a* | 13.1±0.5b | 12.6±0.4b | <0.0001 |
| IDL‐C, mg/dL | |||||
| IDL1 | 4.3±0.3 | 4.7±0.3a* | 4.2±0.3b | 3.9±0.2b | <0.0001 |
| IDL2 | 11.4±0.5 | 11.1±0.5a | 10.5±0.6a,b | 9.8±0.5b* | 0.0005 |
| Remnant Lp, mg/dL | 29.0±1.1 | 30.0±1.1a* | 27.8±1.2b | 26.3±1.0b* | <0.0001 |
All values are means±SEMs. AAD indicates average American diet; AV, avocado diet; HDL, high‐density lipoprotein; IDL‐C, intermediate‐density lipoprotein cholesterol; LDL, low‐density lipoprotein; LF, lower‐fat diet; MF, moderate‐fat diet; Remnant Lp, lipoprotein remnants; VAP, vertical auto profile; VLDL‐C, very‐low‐density lipoprotein cholesterol.
Significant change compared to baseline AAD, P<0.05; Values in diet treatments with different superscript letters (a/b) are significantly different (Tukey post‐hoc test by SAS, P<0.05).
Figure 6.
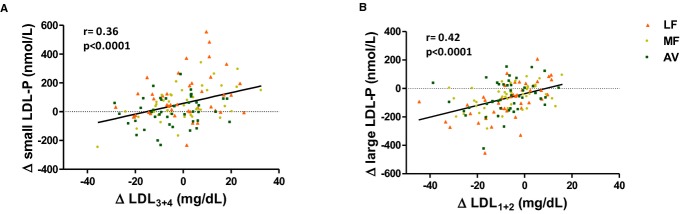
(A) Correlation between the change in small LDL‐P and the change in LDL3+4; (B) correlation between the change in large LDL‐P and the change in LDL1+2. AV indicates avocado diet; LDL, low‐density lipoprotein; LDL‐P, low‐density lipoprotein particle number; LF, lower‐fat diet; MF, moderate‐fat diet.
The LF diet increased cholesterol in VLDL1+2 and VLDL3, whereas the MF and AV diets had no affect (Table 7, Figure 7). Lipoprotein remnants (VLDL3+IDL) were decreased by the AV diet (−2.4 mg/dL, P=0.008) and increased by the LF diet (1.5 mg/dL, P=0.02). The change in VLDL subclass particle number (Table 6) was mostly consistent with VAP results except for the decrease in small VLDL‐P by the LF diet (in contrast to the increase in VLDL3), which may be due to small VLDL particles that were cholesterol enriched after the LF diet (Table 7, Figure 7). Similar to the change in VLDL1+2, large and medium VLDL‐P were increased by the LF diet, however, they were not affected by the MF and AV diets. The AV diet but not MF diet decreased small VLDL‐P from baseline (−5.8 nmol/L, P=0.001). VLDL particle size was increased by the LF diet and was significantly larger than by the MF diet (P=0.01) but not different from the AV diet (Table 6).
Figure 7.
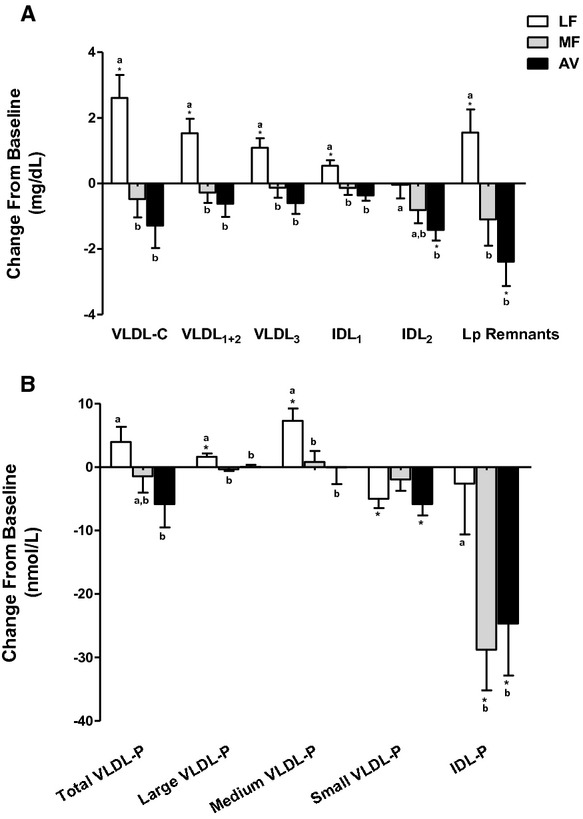
Change in VLDL and lipoprotein remnant particles—mean change value (±SEM) from baseline. (A) Change in VLDL and IDL subclasses cholesterol concentration; lipoprotein remnant particles consist of VLDL3 and IDL. (B) Change in VLDL and IDL subclasses particle number. *Values are significantly different from the baseline (P<0.05). Values with different letters are significantly different (Tukey post‐hoc test by SAS, P<0.05). AV indicates avocado diet; IDL, intermediate‐density‐lipoprotein; IDL‐P, intermediate‐density‐lipoprotein particle number; LF, lower‐fat diet; MF, moderate‐fat diet; VLDL‐C, very‐low‐density lipoprotein cholesterol; VLDL‐P, very‐low‐density lipoprotein particle number.
All diets decreased HDL2 similarly versus baseline. However, HDL3 was significantly decreased after the LF diet but not after the MF and AV diets (Table 7). Unlike HDL‐C, the total HDL‐P was not affected by all diets (Table 6). Large HDL‐P was decreased similarly by all diets (P<0.001). After the LF diet, there was a trend for small HDL‐P to be lower than the MF (P=0.06) and AV diets (P=0.08), which is consistent with the HDL3 change (Tables 6 and 7). HDL particle size was slightly decreased by the LF (−0.07 nm), MF (−0.1 nm), and AV (−0.01 nm) diets versus baseline (P<0.01 for all) (Table 6).
Fasting hsCRP, insulin, glucose, HOMA (homeostatic model assessment) score, systolic and diastolic blood pressure were not affected by any diet (Table 5).
Discussion
This study is the first randomized controlled feeding trial to our knowledge to evaluate the additional LDL‐C lowering effect of avocados beyond their MUFA content. This also is the first feeding study to use 2 advanced lipid‐testing methods to evaluate the effects of LF versus MF diets on lipoprotein subclass changes. Our results demonstrate greater benefits on lipid/lipoprotein profiles when SFA is replaced by MUFA than CHO, which is consistent with current dietary recommendations.17 An important finding we observed is that the AV diet lowered LDL‐C, TC, LDL‐P, non‐HDL‐C, TC/HDL‐C, and LDL/HDL‐C significantly more than the MF diet. This has important implications for future research that needs to be conducted to determine the functional effects of fruits and vegetables on lipid/lipoprotein risk factors that are independent of the substitution of macronutrients. In our study, both VAP and NMR analyses demonstrated that the LF, AV, and MF diets decreased large, buoyant LDL (LDL1+2, large LDL‐P) similarly; however, only the AV diet significantly decreased cholesterol in small, dense LDL (sdLDL) and lipoprotein remnants from baseline, and lowered small LDL‐P concentration compared to the MF and LF diets. The MF diet did not have the same benefit as the AV diet, which clearly indicates that other nutrients/bioactives beyond fatty acids contribute to the health benefits of avocados. We hasten to add that the MF diet did have beneficial effects but, importantly, the nutrient‐dense food source of MUFA (ie, an avocado) had superior effects. Of note, is that the MUFA literature is variable with respect to cardiovascular effects18 which may reflect the food source(s) of MUFA used. Identifying other nutrient‐dense foods that contain MUFA that confer additional cardiovascular benefits, or other nutrient‐dense foods (ie, fruits and vegetables) that can be consumed with high MUFA oils will be important for evolving future dietary guidance.
The effects of the AV diet on sdLDL may be due to the combined effects of MUFA and other bioactives, especially phytosterols and fiber. Avocados are the richest fruit source of β‐sitosterol; one Hass avocado (136 g) provides 114 mg of plant sterols, and 100 g provides 2.11 g soluble fiber and 2.7 g insoluble fiber.19 Avocados also contain a unique seven‐carbon (C7) ketosugar—mannoheptulose and its polyol form perseitol (about 4 g per fruit), which may suppress insulin secretion and promote calorie restriction.20–21 Sialvera et al reported that plant sterol supplementation (4 g per day for 2 months) decreased sdLDL cholesterol in MetS patients on a western diet22; Lamarche et al also reported that including plant sterols (1 g per 1000 kcals), viscous fiber (9 g per 1000 kcals), soybean protein and almonds in a low‐SFA diet for 4 weeks decreased sdLDL cholesterol (−21%, P<0.01) in patients with mildly elevated LDL‐C.23 Daily consumption of high‐fiber oat cereal providing 14 g dietary fiber/day for 12 weeks decreased sdLDL cholesterol (−17.3%, P<0.05) in overweight men.24 Although the combination of fiber and plant sterols in avocados may contribute to the effect, there may be other bioactives and nutrients that also contribute because of the relatively lower dose of fiber and plant sterols delivered by one avocado compared to other supplementation studies. Dietary MUFA has been associated with lower sdLDL when substituted for SFA, although the results reported are inconsistent.25–27 Gill et al reported that LDL3 was 25% lower after a high‐MUFA diet (13.7% energy) versus a low‐MUFA diet (7.8% energy) in hypercholesterolemic participants.25 Kratz et al reported that a high MUFA diet (38.7% energy from fat, 23.2% energy from MUFA) provided by refined olive oil significantly reduced LDL peak particle diameter (−0.36 nm, P=0.012) versus a high SFA diet (16% energy from SFA).26 In another study there was no effect of replacing SFA with MUFA on LDL particle size.27 In the PREDIMED study, nuts but not olive oil supplementation in a Mediterranean diet significantly decreased small LDL‐P.28 Nuts also are a good source of MUFA, phytosterols, and viscous fiber. However, the effect of nuts on sdLDL is unclear. Only one study showed that the addition of walnuts to free‐living subjects’ habitual diets elicited a 13% reduction in the number of sdLDL particles.29 Lamarche et al showed that a dietary portfolio that incorporated plant sterols, soy protein, viscous fiber, and almonds decreased sdLDL by 21% (P<0.01).23 Holligan et al reported a significant decrease in sdLDL cholesterol after consumption of a moderate fat diet including 2 servings/day of pistachios in healthy adults with high LDL‐C.30 One explanation for the inconsistent results is that there might be some synergistic effects of the dietary fiber, plant sterols, MUFA, and other bioactive compounds or nutrients in specific foods and different background diets. Further studies are needed to characterize the bioactives in avocados and investigate the mechanisms by which avocados affect sdLDL production.
The prediction of CVD risk by the 2013 Prevention Guidelines ASCVD Risk Estimator showed significant improvement for overall 10 year and lifetime risk by the MF and AV diets but not the LF diet (Table 8). The predicted reduction in CHD risk by the AV diet could be greater due to changes in non‐HDL‐C, apoB, LDL‐P, sdLDL, lipoprotein remnants, and lipid/lipoprotein ratios. Recent clinical studies have found that the LDL‐attributable atherosclerotic risk is better predicted by LDL‐P and sdLDL than by using standard lipid/lipoprotein measurements31–37 in patients at high risk for MetS and/or diabetes. Furthermore, sdLDL and total LDL‐P have potential importance for comprehensively monitoring the efficacy of lifestyle interventions on CVD risk.38 In the present study, sdLDL concentration was correlated with an atherogenic lipid/lipoprotein profile, which tracks with atherogenic dyslipidemia39 (Figure 8). Importantly, in our study, larger LDL particles and LDL‐C decreased similarly by the LF, MF, and AV diets, which indicate all 3 diets would decrease risk of cardiovascular disease. However, because of the effects of the LF diet on TG and HDL‐C, there was no benefit on 10‐year and lifetime risk of ASCVD. Although the long‐term benefit of LF diet versus AAD was not tested in our study, this is another illustration of the importance of replacing saturated fat with unsaturated fat, ie, MUFA as reported herein.
Table 8.
Predicted Changes in ASCVD Risk by the Three Diets
| Baseline ADD* | LF (∆)* | MF (∆)* | AV (∆)* | |
|---|---|---|---|---|
| Estimated ASCVD 10‐year Risk (%) (for 40 to 69 years old participants) | 2.7 (1.0, 6.3) | −0.05 (CI: −0.35, 0.1) P=0.44 | −0.15 (CI: −0.3, 0) P=0.068 | −0.15 (CI: −0.45, 0) P=0.035 |
| Estimated ASCVD lifetime Risk (%) (for 20 to 59 years old participants) | 36 (27, 46) | 0.0 (CI: −5.0, 0) P=0.2 | −5.0 (CI: −6.0, 0) P=0.006 | −2.5 (CI: −9.5, 0) P=0.04 |
AAD indicates average American diet; AV, avocado diet; AVCSD, atherosclerotic cardiovascular disease; LF, lower‐fat diet; MF, moderate‐fat diet.
Risk at baseline was reported as median with 25% and 75% percentile values.
The change in risk from baseline is the estimated median with 95% CI by the Wilcoxon Signed Rank Test. P<0.05 represents the median change value is significantly negative (<0).
Figure 8.

Correlations between LDL subclasses and TG, VLDL‐C, and HDL‐C. (A) Correlations between LDL3+4 and TG, LDL1+2 and TG; (B) correlations between LDL3+4 and VLDL‐C, LDL1+2 and VLDL‐C; (C) correlations between LDL3+4 and HDL‐C, LDL1+2 and HDL‐C. AAD indicates average American diet; AV, avocado diet; HDL‐C, high‐density lipoprotein cholesterol; LDL‐C, low‐density lipoprotein cholesterol; LF, lower‐fat diet; MF, moderate‐fat diet; TG, triglycerides; VLDL‐C, very‐low‐density lipoprotein cholesterol.
The change in LDL particle size and subclasses due to the MF and AV diets we observed differs from some Mediterranean diet studies. In PREDIMED study, the Mediterranean diet supplemented with nuts significantly increased LDL size (0.2 nmol/l) and large LDL‐P (53.8 nmol/L), and decreased very small LDL‐P (−111 nmol/L) in a sub‐group of subjects (n=156) at high CVD risk.28 Richard et al reported that consumption of a Mediterranean diet for 5 weeks decreased small LDL particles (−11.7%), and increased LDL peak particle size (0.18 nm) compared with an isoenergetic North American control diet (5 weeks).40 In our study, both the MF and AV diets significantly decreased large LDL‐P and LDL particle size. These differences may reflect the higher fat content and other foods/nutrients in the Mediterranean diet. Also, unlike the Mediterranean diet studies, our participants were at lower risk for MetS and CHD (Table 4), thereby demonstrating benefits of the diets we studied for the primary prevention of CVD.
Several studies have demonstrated that non‐HDL‐C is a better predictor of CVD risk compared with LDL‐C because it takes into account the atherogenic VLDL and LP remnant particles.41–43 In our study, the AV and MF diets significantly decreased non‐HDL‐C and apoB compared to baseline while the LF diet did not. This reflects an increase in VLDL and IDL by the LF diet. VLDL and IDL, especially the small, dense Lp remnant particles, are independently associated with the prediction, progression, and residual risk of CVD.44–45 Also, the reduction of TG/HDL‐C by the MF and AV diet (compared to the LF diet) indicated a beneficial effect of MUFA on insulin sensitivity. It must be appreciated that most participants in our study did not have MetS (even though they were at risk because they were overweight or obese), and the prediction value of advanced lipid measures versus standard lipid/lipoprotein needs to be further evaluated in different populations in longer‐term intervention studies.
HDL‐C was decreased by all diets in our study, but total HDL‐P did not change. The MESA study (Multi‐Ethnic Study of Atherosclerosis) reported that HDL‐P but not HDL‐C was independently associated with CHD after adjusting for LDL‐P and other confounding factors.46 In our study, the LF diet decreased HDL3, which is important for cholesterol efflux and may be up‐regulated by MUFA.46–47 Moreover, small, dense HDL3 particles may protect LDL against oxidation48–49and attenuate apoptosis in endothelial cells as shown in recent studies.50 Studies are needed to determine if HDL functionality is improved by a moderate fat diet with avocados.
The current study has several strengths. It was a well‐controlled clinical trial and we achieved a high level of diet compliance, weight maintenance, and had a low dropout rate. The latter is attributable to the run‐in diet period, which familiarized participants with the study.51 Moreover, our study was designed to differentiate the effects of bioactive compounds in avocados beyond fatty acids. One limitation of our study design is that one avocado per day contributed a different percentage of energy over different calorie levels (7% to 13% over the 6 calorie levels). Another limitation is that our study participants did not lose weight, which is the first line of treatment for overweight/obesity. Clearly, weight loss would elicit beneficial effects on lipids/lipoproteins and CVD risk status. Nonetheless, for individuals who do not lose weight, we have shown that a moderate fat diet high in MUFA, especially from one avocado per day has beneficial effects on lipids/lipoproteins and CVD risk status. Finally, our participants did not represent the ethnic diversity of the U.S. population.
Conclusion
Our study has shown that one Hass avocado per day has beneficial effects beyond their fatty acid profile on decreasing LDL‐C and other emerging CVD risk factors. Herein, we present new information that a moderate fat diet low in SFA and high in MUFA from an avocado daily achieved greater reductions in LDL‐C, sdLDL‐C, LDL‐P, non‐HDL‐C, LDL/HDL‐C, and TC/HDL‐C than a high MUFA diet with a similar macronutrient and fatty acid profile. Thus, inclusion of a food source rich in MUFA and bioactives confers additional CVD benefits compared to a MUFA‐matched, low SFA diet.
Author Contributions
The authors responsibilities were as follows—Wang, Fleming, Hill, and Kris‐Etherton: designed the research and wrote the manuscript; Wang, Bordi, Fleming, and Kris‐Etherton: conducted the clinical trial; Wang: collected samples, analyzed data and performed statistical analysis; Kris‐Etherton and Wang: had primary responsibility for the final content of the manuscript; and all authors: read and approved the final manuscript. Wang, Bordi, Fleming, Hill, and Kris‐Etherton reported no conflict of interest in this study.
Sources of Funding
Supported by a grant from the Hass Avocado Board, which had no role in the design and conduct of the study; in the collection, analysis, and interpretation of the data; or in the preparation, review, or approval of the manuscript. The clinical trial was also supported by the National Center for Research Resources, Grant UL1 RR033184, and is now at the National Center for Advancing Translational Sciences, Grant UL1 TR000127. The content is solely the responsibility of the authors and does not necessarily represent the official views of the NIH.
Disclosures
Dr Kris‐Etherton is a member of the Avocado Nutrition Science Advisory.
Acknowledgments
The authors sincerely thank Devon Bordi, Marcella Smith, Tracey Banks, Dr Mosuk Chow, and Ningtao Wang, who provided excellent assistance in the clinical trial implementation and statistical analyses. We also thank LipoScience Inc, for assistance with the NMR LipoProfile test.
References
- 1.Eckel RH, Jakicic JM, Ard JD, Miller NH, Hubbard VS, Nonas CA, de Jesus JM, Sacks FM, Lee I‐M, Lichtenstein AH, Loria CM, Millen BE, Miller NH, Nonas CA, Sacks FM, Smith SC, Jr, Svetkey LP, Wadden TW, Yanovski SZ. AHA/ACC guideline on lifestyle management to reduce cardiovascular risk: a report of the ACC/AHA task force on practice guidelines. Circulation. 2013; 2013:1524-4539. [Google Scholar]
- 2.Moreno JJ, Mitjavila MT. The degree of unsaturation of dietary fatty acids and the development of atherosclerosis (review). J Nutr Biochem. 2003; 14:182-195. [DOI] [PubMed] [Google Scholar]
- 3.Estruch R, Ros E, Salas‐Salvadó J, Covas M‐I, Corella D, Arós F, Gómez‐Gracia E, Ruiz‐Gutiérrez V, Fiol M, Lapetra J. Primary prevention of cardiovascular disease with a Mediterranean diet. N Engl J Med. 2013; 368:1279-1290. [DOI] [PubMed] [Google Scholar]
- 4.Dreher ML, Davenport AJ. Hass avocado composition and potential health effects. Crit Rev Food Sci Nutr. 2012; 53:738-750. [DOI] [PMC free article] [PubMed] [Google Scholar]
- 5.Carranza‐Madrigal J, Herrera‐Abarca JE, Alvizouri‐Muoz M, Alvarado‐Jimenez MR, Chavez‐Carbajal F. Effects of a vegetarian diet vs. A vegetarian diet enriched with avocado in hypercholesterolemic patients. Arch Med Res. 1997; 28:537-542. [PubMed] [Google Scholar]
- 6.López Ledesma R, Frati Munari AC, Hernández Domínguez BC, Cervantes Montalvo S, Hernández Luna MH, Juárez C, Morán Lira S. Monounsaturated fatty acid (avocado) rich diet for mild hypercholesterolemia. Arch Med Res. 1996; 27:519-523. [PubMed] [Google Scholar]
- 7.Carranza J, Alvizouri M, Alvarado M, Chavez F, Gomez M, Herrera J. Effects of avocado on the level of blood lipids in patients with phenotype II and IV dyslipidemias. Arch Inst Cardiol Mex. 1995; 65:342-348. [PubMed] [Google Scholar]
- 8.Lerman‐Garber I, Ichazo‐Cerro S, Zamora‐González J, Cardoso‐Saldaña G, Posadas‐Romero C. Effect of a high‐monounsaturated fat diet enriched with avocado in NIDDM patients. Diabetes Care. 1994; 17:311-315. [DOI] [PubMed] [Google Scholar]
- 9.Colquhoun D, Moores D, Somerset SM, Humphries JA. Comparison of the effects on lipoproteins and apolipoproteins of a diet high in monounsaturated fatty acids, enriched with avocado, and a high‐carbohydrate diet. Am J Clin Nutr. 1992; 56:671-677. [DOI] [PubMed] [Google Scholar]
- 10.Alvizouri‐Muñoz M, Carranza‐Madrigal J, Herrera‐Abarca J, Chavez‐Carbajal F, Amezcua‐Gastelum J. Effects of avocado as a source of monounsaturated fatty acids on plasma lipid levels. Arch Med Res. 1992; 23:163-167. [PubMed] [Google Scholar]
- 11.Pieterse Z, Jerling J, Oosthuizen W, Kruger H, Hanekom S, Smuts C, Schutte A. Substitution of high monounsaturated fatty acid avocado for mixed dietary fats during an energy‐restricted diet: effects on weight loss, serum lipids, fibrinogen, and vascular function. Nutrition. 2005; 21:67-75. [DOI] [PubMed] [Google Scholar]
- 12.Grant WC. Influence of avocados on serum cholesterol. Proc Soc Exp Biol Med. 1960; 104:45-47. [DOI] [PubMed] [Google Scholar]
- 13.US Department of Health and Human Services and the US Department of Agriculture. Report of the Dietary Guidelines Advisory Committee on the Dietary Guidelines for Americans , 2010;PartD.
- 14.Kulkarni K. Cholesterol profile measurement by vertical auto profile method. Clin Lab Med. 2006; 26:787-802. [DOI] [PubMed] [Google Scholar]
- 15.Otvos JD. Measurement of lipoprotein subclass profiles by nuclear magnetic resonance spectroscopy. Clin Lab. 2001; 48:171-180. [PubMed] [Google Scholar]
- 16.Gebauer SK, West SG, Kay CD, Alaupovic P, Bagshaw D, Kris‐Etherton PM. Effects of pistachios on cardiovascular disease risk factors and potential mechanisms of action: a dose‐response study. Am J Clin Nutr. 2008; 88:651-659. [DOI] [PubMed] [Google Scholar]
- 17.Stone NJ, Robinson J, Lichtenstein AH, Merz CNB, Lloyd‐Jones DM, Blum CB, McBride P, Eckel RH, Schwartz JS, Goldberg AC. ACC/AHA guideline on the treatment of blood cholesterol to reduce atherosclerotic cardiovascular risk in adults ‐ a report of the ACC/AHA task force on practice guidelines. J Am Coll Cardiol. 2013; 2013:1524-4539. [DOI] [PubMed] [Google Scholar]
- 18.Jakobsen MU, O'Reilly EJ, Heitmann BL, Pereira MA, Bälter K, Fraser GE, Goldbourt U, Hallmans G, Knekt P, Liu S. Major types of dietary fat and risk of coronary heart disease: a pooled analysis of 11 cohort studies. Am J Clin Nutr. 2009; 89:1425-1432. [DOI] [PMC free article] [PubMed] [Google Scholar]
- 19.Hirasawa M, Shimura K, Shimizu A, Mura K, Tokue C, Arai S. Quantification and functional analysis of dietary fiber and polyphenols in avocado [Persea americana]. J Jpn Soc Food Sci Technol. 2008; 55:95-101. [Google Scholar]
- 20.Ladrière L, Leclercq‐Meyer V, Malaisse WJ. Assessment of islet β‐cell mass in isolated rat pancreases perfused with D‐[3 h] mannoheptulose. Am J Physiol Endocrinol Metab. 2001; 281:E298-E303. [DOI] [PubMed] [Google Scholar]
- 21.Liu X, Sievert J, Arpaia ML, Madore MA. Postulated physiological roles of the seven‐carbon sugars, mannoheptulose, and perseitol in avocado. J Am Soc Hortic Sci. 2002; 127:108-114. [Google Scholar]
- 22.Sialvera T, Pounis G, Koutelidakis A, Richter D, Yfanti G, Kapsokefalou M, Goumas G, Chiotinis N, Diamantopoulos E, Zampelas A. Phytosterols supplementation decreases plasma small and dense LDL levels in metabolic syndrome patients on a westernized type diet. Nutr Metab Cardiovasc Dis. 2011; 22:843-848. [DOI] [PubMed] [Google Scholar]
- 23.Lamarche B, Desroches S, Jenkins DJ, Kendall CW, Marchie A, Faulkner D, Vidgen E, Lapsley KG, Trautwein EA, Parker TL. Combined effects of a dietary portfolio of plant sterols, vegetable protein, viscous fibre and almonds on LDL particle size. Br J Nutr. 2004; 92:657-663. [DOI] [PubMed] [Google Scholar]
- 24.Davy BM, Davy KP, Ho RC, Beske SD, Davrath LR, Melby CL. High‐fiber oat cereal compared with wheat cereal consumption favorably alters LDL‐cholesterol subclass and particle numbers in middle‐aged and older men. Am J Clin Nutr. 2002; 76:351-358. [DOI] [PubMed] [Google Scholar]
- 25.Gill JM, Brown JC, Caslake MJ, Wright DM, Cooney J, Bedford D, Hughes DA, Stanley JC, Packard CJ. Effects of dietary monounsaturated fatty acids on lipoprotein concentrations, compositions, and subfraction distributions and on VLDL apolipoprotein B kinetics: dose‐dependent effects on LDL. Am J Clin Nutr. 2003; 78:47-56. [DOI] [PubMed] [Google Scholar]
- 26.Kratz M, Gülbahçe E, von Eckardstein A, Cullen P, Cignarella A, Assmann G, Wahrburg U. Dietary mono‐and polyunsaturated fatty acids similarly affect LDL size in healthy men and women. J Nutr. 2002; 132:715-718. [DOI] [PubMed] [Google Scholar]
- 27.Rivellese AA, Maffettone A, Vessby B, Uusitupa M, Hermansen K, Berglund L, Louheranta A, Meyer BJ, Riccardi G. Effects of dietary saturated, monounsaturated and n‐3 fatty acids on fasting lipoproteins, LDL size and post‐prandial lipid metabolism in healthy subjects. Atherosclerosis. 2003; 167:149-158. [DOI] [PubMed] [Google Scholar]
- 28.Damasceno NR, Sala‐Vila A, Cofán M, Pérez‐Heras AM, Fitó M, Ruiz‐Gutiérrez V, Martínez‐González M‐Á, Corella D, Arós F, Estruch R. Mediterranean diet supplemented with nuts reduces waist circumference and shifts lipoprotein subfractions to a less atherogenic pattern in subjects at high cardiovascular risk. Atherosclerosis. 2013; 230:347-353. [DOI] [PubMed] [Google Scholar]
- 29.Almario RU, Vonghavaravat V, Wong R, Kasim‐Karakas SE. Effects of walnut consumption on plasma fatty acids and lipoproteins in combined hyperlipidemia. Am J Clin Nutr. 2001; 74:72-79. [DOI] [PubMed] [Google Scholar]
- 30.Holligan SD, West SG, Gebauer SK, Kay CD, Kris‐Etherton PM. A moderate‐fat diet containing pistachios improves emerging markers of cardiometabolic syndrome in healthy adults with elevated LDL levels. Br J Nutr. 2014; 112:744-752. [DOI] [PubMed] [Google Scholar]
- 31.Williams PT, Zhao X‐Q, Marcovina SM, Brown BG, Krauss RM. Levels of cholesterol in small LDL particles predict atherosclerosis progression and incident chd in the HDL‐atherosclerosis treatment study (HATS). PLoS One. 2013; 8:e56782. [DOI] [PMC free article] [PubMed] [Google Scholar]
- 32.Ai M, Otokozawa S, Asztalos BF, Ito Y, Nakajima K, White CC, Cupples LA, Wilson PW, Schaefer EJ. Small dense LDL cholesterol and coronary heart disease: results from the Framingham Offspring Study. Clin Chem. 2010; 56:967-976. [DOI] [PMC free article] [PubMed] [Google Scholar]
- 33.Hoogeveen RC, Gaubatz JW, Sun W, Dodge RC, Crosby JR, Jiang J, Couper D, Virani SS, Kathiresan S, Boerwinkle E. Small dense low‐density lipoprotein‐cholesterol concentrations predict risk for coronary heart disease the atherosclerosis risk in communities (ARIC) study. Arterioscler Thromb Vac Biol. 2014; 34:1069-1077. [DOI] [PMC free article] [PubMed] [Google Scholar]
- 34.Tsai MY, Steffen BT, Guan W, McClelland RL, Warnick R, McConnell J, Hoefner DM, Remaley AT. New automated assay of small dense low‐density lipoprotein cholesterol identifies risk of coronary heart disease in the Multi‐Ethnic Study of Atherosclerosis. Arterioscler Thromb Vac Biol. 2014; 34:196-201. [DOI] [PMC free article] [PubMed] [Google Scholar]
- 35.Cromwell WC, Otvos JD, Keyes MJ, Pencina MJ, Sullivan L, Vasan RS, Wilson PW, D'Agostino RB. LDL particle number and risk of future cardiovascular disease in the Framingham Offspring Study‐implications for LDL management. J Clin Lipidol. 2007; 1:583-592. [DOI] [PMC free article] [PubMed] [Google Scholar]
- 36.Otvos JD, Mora S, Shalaurova I, Greenland P, Mackey RH, Goff DC., Jr Clinical implications of discordance between low‐density lipoprotein cholesterol and particle number. J Clin Lipidol. 2011; 5:105-113. [DOI] [PMC free article] [PubMed] [Google Scholar]
- 37.Mora S, Buring JE, Ridker PM. Discordance of LDL cholesterol with alternative LDL‐related measures and future coronary events. Circulation. 2014; 129:553-561. [DOI] [PMC free article] [PubMed] [Google Scholar]
- 38.Goldberg R, Temprosa M, Otvos J, Brunzell J, Marcovina S, Mather K, Arakaki R, Watson K, Horton E, Barrett‐Connor E. Lifestyle and metformin treatment favorably influence lipoprotein subfraction distribution in the diabetes prevention program. J Clin Endocrinol Metab. 2013; 98:3989-3998. [DOI] [PMC free article] [PubMed] [Google Scholar]
- 39.Austin MA, King M‐C, Vranizan KM, Krauss RM. Atherogenic lipoprotein phenotype A proposed genetic marker for coronary heart disease risk. Circulation. 1990; 82:495-506. [DOI] [PubMed] [Google Scholar]
- 40.Richard C, Couture P, Ooi EM, Tremblay AJ, Desroches S, Charest A, Lichtenstein AH, Lamarche B. Effect of Mediterranean diet with and without weight loss on apolipoprotein B100 metabolism in men with metabolic syndrome. Arterioscler Thromb Vac Biol. 2014; 34:433-438. [DOI] [PubMed] [Google Scholar]
- 41.Ridker PM, Rifai N, Cook NR, Bradwin G, Buring JE. Non‐HDL cholesterol, apolipoproteins A1 and B100, standard lipid measures, lipid ratios, and CRP as risk factors for cardiovascular disease in women. JAMA. 2005; 294:326-333. [DOI] [PubMed] [Google Scholar]
- 42.Packard C, Saito Y. Non‐HDL cholesterol as a measure of atherosclerotic risk. J Atheroscler Thromb. 2003; 11:6-14. [DOI] [PubMed] [Google Scholar]
- 43.Boekholdt SM, Arsenault BJ, Mora S, Pedersen TR, LaRosa JC, Nestel PJ, Simes RJ, Durrington P, Hitman GA, Welch K. Association of LDL cholesterol, non‐HDL cholesterol, and apolipoprotein B levels with risk of cardiovascular events among patients treated with statins: a meta‐analysis. JAMA. 2012; 307:1302-1309. [DOI] [PubMed] [Google Scholar]
- 44.Nakamura T, Obata J‐E, Hirano M, Kitta Y, Fujioka D, Saito Y, Kawabata K‐I, Watanabe K, Watanabe Y, Mishina H. Predictive value of remnant lipoprotein for cardiovascular events in patients with coronary artery disease after achievement of LDL‐cholesterol goals. Atherosclerosis. 2011; 218:163-167. [DOI] [PubMed] [Google Scholar]
- 45.Kugiyama K, Doi H, Takazoe K, Kawano H, Soejima H, Mizuno Y, Tsunoda R, Sakamoto T, Nakano T, Nakajima K. Remnant lipoprotein levels in fasting serum predict coronary events in patients with coronary artery disease. Circulation. 1999; 99:2858-2860. [DOI] [PubMed] [Google Scholar]
- 46.Mackey RH, Greenland P, Goff DC, Lloyd‐Jones D, Sibley CT, Mora S. High‐density lipoprotein cholesterol and particle concentrations, carotid atherosclerosis, and coronary events in MESA (Multi‐Ethnic Study of Atherosclerosis). J Am Coll Cardiol. 2012; 60:508-516. [DOI] [PMC free article] [PubMed] [Google Scholar]
- 47.Sola R, Motta C, Maille M, Bargallo M, Boisnier C, Richard J, Jacotot B. Dietary monounsaturated fatty acids enhance cholesterol efflux from human fibroblasts. Relation to fluidity, phospholipid fatty acid composition, overall composition, and size of HDL3. Arterioscler Thromb. 1993; 13:958-966. [DOI] [PubMed] [Google Scholar]
- 48.Kontush A, Chapman MJ. Antiatherogenic function of HDL particle subpopulations: focus on antioxidative activities. Curr Opin Lipidol. 2010; 21:312-318. [DOI] [PubMed] [Google Scholar]
- 49.Davidson WS, Silva RGD, Chantepie S, Lagor WR, Chapman MJ, Kontush A. Proteomic analysis of defined HDL subpopulations reveals particle‐specific protein clusters relevance to antioxidative function. Arterioscler Thromb Vac Biol. 2009; 29:870-876. [DOI] [PMC free article] [PubMed] [Google Scholar]
- 50.De Souza JA, Vindis C, Nègre‐Salvayre A, Rye KA, Couturier M, Therond P, Chantepie S, Salvayre R, Chapman MJ, Kontush A. Small, dense HDL3 particles attenuate apoptosis in endothelial cells: pivotal role of apolipoprotein A‐I. J Cell Mol Med. 2010; 14:608-620. [DOI] [PMC free article] [PubMed] [Google Scholar]
- 51.Landers PS, Landers TL. Survival analysis of dropout patterns in dieting clinical trials. J Am Diet Assoc. 2004; 104:1586-1588. [DOI] [PubMed] [Google Scholar]