Abstract
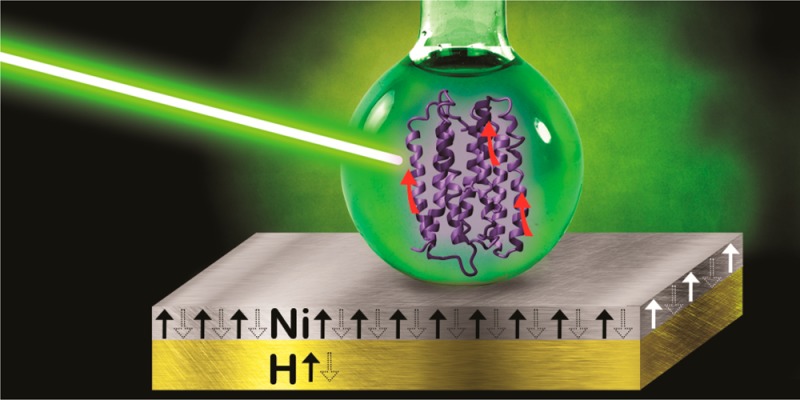
The role of the electron spin in chemistry and biology has received much attention recently owing to to the possible electromagnetic field effects on living organisms and the prospect of using molecules in the emerging field of spintronics. Recently the chiral-induced spin selectivity effect was observed by electron transmission through organic molecules. In the present study, we demonstrated the ability to control the spin filtering of electrons by light transmitted through purple membranes containing bacteriorhodopsin (bR) and its D96N mutant. The spin-dependent electrochemical cyclic voltammetry (CV) and chronoamperometric measurements were performed with the membranes deposited on nickel substrates. High spin-dependent electron transmission through the membranes was observed; however, after the samples were illuminated by 532 nm light, the spin filtering in the D96N mutant was dramatically reduced whereas the light did not have any effect on the wild-type bR. Beyond demonstrating spin-dependent electron transmission, this work also provides an interesting insight into the relationship between the structure of proteins and spin filtering by conducting electrons.
Keywords: Spin filtering, bacteriorhodopsin, electrochemistry, light-induced effects
Interest in spintronics1 has been growing as a new approach for efficient computation and data storage. This field has been positively affected by the introduction of novel materials and techniques. Commonly in spintronics the electrons’ spins are manipulated by magnetic materials. Spin injectors, for example, are composed of ferromagnets. The ability to control the spin properties in spintronics-related structures by light has also been demonstrated.2,3 The combination of light with biospintronics opens up the possibility of widening the applications and combining photonics with spintronics in biosystems or using biosystems as the spintronics medium.4 Here we demonstrate that the purple membrane, which contains a mutant of bacteriorhodopsin (bR), can serve as a light-activated spin switch. This system has been previously suggested as a candidate for bioelectronics5,6 and in a former study wild-type bR was shown to have spin-filtering properties.7 These observations were explained by the chiral-induced spin selectivity (CISS) effect, reported for several other chiral molecular systems.8 However, no light-induced effect on spin filtering was observed in wild-type bR. Here, spin-dependent electrochemical studies were conducted on a purple membrane containing a mutant of bacteriorhodopsin (bR) adsorbed on nickel substrates. The bR protein is embedded in its native membrane environment, closely resembling its natural structure. The light dramatically affects the spin filtering.
Bacteriorhodopsin is the integral protein in the purple membrane of Halobacterium salinarum. It is composed of seven transmembrane helical segments enclosing the binding pocket for the all-trans retinal chromophore. The latter is bound to Lys216 via a protonated Schiff base (PSB) linkage. Light absorption initiates a multistep reaction cycle with several distinct spectroscopic intermediates: J625, K590, L550, M412, N560, and O640. It is well established that retinal in K590 has a 13-cis configuration.9,10 Deprotonation of the protonated Schiff base takes place during the L to M transition, which is accompanied by protonation of Asp85, and the appearance of a proton at the extracellular surface. The Schiff base is reprotonated during the M to N transition from the proton donor Asp96, which is finally reprotonated from the cytoplasmic side during its recovery from the initial state of bR. Because Asp96 serves as a proton donor to the Schiff base, its replacement by a neutral residue (D96N or D96A), via site-directed mutagenesis, prevents fast decay of the M intermediate and leads to the accumulation of this intermediate under steady-state illumination and especially at high pH.11,12 Formation of an M intermediate is associated with a large scale of protein conformational changes, consisting mainly of tilts of the cytoplasmic ends of helixes F and G. These changes were confirmed by spectroscopic measurements as well as by crystallographic evidence,13 and are also accompanied by protein charge reorganization.
Light absorption by bacteriorhodopsin triggers a shift in the electron density from the β-ionone ring of the retinal chromophore toward the protonated Schiff base. This shift is comparable to a 2.6 Å displacement of a single electron down the polyene chain14 and is in the opposite direction of the initial photovoltage spike that is observed in bR.15 This charge shift is a critical component of the primary event because it sets in motion events that lead to the photoisomerization of the retinal chromophore.16 Further charge reorganization takes place at a slower time scale and major changes occur following the formation of an M intermediate. Photovoltage and photocurrent signals were detected by electrical studies that were performed on dried purple membrane samples,17,18 on bR proteoliposomes, on bR adsorbed to Millipore filters,19 and on bR incorporated into planar lipid membranes.20,21
To perform the present experiments, 5 nm of titanium (adhesive layer) and 150 nm of nickel were evaporated on silicon wafers with 300 nm of thermal oxide (University Wafer, Inc., U.S.A.). A small beaker with a defined area of 0.78 cm2 was sealed on the nickel surface. Both wild-type and D96N bR were prepared in a carbonate buffer (5 μM in 50 mM sodium carbonate buffer). Different amounts of wild-type and D96N bR were physisorbed on the surface using the drop-casting method and left to dry in vacuum for 48 h.
Electron conduction through purple membranes was measured in an electrochemical cell under ambient conditions in the dark and during illumination. The experimental setup is shown schematically in Figure 1a. The working electrode is made from nickel; underneath, a magnet is placed, whose direction can be flipped. The counter electrode is platinum and the reference electrode used is KCl-saturated calomel. The electrolyte used in all electrochemical measurements consists of a 10 mM tris(hydroxymethyl)aminomethane) (TRIS) buffer with 50 mM NaCl at pH 9, with the addition of a redox couple. The redox couple selected for the current study was K4[Fe(CN)6]/K3[Fe(CN)6] (Fe2+/Fe3+) due to its robust chemical properties and because of our thorough knowledge of its thermodynamic, kinetic, and electrochemical parameters. The relevant chemical reaction is a reversible electrochemical equilibrium. The relevant standard potential is
Figure 1.
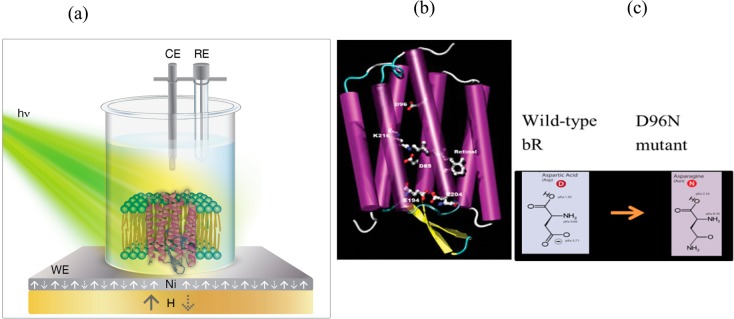
(a) Scheme of the opto-magnetic electrochemical measurements setup. (b) The 3D scheme of the bacteriorhodopsin structure. (c) The difference between wild-type bR and the mutant D96N; the aspartic acid is replaced by asparagine.
The chronoamperometric measurements were performed in three concentrations of the redox couple: 1, 5, and 10 mM. The cyclic voltammetry measurements were performed with 5 mM Fe2+/Fe3+. All measurements were performed as a function of the direction of the magnetization of the Ni electrode in the dark and when illuminated at 532 nm.
Figure 2 shows the cyclic voltammograms of the WT bR and the D96N mutant. It can be clearly seen that the current depends on the direction of the magnetization. The illumination did not change the signal measured with the WT, whereas a significant change was detected in the mutant D96N. Furthermore, the current through the sample containing the mutant is twice as high as the one measured with WT bR. An interesting point is that the spin polarization during the reduction and oxidation states looks nonsymmetrical. This effect is more pronounced as the bR thickness on the surface increases, as can be seen in Figure 3.
Figure 2.
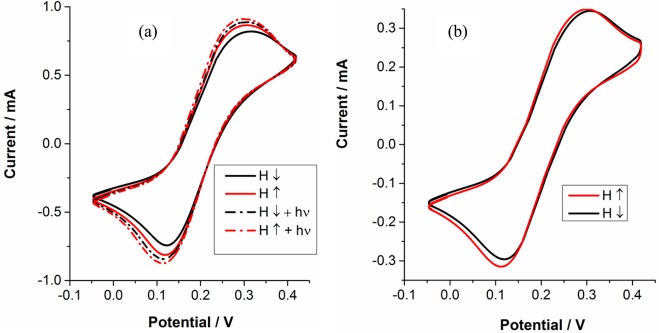
Cyclic voltammetry of (a) a sample containing the D96N mutant and (b) a sample containing the wild-type bR. Both samples contain 5.67 × 1000 μg/μm2 of bR on the surface. The dotted curves represent the results obtained while the samples are illuminated. The illumination effect is observed only with the D96N sample.
Figure 3.
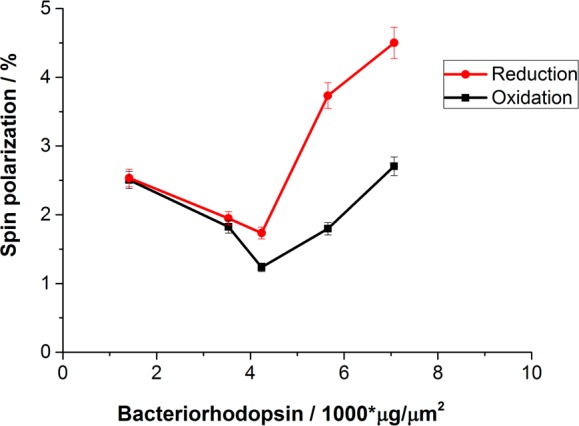
Spin polarization versus the amount of bR (D96N) on the electrode. The SP during the reduction process is higher than during oxidation.
The spin polarization is defined as SP = ((I+ – I–)/(I+ + I–)), where I+ and I– represent the currents measured with the magnet pointing up or down, respectively. Figure 2 indicates that the CV curves have very similar shapes for the mutant and the wild-type bR; this fact supports the conclusion that the coverage on the electrodes is similar for the two types of samples. In both cases, the spin direction associated with the magnet pointing up is favorable in the dark. Upon illumination of the mutant sample, the current increases significantly; however, the spin selectivity is clearly reduced and the current of the “unfavorable” spin increases to the extent that within the experimental uncertainty it is equal to the current of the “favorable spin”. The light effect is probably due to the accumulation of the M photochemically induced intermediate. The increased current is consistent with previous studies indicating increased current transport through bacteriorhodopsins following M intermediate accumulation.6,22,23 The proposal that the observed effect is due to M accumulation is further supported by the lack of any effect in the wild-type sample because in this sample M does not accumulate.
Figure 3 shows the SP as a function of sample thickness, expressed by the concentration of the purple membrane containing D96N in the deposition solution with a fixed electrode area. The values are obtained from the cyclic voltammetry measurements at the oxidation and reduction peaks. Clearly the SP during reduction is higher than that obtained during oxidation. It is important to realize that in principle which spin is transmitted depends on the handedness of the molecule and on the electron’s velocity. Hence, the direction of the spin of the electrons that are favored when electrons are moving from Ni to the solution is opposite to that of the electrons moving toward Ni. Therefore, in the reduction process the results are sensitive to the ratio of the density of states of the majority spin and the minority spins (R±) in the Ni below the Fermi level, whereas in the oxidation process the system is sensitive to the ratio of the minority and the majority spins (R∓) above the Fermi level. Because R± ≠ R∓, the reduction and oxidation spin selectivity are not expected to be the same. Another reason for the difference may arise from the asymmetric structure of the protein, which may induce different spin selectivity for electrons transferred in two opposite directions.
Because the CV curves reflect a steady-state situation when a double layer is formed near the electrode, we also performed chronoamperometric measurements to evaluate the SP efficiency at short times, namely, before and during the formation of the double layer. Figure 4 shows the current versus time measured for WT and for D96N bR in the dark and when illuminated when the magnetic field is pointing up or down. The results indicate large current (as expected) as well as a large spin selectivity during the first seconds. We noted that the ratio between the current through D96N bR and the WT in dark is only 1.2:1, smaller than the ratio obtained in the CV measurements (Figure 2). This difference may result from the differences in the rate of formation of the double layer.
Figure 4.
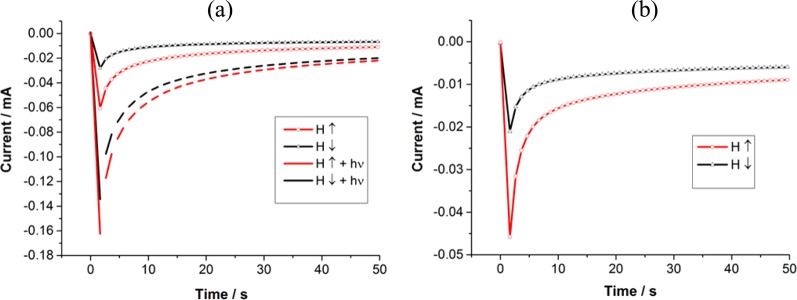
Chronoamperometric measurements with the magnetic field pointing up (red line) or down (black line) in TRIS buffer containing 1 mM K4[Fe(CN)6]/K3[Fe(CN)6] at pH 9 (a) of mutant D96N bR on nickel substrates and (b) for the WT bR on nickel substrates. The dashed curves were obtained when the sample was illuminated with a 532 nm laser. Note that the current in the case of the mutant (b), when illuminated, is larger by more than a factor of 3 than that obtained with the wild-type bR (a) in the dark. Measurements were performed at the reduction potential, that is, 73 mV for wild-type and 64 mV for D96N vs the KCl-saturated calomel electrode.
The chronoamperometric curve shape can be explained by Conttrell’s equation24,25
where i is the current A, n is the number of electrons (to reduce/oxidize one molecule of analyte), F is the Faraday constant, A is the area of the (planar) electrode, c0 is the initial concentration of the reducible analyte, D is the diffusion coefficient for the reduced/oxidized species, and t is the time in seconds.
The difference in the magnitude of the spin polarization observed in the chronoamperometric measurements as compared to the smaller values obtained in the CV experiments is due to the effect of the double layer. In the CV studies, the double layer is constant, therefore the electrons have to penetrate through this layer when passing between the surface and the redox couple. In the case of the time-dependent measurements, however, the double layer is not yet fully formed and therefore the electrons have to cross on average shorter distance between the redox couple and the surface. Hence, the spin orientation is better maintained.
Figure 5 shows both the spin polarization (left “y”-axis) and the current enhancement (right “y”-axis) of the mutant taken from Figure 4. The current enhancement was calculated as Ilight/Idark. The spin polarization is shown both for dark and illuminated measurements. The spin selectivity of the membrane containing the mutant is reduced when the membrane is illuminated, which is accompanied by an increase in the total current. Namely, the illumination reduces the barrier for the conduction of the unfavorable spin, thereby enhancing the total current and reducing the spin polarization, SP. The current increase upon illumination was observed before, as mentioned before.
Figure 5.
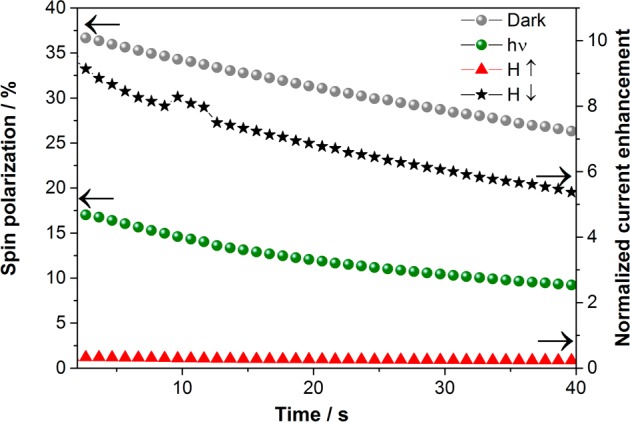
Spin polarization calculations of the mutant D96N bR (left “y”-axis) and enhanced current during illumination (right “y”-axis) of the mutant D96N bR on nickel substrates with different magnetic field directions. All measurements were done in 10 mM TRIS buffer containing 50 mM NaCl and 1 mM K4[Fe(CN)6]/K3[Fe(CN)6] at pH 9. The samples were illuminated with green light at 532 nm.
The present finding that the enhanced current is associated with loss of spin selectivity in the conduction, provides an interesting insight into the conduction mechanism through bR. We know that the spin filtering is enhanced by a helical secondary structure and that it depends on the length of the helix.26 It is also well established that the formation of an M intermediate is associated with a large scale of protein conformational changes, including mainly tilts of the protein cytoplasmic ends of helixes F and G. These changes were confirmed by spectroscopic measurements as well as by crystallographic evidence.5 This is accompanied by a protein hydrogen bonding network and charge reorganization, as well as proton movement to the protein surface. This structural change probably affects the path of the electrons through the helical part of the protein and shortens it. However, this explanation should be validated by calculations.
The present work clearly demonstrates the ability to control spin selectivity by light. Despite that only part of the membrane consists of bR, the spin selectivity approaches 40%. Beyond the potential for future applications, the results also provide an interesting insight into the relationship between the structure of proteins and spin filtering when conducting through these systems.
Acknowledgments
H.E., D.M., and R.N. acknowledge financial support from the ERC-Adv grant and the Israel Science Foundation.
Supporting Information Available
Description of the experimental setup, characterization of the sample, and results from controlled experiments. This material is available free of charge via the Internet at http://pubs.acs.org.
The authors declare no competing financial interest.
Supplementary Material
References
- Wolf S. A.; Awschalom D. D.; Buhrman R. A.; Daughton J. M.; von Molnár S.; Roukes M. L.; Chtchelkanova A. Y.; Treger D. M. Science 2001, 294, 1488–1495. [DOI] [PubMed] [Google Scholar]
- Zutić I.; Petukhov A. Nat. Nanotechnol. 2009, 4, 623–625. [DOI] [PubMed] [Google Scholar]
- Němec P.; Rozkotová E.; Tesařová N.; Trojánek F.; De Ranieri E.; Olejník K.; Zemen J.; Novák V.; Cukr M.; Malý P.; Jungwirth T. Nat. Phys. 2012, 8, 411–415. [Google Scholar]
- Freitas P. P.; Cardoso F. a; Martins V. C.; Martins S. A M.; Loureiro J.; Amaral J.; Chaves R. C.; Cardoso S.; Fonseca L. P.; Sebastião A. M.; Pannetier-Lecoeur M.; Fermon C. Lab Chip 2012, 12, 546–557. [DOI] [PubMed] [Google Scholar]
- Sepunaru L.; Friedman N.; Pecht I.; Sheves M.; Cahen D. J. Am. Chem. Soc. 2012, 134, 4169–4176. [DOI] [PubMed] [Google Scholar]
- Berthoumieu O.; Patil A. V.; Xi W.; Aslimovska L.; Davis J. J.; Watts A. Nano Lett. 2012, 12, 899–903. [DOI] [PubMed] [Google Scholar]
- Mishra D.; Markus T. Z.; Naaman R.; Kettner M.; Göhler B.; Zacharias H.; Friedman N.; Sheves M.; Fontanesi C. Proc. Natl. Acad. Sci. U.S.A. 2013, 110, 14872–14876. [DOI] [PMC free article] [PubMed] [Google Scholar]
- Naaman R.; Waldeck D. H. J. Phys. Chem. Lett. 2012, 3, 2178–2187. [DOI] [PubMed] [Google Scholar]
- Honig B.; Ebrey T.; Callender R. H.; Dinur U.; Ottolenghi M. Proc. Natl. Acad. Sci. U.S.A. 1979, 76, 2503–2507. [DOI] [PMC free article] [PubMed] [Google Scholar]
- Braiman M.; Mathies R. Proc. Natl. Acad. Sci. U.S.A. 1982, 79, 403–407. [DOI] [PMC free article] [PubMed] [Google Scholar]
- Otto H.; Marti T.; Holz M.; Mogi T.; Lindau M.; Khorana H. G.; Heyn M. P. Proc. Natl. Acad. Sci. U.S.A. 1989, 86, 9228–9232. [DOI] [PMC free article] [PubMed] [Google Scholar]
- Zimányi L.; Kulcsár A.; Lanyi J. K.; Sears D. F.; Saltiel J. Proc. Natl. Acad. Sci. U.S.A. 1999, 96, 4414–4419. [DOI] [PMC free article] [PubMed] [Google Scholar]
- Lanyi J. K. Mol. Membr. Biol. 2004, 21, 143–150. [DOI] [PubMed] [Google Scholar]
- Birge R. R.; Gillespie N. B.; Izaguirre E. W.; Kusnetzow A.; Lawrence A. F.; Singh D.; Song Q. W.; Schmidt E.; Stuart J. A.; Seetharaman S.; Wise K. J. J. Phys. Chem. B 1999, 1034910746–10766. [Google Scholar]
- Trissl H. W. Photochem. Photobiol. 1990, 51, 793–818. [PubMed] [Google Scholar]
- Zadok U.; Khatchatouriants A.; Lewis A.; Ottolenghi M.; Sheves M. J. Am. Chem. Soc. 2002, 124, 11844–11845. [DOI] [PubMed] [Google Scholar]
- Váró G.; Keszthelyi L. Biophys. J. 1983, 43, 47–51. [DOI] [PMC free article] [PubMed] [Google Scholar]
- Lukashev E. P.; Vozary E.; Kononenko A. A.; Rubin A. B. Biochim. Biophys. Acta 1980, 592, 258–266. [DOI] [PubMed] [Google Scholar]
- Hellingwerf K. J.; Schuurmans J. J.; Westerhoff H. V. FEBS Lett. 1978, 92, 181–186. [DOI] [PubMed] [Google Scholar]
- Bamberg E.; Dencher N. A.; Fahr A.; Heyn M. P. Proc. Natl. Acad. Sci. U.S.A. 1981, 78, 7502–7506. [DOI] [PMC free article] [PubMed] [Google Scholar]
- Braun D.; Heyn M. P.; Group B.; Berlin F. U. Biophys. J. 1988, 53, 617–621. [DOI] [PMC free article] [PubMed] [Google Scholar]
- Jin Y.; Honig T.; Ron I.; Friedman N.; Sheves M.; Cahen D. Chem. Soc. Rev. 2008, 37, 2422–2432. [DOI] [PubMed] [Google Scholar]
- Mukhopadhyay S.; Cohen S. R.; Marchak D.; Friedman N.; Pecht I.; Sheves M.; Cahen D. ACS Nano 2014, 7714–7722. [DOI] [PubMed] [Google Scholar]
- Bard A. J.; Faulkner L. R.. Electrochemical Methods: Fundamentals and Applications, 2nd ed.; Wiley: New York, 2001. [Google Scholar]
- Cottrell F. G. J. Am. Chem. Soc. 1903, 25, 777–779. [Google Scholar]
- Kettner M.; Göhler B.; Zacharias H.; Mishra D.; Kiran V.; Naaman R.; Fontanesi C.; Waldeck D. H.; Sęk S.; Pawłowski J.; Juhaniewicz J. J. Phys Chem. C 2015, 10.1021/jp509974z. [DOI] [Google Scholar]
Associated Data
This section collects any data citations, data availability statements, or supplementary materials included in this article.


