


Abstract
Ligand-responsive transcription factors in prokaryotes found simple small molecule-inducible gene expression systems. These have been extensively used for regulated protein production and associated biosynthesis of fine chemicals. However, the promoter and protein engineering approaches traditionally used often pose significant restrictions to predictably and rapidly tune the expression profiles of inducible expression systems. Here, we present a new unified and rational tuning method to amplify the sensitivity and dynamic ranges of versatile small molecule-inducible expression systems. We employ a systematic variation of the concentration of intracellular receptors for transcriptional control. We show that a low density of the repressor receptor (e.g. TetR and ArsR) in the cell can significantly increase the sensitivity and dynamic range, whereas a high activator receptor (e.g. LuxR) density achieves the same outcome. The intracellular concentration of receptors can be tuned in both discrete and continuous modes by adjusting the strength of their cognate driving promoters. We exemplified this approach in several synthetic receptor-mediated sensing circuits, including a tunable cell-based arsenic sensor. The approach offers a new paradigm to predictably tune and amplify ligand-responsive gene expression with potential applications in synthetic biology and industrial biotechnology.
INTRODUCTION
Ligand responsive transcription factors (TFs) in bacteria regulates cellular functions in response to environmental and metabolic cues (1). They play a central and classical role in the induction of gene expression systems by small molecules, such as tetracycline (tet), lactose (lac) and arabinose (ara) (2). Inducible expression systems have been widely utilized for recombinant protein production (3), gene function studies and, more recently, in synthetic biology for the control of gene networks (4–6) and metabolic pathways to produce fine chemicals and biofuels (7–9). However, the native effector-responsive TF-controlled systems have evolved to respond to their cognate ligands with a particular sensitivity, selectivity and dynamic ranges, and are therefore not optimized for direct reuse in, e.g. industrial biotechnology, to express various target genes. As a result, several approaches have been proposed to re-engineer the wild-type small molecule-mediated expression systems in order to generate modified systems that can achieve matched expression of various genes in synthetic biochemical pathways (10–12). Typically, these approaches have focused on re-engineering directly the underlying promoters by either randomly mutating flanking sequences of the consensus DNA motifs (5,13), or by placing different numbers of enhancers or operator sites within different locations of the target promoter (2,14–17). Despite notable successes, the somewhat unpredictable and labour-intensive nature of these promoter-engineering approaches poses significant restrictions to their use to predictably and rapidly tune the sensitivity and dynamic range of inducible expression systems. Hence, there is a need for new methods that will enable the systematic and controlled variation of the expression profiles of versatile small molecule-inducible expression systems.
Here we present a new methodology to flexibly tune the sensitivity and dynamic range of small molecule-inducible gene expression systems in a predictable manner via variation of the concentrations of intracellular receptors in one-component signal transduction pathways. Bacterial ligand-responsive TF regulatory systems typically comprises an intracellular receptor protein, which acts as either a transcriptional activator or repressor and dynamically switches between two states through allostery upon binding to its target ligand in the cytoplasm, and a cognate target promoter, which is regulated by the receptor to control the transcription of a downstream gene (Figure 1) (1). Since the receptor protein both detects the target ligand and acts to activate/repress the target promoter, we expected that the concentration of receptor in the cytoplasm would determine the sensing sensitivity for the ligand as well as the transcriptional dynamic range of the cognate-inducible promoter. Thus, the density of the intracellular receptor could function as a dial to tune continuously the sensitivity and dynamic range of the gene expression system (Figure 1). In this study, we demonstrate that lowering the intra-cellular density of a repressor receptor protein (e.g. TetR and ArsR) increases significantly the sensitivity and dynamic range of these small molecule-inducible systems. Increasing the intra-cellular density of an activator receptor (e.g. LuxR) achieves a similar outcome. This approach establishes a new way to tune and amplify ligand-responsive gene expression systems in living cells and has the potential for applications in synthetic biology and industrial biotechnology.
Figure 1.
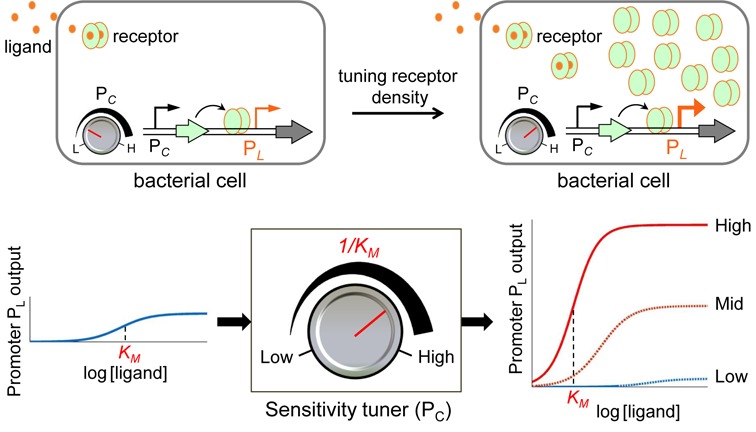
The amplification of ligand-responsive TF controlled gene expression via tuning of the density of intracellular receptors. The output characteristics of the signaling promoter (PL) can be significantly tuned by altering the density of its cognate ligand-responsive receptor for transcriptional control in bacterial cells. KM is the inducer concentration achieving half-maximal activation of the target PL promoter (in orange).
MATERIALS AND METHODS
Strain, media and growth conditions
Plasmid cloning work and circuit construct characterization were all performed in Escherichia coli TOP10 strain. Cells were cultured in LB (Luria–Bertani Broth) media (10 g/l peptone, 5 g/l NaCl, 5 g/l yeast extract). The kanamycin used was 50 μg/ml. Cells inoculated from single colonies on freshly streaked plates were grown overnight in 5 ml LB in sterile 20 ml universal tubes at 37°C with shaking (200 revolutions per minute (rpm)). Overnight cultures were diluted into pre-warmed LB media at OD600 = 0.025 for the day cultures, which were induced (see below) and grown for 6 h at 37°C prior to analysis. For fluorescence assay by fluorometry, diluted cultures were loaded into a 96-well microplate (Bio-Greiner, chimney black, flat clear bottom) and induced with 5 μl (for single input induction) or 10 μl (for double input induction) volumes of specified inducers to yield a final volume of 200 μl per well. For the 2D characterization, cell cultures in the microplate were first induced with arabinose and grown for 3 h (to produce sufficient receptor proteins in the cytoplasm) before being induced by the second inducer chemical (aTc or NaAsO2 or 3OC6HSL) and grown for another 3 h. The microplate was covered by a ultraviolet transparent lid to counteract evaporation and incubated in the fluorometer (BMG FLUOstar) with continuous shaking (200 rpm, linear mode, 37°C) between each cycle of repetitive measurements. Chemical reagents and inducers (arabinose, anhydrotetracycline, NaAsO2 and 3OC6HSL) used were analytical grade from Sigma Aldrich.
Plasmid circuit construction
Plasmid construction and DNA manipulations were performed following standard molecular biology techniques. The aTc (rbs30-tetR-B0015-Ptet2), 3OC6HSL (rbs30-luxR-B0015-Plux2) and NaAsO2 (rbs30-arsR-B0015-ParsR) sensor fragments were synthesized by GENEART following the BioBrick standard (http://biobricks.org), by eliminating the four restriction sites (EcoRI, XbaI, SpeI and PstI) for the BioBrick standard via synonymous codon exchange and flanking with prefix and suffix sequences containing the appropriate restriction sites and RBS (ribosome binding site) sequences. The double terminator BBa_B0015 (http://partsregistry.org) was used to terminate gene transcription in all cases. The arabinose inducible araC-PBAD promoter was amplified from plasmid pBAD18-Cm (pBR322 ori, Cmr). pSB3K3 (18) (p15A ori, Kanr) was used to clone and characterize all the genetic constructs in this study (Supplementary Figure S2). The GFP (gfpmut3b, BBa_E0840, green fluorescent protein) reporter was from the Registry of Standard Biological Parts (http://partsregistry.org). The constitutive promoters (Table 1) were assembled from two annealed single-stranded primers flanked with appropriate BioBrick restriction sites. The annealed constitutive promoters were next assembled with the corresponding sensor constructs into the pSB3K3 plasmid following a three-way BioBrick assembly protocol. Constructs were verified by DNA sequencing (Beckman Coulter Genomics at UK). Primers were synthesized by Sigma Life Science. Details are in Supplementary Figure S3 with plasmid maps describing representative circuit constructs used along with Supplementary Table S1 (list of genetic constructs) and Supplementary Table S2 (list of genetic construct sequences). All plasmids used are available upon request and selected plasmids may be obtained from the Registry of Standard Biological Parts (http://partsregistry.org) and Addgene repository (http://www.addgene.org/).
Table 1. Gene regulatory sequences used for characterizing sensor dose–responses.
| Identifiera | Type | DNA sequence (5′–3′) |
|---|---|---|
| J117 | Promoterb | TTGACAGCTAGCTCAGTCCTAGGGATTGTGCTAGC |
| J114 | Promoter | TTTATGGCTAGCTCAGTCCTAGGTACAATGCTAGC |
| J115 | Promoter | TTTATAGCTAGCTCAGCCCTTGGTACAATGCTAGC |
| J105 | Promoter | TTTACGGCTAGCTCAGTCCTAGGTACTATGCTAGC |
| J106 | Promoter | TTTACGGCTAGCTCAGTCCTAGGTATAGTGCTAGC |
| J101 | Promoter | TTTACAGCTAGCTCAGTCCTAGGTATTATGCTAGC |
| rbs30 | RBSc | TCTAGAGATTAAAGAGGAGAAATACTAGATG |
aThe regulatory sequences are from the Registry of Standard Biological Parts (http://partsregistry.org).
bThe −10 and −35 sequences of the promoter is underlined.
cSequence of RBS is italic and start codon is in bold.
Gene expression assay and data analysis
Fluorescence levels of gfp gene expression were determined by fluorometry at the cell population level. Cells grown in 96-well plates were monitored for growth and GFP using a BMG FLUOstar fluorometer for repeated absorbance (OD600) and fluorescence (485 nm for excitation, 520 ± 10 nm for emission, Gain = 1000, bottom reading) readings (20 min/cycle). The fluorometry data of gene expression were first processed in BMG Omega Data Analysis Software (v1.10) and were analysed in Microsoft Excel 2007 and Matlab after being exported. The growth medium backgrounds (absorbance and fluorescence) were determined from wells loaded with LB media and were subtracted from the readings of other wells. The fluorescence/OD600 (Fluo/OD600) at a specific time for a sample culture was determined after subtracting its triplicate-averaged counterpart of the negative control cultures (GFP-free) at the same time. For population-averaged assay by fluorometry, the fluorescence/OD600 after 6 h growth post-initial day dilution and induction was used as the output response of the cells in the steady state when cells were in the exponential growth phase where the steady-state assumption for protein expression can be applied. For the constitutive promoter assay by fluorometry, the fluorescence values immediately after dilution were used as the baseline for the correction of subsequent fluorescence readings.
Fluorescence-activated cell sorting (FACS) assay were performed using a Becton–Dickinson FACSCalibur flow cytometer with a 488 nm Argon excitation laser and a 530 nm emission filter with 30 nm bandpass. After 6 h growth post the day culture dilution, cells were transferred from their 96-well plate and resuspended in 0.22 μm filtered phosphate-buffered saline (PBS) for FACS. The flow cytometer was tuned with the negative control (GFP-free) to obtain a fluorescence level centred within the first decade under log mode and with the cells scatter at the desired position on the scatter graph. Cells were assayed at low flow rate until 20 000 gated events were collected using the BD CellQuest Pro software. The flow cytometry data (Figure 5) were analysed using FlowJo software (v7.6) with an appropriate gate of forward-scattering and side-scattering for all tested cultures. The Robust CV (coefficient of variation) in FlowJo (v7.6) is calculated as 0.5*(Intensity [at 84.13 percentile] − Intensity [at 15.87 percentile])/Median. The robust CV is an alternative approach to classical CV but more resistant to the statistical influence of outlying events in a sample population, and thus is not as skewed by outlying values as the CV (19).
Figure 5.
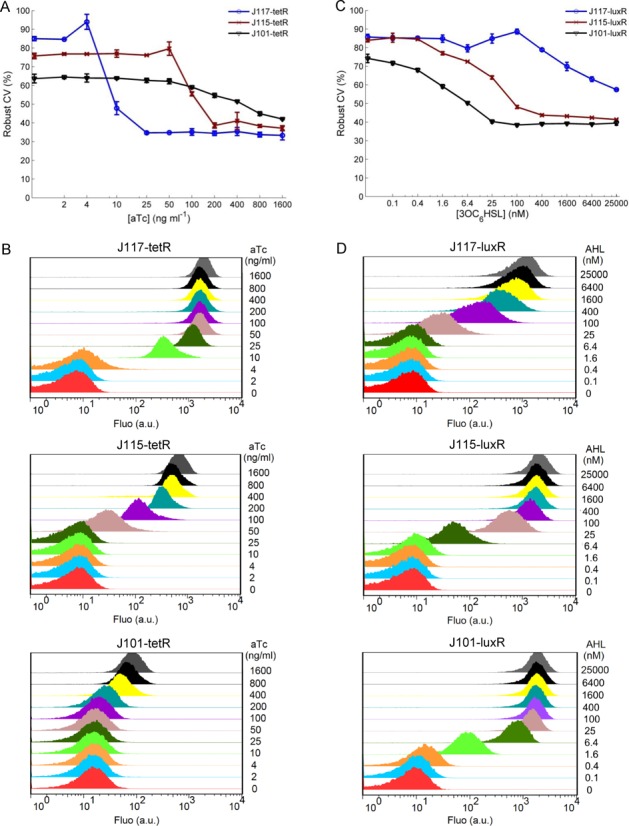
Robust CV of the sensor dose–response at single cell level under different receptor concentrations and ligand inductions. (A) Robust CV of the TetR repressor receptor-mediated gene expression from single cell assay. (B) Single cell flow cytometry data shows the cellular responses of the aTc sensor induced by varied aTc. Strains shown containing J117-tetR (top), J115-tetR (mid), J101-tetR (bottom) construct, respectively. (C) Robust CV of the LuxR activator receptor-mediated gene expression from single cell assay. (D) Single cell flow cytometry data shows cellular responses of the AHL sensor induced by varied 3OC6HSL. Strains shown containing J117-luxR (top), J115-luxR (mid), J101-luxR (bottom) construct, respectively. Error bars, SD (n = 3).
The transfer functions for the sensors were derived from a steady-state assumption (4). The resulting data (Figure 2B, Figure 3A, Figure 4A) were fitted to a Hill function model for the environment responsive promoter steady-state input–output response (transfer function) of the form (4,20):
 |
where [I] is the concentration of the inducer, KM and n are the Hill constant and coefficient, respectively, relating to the promoter-regulator/inducer interaction, k is the maximum expression level due to induction and α is a constant relating to the basal level of the promoter due to leaky expression (Table 2). A detailed derivation of the transfer functions is provided in Supplementary Methods. The nonlinear least square fitting function (cftool) in Matlab (MathWorks R2010a) was applied to fit the experimental data to parametrize the transfer function model.
Figure 2.
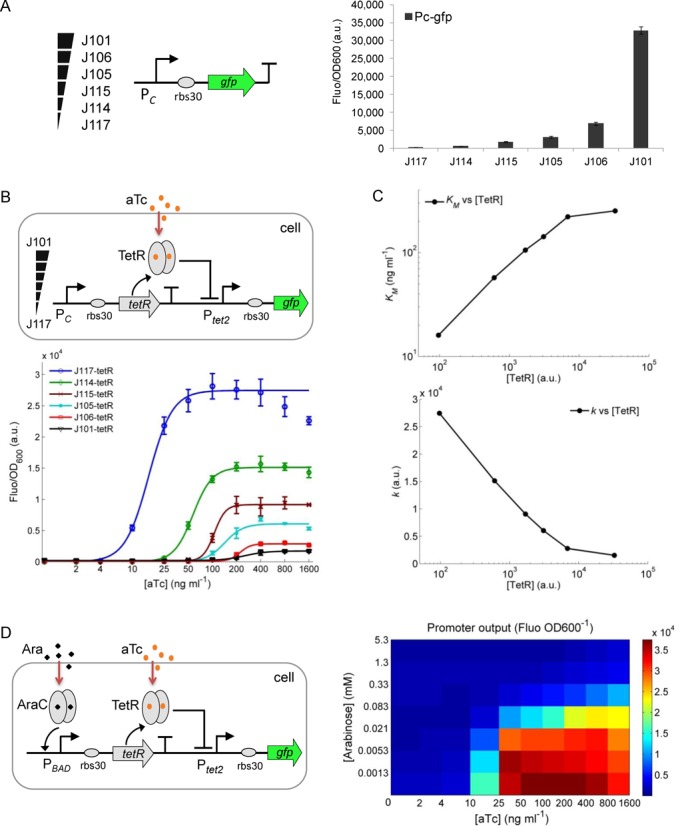
Amplifying repressor receptor-mediated gene expression by lowering its intracellular density. (A) A set of constitutive promoters, spanning a wide range of strengths, was characterized prior to their use to continuously express the receptor protein in the cytoplasm. (B) The synthetic aTc sensor with the receptor (TetR) expressed from the six constitutive promoters of varying strengths, and the responses of the sensor to different aTc levels (0, 2, 4, 10, 25, 50, 100, 200, 400, 800, 1600 ng ml−1). (C) The Hill constant (KM) and maximum output (k) of the fitted sensor dose–response against the relevant intracellular TetR levels. Fitting parameters are displayed in Table 2. (D) The responses of the synthetic aTc sensor to different aTc and arabinose levels with TetR receptor expressed from an arabinose inducible PBAD promoter. Error bars, SD (n = 3). a.u., arbitrary units.
Figure 3.
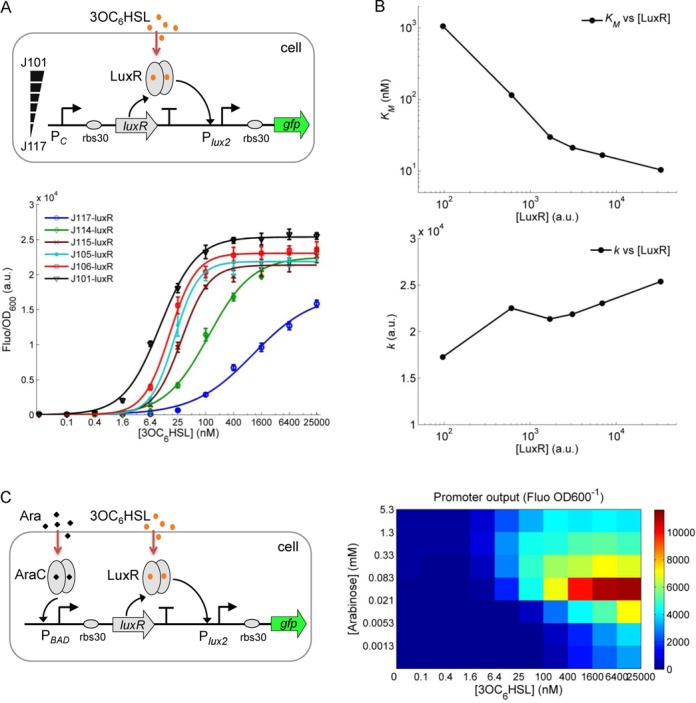
Amplifying activator receptor-mediated gene expression by increasing its intracellular density. (A) The synthetic AHL sensor with the receptor (LuxR) expressed from six constitutive promoters of varying strengths, and the responses of the sensor to different levels of 3OC6HSL (0, 0.10, 0.40, 1.60, 6.4, 25.0, 100, 400, 1600, 6400, 25000 nM). (B) The Hill constant (KM) and maximum output (k) of the fitted sensor dose–response against the relevant LuxR levels in the cytoplasm. (C) The sensor responses to different 3OC6HSL and arabinose levels with LuxR receptor expressed from an arabinose inducible PBAD promoter. Error bars, SD (n = 3).
Figure 4.
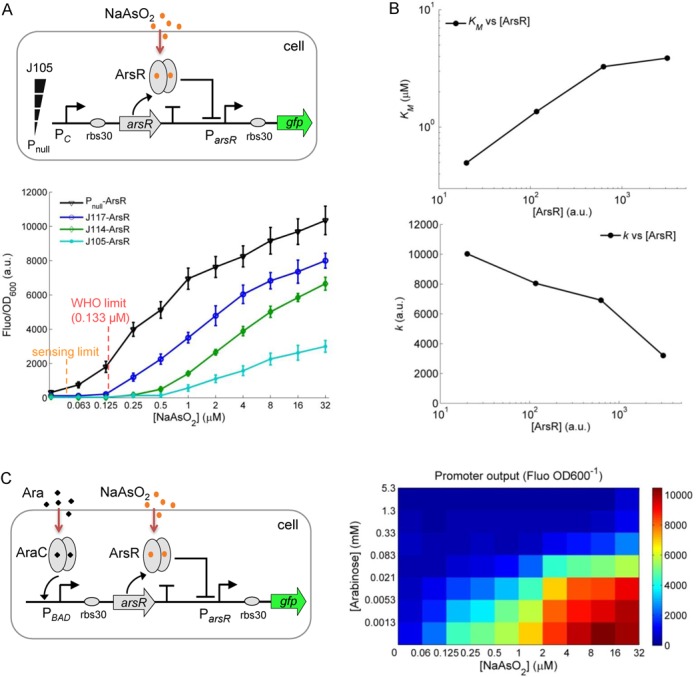
Engineering an arsenic cell-based sensor with tunable sensitivity and dynamic range. (A) The design of the synthetic arsenic sensor with the receptor (ArsR) expressed from a constitutive promoter, and the responses of the sensor to different levels of NaAsO2 (0, 0.0625, 0.125, 0.25, 0.5, 1.0, 2.0, 4.0, 8.0, 16.0, 32 μM). Sensing limit is derived from measuring errors of Pnull-ArsR. (B) The Hill constant (KM) and maximum output (k) of the fitted sensor dose–response against the relevant ArsR levels in the cytoplasm. (C) The sensor responses to different NaAsO2 and arabinose levels with ArsR receptor expressed from an arabinose inducible PBAD promoter. Error bars, SD (n = 3).
Table 2. Best fits for characterized dose–responses of the TF-mediated gene expression with 95% confidence bounds.
| PC-receptor | Target | k (a.u.) | KM | n | α | R2 |
|---|---|---|---|---|---|---|
| J117-tetR | aTc | 2.746e4 ± 0.064e4 | 16.04 ± 1.1 ng ml−1 | 2.959 ± 0.405 | 4.661e-10 | 0.9987 |
| J114-tetR | aTc | 1.513e4 ± 0.045e4 | 57.35 ± 3.8 ng ml−1 | 3.647 ± 0.816 | 6.878e-9 | 0.9979 |
| J115-tetR | aTc | 9067 ± 328 | 105.8 ± 5.3 ng ml−1 | 6.277 ± 4.081 | 0.0104 ± 0.0209 | 0.9987 |
| J105-tetR | aTc | 6046 ± 800 | 142.5 ± 31.6 ng ml−1 | 3.809 ± 2.235 | 0.0048 ± 0.0735 | 0.9830 |
| J106-tetR | aTc | 2774 ± 263 | 221.5 ± 40.4 ng ml−1 | 6.678 ± 10.462 | 0.0368 ± 0.0459 | 0.9921 |
| J101-tetR | aTc | 1530 ± 147 | 252.6 ± 37.2 ng ml−1 | 3.162 ± 1.201 | 0.1315 ± 0.0480 | 0.9930 |
| J117-luxR | 3OC6HSL | 1.727e4 ± 0.25e4 | 1059 ± 662 nM | 0.6727 ± 0.1694 | 2.675e-9 | 0.9944 |
| J114-luxR | 3OC6HSL | 2.252e4 ± 0.125e4 | 115.3 ± 31.92 nM | 0.9199 ± 0.1933 | 7.192e-11 | 0.9962 |
| J115-luxR | 3OC6HSL | 2.136e4 ± 0.086e4 | 29.88 ± 5.88 nM | 1.471 ± 0.383 | 7.465e-10 | 0.9962 |
| J105-luxR | 3OC6HSL | 2.187e4 ± 0.070e4 | 21.22 ± 3.13 nM | 1.692 ± 0.405 | 4.164e-10 | 0.9974 |
| J106-luxR | 3OC6HSL | 2.187e4 ± 0.067e4 | 16.68 ± 2.46 nM | 1.533 ± 0.295 | 2.359e-9 | 0.9977 |
| J101-luxR | 3OC6HSL | 2.305e4 ± 0.067e4 | 10.38 ± 1.37 nM | 1.107 ± 0.139 | 2.341e-10 | 0.9987 |
| Pnull -arsR | NaAsO2 | 1.003e4 ± 0.1582e4 | 0.496 ± 0.214 μM | 0.9356 ± 0.3304 | 5.193e-8 | 0.9884 |
| J117-arsR | NaAsO2 | 8049 ± 514 | 1.359 ± 0.286 μM | 1.048 ± 0.173 | 1.589e-9 | 0.9964 |
| J114-arsR | NaAsO2 | 6919 ± 512 | 3.274 ± 0.648 μM | 1.183 ± 0.187 | 6.657e-10 | 0.9973 |
| J105-arsR | NaAsO2 | 3208 ± 278 | 3.871 ± 0.875 μM | 1.164 ± 0.196 | 5.145e-9 | 0.9970 |
RESULTS
Amplifying repressor receptor-mediated gene expression by lowering its intracellular density
We first built the aTc (anhydrotetracycline) responsive TetR repressor-mediated signaling module in the E. coli TOP10 host (Figure 2) (21). In this signaling module, the aTc molecule diffuses into the cytoplasm and binds the TetR repressor to relieve its repression on the target Ptet2 promoter (22). We use gfp as the output reporter, and a constitutive promoter is used to continually express TetR so that stable inhibition of its cognate regulatory promoter is achieved under non-induced conditions. To obtain different concentrations of the TetR receptor in the cytoplasm, a set of six constitutive promoters (J117–J101, Figure 2A) spanning over a 1000-fold range of transcriptional output strengths were used to drive TetR expression (Figure 2B). Subsequent characterization shows that the dose–response curves (against varying levels of aTc) of the TetR-mediated signaling module change dramatically as a function of the stepped-up strength of the constitutive promoters driving TetR. The weaker the promoter used for TetR expression (i.e. the lower the TetR concentration in the cytoplasm), the more sensitive and the higher dynamic range the response to aTc. Surprisingly, the Ptet2 promoter is not leaky even under very low levels of TetR (i.e. when driven by the J117 promoter), demonstrating the strong repressing capability of TetR and the tightness of this promoter (22).
The experimental dose–response curves were fitted to a Hill function-based biochemical model (11,20) derived to describe the transfer function (input–output relationship at steady state) of this module (Supplementary Methods, Table 2). In Figure 2C, we plot the Hill constant KM (i.e. the inducer concentration achieving half-maximal activation) and k (the maximum expression level due to induction) obtained from the fits of the data to the model (Table 2), against the intracellular TetR protein level, as measured by the strength of the corresponding constitutive promoter used for TetR expression (Figure 2A). The Hill constant KM shows a ca. 20-fold change and the maximum output k shows a ca. 40-fold change across the whole range of TetR concentration (ca. 1000-fold change). The observed dependences corroborate the fact that the sensing response sensitivity (the higher KM, the lower the sensitivity) and dynamic range (the higher k, the higher the range) of this inducible gene expression module are both decreased in proportion to increasing density of repressor TetR receptor in the cytoplasm.
To further verify the impact of TetR concentration on the transcriptional activity of its target promoter, we used the arabinose inducible PBAD promoter (23) to drive TetR, so that the TetR density in the cytoplasm can be tuned in continuous fashion by externally added arabinose (Figure 2D). The 2D characterization of the response to combinations of arabinose and aTc shows that the response sensitivity (i.e. the lowest input concentration sensed above background) and the dynamic range of the TetR-mediated signaling module are both increased when the arabinose level is decreased. Since the pBAD promoter expression is proportional to the arabinose level added (Supplementary Figure S2) (23), this result confirms that the TetR repressor receptor-mediated gene expression can be significantly amplified by modulating the intracellular receptor concentration.
Amplifying activator receptor-mediated gene expression by increasing its intracellular density
We next examined the alternative case when the intracellular receptor is an activator for the downstream regulatory promoter, rather than a repressor. To this end, we designed and built a synthetic AHL (acyl-homoserine lactone) responsive signaling module. In this sensing module, the quorum sensing signaling molecule 3OC6HSL (24) diffuses into the cytoplasm to bind the receptor LuxR leading to formation of an active dimer complex that activates the cognate Plux2 promoter (22) (Figure 3A). Similarly to the TetR-repressor module above, we first used the same six constitutive promoters of varying strengths to drive the expression of LuxR, resulting in differential receptor concentrations in the cytoplasm. The characterized input–output dose–response curves of this LuxR-mediated signaling module show a reciprocal outcome to that of the TetR-mediated signaling (Figure 3A). The stronger the promoter used for LuxR expression (i.e. the higher the LuxR concentration in the cytoplasm), the higher sensitivity and dynamic range in the response to 3OC6HSL. The dose–responses were also fitted to the transfer function model of this gene expression module (Table 2), and the fitted Hill constant (KM) and maximum output (k) are plotted against the derived LuxR protein concentration in the cytoplasm in Figure 3B. The results show a 100-fold change for the Hill constant KM, while the maximum output k shows a mild ca. 1.5-fold change across the ca. 1000-fold range of LuxR concentration.
We also used the arabinose inducible PBAD promoter to express LuxR so as to achieve continuous tunability of LuxR density in the cytoplasm by external addition of arabinose (Figure 3C). The 2D dose–response diagram shows that the response sensitivity (lowest input concentration sensed above background) is increased coherently with the arabinose induction level. The maximum output amplitude shows an increase first and then a fall off, potentially due to the saturated overexpression of LuxR protein within the second phase induction by arabinose. Taken together, the results show that the LuxR activator receptor-mediated gene expression can be significantly amplified by increasing its receptor concentration in the cytoplasm.
Engineering an arsenic cell-based sensor with tunable sensitivities and dynamic ranges
Based on the above findings, we next investigated if the receptor concentration tuning strategy can be applied to rationally increase the sensitivity and dynamic range of an arsenite cellular sensor we constructed previously (25). Our synthetic arsenic sensor functions as a repressor receptor (ArsR)-mediated sensing module, in which the repression of ArsR on its target ParsR promoter is relieved when bound with NaAsO2 (Figure 4A) (25,26). Since ArsR is also expressed from the endogenous E. coli genome, and thus may already be present at some level in the cytoplasm (27), we first used three weak constitutive (J117, J114, J105) promoters and one null (Pnull, promoterless) promoter to express ArsR on a plasmid in E. coli. As with the TetR-mediated gene expression, the characterized dose–response curves of the module change consistently according to the strength of the constitutive promoters used to control ArsR levels, i.e. the weaker the promoter used for ArsR expression, the higher sensitivity and dynamic range of the response to NaAsO2. In particular, the detection sensitivity for the synthetic sensor with Pnull-ArsR for NaAsO2 is now improved beyond the safety level for drinking water set by the World Health Organization (10 ppb or 0.133 μM) (28).
In Figure 4B, the fitted Hill constant (KM) and maximum output (k) of this sensor (Table 2) are plotted against the derived ArsR protein concentration in the cytoplasm (with default ArsR protein level expressed from E. coli genome set to 20 a.u. here). KM shows a ca. 10-fold change while the maximum output k shows a moderate ca. 3-fold change across the ca. 150-fold range of ArsR concentration. Similarly to the examples above, the arabinose inducible PBAD promoter was used to express ArsR and achieve continuous tunability of ArsR density in the E. coli cytoplasm by externally added arabionose (Figure 4C). The 2D dose–response results show that the response sensitivity and dynamic range of the ArsR sensor module are both increased with the decrease of the arabinose induction level. These results confirm that the synthetic ArsR receptor-mediated sensor for NaAsO2 can be significantly tuned by lowering its receptor density in the cytoplasm to meet the practical sensing limits required in real-world applications.
DISCUSSION
In this study, we have demonstrated a novel approach that can rationally and rapidly be applied to tune the sensitivity and dynamic range of ligand-responsive TF controlled gene expression in E. coli. The ligand inducible gene expression modules exemplified here are either heterologous (TetR and LuxR) or endogenous (ArsR) to the E. coli host genetic background, and include both repressor (TetR, ArsR) and activator (LuxR) receptors mediated signaling paradigms. In both cases, the detection thresholds and dynamic range of these genetic sensors can be significantly tuned by systematically varying the receptor protein concentrations in the cytoplasm. Two types of tuning of the receptor density have been shown including both the discrete mode via employing a set of constitutive promoters of different strengths and the continuous mode using an inducible promoter. Typically, low expression level of the repressor receptor protein (e.g. TetR and ArsR) in the cell will increase the sensitivity and dynamic range of the sensors while high level of the activator receptor protein (e.g. LuxR) is required to achieve the same outcome. We note that repressors typically bind their target DNA sites to prevent transcription, whereas activators do not bind their target sites to initiate transcription until complexed with their cognate ligands. Hence, we speculate that a low abundance of transcription repressors may well require fewer ligand molecules to bind to relieve the inhibition of their target promoter and that a higher abundance of transcription activators will need fewer ligand molecules to generate the necessary amount of active complex to stimulate their target promoter. Strikingly, we noted that lowering or increasing the expression levels of the regulatory repressor or activator proteins in the cytoplasm does not lead to obviously leaky transcription from the cognate promoters in this study. The technique demonstrated here has clear advantages over traditional gene expression optimization approaches, which typically involve random mutation of the target promoter (10,29) or regulatory protein sequences (to alter their binding affinities) (30,31) with the associated labour-intensive process of repetitive screening.
It is striking that the response curve of the tested gene expression modules can be tuned to such a drastic extent by simply adjusting the concentration of the ligand-responsive TFs (receptors). This property will provide a new simple and rational tuning method to reshape designer genetic circuit behaviour, contrasting the more usual fixed- or overexpression of TFs employed in synthetic biological systems. Due to its relative easiness and predictability which contrasts that of engineering protein changes, such a mechanism may also be utilized in evolution by native cells to fine tune gene expression levels in response to changing environments. A recent study shows that the wild-type levels of the TFs in cells can reveal their mode of action, i.e. binding to target DNA sites in either a ligand-dependent manner or not (32). Generally, abundant TFs tend to bind ligand-dependently, whereas most low abundant TFs bind ligand-independently in order to tradeoff their low abundance for achieving timely regulation. Since the three TFs studied here all act in a ligand-dependent manner, their abundances may affect their response dynamics to target signals, i.e. low level of TF may slightly delay responses in contrast to high level TF scenarios. Hence, it would be of interest to further study these behaviours using methods yielding much higher time resolution such as time-lapse fluorescence microscopy.
We considered whether a low level of the receptor TF might lead to increased noise in gene expression. To address this, we performed single cell characterization of the fluorescence in cell populations for selected conditions with low, mid and high levels of the cognate receptor proteins. Figure 5 shows the experimentally measured noise curves (as the Robust Coefficient of Variation (19)) of the TetR repressor and LuxR activator-mediated sensor dose–responses at the single cell level (Figure 5B and D). The results indicate that the noise level is higher for conditions with low abundant TFs only at an uninduced to low-induced stage. At an intermediate to highly induced stage the noise level becomes consistently lower for conditions with high promoter output, regardless of the abundance of the cognate TF receptors. Thus, a low level of the TF receptors does not simply lead to increased noise level for gene expression at induced state. In contrast, the noise level appears more relevant to the transcriptional state of the cognate regulated promoters, i.e. the higher the promoter output the lower the corresponding noise level (33).
The methodology presented could be of significant value to predictably tune and control gene expression in living cells and has a wide range of potential applications in industrial biotechnology and synthetic biology. First, the engineered signaling modules themselves serve as a library of inducible gene expression systems with different sensitivities and dynamic ranges, providing options for biotechnologists and chemical biologists to drive candidate downstream genes or transcriptional pathways of vastly different input-output strengths (11,34). As our results demonstrate, the method is also well-suited to improve the detection limits of synthetic cell-based biosensors for practical applications in metabolic engineering (7,35), environmental hazard monitoring (25) and disease diagnostics (36). Moreover, our approach can be applied to reduce the amount of expensive chemical inducers required to achieve sufficient induction of promoters for recombinant protein production in industrial bioreactors (3) by increasing the sensitivity and dynamic range of the cognate inducible promoter (e.g. the aTc inducible Ptet2).
SUPPLEMENTARY DATA
Supplementary Data are available at NAR Online.
FUNDING
Royal Society [RG120527]; BBSRC [BB/K016288/1]. SULSA (Scottish Universities Life Sciences Alliance) and Wellcome Trust ISSF [to B.W.]; EPSRC [EP/I032223/1 to M.B.]. Funding for open access charge: Research Councils UK (RCUK).
Author Contributions: B.W. conceived the study and designed the experiments; B.W. performed the experiments and analyzed the data with input from M.B. All the authors were involved in interpretation of results and preparation of the manuscript.
Conflict of interest statement. None declared.
REFERENCES
- 1.Ulrich L.E., Koonin E.V., Zhulin I.B. One-component systems dominate signal transduction in prokaryotes. Trends Microbiol. 2005;13:52–56. doi: 10.1016/j.tim.2004.12.006. [DOI] [PMC free article] [PubMed] [Google Scholar]
- 2.Lutz R., Bujard H. Independent and tight regulation of transcriptional units in Escherichia coli via the LacR/O, the TetR/O and AraC/I1-I2 regulatory elements. Nucleic Acids Res. 1997;25:1203–1210. doi: 10.1093/nar/25.6.1203. [DOI] [PMC free article] [PubMed] [Google Scholar]
- 3.Terpe K. Overview of bacterial expression systems for heterologous protein production: from molecular and biochemical fundamentals to commercial systems. Appl. Microbiol. Biotechnol. 2006;72:211–222. doi: 10.1007/s00253-006-0465-8. [DOI] [PubMed] [Google Scholar]
- 4.Wang B., Kitney R.I., Joly N., Buck M. Engineering modular and orthogonal genetic logic gates for robust digital-like synthetic biology. Nat. Commun. 2011;2:508. doi: 10.1038/ncomms1516. [DOI] [PMC free article] [PubMed] [Google Scholar]
- 5.Ellis T., Wang X., Collins J.J. Diversity-based, model-guided construction of synthetic gene networks with predicted functions. Nat. Biotech. 2009;27:465–471. doi: 10.1038/nbt.1536. [DOI] [PMC free article] [PubMed] [Google Scholar]
- 6.Kotula J.W., Kerns S.J., Shaket L.A., Siraj L., Collins J.J., Way J.C., Silver P.A. Programmable bacteria detect and record an environmental signal in the mammalian gut. Proc. Natl. Acad. Sci. U.S.A. 2014;111:4838–4843. doi: 10.1073/pnas.1321321111. [DOI] [PMC free article] [PubMed] [Google Scholar]
- 7.Zhang F., Keasling J. Biosensors and their applications in microbial metabolic engineering. Trends Microbiol. 2011;19:323–329. doi: 10.1016/j.tim.2011.05.003. [DOI] [PubMed] [Google Scholar]
- 8.Zhang F., Carothers J.M., Keasling J.D. Design of a dynamic sensor-regulator system for production of chemicals and fuels derived from fatty acids. Nat. Biotechnol. 2012;30:354–359. doi: 10.1038/nbt.2149. [DOI] [PubMed] [Google Scholar]
- 9.Schmidt F.R. Recombinant expression systems in the pharmaceutical industry. Appl. Microbiol. Biotechnol. 2004;65:363–372. doi: 10.1007/s00253-004-1656-9. [DOI] [PubMed] [Google Scholar]
- 10.Blazeck J., Alper H.S. Promoter engineering: recent advances in controlling transcription at the most fundamental level. Biotechnol. J. 2013;8:46–58. doi: 10.1002/biot.201200120. [DOI] [PubMed] [Google Scholar]
- 11.Ang J., Harris E., Hussey B.J., Kil R., McMillen D.R. Tuning response curves for synthetic biology. ACS Synth. Biol. 2013;2:547–567. doi: 10.1021/sb4000564. [DOI] [PMC free article] [PubMed] [Google Scholar]
- 12.Wang B., Barahona M., Buck M. Engineering modular and tunable genetic amplifiers for scaling transcriptional signals in cascaded gene networks. Nucleic Acids Res. 2014;42:9484–9492. doi: 10.1093/nar/gku593. [DOI] [PMC free article] [PubMed] [Google Scholar]
- 13.Blazeck J., Liu L., Redden H., Alper H. Tuning gene expression in Yarrowia lipolytica by a hybrid promoter approach. Appl. Environ. Microbiol. 2011;77:7905–7914. doi: 10.1128/AEM.05763-11. [DOI] [PMC free article] [PubMed] [Google Scholar]
- 14.Cox R.S., Surette M.G., Elowitz M.B. Programming gene expression with combinatorial promoters. Mol. Syst. Biol. 2007;3:145. doi: 10.1038/msb4100187. [DOI] [PMC free article] [PubMed] [Google Scholar]
- 15.Lee T.-H., Maheshri N. A regulatory role for repeated decoy transcription factor binding sites in target gene expression. Mol. Syst. Biol. 2012;8:576. doi: 10.1038/msb.2012.7. [DOI] [PMC free article] [PubMed] [Google Scholar]
- 16.Curran K.A., Crook N.C., Karim A.S., Gupta A., Wagman A.M., Alper H.S. Design of synthetic yeast promoters via tuning of nucleosome architecture. Nat. Commun. 2014;5:4002. doi: 10.1038/ncomms5002. [DOI] [PMC free article] [PubMed] [Google Scholar]
- 17.Mazumder M., McMillen D.R. Design and characterization of a dual-mode promoter with activation and repression capability for tuning gene expression in yeast. Nucleic Acids Res. 2014;42:9514–9522. doi: 10.1093/nar/gku651. [DOI] [PMC free article] [PubMed] [Google Scholar]
- 18.Shetty R., Endy D., Knight T. Engineering BioBrick vectors from BioBrick parts. J. Biol. Eng. 2008;2:5. doi: 10.1186/1754-1611-2-5. [DOI] [PMC free article] [PubMed] [Google Scholar]
- 19.Huber P.J. Robust Statistics. New York: John Wiley & Sons; 1981. [Google Scholar]
- 20.Alon U. An Introduction to Systems Biology: Design Principles of Biological Circuits. London: Chapman & Hall/CRC; 2007. [Google Scholar]
- 21.Bertram R., Hillen W. The application of Tet repressor in prokaryotic gene regulation and expression. Microb. Biotechnol. 2008;1:2–16. doi: 10.1111/j.1751-7915.2007.00001.x. [DOI] [PMC free article] [PubMed] [Google Scholar]
- 22.Moon T.S., Lou C., Tamsir A., Stanton B.C., Voigt C.A. Genetic programs constructed from layered logic gates in single cells. Nature. 2012;491:249–253. doi: 10.1038/nature11516. [DOI] [PMC free article] [PubMed] [Google Scholar]
- 23.Guzman L., Belin D., Carson M., Beckwith J. Tight regulation, modulation, and high-level expression by vectors containing the arabinose PBAD promoter. J. Bacteriol. 1995;177:4121–4130. doi: 10.1128/jb.177.14.4121-4130.1995. [DOI] [PMC free article] [PubMed] [Google Scholar]
- 24.Stevens A., Greenberg E. Quorum sensing in Vibrio fischeri: essential elements for activation of the luminescence genes. J. Bacteriol. 1997;179:557–562. doi: 10.1128/jb.179.2.557-562.1997. [DOI] [PMC free article] [PubMed] [Google Scholar]
- 25.Wang B., Barahona M., Buck M. A modular cell-based biosensor using engineered genetic logic circuits to detect and integrate multiple environmental signals. Biosens. Bioelectron. 2013;40:368–376. doi: 10.1016/j.bios.2012.08.011. [DOI] [PMC free article] [PubMed] [Google Scholar]
- 26.Merulla D., Hatzimanikatis V., van der Meer J.R. Tunable reporter signal production in feedback-uncoupled arsenic bioreporters. Microb. Biotechnol. 2013;6:503–514. doi: 10.1111/1751-7915.12031. [DOI] [PMC free article] [PubMed] [Google Scholar]
- 27.Diorio C., Cai J., Marmor J., Shinder R., DuBow M.S. An Escherichia coli chromosomal ars operon homolog is functional in arsenic detoxification and is conserved in gram-negative bacteria. J. Bacteriol. 1995;177:2050–2056. doi: 10.1128/jb.177.8.2050-2056.1995. [DOI] [PMC free article] [PubMed] [Google Scholar]
- 28.Merulla D., Buffi N., Beggah S., Truffer F., Geiser M., Renaud P., van der Meer J.R. Bioreporters and biosensors for arsenic detection. Biotechnological solutions for a world-wide pollution problem. Curr. Opin. Biotechnol. 2012;24:534–541. doi: 10.1016/j.copbio.2012.09.002. [DOI] [PubMed] [Google Scholar]
- 29.Hammer K., Mijakovic I., Jensen P.R. Synthetic promoter libraries – tuning of gene expression. Trends Biotechnol. 2006;24:53–55. doi: 10.1016/j.tibtech.2005.12.003. [DOI] [PubMed] [Google Scholar]
- 30.Hawkins A.C., Arnold F.H., Stuermer R., Hauer B., Leadbetter J.R. Directed evolution of Vibrio fischeri LuxR for improved response to butanoyl-homoserine lactone. Appl. Environ. Microbiol. 2007;73:5775–5781. doi: 10.1128/AEM.00060-07. [DOI] [PMC free article] [PubMed] [Google Scholar]
- 31.Galvão T.C., de Lorenzo V. Transcriptional regulators à la carte: engineering new effector specificities in bacterial regulatory proteins. Curr. Opin. Biotechnol. 2006;17:34–42. doi: 10.1016/j.copbio.2005.12.002. [DOI] [PubMed] [Google Scholar]
- 32.Li G.-W., Burkhardt D., Gross C., Weissman J.S. Quantifying absolute protein synthesis rates reveals principles underlying allocation of cellular resources. Cell. 2014;157:624–635. doi: 10.1016/j.cell.2014.02.033. [DOI] [PMC free article] [PubMed] [Google Scholar]
- 33.Ozbudak E.M., Thattai M., Kurtser I., Grossman A.D., van Oudenaarden A. Regulation of noise in the expression of a single gene. Nat. Genet. 2002;31:69–73. doi: 10.1038/ng869. [DOI] [PubMed] [Google Scholar]
- 34.Arpino J.A.J., Hancock E.J., Anderson J., Barahona M., Stan G.-B.V., Papachristodoulou A., Polizzi K. Tuning the dials of Synthetic Biology. Microbiology. 2013;159:1236–1253. doi: 10.1099/mic.0.067975-0. [DOI] [PMC free article] [PubMed] [Google Scholar]
- 35.Moser F., Horwitz A., Chen J., Lim W.A., Voigt C.A. Genetic Sensor for Strong Methylating Compounds. ACS Synth. Biol. 2013;2:614–624. doi: 10.1021/sb400086p. [DOI] [PMC free article] [PubMed] [Google Scholar]
- 36.Anderson J.C., Clarke E.J., Arkin A.P., Voigt C.A. Environmentally controlled invasion of cancer cells by engineered bacteria. J. Mol. Biol. 2006;355:619–627. doi: 10.1016/j.jmb.2005.10.076. [DOI] [PubMed] [Google Scholar]
Associated Data
This section collects any data citations, data availability statements, or supplementary materials included in this article.