Abstract
In cardiac ischemia-reperfusion injury, reactive oxygen species (ROS) generation and upregulation of the hypoxia-inducible protein BNIP3 result in mitochondrial permeabilization, but impairment in autophagic removal of damaged mitochondria provokes programmed cardiomyocyte death. BNIP3 expression and ROS generation result in upregulation of beclin-1, a protein associated with transcriptional suppression of autophagy-lysosome proteins and reduced activation of transcription factor EB (TFEB), a master regulator of the autophagy-lysosome machinery. Partial beclin-1 knockdown transcriptionally stimulates lysosome biogenesis and autophagy via mTOR inhibition and activation of TFEB, enhancing removal of depolarized mitochondria. TFEB activation concomitantly stimulates mitochondrial biogenesis via PGC1α induction to restore normally polarized mitochondria and attenuate BNIP3- and hypoxia-reoxygenation-induced cell death. Conversely, overexpression of beclin-1 activates mTOR to inhibit TFEB, resulting in declines in lysosome numbers and suppression of PGC1α transcription. Importantly, knockdown of endogenous TFEB or PGC1α results in a complete or partial loss, respectively, of the cytoprotective effects of partial beclin-1 knockdown, indicating a critical role for both mitochondrial autophagy and biogenesis in ensuring cellular viability. These studies uncover a transcriptional feedback loop for beclin-1-mediated regulation of TFEB activation and implicate a central role for TFEB in coordinating mitochondrial autophagy with biogenesis to restore normally polarized mitochondria and prevent ischemia-reperfusion-induced cardiomyocyte death.
INTRODUCTION
Preservation of healthy mitochondria is essential for energy generation and maintenance of contractile function in cardiac myocytes (1). In cardiac ischemia-reperfusion (IR) injury, mitochondrial permeabilization results in activation of programmed cell death pathways and cardiomyocyte loss (2). Removal of damaged mitochondria by macroautophagy, a lysosomal degradative pathway, is essential to prevent cardiomyocyte death and limit myocardial infarct size (3, 4). Cardiomyocyte autophagy is upregulated with IR injury (5), but autophagosome processing is impaired early after reperfusion, which prevents autophagic removal of damaged mitochondria (6). The hypoxic insult also provokes transcriptional induction of BNIP3 (Bcl2 and nineteen-kilodalton interacting protein 3), a prodeath Bcl2 family protein (7, 8) which is targeted to and permeabilizes mitochondria (9–11) and triggers cardiomyocyte death in IR injury (12). While BNIP3 has been suggested to facilitate mitochondrial autophagy by functioning as an adaptor to sequester damaged mitochondria within autophagosomes (13, 14), increased BNIP3 expression provokes declines in lysosome numbers, with impaired autophagic flux, resulting in accumulation of damaged mitochondria and cardiomyocyte death (15). These observations implicate a failure of the autophagy-lysosome machinery to clear damaged mitochondria as a cause of cell death with IR injury, but the underlying mechanisms remain to be defined.
Mitochondria are also targeted for degradation by starvation, wherein autophagy is critical for cell survival (16, 17). Interestingly, with starvation, lysosome numbers rapidly plummet (18), but endogenous mechanisms are promptly recruited to drive reformation of new lysosomes (18–20). This is facilitated via a transcriptional induction of autophagy-lysosome machinery proteins orchestrated by nuclear translocation of the basic helix-loop-helix (bHLH) transcription factor EB (TFEB) (21–25), a master inducer of the autophagy-lysosome machinery (23), thereby sustaining autophagic flux. In contrast, lysosome numbers progressively decline with BNIP3-induced autophagy, without replenishment (15), suggesting that an impairment in this transcriptional response engenders “insufficient” cytoprotective autophagy.
Relevant to this discussion is our observation that upon reperfusion/reoxygenation, a rapid reactive oxygen species (ROS)-induced increase in beclin-1 abundance paradoxically impairs autophagic flux in cardiomyocytes (6). Interestingly, while basal beclin-1 levels play critical roles in autophagosome formation (26) and protection against cardiomyocyte death (6), we observed that increased beclin-1 abundance is sufficient to suppress transcription of autophagy-lysosome machinery genes (6). Taken together with the in vivo observation that haploinsufficiency of beclin-1 by targeted disruption of a BECN1 allele confers cytoprotection in cardiac IR injury (5), these data suggest the hypothesis that ROS-induced upregulation of beclin-1 transcriptionally impairs the lysosomal machinery to prevent removal of damaged mitochondria and cause cell death with BNIP3 expression and hypoxia-reoxygenation injury. In this study, we uncovered an autoregulatory loop whereby beclin-1 levels regulate TFEB activity, which coordinates mitochondrial autophagy with biogenesis to control mitochondrial quality and regulate stress-induced cardiomyocyte death.
MATERIALS AND METHODS
In vivo ischemia-reperfusion modeling.
BECN1 heterozygous null mice (BECN1+/−; mice with haploinsufficiency of beclin-1) (26) and wild-type (WT) mice of the C57BL/6 strain were obtained from Jackson Laboratories and subjected to reversible left anterior descending (LAD) coronary artery occlusion to induce ischemia for 30 min, followed by 4 h of reperfusion, as described previously (6). Briefly, mice were anesthetized with a mixture of ketamine (80 mg/kg of body weight) and xylazine (5 mg/kg), surgically prepped, and ventilated. After thoracotomy, the LAD artery was identified, and a 9-0 polypropylene suture was passed under the LAD artery. A knot was tied over a 1-mm section of PE-10 tubing placed directly over the vessel to create the occlusion. Ischemia was confirmed by an absence of blood flow, verified visually, and by the presence of ST elevations on electrocardiogram (EKG). Reperfusion was induced to release the occlusion, which was confirmed by resolution of ST segment elevation. At sacrifice, the ventricles were sectioned into three pieces; the apical 1/3 was subjected to biochemical analysis as the “injured” region, and the basal 1/3 was processed as the “remote” region. Sham-treated mice underwent the entire surgical procedure without occlusion of the LAD artery. Autophagic flux was assessed in comparison to that of mice pretreated with chloroquine (CQ; 40 mg/kg, administered intraperitoneally [i.p.]) 30 min prior to IR modeling, as previously described (6, 27). All animal studies were approved by the Animal Studies Committee at the Washington University School of Medicine and the Institutional Animal Care and Use Committee at the John Cochran VA Medical Center.
Cell culture.
Isolation of neonatal rat cardiac myocytes (NRCMs) was performed as described previously (6). Hearts were removed from 1-day-old Sprague-Dawley rats, the atria and great vessels were trimmed off, and tissue was finely minced, followed by sequential digestion with 0.5 mg/ml collagenase (Worthington Biochemical, NJ). Ventricular cardiomyocytes were separated from fibroblasts by differential plating in medium containing Dulbecco's modified Eagle's medium (DMEM), 10% horse serum, 5% fetal calf serum, 100 μmol/liter bromodeoxyuridine, penicillin, streptomycin, and l-glutamine, followed by tissue culture in gelatin-coated plates in medium containing modified DMEM, 100 μM bromodeoxyuridine, penicillin, streptomycin, l-glutamine, 10 ng/ml insulin, 10 μg/ml transferrin, and 0.5 mg/ml bovine serum albumin.
Nutrient deprivation was induced by culture in serum-free Hanks balanced salt solution (HBSS; Invitrogen). HEK293 cells were cultured as described previously (15).
Hypoxia modeling.
Cells were subjected to hypoxia in vitro in an oxygen control cabinet (Coy Laboratories, Grass Lake, MI) mounted within an incubator and equipped with an oxygen sensor for continuous oxygen level monitoring. A mixture of 95% nitrogen and 5% CO2 was infused to create hypoxia, and oxygen levels in the chamber were monitored and maintained at <1%, as described previously (6).
Generation of adenoviral constructs.
Lentiviral particles coding for mCherry-GFP-LC3 expression have been described (6). Adenoviral delivery of constructs was employed to achieve a high efficiency of transduction and permit evaluation of dose-dependent effects in primary NRCMs, as previously described (6, 15). Adenoviral particles for expression of short hairpin RNAs (shRNAs) targeting rat TFEB, BECN1, and PPARGC1α were generated with the BLOCKiT adenoviral system (Invitrogen). Specific oligonucleotide sequences employed were as follows (with targeted coding sequences underlined): (i) shRNA targeting rat TFEB, 5′-CACCGAATCAAGGAGCTGGGAATGCTGATCGAAATCAGCATTCCCAGCTCCTTGATTC-3′ (top-strand oligonucleotide) and 5′-AAAAGAATCAAGGAGCTGGGAATGCTGATTTCGATCAGCATTCCCAGCTCCTTGATTC-3′ (bottom-strand oligonucleotide); (ii) shRNA targeting BECN1 (annotated shBECN1-2), 5′-CACCGCTCAGTACCAGCGAGAATATCGAAATATTCTCGCTGGTACTGAGC-3′ (top-strand oligonucleotide) and 5′-AAAAGCTCAGTACCAGCGAGAATATTTCGATATTCTCGCTGGTACTGAGC-3′ (bottom-strand oligonucleotide); and (iii) shRNA targeting rat PPARGC1α, 5′-CACCGAGCAAGTATGACTCTCTGCGAACAGAGAGTCATACTTGCTC-3′ (top-strand oligonucleotide) and 5′-AAAAGAGCAAGTATGACTCTCTGTTCGCAGAGAGTCATACTTGCTC-3′ (bottom-strand oligonucleotide).
Adenoviral particles for shRNAs targeting BECN1 (annotated shBECN1-1) (5) and LacZ, as a nontargeting control for studies with shRNA-mediated knockdown, and for overexpression of LacZ (as a control), green fluorescent protein (GFP)-tagged LC3, FLAG-hBNIP3, mBECLIN-1, and hemagglutinin (HA)-tagged hTFEB have been described previously (15). Adenoviral particles for expression of FLAG-PPARGC1α were engineered with a tagging coding sequence for human PPARGC1α with a FLAG tag at the N terminus, using Gateway cloning technology (Invitrogen). Viral particles were generated per the manufacturer's instructions. In all experiments, control adenoviral particles were added to groups as necessary to ensure equal viral particle doses, i.e., multiplicities of infection (MOIs), between groups.
Assessment of cell death.
Cell death assays were performed in 96-well plates (Nunc, Fisher) with a Live-Dead cytotoxicity viability kit for mammalian cells (Invitrogen), using a Tecan Infinite M200 Pro microplate reader (Tecan) following the manufacturer's instructions, as described previously (6).
Assessment of TUNEL positivity.
Terminal deoxynucleotidyltransferase-mediated dUTP-biotin nick end labeling (TUNEL) was performed on fixed and permeabilized NRCMs by using the Dead-End fluorometric TUNEL system (Promega) following the manufacturer's directions, as previously described (15).
Cellular ATP content analysis.
NRCMs were transduced with adenoviral particles for 24 h and then trypsinized, and 5 × 10⁴ cells were plated in each well of a 96-well plate. Cellular ATP levels were quantified using a luciferase reaction-based assay kit (CellTiter-Glo reagent; Promega), and readings were normalized to those of viable cells assessed by the trypan blue exclusion method as previously described (28).
Immunofluorescence imaging.
Imaging for mCherry-GFP-LC3 and LysoTracker Red was performed with live NRCMs, and imaging for GFP-LC3, LAMP1, and TFEB (with immunofluorescence of the HA tag) was performed with NRCMs fixed with 4% paraformaldehyde (20 min) and then permeabilized with 0.1% Triton X-100 (5 min), using an Axioscap upright microscope fitted with an AxioCam HRC camera and Plan Neofluar objectives (20× [numerical aperture {NA} = 0.60], 40× [NA = 0.75], and 63× [oil] [NA = 1.25] [Zeiss]), along with appropriate filter cubes, as previously described (6). Nuclear localization of TFEB was assessed in 60 cells/group. LAMP1-positive puncta in 50 cells/group were counted using ImageJ software as described previously (15), and results are expressed as numbers of dots/nucleus. Imaging for BNIP3 and COX-IV was performed on fixed and permeabilized NRCMs with a Zeiss confocal LSM 700 laser scanning confocal microscope using 63× Zeiss Plan-Neofluar 40×/1.3 and 63×/1.4 oil immersion objectives. Nuclei were stained blue with Hoechst dye (for live-cell imaging) (H3750; Invitrogen) or DAPI (4′,6-diamidino-2-phenylindole) (for fixed cells) (H1200; Vector Laboratories). Epifluorescence and confocal images were acquired and analyzed using Zeiss Axiovision and Zen 2010 software, respectively.
Flow cytometric assessment.
NRCMs were incubated with LysoTracker Red (1 mmol/liter for 15 min) to assess lysosome abundance, with nonyl-acridine orange (NAO) (a cardiolipin-binding dye; 10 nmol/liter for 15 min) and Mitotracker Green (200 nmol/liter for 45 min) to assess mitochondrial mass, with JC-1 (10 mg/ml for 10 min) or tetramethylrhodamine, ethyl ester (TMRE; 50 nmol/liter for 30 min) to assess mitochondrial polarization, and with carboxy-H2DCFDA (a cell-permeating ROS indicator; 10 μmol/liter for 30 min) to assess the levels of ROS. Following incubation with these compounds at 37°C in 5% CO2, the cells were trypsinized and subjected to flow cytometry on a FACScan instrument (Becton-Dickinson) as previously described (15). Cyflogic software (CyFlo) was employed to analyze 20,000 events per run.
Assessment of mitochondrial DNA content.
Mitochondrial DNA content was assessed by quantitative PCR analysis as previously described (29). Briefly, DNA was prepared from NRCM pellets, and real-time quantitative PCR was performed for the mitochondrial gene NADH2 (with primers 5′-ATCACCACCATTCTCGCAAT-3′ and 5′-TCCTATGTGGGCAATTGATG-3′) and the nuclear gene RCAN1 (with primers 5′-GGTTTGCTGAGCCTCGAAG-3′ and 5′-CTTCATCCCTCCTTTGTAAC-3′). The ratio of copies of mitochondrial to nuclear genes represents the relative mitochondrial DNA content.
Assessment of mitochondrial fragmentation.
Mitochondrial morphology was ascertained to be fragmented or tubular by visual inspection of individual cells at a high magnification, as described previously (30). Fifty cells were evaluated per experimental group, and results are expressed as percentages of cells showing predominantly fragmented mitochondria.
Assessment of mitochondrial polarization.
Mitochondrial depolarization was assessed by expression of TMRE or with the ratiometric dye JC-1, which aggregates into red fluorescent polymers in normally polarized mitochondria but is predominantly observed as green fluorescent monomers in cells with depolarized mitochondria, as previously described (6, 15).
TEM.
NRCMs were fixed in modified Karnovsky's fixative (3% glutaraldehyde, 1% paraformaldehyde in 0.1 M sodium cacodylate buffer), followed by postfixation in 2% osmium tetroxide in 0.1 M sodium cacodylate buffer for 1 h. The cells were then stained with 2% aqueous uranyl acetate for 30 min, dehydrated in a series of graded ethanol concentrations, and embedded in PolyBed (Polysciences). Blocks were sectioned at a 90-nm thickness, poststained with Venable's lead citrate, and viewed with a JEOL model 1200EX transmission electron microscope (TEM) (JEOL, Tokyo, Japan). Digital images were acquired using an AMT Advantage HR (Advanced Microscopy Techniques, Danvers, MA) high-definition charge-coupled device (CCD) 1.3-megapixel TEM camera.
Assessment of promoter-driven luciferase activity.
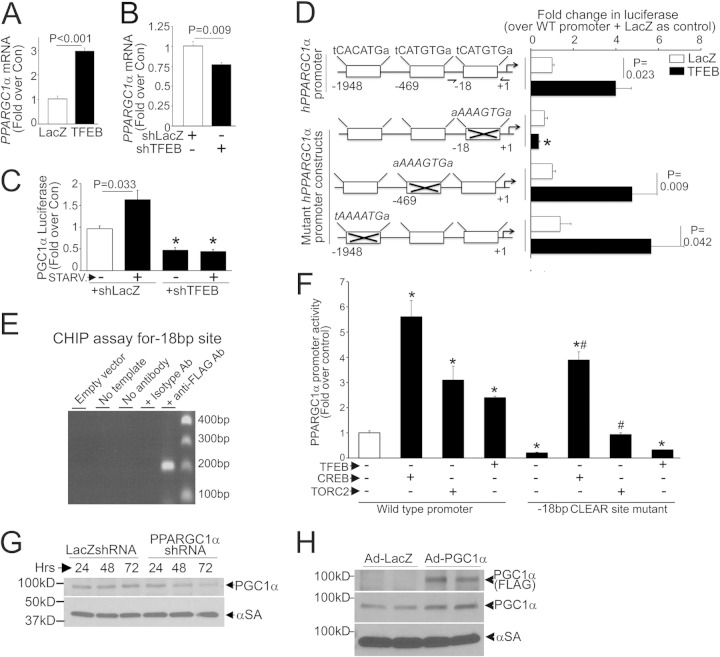
A total of 3 × 10⁴ cells were plated per well of a 96-well plate and transfected with the PGL3.Luc vector, carrying a 2,760-bp fragment of the human PPARGC1α promoter (for firefly luciferase expression), and the pRL-SV40 vector (for Renilla luciferase expression [31]) at a 100:1 ratio, using Lipofectamine 2000 (Invitrogen). Constructs coding for the human PPARGC1α promoter (GenBank accession number NG_028250.1) with individual mutations in the three CLEAR sites detected within (as depicted in Fig. 9D) were generated by site-directed mutagenesis using a QuikChange Lightning site-directed mutagenesis kit (Stratagene) and verified by sequencing. Luciferase activity was measured with a dual-luciferase assay kit (Promega) and a Tecan Infinite M200 Pro microplate reader (Tecan) following the manufacturers' instructions. Firefly luciferase values were normalized to those for Renilla luciferase to control for transfection efficiency. To assess whether the bp −18 site mutant construct retained activity to drive transcriptional activation (other than that driven by TFEB), HEK293 cells were transfected with the PGL3.Luc vector, driven by the human PPARGC1α promoter without (i.e., wild-type promoter) or with mutations in the “CLEAR sequence,” located 69 bp upstream of the transcriptional start site (i.e., −18 CLEAR site mutant), together with pRL-SV40 for Renilla luciferase expression (at a ratio of 100:1). In addition, cells were cotransfected with expression vectors coding for the constitutively active transcription factor CREB, the CREB activator TORC2 (i.e., CRTC2) (see below for details), TFEB (pAd-CMV/V5-hTFEB), or LacZ (pAd-CMV/V5-LacZ) (as a control), and luciferase activities were measured 48 h after transfection. Firefly luciferase readings were normalized to those for Renilla luciferase to control for transfection efficiency.
FIG 9.
TFEB stimulates PGC1α transcription in NRCMs. (A and B) PPARGC1α transcript levels in NRCMs transduced with TFEB or LacZ (MOI = 100; 48 h; n = 4) (A) or with shTFEB or shLacZ (MOI = 1; 72 h; n = 4) (B). (C) Promoter-driven luciferase activities in NRCMs transduced with shTFEB or shLacZ (MOI = 1; 72 h), with or without starvation (6 h) (n = 12 to 22). (D) (Left) TFEB target (CLEAR) sequences in the human PPARGC1α promoter, numbered backwards from the transcriptional start site (arrow), and in mutants (crossed out). (Right) Promoter-driven luciferase activities in NRCMs transfected with the various constructs shown at left, followed by transduction with TFEB or LacZ (MOI = 100; 48 h) (n = 7 to 23). (E) CHIP analysis for a PCR amplicon flanking the bp −18 CLEAR site in HEK cells transfected as described for panel A. Primers are depicted in panel D (left). Immunoprecipitation with an isotype control antibody was employed as a control (see Materials and Methods). (F) Promoter-driven luciferase activities in HEK293 cells expressing CREB, TORC2, TFEB, or LacZ (as a control) (n = 4). * and #, P < 0.05 versus WT promoter plus LacZ (white bar) and versus bp −18 CLEAR site mutant plus LacZ (5th bar from left), respectively. (G and H) Expression of PGC1α protein in NRCMs transduced with shPPARGC1α (or shLacZ) (MOI = 100) (G) or with FLAG-PGC1α or LacZ (MOI = 100; 24 h) (H).
Subcellular fractionation.
NRCMs were subjected to biochemical fractionation to recover nucleus-enriched and cytoplasmic fractions, as previously described (23). Hearts were fractionated into nucleus-enriched and cytoplasmic samples by using a CelLytic NuCLEAR extraction kit (Nxtract; Sigma). Expression of proteins localized to the nucleus (histone H3) and cytoplasm (glyceraldehyde-3-phosphate dehydrogenase [GAPDH]) was examined to confirm relative enrichment.
Coimmunoprecipitation studies.
Murine embryonic fibroblasts (MEFs) from C57BL/6 wild-type mice were adenovirally transduced with beclin-1–HA (MOI = 100) or transfected with N-terminal HA-tagged TSC1 (Addgene) (32). Three hundred micrograms of protein was incubated with anti-HA (H3663; Sigma) or normal rabbit IgG, and immunoprecipitation was performed using DynaBeads (Invitrogen).
Immunoblotting.
Immunoblotting was performed on cellular extracts by use of previously described techniques (15). Antibodies employed were as follows: antibodies for FLAG (F3165; Sigma), HA (H6908; Sigma), LAMP1 (AB24170; Abcam), beclin-1 (ab16998 [Abcam] and sc-11427 [Santa Cruz]), p70S6K (2708; Cell Signaling), p-p70S6K (9234; Cell Signaling), 4-EBP1 (9644; Cell Signaling), p-4EBP1 (2855; Cell Signaling), p-mTOR (2974; Cell Signaling), mTOR (2983; Cell Signaling), histone H3 (9715; Cell Signaling), TFEB (MBS120432; employed to detect adenovirally transduced HA-tagged human TFEB when HA detection was precluded for specificity), GAPDH (ab22555; Abcam), peroxisome proliferator-activated receptor gamma coactivator 1α (PGC1α) (ab106814; Abcam), tuberous sclerosis complex 1 (TSC1) (6935; Cell Signaling), and tuberous sclerosis complex 2 (TSC2) (3612; Cell Signaling). Murine TFEB was detected with a Bethyl Labs antibody (A303-673A). The multiple immunoreactive TFEB bands observed (see Fig. 12C and D) likely represent various TFEB isoforms (NP_001155194.1 and NP_035679.3) or posttranslationally modified forms of the protein in the myocardium. Immunoblotting for α-sarcomeric actin (αSA) (ab52219; Abcam) was employed as a loading control unless otherwise indicated. ImageJ software was employed for quantitative analysis. Protein abundance was normalized to α-sarcomeric actin protein expression and reported as the fold change versus the control. Chemicals employed were as follows: 3-methyladenine (3MA; EMD4Biosciences), torin-1 (Tocris), MG-132 (Cayman Chemical Company), and MnTMPyP (Calbiochem). Equivalent quantities of appropriate diluent were employed as controls in all studies in which these chemicals were employed.
FIG 12.
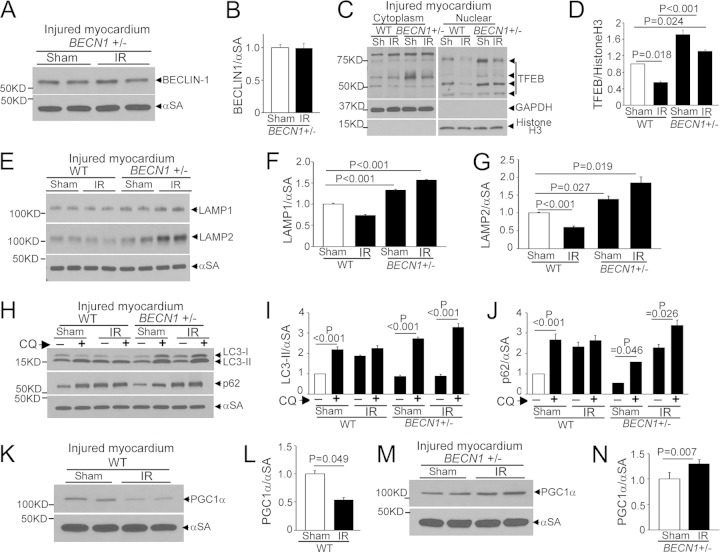
BECN1 haploinsufficiency prevents IR-induced TFEB inactivation. (A and B) Immunoblot (A) and quantitation (B) of beclin-1 in IR-injured (or sham-treated) myocardia from BECN1+/− mice (n = 4). (C and D) Immunoblot depicting myocardial TFEB (C) and quantitation of nuclear TFEB (D) in WT and BECN1+/− mice subjected to IR injury (or sham [Sh] procedure) followed by subcellular fractionation (n = 3). White lines in panel C separate parts of the same gel. (E to G) Immunoblot (E) and quantitation of LAMP1 (F) and LAMP2 (G) in IR-injured (or sham-treated) WT and BECN1+/− myocardia (n = 4). (H to J) Immunoblot (H) and quantitation of LC3-II (I) and p62 (J) in IR-injured (or sham-treated) WT and BECN1+/− myocardia that were pretreated with CQ or diluent to assess autophagic flux (n = 3). (K to N) Immunoblots (K and M) and quantitation of PGC1α (L and N) in IR-injured (or sham-treated) WT (K and L) and BECN1+/− (M and N) myocardia (n = 4).
Quantitative PCR analysis for mRNA.
Real-time PCR was performed as described previously (6). Briefly, total RNA was prepared from NRCMs by use of an RNA-easy minikit (Qiagen), and cDNA was synthesized with 1 μg of total RNA by using the SuperScript III first-strand synthesis system (Invitrogen). One microliter of cDNA template was mixed with 12.5 μl of 2× SYBR green PCR master mix (Invitrogen) and subjected to quantitative PCR in triplicate under the following conditions: 50°C for 2 min and 95°C for 10 min followed by 40 cycles of 95°C for 15 s and 60°C for 1 min in an ABI7500 Fast real-time PCR system. The GAPDH gene was also amplified in parallel as a reference for the quantification of transcripts. Primer sets employed are shown in Table 1. Results were calculated using the ΔΔCT method and expressed as previously described (6).
TABLE 1.
Primer sequences employed for qPCR analysis of the indicated genes
| Target gene | Primer sequence (5′–3′) |
|
|---|---|---|
| Forward | Reverse | |
| Rat genes | ||
| MAP1LC3B | TTTGTAAGGGCGGTTCTGAC | CAGGTAGCAGGAAGCAGAGG |
| SQSTM1 | GCTGCCCTGTACCCACATCT | CGCCTTCATCCGAGAAAC |
| LAMP1 | TCTTCAGCGTGCAAGTCCAG | ATGAGGACGATGAGGACCAG |
| PPARGC1α | ATGAATGCAGCGGTCTTAGC | AACAATGGCAGGGTTTGTTC |
| BECN1 | TTCAAGATCCTGGACCGAGTGAC | AGACACCATCCTGGCGAGTTTC |
| TFEB | GTCCAGCAGCCACCTGAACGT | ACCAGGGAAGCCGTGACCTG |
| LAMP2A | CCAAATTGGGATCCTAACCTAA | TGGTGAAGCAGTGTTTATTAATTCC |
| LAMP2B | GGTGCTGGTCTTTCAGGCTTGATT | ACCACCCAATCTAAGAGCAGGACT |
| CTSB | AAATCAGGCGTATACAAGCATGAA | AGCCCAGAATGCGGATGG |
| CTSD | CTGAGTGGCTTCATGGGGAT | CCTGACAGTGAAGAAGGAGC |
| RAB7 | TTACTTCGAGACCAGTGCCAAGGA | TGTCCAGTTTGATGGGTTCAGGGA |
| GAPDH | GGCCGAGGGCCCACTA | TGTTGAAGTCACAGGAGACAACCT |
| RPS12 | AAGGCATAGCTGCTGGAGGTGTAA | AGTTGGATGCGAGCACACACAGAT |
| RPL32 | CCTCTGGTGAAGCCCAAGATC | TCTGGGTTTCCGCCAGTTT |
| Mouse genes | ||
| MAP1LC3B | CGTCCTGGACAAGACCAAGT | ATTGCTGTCCCGAATGTCTC |
| LAMP1 | TCTTCAGTGTGCAGGTCCAG | ATGAGGACGATGAGGACCAG |
| PPARGC1α | ATGAATGCAGCGGTCTTAGC | AACAATGGCAGGGTTTGTTC |
| BECN1 | AATCTAAGGAGTTGCCGTTATAC | CCAGTGTCTTCAATCTTGCC |
| TFEB | GTCTAGCAGCCACCTGAACGT | ACCATGGAGGCTGTGACCTG |
| LAMP2A | CCAAATTGGGATCCTAACCTAA | TGGTCAAGCAGTGTTTATTAATTCC |
| LAMP2B | GGTGCTGGTCTTTCAGGCTTGATT | ACCACCCAATCTAAGAGCAGGACT |
| RAB7 | TTACTTCGAGACCAGTGCCAAGGA | TGTCCAGTTTGATGGGTTCAGGGA |
| CTSB | AAATCAGGAGTATACAAGCATGA | GCCCAGGGATGCGGATGG |
| CTSD | CTGAGTGGCTTCATGGGAAT | CCTGACAGTGGAGAAGGAGC |
| SQSTM1 | GCTGCCCTATACCCACATCT | CGCCTTCATCCGAGAAAC |
| GAPDH | ACTCCCACTCTTCCACCTTC | TCTTGCTCAGTGTCCTTGC |
| RPS12 | AAGACCGCCCTCATCCACGATG | TTGGTGCTCAGCACAAAGTGCC |
| RPL32 | CCTCTGGTGAAGCCCAAGATC | TCTGGGTTTCCGCCAGTTT |
ChIP assays.
Chromatin immunoprecipitation (ChIP) was performed as previously reported (25, 33). Briefly, HEK293A cells were transfected with the empty pAAV-CMV-TFEB-IRES-GFP construct, described earlier (34), or with empty vector (as a control) for 48 h. Cells were collected, fixed with 1% formaldehyde for 10 min, and lysed on ice with ChIP lysis buffer (50 mM Tris-HCl, pH 7.5, 100 mM NaCl, 1% Triton X-100, 1% Tween 20) for 20 min. The lysate was digested with micrococcal nuclease (Sigma) for 15 min at 37°C, and the reaction was terminated using EDTA (2 mM) and sodium dodecyl sulfate (SDS; 1%). SDS-Out (Pierce) was employed to precipitate the unbound SDS, and lysates diluted 1:1 with ChIP dilution buffer (50 mM Tris-HCl, pH 7.5, 100 mM NaCl, 0.5% Triton X-100, 2 mM EDTA) were incubated with high-capacity NeutrAvidin agarose (Pierce). Biotinylated anti-FLAG antibody (F9291; Sigma) or isotype control IgG1 (M9035; Sigma) was precoupled with NeutrAvidin beads for 30 min at 4°C, and the protein-DNA complexes were immunoprecipitated overnight at 4°C. After six washes, the DNA was eluted by addition of 8 mM biotin, 1% SDS in Tris-EDTA (TE) buffer and precipitated after reversing the cross-linkage by use of 200 mM NaCl at 65°C overnight. PCR was performed using primers flanking the CLEAR site 18 bp upstream of the transcriptional start site (forward primer, 5′-CGTCACGAGTTAGAGCAGCA-3′; and reverse primer, 5′-TCGCCCTTAAGCTTTTTCAA-3′) (204-bp amplicon). An additional primer set within an adjacent segment located between the CLEAR sites at bp −18 and −469 (forward primer, 5′-CTGTCATGAAACAGGGAGCTTT-3′; and reverse primer, 5′-GCTTTGAATGCCACAGACTCTA-3′) (125-bp amplicon) did not generate a product, demonstrating specificity (data not shown).
Statistical analysis.
Results are expressed as means ± standard errors of the means (SEM), with the sample size (n) per group indicated in the figure legends. Assumptions of normality and equality of variance were verified, following which statistical differences were assessed with unpaired 2-tailed Student's t test for two experimental groups, one-way analysis of variance (ANOVA) for multiple groups, and two-way ANOVA for testing of two variables across multiple groups, using SPSS software. Bonferroni's and Dunnett's T3 post hoc tests were employed after ANOVA for testing for significant differences between groups for data with equal and unequal variances, respectively. Nonparametric tests were employed for data that were not normally distributed. A two-tailed P value of <0.05 was considered statistically significant.
RESULTS
BNIP3 expression increases beclin-1 abundance with transcriptional suppression of autophagy-lysosome machinery.
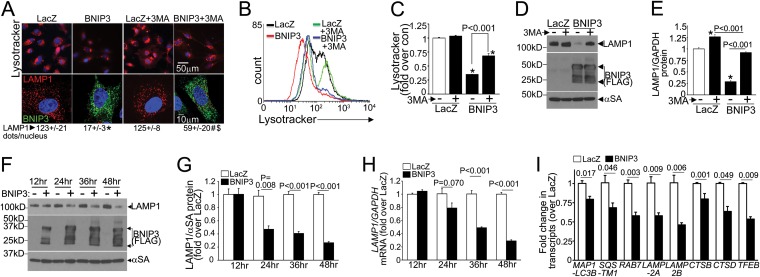
BNIP3, a Bcl-2 family prodeath protein, is transcriptionally induced in cardiac IR injury and provokes mitochondrial permeabilization (8, 11, 12). We have observed that BNIP3 expression provokes progressive declines in lysosome numbers, with accumulation of fragmented and depolarized mitochondria, leading to cell death (15), and that restoring lysosome biogenesis by exogenous TFEB expression reestablishes mitochondrial autophagy to rescue BNIP3-induced cell death (15). To examine the mechanisms for impaired autophagic removal of BNIP3-damaged mitochondria, we evaluated the regulation of the autophagy-lysosome machinery by adenoviral transduction of NRCMs with BNIP3. We hypothesized that the decline in lysosome number is driven by BNIP3-induced autophagy, as also observed early during starvation-induced autophagy (18). However, BNIP3-induced declines in lysosome abundance (assessed with the acidophilic dye LysoTracker Red [Fig. 1A to C] and by immunostaining for LAMP1 [a candidate lysosomal protein whose levels are used to track lysosome abundance {35}] [Fig. 1A]) and in LAMP1 protein abundance (Fig. 1D and E) were only partially restored with 3MA (a type III phosphatidylinositol 3-kinase inhibitor which inhibits autophagosome formation) (Fig. 1A to E), to 65%, 59%, and 72%, respectively, of the levels for similarly treated controls. This indicates that lysosome consumption in BNIP3-induced autophagy is only partly responsible for the observed decline in lysosome abundance (15). Importantly, we observed progressive declines in LAMP1 transcripts (Fig. 1H) paralleling the decline in LAMP1 protein abundance (Fig. 1F and G). This transcriptional suppression also affected multiple proteins (Fig. 1I) that participate in autophagy (LC3, p62, and RAB7), constitute the lysosomes (LAMP2A, LAMP2B, cathepsin B, and cathepsin D), and function as the master transcriptional regulator of the autophagy-lysosome machinery (TFEB) but did not alter expression of the unrelated ribosomal proteins RPL32 and RPS12 (changes in transcript/GAPDH abundances of 0.95- ± 0.02-fold [versus 1.01- ± 0.03-fold for LacZ] and 0.95- ± 0.03-fold [versus 1.04- ± 0.03-fold for LacZ], respectively; the P value was nonsignificant [NS]; n = 8). Taken together, these observations indicate that in contrast to the well-described transcriptional stimulation of the autophagy-lysosome machinery observed with starvation (21–24), BNIP3 expression results in transcriptional suppression of this machinery to prevent its replenishment, while autophagy is robustly induced to remove BNIP3-damaged mitochondria (15).
FIG 1.
BNIP3 expression results in transcriptional downregulation of autophagy-lysosome machinery. (A) Confocal images demonstrating LysoTracker fluorescence (top) and LAMP1 expression (bottom) in NRCMs transduced with BNIP3 (green) or LacZ (24 h), with or without 3MA (7 mmol/liter) and with quantitation of the number of LAMP1-positive dots/nucleus. *, #, and $, P < 0.05 versus LacZ, BNIP3, and BNIP3 plus 3MA, respectively. (B and C) Representative flow cytometric tracings (B) and quantitation (C) of LysoTracker fluorescence (n = 3). *, P < 0.05 versus control (con) (white bar). (D and E) Representative immunoblot (D) and quantitation (E) for LAMP1 in NRCMs treated as described for panel A (n = 3). *, P < 0.05 versus control (white bar). (F to H) Representative immunoblot (as previously described [15]) (F) and quantitation of LAMP1 protein (n = 3) (G) and LAMP1 transcripts (n = 4 to 6) (H) in NRCMs transduced with BNIP3 or LacZ for the indicated durations. (I) Levels of representative autophagy-lysosome machinery transcripts in NRCMs transduced with BNIP3 or LacZ (24 h; n = 8). All transductions were performed at an MOI of 100/sample.
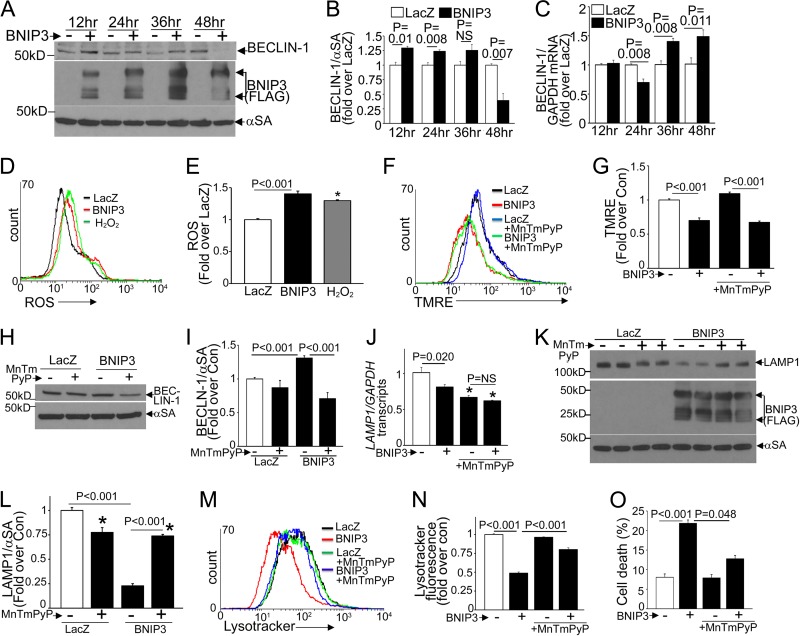
We and others have observed a rapid increase in beclin-1 abundance with reperfusion/reoxygenation injury (5, 6), and elevated beclin-1 levels transcriptionally suppress autophagy-lysosome machinery genes (6). Since BNIP3 expression is postulated to displace beclin-1 from its binding to Bcl2 as a mechanism for induction of autophagosome formation (14), we examined the effect of BNIP3 expression on beclin-1. Beclin-1 protein abundance was increased early (at 12 and 24 h) after BNIP3 transduction (Fig. 2A and B), and this was not due to transcriptional induction (Fig. 2C). In fact, BECN1 transcript levels were significantly reduced compared with those of controls at 24 h, coinciding with the suppression of other autophagy-lysosome machinery transcripts (Fig. 1I), and only increased subsequently, in parallel with a decline in beclin-1 protein abundance (Fig. 2B and C) secondary to consumption with persistent autophagy (data not shown). This suggests that a stabilization of beclin-1 protein results in its accumulation early after BNIP3 expression.
FIG 2.
BNIP3-induced ROS drive increased beclin-1 protein levels and suppression of lysosome abundance. (A to C) Representative immunoblot (A) and quantitation of beclin-1 protein (n = 3) (B) and BECN1 transcripts (n = 3 or 4) (C) in NRCMs transduced with BNIP3 or LacZ for the indicated durations. (D and E) Representative flow cytometric tracings (D) and quantitation (E) of ROS (n = 3 or 4) in NRCMs transduced with BNIP3 or LacZ for 12 h. H2O2 (500 mmol/liter; 4 h) was used as the positive control. (F and G) Representative flow cytometric tracings (F) and quantitation (G) of TMRE fluorescence (n = 3) in NRCMs treated as described for panel D. (H and I) Representative immunoblot (H) and quantitation (I) of beclin-1 (n = 3 or 4) in NRCMs transduced with BNIP3 or LacZ plus MnTMPyP (50 μmol/liter; 24 h). (J to L) LAMP1 transcript (n = 6) (J) and protein (representative immunoblot [K] and quantitation [L] [n = 4]) abundances in NRCMs treated as described for panel H. (M and N) Representative flow cytometric tracings (M) and quantitation (N) of LysoTracker fluorescence (n = 3). (O) Cell death in NRCMs treated as described for panel H (n = 7 or 8). All transductions were performed at an MOI of 100/sample. *, P < 0.05 versus control (white bars).
We next examined if ROS mediate the BNIP3-induced increase in beclin-1 abundance observed with reperfusion injury (6). BNIP3 triggered ROS generation early after its expression (at 12 h) (Fig. 2D and E), likely as a result of mitochondrial depolarization (Fig. 2F and G). Scavenging of ROS with MnTMPyP, a cell-permeating superoxide dismutase mimetic, did not affect BNIP3-induced mitochondrial depolarization (Fig. 2F and G) but prevented the increase in beclin-1 abundance (Fig. 2H and I), indicating that BNIP3-induced mitochondrial permeabilization is the cause rather than the consequence of ROS generation, which provokes increased beclin-1 abundance. Treatment with MnTMPyP induced reductions in LAMP1 transcripts (Fig. 2J) and protein levels (Fig. 2K and L), consistent with prior reports indicating that basal ROS levels may drive transcription of lysosomal genes (36). Importantly, treatment with MnTMPyP prevented BNIP3-induced declines in LAMP1 transcripts (Fig. 2J) and protein (Fig. 2K and L) and in lysosomes (Fig. 2M and N) and attenuated BNIP3-induced cardiomyocyte death (Fig. 2O). Taken together, these observations indicate that BNIP3-induced ROS mediate increased beclin-1 abundance and the observed transcriptional suppression of the lysosome machinery.
Partial beclin-1 knockdown transcriptionally stimulates autophagic flux to attenuate BNIP3-induced cardiomyocyte death.
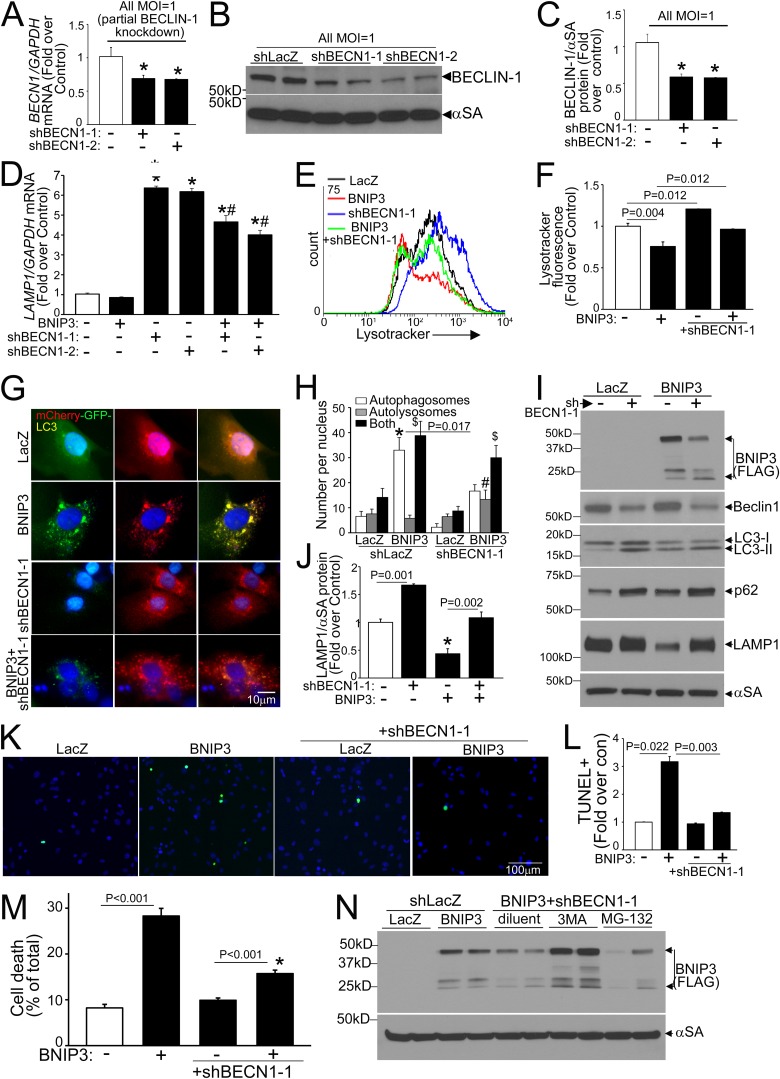
We have observed that experimental modulation of beclin-1 levels transcriptionally affects autophagy-lysosome machinery proteins in a reciprocal fashion (6). To determine if BNIP3-induced upregulation of beclin-1 contributes to the observed decline in LAMP1, we performed a partial knockdown of BECN1 transcripts (with two different shRNA constructs) in BNIP3 (and LacZ)-treated NRCMs. Partial beclin-1 knockdown (reduction in BECN1 transcripts to ∼69% of control level and in beclin-1 protein to ∼45 to 50% of control level) (Fig. 3A to C) stimulated LAMP1 transcription (Fig. 3D) and increased lysosome abundance (Fig. 3E and F) to prevent BNIP3-induced declines in lysosome numbers (Fig. 3E and F). BNIP3 expression resulted in autophagosome accumulation, indicating impaired autophagic flux (15), and partial beclin-1 knockdown increased the relative abundance of autolysosomes and reduced the level of autophagosomes (versus the shLacZ control) in BNIP3-transduced NRCMs (Fig. 3G and H), pointing to enhanced autophagic flux. Partial beclin-1 knockdown also resulted in an increased abundance of autophagy proteins (total LC3 and p62) (Fig. 3I), which was transcriptional as we described earlier (6; data not shown), and in LAMP1 (Fig. 3I and J), paralleling the increased lysosome abundance. Importantly, partial beclin-1 knockdown attenuated the BNIP3-induced decline in LAMP1 protein (Fig. 3I and J), reduced BNIP3-induced TUNEL positivity (Fig. 3K and L), and prevented BNIP3-induced cell death (Fig. 3M), mimicking the observations seen with exogenous expression of TFEB (15). Interestingly, partial beclin-1 knockdown resulted in reduced BNIP3 protein, which was prevented by concomitant inhibition of autophagosome formation with 3MA (Fig. 3N) but not by proteasome inhibition with MG-132, suggesting an enhanced autophagic degradation of BNIP3 together with the mitochondria, whereupon it is localized. Partial beclin-1 knockdown with the second shRNA construct (shBECN1-2) (Fig. 3A to D) recapitulated these findings (data not shown). Taken together, these data indicate that partial beclin-1 knockdown transcriptionally stimulates autophagic flux to restore impaired autophagosome processing with BNIP3 expression.
Fig 3.
Partial beclin-1 knockdown stimulates lysosome biogenesis and induces autophagic flux to attenuate BNIP3-induced cell death. (A) BECN1 transcript levels in NRCMs transduced with two shBECN1 constructs or shLacZ (MOI = 1; 72 h). (B and C) Representative immunoblot (B) and quantitation (C) of beclin-1 protein (n = 4) in NRCMs treated as described for panel A. *, P < 0.05 versus shLacZ. (D) LAMP1 transcript levels in NRCMs treated as described for panel A and cotransduced with BNIP3 or LacZ (MOI = 100; 24 h) (n = 4 to 12). * and #, P < 0.05 versus control (white bar) and the respective shBECN1-treated group, respectively. (E and F) Representative flow cytometric tracings (E) and quantitation (F) of LysoTracker fluorescence in NRCMs transduced with shBECN1-1 or shLacZ and cotransduced with BNIP3 or LacZ as described for panel D (n = 3). (G and H) mCherry-GFP-LC3 localization (magnification, ×630; representative of 3 experiments) (G) and quantitation of autophagosomes, autolysosomes, and both (H) in NRCMs treated as described for panel B (n = 20 to 40 nuclei/group). *, #, and $, P < 0.05 for autophagosomes, autolysosomes, and both, respectively, versus shLacZ-plus-LacZ control. (I and J) Immunoblot depicting autophagy-lysosome proteins (I) and quantitation of LAMP1 (n = 3) (J) in NRCMs treated as described for panel E. *, P < 0.05 versus control (white bar). (K and L) Representative images (magnification, ×200) (K) and quantitation of TUNEL positivity (green in panel K) (n = 4) (L). (M) Cell death in NRCMs treated as described for panel E (n = 20 to 24). *, P < 0.05 versus control (white bar). (N) BNIP3 expression in NRCMs transduced with shBECN1-1 or shLacZ (MOI = 1; 72 h) and cotransduced with BNIP3 or LacZ (MOI = 100; 24 h), with or without 3MA (7 mmol/liter) or MG-132 (10 μmol/liter).
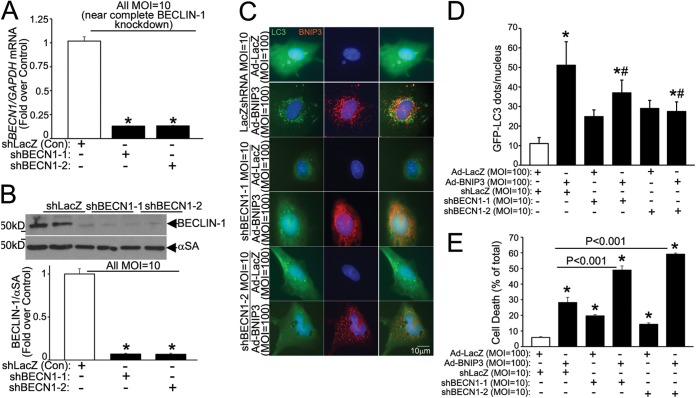
Notably, as we observed previously (6), a more complete knockdown of BECN1 (with 10-fold higher adenoviral shBECN1 transduction, to ∼13% of transcript levels with shLacZ, resulting in a reduction of beclin-1 protein abundance to ∼7% of the control level) (Fig. 4A and B) resulted in inhibition of autophagosome formation (Fig. 4C and D) and increased BNIP3-induced cell death (Fig. 4E), consistent with an obligate role for beclin-1 in initiation of autophagy (26).
FIG 4.
Nearly complete beclin-1 knockdown inhibits autophagy to increase BNIP3-induced cell death. (A) BECN1 transcript levels in NRCMs transduced with shBECN1-1, shBECN1-2, or shLacZ (MOI = 10; 72 h). (B) Representative immunoblot (top) and quantitation (bottom) of beclin-1 protein abundance in NRCMs treated as described for panel A (n = 4). *, P < 0.05 versus shLacZ. (C and D) GFP-tagged LC3 localization (magnification, ×630; representative of 3 experiments) (C) and quantitation of punctate GFP (D) in NRCMs treated as described for panel A and cotransduced with BNIP3 or LacZ (24 h) (n = 15 to 20 cells/group). * and #, P < 0.05 versus control (white bars) and the BNIP3-plus-shLacZ group, respectively. (E) Cell death in NRCMs treated as described for panel C (n = 7 to 15). *, P < 0.05 versus control (white bar).
Partial beclin-1 knockdown activates TFEB to attenuate BNIP3-induced cardiomyocyte death.
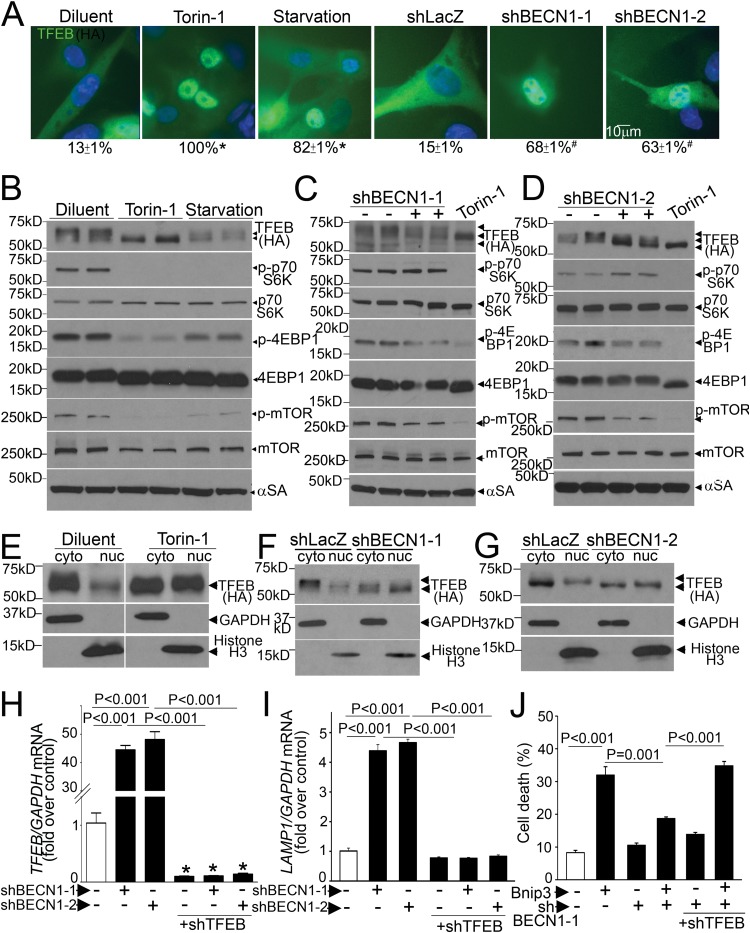
Intriguingly, the effects of partial beclin-1 knockdown (Fig. 3) mimicked our observations with TFEB activation (15). Therefore, we evaluated the effect of partial beclin-1 knockdown on TFEB activation. Recent studies uncovered a tightly regulated mechanism for TFEB activation, whereby TFEB is phosphorylated and sequestered in the cytoplasm, in the unstressed state, and starvation-induced mTOR inactivation provokes dephosphorylation and nuclear translocation of TFEB (21, 22, 24). Given the lack of suitable antibodies to detect endogenous TFEB in rat cells (24), we examined the effect of starvation on subcellular distribution of exogenous TFEB in NRCMs. Exogenous TFEB expressed at low levels localized to the cytoplasm in resting cardiomyocytes and rapidly translocated to the nucleus with starvation and torin-1 treatment (Fig. 5A), via inhibition of mTOR activity (as evidenced by a reduction in Thr-389 phosphorylation of S6 kinase [S6K], Thr-37/46 phosphorylation of 4E-binding protein 1 [4EBP-1], and Ser-2481 autophosphorylation of mTOR) (Fig. 5B to D). Torin-1-induced mTOR inhibition provoked an increase in faster-migrating (i.e., dephosphorylated) forms of TFEB (Fig. 5B) and markedly increased TFEB abundance in the nucleus-enriched fraction in cardiac myocytes (Fig. 5E), as observed in other cell types (21, 22, 24).
FIG 5.
Partial beclin-1 knockdown activates TFEB to attenuate BNIP3-induced cell death. (A) Subcellular distribution of TFEB (magnification, ×630) in NRCMs transduced with HA-TFEB (MOI = 1; 24 h), with or without torin-1 (250 nmol/liter; 1 h), subjected to starvation (4 h), or transduced with shBECN1-1, shBECN1-2, or shLacZ (MOI = 1; 72 h), with quantitation of cells with nuclear TFEB (numbers below the panels). * and #, P < 0.05 versus diluent and shLacZ, respectively. (B to D) Immunoblots depicting TFEB and phosphorylation of S6K, 4EBP-1, and mTOR in NRCMs treated as described for panel A. (E to G) Immunoblots depicting TFEB in NRCMs treated with torin-1, shBECN1-1, and shBECN1-2 as described for panel A, followed by biochemical fractionation into cytoplasmic (GAPDH-expressing) and nucleus-enriched (histone H3-expressing) fractions. White lines separate parts of the same gel. The data for panels A to G are representative of 2 experiments. (H and I) TFEB (H) and LAMP1 (I) transcript levels in NRCMs transduced with shBECN1 constructs (or shLacZ), with or without shTFEB (MOI = 1; 72 h) (n = 4). (J) Cell death in NRCMs transduced with shBECN1-1 (or shLacZ), with or without shTFEB (MOI = 1; 72 h), and cotransduced with BNIP3 or LacZ (MOI = 100; 24 h) (n = 7 or 8). *, P < 0.05 versus control (white bars).
Partial beclin-1 knockdown also resulted in activation of TFEB with increased nuclear localization (Fig. 5A) and in increases in faster-migrating forms (Fig. 5C, D, F, and G) and nuclear TFEB levels compared to those of the control (Fig. 5F and G). To determine the mechanism for TFEB activation, we examined mTOR activity with partial beclin-1 knockdown, which revealed reductions in 4EBP-1 phosphorylation and mTOR autophosphorylation, without a change (or even an increase) in S6K phosphorylation (Fig. 5C and D), suggesting that mTOR inactivation may be partial and/or S6K phosphorylation may be affected simultaneously by mTOR-independent mechanisms (37). Indeed, complete inhibition of mTOR with torin-1 resulted in further TFEB activation in shBECN1-treated cells, as evidenced by the appearance of faster-migrating (dephosphorylated) TFEB bands (Fig. 5C and D). Interestingly, TFEB protein abundance was modestly reduced with partial beclin-1 knockdown and starvation-induced activation (but not with torin-1) (Fig. 5B to G), suggesting an enhanced degradation of activated TFEB, as observed previously (22, 38). Partial beclin-1 knockdown also resulted in a marked increase in endogenous TFEB transcripts (Fig. 5H), consistent with the observation that activated TFEB induces its own transcription (25). Importantly, simultaneous knockdown of endogenous TFEB (Fig. 5H) prevented the transcriptional upregulation of LAMP1 (Fig. 5I) and negated the salutary effects of partial beclin-1 knockdown on BNIP3-induced cardiomyocyte death (Fig. 5J), indicating that the effects of partial beclin-1 knockdown are transduced via activation of endogenous TFEB.
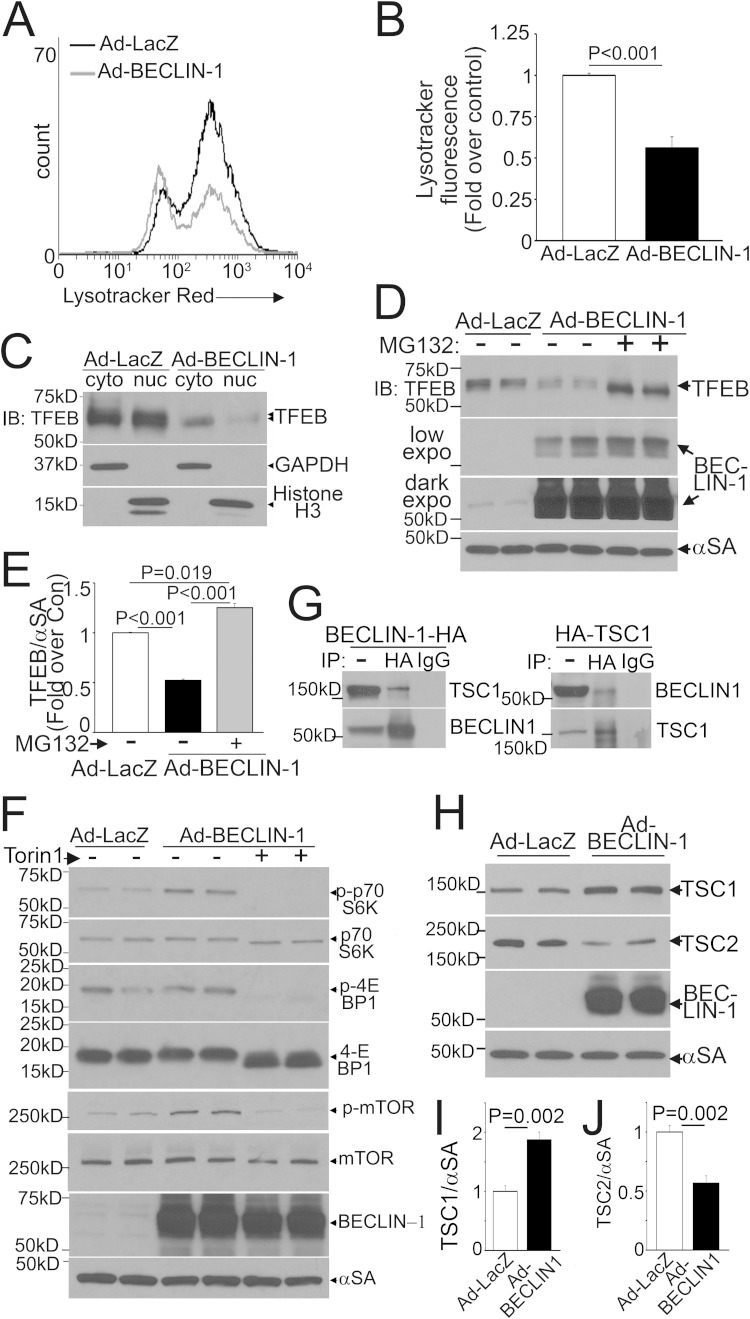
Conversely, consistent with the observation that exogenous beclin-1 is sufficient to suppress transcription of autophagy-lysosome proteins and inhibit autophagic flux (6), exogenous beclin-1 provoked a decline in lysosome abundance (Fig. 6A and B), with a marked reduction in nuclear TFEB (Fig. 6C) as well as in the abundance of total TFEB (Fig. 6D and E), driven by enhanced proteasomal degradation. This was likely the result of the beclin-1-induced increase in mTOR activation (Fig. 6F). beclin-1 interacts with TSC1 (Fig. 6G), as previously described (39), with increased TSC1 and reduced TSC2 abundance (Fig. 6H to J), suggesting a mechanism whereby recruitment of TSC1 away from TSC2 increases its degradation, driving increased mTOR activation via sustained Rheb activity (40, 41). Taken together, these findings indicate that beclin-1 levels reciprocally regulate TFEB activity.
Fig 6.
Exogenous beclin-1 inactivates TFEB. (A and B) Representative flow cytometric tracings (A) and quantitation (B) of LysoTracker fluorescence in NRCMs transduced with beclin-1 or LacZ (MOI = 100; 48 h) (n = 6). (C) Immunoblot (IB) demonstrating subcellular distribution of TFEB in NRCMs transduced with HA-TFEB (MOI = 1), treated as described for panel A, and subjected to subcellular fractionation into cytoplasmic and nuclear fractions. The data are representative of 2 experiments. (D and E) Immunoblot (D) and quantitation (E) of TFEB abundance in NRCMs transduced with HA-TFEB (MOI = 1) and treated as described for panel A, with or without MG-132 (10 μmol/liter; 24 h) (n = 4). (F) Immunoblots for phosphorylation of S6K, 4EBP-1, and mTOR in NRCMs transduced with beclin-1 or LacZ (MOI = 100; 48 h), with or without torin-1 (250 nmol/liter; 1 h). (G) Representative immunoblot (n = 2) depicting coimmunoprecipitation (IP) of endogenous TSC1 (left) and beclin-1 (right) in MEFs expressing beclin-1–HA and HA-TSC1, respectively. (H to J) Immunoblot (H) and quantitation of TSC1 (I) and TSC2 (J) in NRCMs treated as described for panel A (n = 4).
Partial beclin-1 knockdown restores normally polarized mitochondria in BNIP3-expressing cells.
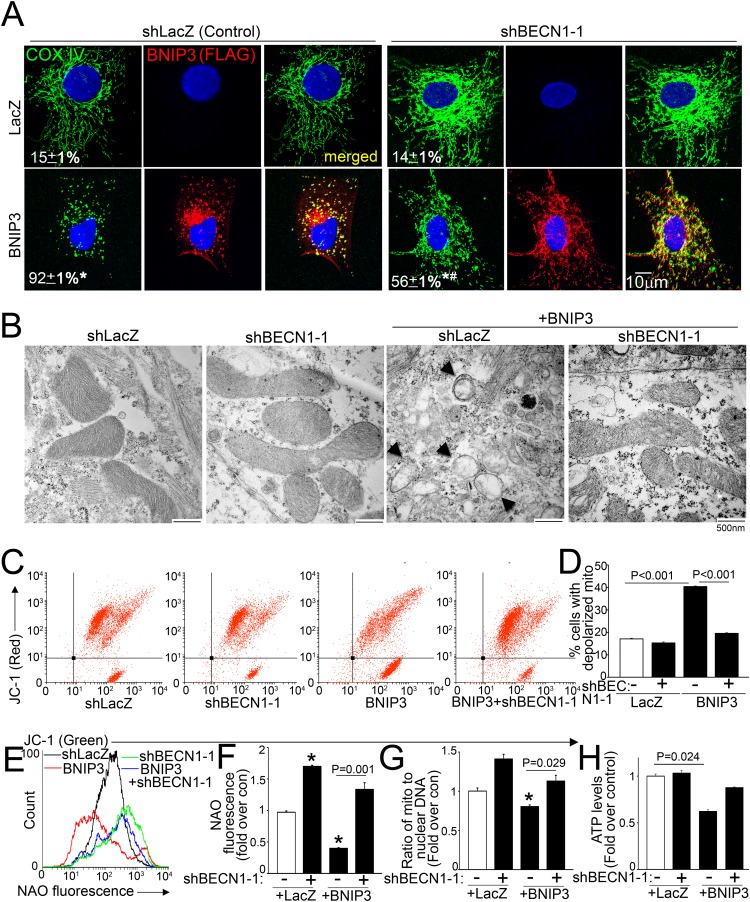
BNIP3 expression resulted in mitochondrial fragmentation, and partial beclin-1 knockdown restored the filamentous appearance of the mitochondrial network in BNIP3-expressing cells (Fig. 7A). Ultrastructural examination of BNIP3-transduced cardiomyocytes revealed widespread mitochondrial swelling and fragmentation and effacement of cristae, with a marked increase in prevalence of autophagic structures, and concomitant partial beclin-1 knockdown restored structurally normal-looking mitochondria in BNIP3-expressing cells (Fig. 7B). Concomitant partial beclin-1 knockdown also significantly reduced the prevalence of BNIP3-depolarized mitochondria (Fig. 7C and D), consistent with their increased autophagic removal, as observed with exogenous expression of TFEB (15).
FIG 7.
Partial beclin-1 knockdown restores normal mitochondria in BNIP3-expressing cells. (A) Confocal images demonstrating COX IV expression (green) in NRCMs transduced with shBECN1-1 or shLacZ (MOI = 1; 72 h) and cotransduced with BNIP3 (red) or LacZ (MOI = 100; 24 h), with the fraction of cells demonstrating fragmented mitochondria indicated. * and #, P < 0.05 versus LacZ and BNIP3, respectively. (B) TEM images of NRCMs treated as described for panel A. Arrows point to BNIP3-damaged mitochondria. The data are representative of 2 experiments. (C and D) Representative flow cytometric tracings demonstrating JC-1 fluorescence (C) and quantitation of cells predominantly expressing JC-1 monomers (lower right quadrants in panel C) (D) for NRCMs treated as described for panel A (n = 4). (E and F) Representative flow cytometric tracings (E) and quantitation (F) of NAO fluorescence in cells treated as described for panel A (n = 4). (G) Ratio of mitochondrial to nuclear DNA (n = 3). (H) Quantitation of ATP levels in cells treated as described for panel A (n = 4). *, P < 0.05 versus control (white bars).
BNIP3 expression resulted in reduced mitochondrial mass, as evidenced by reduced NAO fluorescence (Fig. 7E and F) and a reduced mitochondrial DNA content (Fig. 7G). Interestingly, partial beclin-1 knockdown significantly increased NAO fluorescence (Fig. 7E and F), with a trend toward increased mitochondrial DNA (Fig. 7G), in LacZ-treated controls; restored the mitochondrial mass in BNIP3-expressing cells (Fig. 7E to G); and prevented the decline in cellular ATP content with BNIP3 expression (Fig. 7H). Taken together, these data indicate that partial beclin-1 knockdown restores normal mitochondria in BNIP3-expressing NRCMs.
Partial BECLIN1 knockdown concomitantly stimulates mitochondrial biogenesis via TFEB to rescue BNIP3-induced cell death.
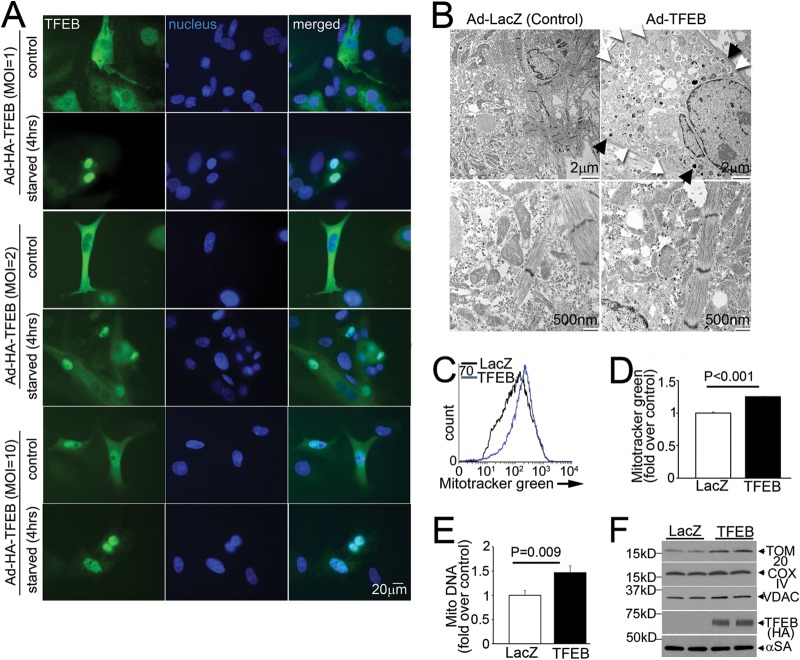
The effects of partial beclin-1 knockdown (Fig. 7A to F) mimicked those of exogenous TFEB in BNIP3-expressing cells (15) and suggested a concomitant induction of mitochondrial biogenesis (Fig. 7E to G), as observed with TFEB activation in noncardiomyocytes (25, 42). Indeed, exogenous TFEB localized to the nuclei of NRCMs at increasing doses irrespective of another stimulus, such as starvation (Fig. 8A), resulting in increased autophagic structures and lysosomes, indicating stimulation of autophagy and lysosome biogenesis (Fig. 8B), and in increased mitochondrial mass (Fig. 8C to F), indicating that TFEB is sufficient to stimulate mitochondrial biogenesis in NRCMs.
FIG 8.
Exogenous TFEB induces mitochondrial biogenesis. (A) Subcellular distribution of TFEB (green; magnification, ×400) in NRCMs transduced with increasing doses of TFEB or LacZ, with or without starvation (4 h). The data are representative of 2 experiments. (B) TEM images of NRCMs transduced with TFEB or LacZ (MOI = 100; 48 h), demonstrating increased abundances of lysosomes (black arrows; top right) and autophagic structures (white arrows; top right) and showing mitochondrial morphology (bottom right). The data are representative of 2 experiments. (C to F) Representative flow cytometric tracings (C) and quantitation (D) of Mitotracker Green, mitochondrial DNA content (E), and abundances of representative mitochondrial proteins (F) in NRCMs treated as described for panel B (n = 3 or 4).
We observed that TFEB regulated the abundance of transcripts for PGC1α (a modulator of mitochondrial biogenesis [1, 43]) in both resting and starved NRCMs (Fig. 9A to C) and that exogenous TFEB activated transcription from a PPARGC1α promoter-luciferase reporter construct (Fig. 9D). We proceeded to individually mutate the three TFEB-binding E-boxes (termed “CLEAR” sites, with only one base pair mismatch at a degenerate location compared with the ideal site annotated for maximal activation [33]) in the human PPARGC1α promoter (Fig. 9D, left panel). Only mutations within the CLEAR sequence located 18 bp upstream from the transcriptional start site completely ablated the responsiveness to TFEB (Fig. 9D, right panel), and we confirmed TFEB binding at this site by use of a ChIP assay (with a primer pair flanking this site) (Fig. 9E). Importantly, the bp −18 mutant construct retained intact activity toward CREB (44) and TORC2 (45), two known inducers of PPARGC1α transcription (Fig. 9F), confirming a specific effect of TFEB on PGC1α transcription via binding to this site.
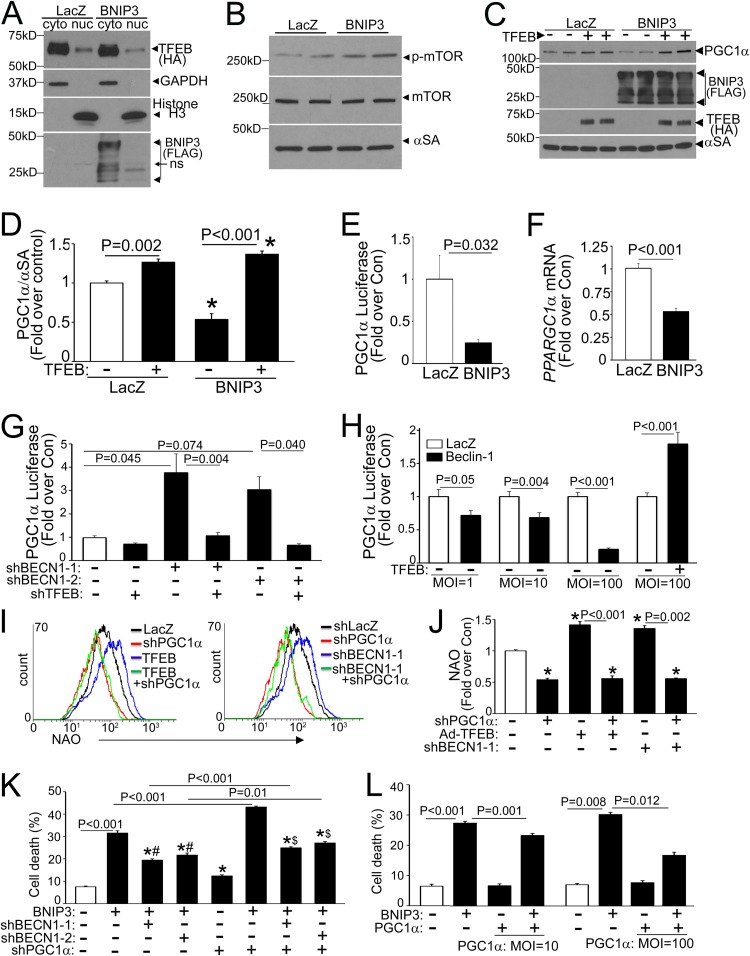
Multiple observations suggested an impairment of TFEB activation in the setting of BNIP3-induced autophagy, namely, reductions in autophagy-lysosome gene and TFEB transcripts (Fig. 1I) and the accompanying impairment of autophagic flux (Fig. 3G and H) and a rescue of BNIP3-induced cell death with exogenous TFEB (15) and with partial beclin-1 knockdown-mediated TFEB activation (Fig. 5). Indeed, we observed a reduction in the nuclear TFEB level in BNIP3-expressing cells (by 33%; P = 0.005; n = 3) (Fig. 10A), accompanied by mTOR activation (fold change in p-mTOR/mTOR abundances, 1.6 ± 0.1 in BNIP3 versus 1.0 ± 0.1 in control; P = 0.005; n = 4), as the possible mechanism (Fig. 10B).
FIG 10.
Inhibition of TFEB-PGC1α axis provokes cell death in BNIP3-expressing NRCMs. (A) Immunoblot depicting TFEB expression in NRCMs transduced with HA-TFEB (MOI = 1; 24 h), with or without BNIP3 or LacZ (MOI = 100; 24 h), followed by biochemical fractionation into cytoplasmic and nuclear fractions. (B) Immunoblot depicting p-mTOR and total mTOR expression in NRCMs transduced with BNIP3 or LacZ (MOI = 100; 24 h). (C and D) Representative immunoblot (C) and quantitation (D) of PGC1α protein in NRCMs transduced with BNIP3 or LacZ, with or without TFEB (each at an MOI of 100; 24 h) (n = 4). (E and F) Promoter-driven luciferase activities (E) and PPARGC1α transcript levels (F) in NRCMs transduced with BNIP3 or LacZ (MOI = 100; 48 h) (n = 6 to 9). (G) Promoter-driven luciferase activities in NRCMs transduced with shBECN1-1 or shBECN1-2, with or without shLacZ or shTFEB (MOI = 1; 72 h) (n = 8 to 16). (H) Promoter-driven luciferase activities in NRCMs transduced with beclin-1–HA or LacZ, with or without TFEB (MOI = 100; 48 h) (n = 8 to 15). (I and J) Representative flow cytometric tracings (I) and quantitation (J) of NAO fluorescence in NRCMs transduced with shPPARGC1α or shLacZ (MOI = 100; 72 h) and cotransduced with TFEB or LacZ (MOI = 100; 48 h) (I, left panel) or with shBECN1-1 (or shLacZ) (MOI = 1; 72 h) (I, right panel) (n = 4). (K) Cell death in NRCMs transduced with shBECN1-1, shBECN1-2, or shLacZ (MOI = 1), with or without shPPARGC1α (MOI = 100; 72 h), and cotransduced with BNIP3 or LacZ (MOI = 100; 24 h) (n = 7 or 8). *, #, and $, P < 0.05 versus LacZ, the respective BNIP3-treated group, and the respective BNIP3-plus-shPPARGC1α-treated group, respectively. (L) Cell death in NRCMs transduced with FLAG-PGC1α or LacZ and BNIP3 or LacZ (MOI = 100), all for 24 h (n = 7 or 8).
We also found a marked reduction of PGC1α protein abundance in BNIP3-expressing NRCMs (Fig. 10C and D), which was driven by reduced PGC1α transcription (Fig. 10E and F) and rescued by concomitant TFEB expression (Fig. 10C and D). To examine if the beclin-1 protein affects mitochondrial biogenesis via the TFEB-PGC1α axis, we evaluated the effect of modulating beclin-1 levels on PGC1α transcription by using loss of function and gain of function of beclin-1. Partial beclin-1 knockdown induced PPARGC1α transcription in a TFEB-dependent manner (Fig. 10G), and conversely, beclin-1 overexpression suppressed PPARGC1α promoter activity, which could be rescued with exogenous TFEB (Fig. 10H). Taken together, these findings suggest that BNIP3-induced beclin-1 upregulation may also impair mitochondrial biogenesis via attenuation of TFEB activity and a decline in PGC1α expression, contributing to reduced mitochondrial mass (Fig. 7E to G).
In further studies, suppression of endogenous PGC1α (by PGC1α knockdown) (Fig. 9G) prevented the increase in mitochondrial mass with partial beclin-1 knockdown (and exogenous TFEB) (Fig. 10I and J), increased cell death in BNIP3-expressing NRCMs (as well as in controls) (Fig. 10K), and resulted in attenuated cytoprotection with partial beclin-1 knockdown in BNIP3-expressing NRCMs (Fig. 10K). Conversely, exogenous PGC1α (Fig. 9H) was sufficient to attenuate BNIP3-induced cell death, in a dose-dependent fashion (Fig. 10L). These data indicate that enhanced mitochondrial biogenesis via the TFEB-PGC1α axis contributes to the cytoprotective effects of partial beclin-1 knockdown in BNIP3-expressing cells.
Partial beclin-1 knockdown restores normally polarized mitochondria and attenuates hypoxia-reoxygenation-induced cell death via TFEB.
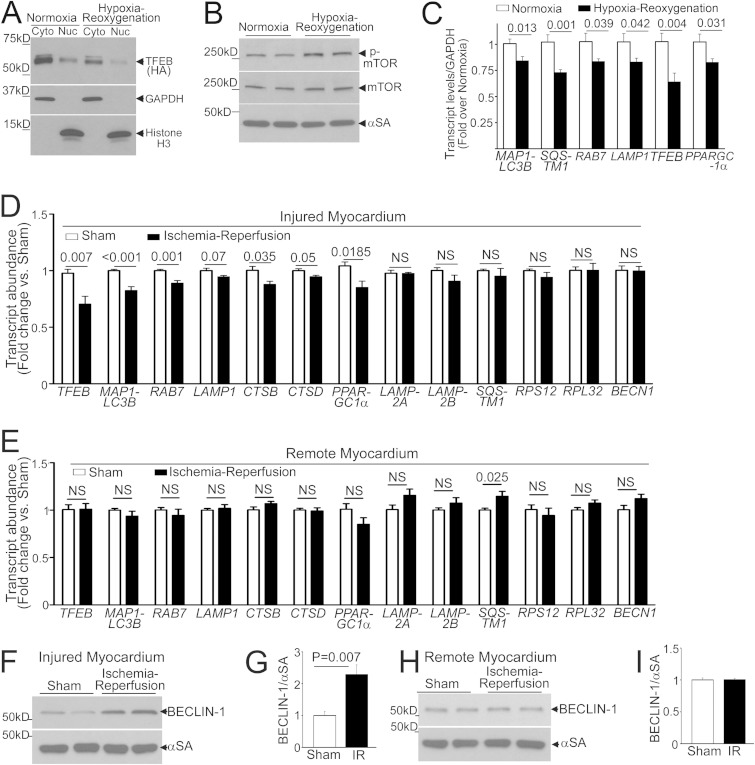
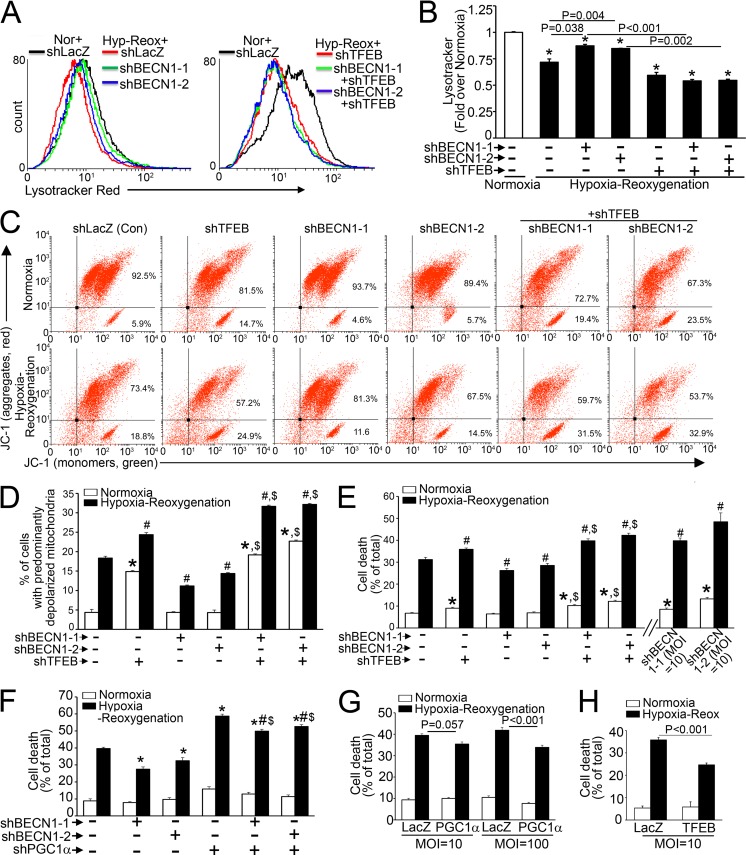
Mitochondrial permeabilization causes cell death with cardiac IR injury (2). Given the observations that BECN1-haploinsufficient mice demonstrate reductions in infarct size with experimental in vivo IR injury (5) and that partial beclin-1 knockdown facilitates autophagosome processing to attenuate cell death with in vitro hypoxia-reoxygenation injury (6), we hypothesized that hypoxia-reoxygenation injury results in inhibition of TFEB activity and that partial beclin-1 knockdown activates TFEB to restore normal mitochondria and prevent hypoxia-reoxygenation-induced cell death. Indeed, hypoxia-reoxygenation injury resulted in reduced nuclear TFEB abundance (by 56%; P = 0.005; n = 3) (Fig. 11A) accompanied by mTOR activation (fold change in p-mTOR/mTOR abundances of 2.1 ± 0.1, versus 1.0 ± 0.1 for normoxia; P < 0.001; n = 4) (Fig. 11B), as previously described to occur rapidly with reperfusion in vivo (46). This was accompanied by significant declines in LC3, p62, RAB7, LAMP1, TFEB, and PGC1α transcript levels (but not in the RPS12 or RPL32 transcript level) (data not shown) with hypoxia-reoxygenation compared to the levels in normoxic controls (Fig. 11C).
FIG 11.
Hypoxia-reoxygenation/IR injury impairs TFEB activation. (A) Immunoblot depicting TFEB in NRCMs transduced with HA-TFEB (MOI = 1; 24 h) and subjected to hypoxia (<1% ambient O2; 6 h) and then reoxygenation (18 h), followed by biochemical fractionation into cytoplasmic and nuclear fractions. (B) Immunoblot depicting p-mTOR and total mTOR expression in NRCMs treated as described for panel A. (C) Transcript levels for representative autophagy-lysosome machinery genes in NRCMs treated as described for panel A (n = 9). (D and E) Transcript levels for autophagy-lysosome genes and unrelated ribosomal genes in hearts subjected to in vivo IR injury (or sham procedure) and analyzed within the injured region (D) or the remote myocardium (E). (F to I) Immunoblots and quantitation of endogenous beclin-1 abundances in hearts treated as described for panels D and E (n = 4 for panels D to G).
To examine if suppression of TFEB activity is also observed with in vivo IR injury, we subjected adult mice to reversible LAD coronary artery ligation and examined autophagy-lysosome transcripts in the injured region and the remote myocardium 4 h after reperfusion. Indeed, we observed transcriptional suppression of TFEB (which suggests suppressed TFEB activation, as it autoregulates its transcription [25]) and various autophagy-lysosome gene transcripts but not others (suggesting that they may be regulated via parallel pathways) only in the injured area (Fig. 11D), not in the remote myocardium (Fig. 11E). Also, as observed previously (5, 6), we confirmed that beclin-1 abundance was increased only in the injured myocardium (Fig. 11F to I), without an increase in its transcript level (Fig. 11D and E), indicating protein stabilization. Importantly, beclin-1 abundance was not increased in the IR-injured beclin-1-haploinsufficient (BECN1+/−) myocardium compared with a sham-treated one (Fig. 12A and B). This was associated with increased nuclear TFEB levels in IR-injured BECN1+/− compared with IR-injured WT myocardium (wherein nuclear TFEB was reduced compared to the level in sham-treated WT myocardium) (Fig. 12C and D), increased lysosomal protein abundance (Fig. 12E to G), and stimulation of autophagic flux in IR-injured BECN1+/− myocardium (Fig. 12H to J), in contrast to impaired autophagic flux in IR-injured WT myocardium, as we observed previously (6). BECN1 haploinsufficiency also prevented the decline in PGC1α abundance with IR injury in WT hearts (Fig. 12K to M).
Consistent with the aforementioned effects on activation of the TFEB-PGC1α axis, we observed that partial beclin-1 knockdown increased lysosome abundance (Fig. 13A and B) and attenuated the increase in depolarized mitochondria (Fig. 13C and D) and cell death (Fig. 13E) in an endogenous TFEB-dependent manner. Notably, the effects of partial beclin-1 knockdown on attenuation of hypoxia-reoxygenation-induced cell death were partially dependent upon endogenous PGC1α signaling (Fig. 13F). While exogenous PGC1α was sufficient to partially attenuate hypoxia-reoxygenation-induced cell death (by 19%) (Fig. 13G), exogenous TFEB conferred a larger reduction (31%) (Fig. 13H), indicating that both mitochondrial autophagy and biogenesis play critical roles in the observed cytoprotection.
FIG 13.
Partial beclin-1 knockdown restores mitochondrial quality in hypoxia-reoxygenation injury via the TFEB-PGC1α axis. (A and B) Representative flow cytometric tracings (A) and quantitation (B) of LysoTracker fluorescence in NRCMs transduced with shBECN1-1, shBECN1-2, or shLacZ (MOI = 1; 48 h) and subjected to hypoxia-reoxygenation (6 h-18 h) or normoxia (24 h) (n = 3). (C and D) Representative flow cytometric tracings of JC-1 fluorescence (C) and quantitation of cells with predominantly depolarized mitochondria (D) in NRCMs transduced with shBECN1 constructs (or shLacZ), with or without shTFEB (or shLacZ) (MOI = 1; 72 h), and subjected to hypoxia (6 h) followed by reoxygenation (18 h) (n = 4). (E) Cell death in NRCMs treated as described for panel C, with additional groups transduced with a higher dose of shBECN1 constructs (MOI = 10) (n = 8 to 16). *, P < 0.01 versus normoxia plus shLacZ (control); #, P < 0.05 versus hypoxia-reoxygenation plus shLacZ; $, P < 0.05 versus respective shBECN1-treated group. (F) Cell death in NRCMs transduced with shBECN1-1 or shBECN1-2 (or shLacZ), with or without shPPARGC1α or shLacZ (MOI = 100; 72 h), and subjected to hypoxia-reoxygenation injury as described for panel A (n = 14 to 16). (G and H) Cell death in NRCMs transduced with PGC1α or TFEB and subjected to hypoxia-reoxygenation injury (n = 8).
Interestingly, as observed in the setting of BNIP3 expression (Fig. 4E), a nearly complete reduction in beclin-1 abundance increased hypoxia-reoxygenation-induced cell death (Fig. 13E), consistent with an obligate role for beclin-1 in autophagosome formation (26).
DISCUSSION
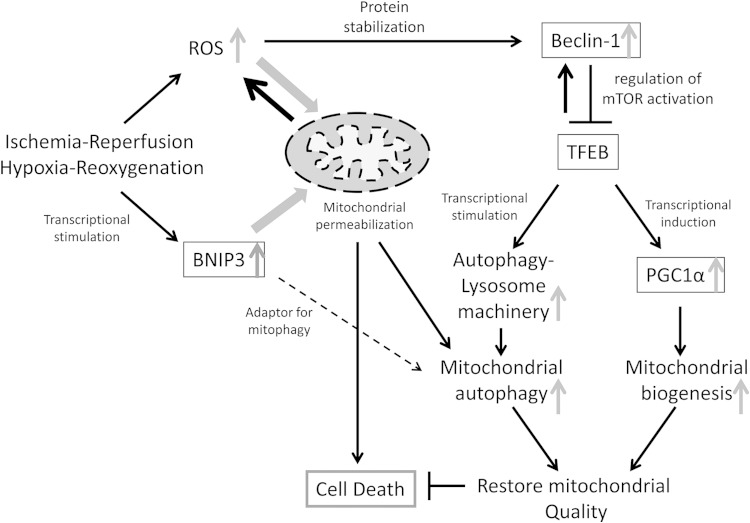
Activation of TFEB is essential for sustaining lysosome function and enhancing cell survival under starvation conditions (25, 47). Our findings indicate that TFEB activation is impaired by an ROS-induced increase in beclin-1 abundance resulting in cardiomyocyte death in IR injury (Fig. 14). The following lines of evidence support this argument. (i) BNIP3, a hypoxia-inducible protein, permeabilizes mitochondria with ROS generation, which provokes increased beclin-1 abundance (Fig. 2) accompanied by a decline in the nuclear TFEB level (Fig. 11) and transcriptional suppression of the autophagy-lysosome machinery (Fig. 1). (ii) Hypoxia-reoxygenation injury, which triggers ROS-induced upregulation of beclin-1 early after reoxygenation (5, 6), also results in inactivation of TFEB, with transcriptional suppression of the autophagy-lysosome machinery, a finding mirrored early after in vivo ischemia-reperfusion insult specifically in the IR-injured segment (Fig. 12 and 13). (iii) Partial beclin-1 knockdown transcriptionally stimulates the autophagy-lysosome machinery via activation of TFEB (Fig. 3 and 5) to facilitate removal of damaged mitochondria and attenuate cardiomyocyte death with BNIP3 expression (Fig. 3) and hypoxia-reoxygenation injury (Fig. 13). (iv) BECN1 haploinsufficiency prevents the decline in nuclear TFEB and impairment in autophagic flux observed with IR injury (Fig. 12). (v) Partial beclin-1 knockdown induces TFEB-mediated upregulation of PGC1α to stimulate mitochondrial biogenesis (Fig. 10), which restores the mass of normally polarized mitochondria under these conditions (Fig. 7 and 13). Interestingly, partial beclin-1 knockdown-mediated cytoprotection with hypoxia-reoxygenation injury (Fig. 13) parallels the reduction in IR-induced cell death in the BECN1-haploinsufficient myocardium in vivo (5) and compares favorably with effects of ROS scavenging in this setting (48).
FIG 14.
Schematic depicting the role of beclin-1 in mitochondrial quality control via the TFEB-PGC1α axis in IR injury. In IR or hypoxia-reoxygenation injury, the reperfusion/reoxygenation-induced burst of ROS generation provokes mitochondrial permeabilization, leading to cell death (2). Transcriptional induction of BNIP3 (>4 h after induction of hypoxia [8]) further upregulates ROS generation from BNIP3-permeabilized mitochondria. While mitochondrion-localized BNIP3 may act as an adaptor to facilitate autophagic removal of damaged mitochondria (13–15), we have found that autophagic flux is impaired, resulting in accumulation of damaged mitochondria (6, 15). ROS provoke increased beclin-1 abundance, resulting in mTOR activation and inhibition of TFEB, a master regulator of autophagy-lysosome machinery biogenesis. Beclin-1 itself is a TFEB target (33), which suggests a counterregulatory loop whereby extant beclin-1 levels are sensed to regulate TFEB activation. Indeed, partial beclin-1 knockdown activates TFEB to stimulate autophagic flux in these settings. TFEB coordinately drives mitochondrial biogenesis together with autophagic removal of damaged mitochondria to restore normal mitochondria and prevent cell death. In IR injury, elevated beclin-1 levels result in suppression of the TFEB-PGC1α axis, which triggers cardiomyocyte death.
Maintenance of mitochondrial quality and mass is essential for cell survival across multiple eukaryotic organisms (49–52), and mitochondrial mass is tightly regulated to ensure efficient energy generation in the mammalian heart (43). In the context of the emerging evidence for a critical role of TFEB and its Candida elegans orthologue hlh-30 in regulating mitochondrial mass under starvation stress (25, 42, 47), our data suggest that suppression of this evolutionarily conserved pathway may impair mitochondrial quality control to limit myocardial salvage despite expedient reperfusion in myocardial infarction. Speculatively, altered regulation of transcriptional repressors of the autophagy-lysosome machinery (47, 53) may also contribute to insufficient TFEB-activated transcription with IR injury and requires further investigation.
Given that beclin-1 itself is a TFEB target (33), our findings suggest that beclin-1 protein levels may be “sensed” via a counterregulatory loop to affect TFEB activity (Fig. 14) as a physiologic mechanism to prime autophagy during starvation and to replenish autophagy-lysosome proteins, including beclin-1, which are consumed with a markedly upregulated autophagic flux. In contrast, during IR injury, ROS-induced upregulation of beclin-1 transcriptionally impairs autophagy by acting as a counterregulatory brake to suppress TFEB activity, which impairs removal of damaged mitochondria (6, 15) and prevents restoration of normal mitochondria via PGC1α (Fig. 14). Unlike the regulation of BECN1 in other cardiac disease states, such as pressure overload (54), the rapid increase in beclin-1 with IR injury (5) and BNIP3 expression is posttranslational (Fig. 2 and 12). Conceivably, ROS generation may oxidatively modify the beclin-1 protein to prevent its degradation. Interestingly, we observed a mobility shift in the beclin-1 protein with BNIP3 expression (as also seen in LacZ-treated cells at the 48-h time point) (Fig. 2A), which may reflect the effects of posttranslational modifications that need to be elucidated in future studies. Prevalent beclin-1 levels affect mTOR activation via its interaction with TSC1 (Fig. 6), and possibly through TBC1D7 (TBC1 domain family member 7) (39), to regulate TFEB activity (24). Alternatively, the beclin-1 protein has a nuclear export signal (NES) motif which is masked in physiologic states but results in its nuclear accumulation with overexpression (55), suggesting a potential for directly modulating transcription. It is also pertinent that constitutive activation of TFEB by chromosomal translocation is implicated in carcinogenesis (56), whereby its counterregulation by beclin-1 may mechanistically drive the observed tumorigenesis with BECN1 haploinsufficiency (26, 57).
In summary, we have uncovered a transcriptional regulatory network that coordinately regulates lysosome biogenesis and mitochondrial quality. Dysregulation of this network may be targeted therapeutically to enhance mitochondrial preservation and cellular preservation in myocardial infarction and ischemia-reperfusion injury in other organ systems.
ACKNOWLEDGMENTS
We thank Junichi Sadoshima, UMDNJ, for providing Ad-shBECN1-1; Brian Finck, Washington University, for expression vectors coding for Renilla luciferase, TORC2, and constitutively active CREB; and Daniel P. Kelly, Sanford-Burnham Medical Research Institute, for the human PPARGC1α promoter-luciferase construct. We also thank Joan Avery and YouJin Lee for technical assistance and Douglas L. Mann, Washington University, for helpful comments and support.
This study was supported by grants from the NIH (HL107594) and the Department of Veterans Affairs (I01BX000448 and 1I01BX001969) to A.D.
X.M., H.L., S.R.F., R.J.G., J.T.M., and H.A. performed studies, analyzed data, and edited the manuscript. P.M.B. and A.D. designed and supervised the work and wrote the manuscript. C.J.W. performed studies and edited the manuscript.
We have no conflicts of interest to report.
REFERENCES
- 1.Leone TC, Kelly DP. 2011. Transcriptional control of cardiac fuel metabolism and mitochondrial function. Cold Spring Harb Symp Quant Biol 76:175–182. doi: 10.1101/sqb.2011.76.011965. [DOI] [PMC free article] [PubMed] [Google Scholar]
- 2.Hausenloy DJ, Duchen MR, Yellon DM. 2003. Inhibiting mitochondrial permeability transition pore opening at reperfusion protects against ischaemia-reperfusion injury. Cardiovasc Res 60:617–625. doi: 10.1016/j.cardiores.2003.09.025. [DOI] [PubMed] [Google Scholar]
- 3.Carreira RS, Lee Y, Ghochani M, Gustafsson AB, Gottlieb RA. 2010. Cyclophilin D is required for mitochondrial removal by autophagy in cardiac cells. Autophagy 6:462–472. doi: 10.4161/auto.6.4.11553. [DOI] [PMC free article] [PubMed] [Google Scholar]
- 4.Kubli DA, Zhang X, Lee Y, Hanna RA, Quinsay MN, Nguyen CK, Jimenez R, Petrosyan S, Murphy AN, Gustafsson AB. 2013. Parkin protein deficiency exacerbates cardiac injury and reduces survival following myocardial infarction. J Biol Chem 288:915–926. doi: 10.1074/jbc.M112.411363. [DOI] [PMC free article] [PubMed] [Google Scholar]
- 5.Matsui Y, Takagi H, Qu X, Abdellatif M, Sakoda H, Asano T, Levine B, Sadoshima J. 2007. Distinct roles of autophagy in the heart during ischemia and reperfusion: roles of AMP-activated protein kinase and Beclin 1 in mediating autophagy. Circ Res 100:914–922. doi: 10.1161/01.RES.0000261924.76669.36. [DOI] [PubMed] [Google Scholar]
- 6.Ma X, Liu H, Foyil SR, Godar RJ, Weinheimer CJ, Hill JA, Diwan A. 2012. Impaired autophagosome clearance contributes to cardiomyocyte death in ischemia/reperfusion injury. Circulation 125:3170–3181. doi: 10.1161/CIRCULATIONAHA.111.041814. [DOI] [PMC free article] [PubMed] [Google Scholar]
- 7.Bruick RK. 2000. Expression of the gene encoding the proapoptotic Nip3 protein is induced by hypoxia. Proc Natl Acad Sci U S A 97:9082–9087. doi: 10.1073/pnas.97.16.9082. [DOI] [PMC free article] [PubMed] [Google Scholar]
- 8.Kubasiak LA, Hernandez OM, Bishopric NH, Webster KA. 2002. Hypoxia and acidosis activate cardiac myocyte death through the Bcl-2 family protein BNIP3. Proc Natl Acad Sci U S A 99:12825–12830. doi: 10.1073/pnas.202474099. [DOI] [PMC free article] [PubMed] [Google Scholar]
- 9.Chen G, Ray R, Dubik D, Shi L, Cizeau J, Bleackley RC, Saxena S, Gietz RD, Greenberg AH. 1997. The E1B 19K/Bcl-2-binding protein Nip3 is a dimeric mitochondrial protein that activates apoptosis. J Exp Med 186:1975–1983. doi: 10.1084/jem.186.12.1975. [DOI] [PMC free article] [PubMed] [Google Scholar]
- 10.Kubli DA, Ycaza JE, Gustafsson AB. 2007. Bnip3 mediates mitochondrial dysfunction and cell death through Bax and Bak. Biochem J 405:407–415. doi: 10.1042/BJ20070319. [DOI] [PMC free article] [PubMed] [Google Scholar]
- 11.Regula KM, Ens K, Kirshenbaum LA. 2002. Inducible expression of BNIP3 provokes mitochondrial defects and hypoxia-mediated cell death of ventricular myocytes. Circ Res 91:226–231. doi: 10.1161/01.RES.0000029232.42227.16. [DOI] [PubMed] [Google Scholar]
- 12.Hamacher-Brady A, Brady NR, Logue SE, Sayen MR, Jinno M, Kirshenbaum LA, Gottlieb RA, Gustafsson AB. 2007. Response to myocardial ischemia/reperfusion injury involves Bnip3 and autophagy. Cell Death Differ 14:146–157. doi: 10.1038/sj.cdd.4401936. [DOI] [PubMed] [Google Scholar]
- 13.Hamacher-Brady A, Brady NR, Gottlieb RA, Gustafsson AB. 2006. Autophagy as a protective response to Bnip3-mediated apoptotic signaling in the heart. Autophagy 2:307–309. doi: 10.4161/auto.2947. [DOI] [PubMed] [Google Scholar]
- 14.Zhang H, Bosch-Marce M, Shimoda LA, Tan YS, Baek JH, Wesley JB, Gonzalez FJ, Semenza GL. 2008. Mitochondrial autophagy is an HIF-1-dependent adaptive metabolic response to hypoxia. J Biol Chem 283:10892–10903. doi: 10.1074/jbc.M800102200. [DOI] [PMC free article] [PubMed] [Google Scholar] [Retracted]
- 15.Ma X, Godar RJ, Liu H, Diwan A. 2012. Enhancing lysosome biogenesis attenuates BNIP3-induced cardiomyocyte death. Autophagy 8:297–309. doi: 10.4161/auto.18658. [DOI] [PMC free article] [PubMed] [Google Scholar]
- 16.Egan DF, Shackelford DB, Mihaylova MM, Gelino S, Kohnz RA, Mair W, Vasquez DS, Joshi A, Gwinn DM, Taylor R, Asara JM, Fitzpatrick J, Dillin A, Viollet B, Kundu M, Hansen M, Shaw RJ. 2011. Phosphorylation of ULK1 (hATG1) by AMP-activated protein kinase connects energy sensing to mitophagy. Science 331:456–461. doi: 10.1126/science.1196371. [DOI] [PMC free article] [PubMed] [Google Scholar]
- 17.Nakai A, Yamaguchi O, Takeda T, Higuchi Y, Hikoso S, Taniike M, Omiya S, Mizote I, Matsumura Y, Asahi M, Nishida K, Hori M, Mizushima N, Otsu K. 2007. The role of autophagy in cardiomyocytes in the basal state and in response to hemodynamic stress. Nat Med 13:619–624. doi: 10.1038/nm1574. [DOI] [PubMed] [Google Scholar]
- 18.Yu L, McPhee CK, Zheng L, Mardones GA, Rong Y, Peng J, Mi N, Zhao Y, Liu Z, Wan F, Hailey DW, Oorschot V, Klumperman J, Baehrecke EH, Lenardo MJ. 2010. Termination of autophagy and reformation of lysosomes regulated by mTOR. Nature 465:942–946. doi: 10.1038/nature09076. [DOI] [PMC free article] [PubMed] [Google Scholar]
- 19.Rong Y, McPhee CK, Deng S, Huang L, Chen L, Liu M, Tracy K, Baehrecke EH, Yu L, Lenardo MJ. 2011. Spinster is required for autophagic lysosome reformation and mTOR reactivation following starvation. Proc Natl Acad Sci U S A 108:7826–7831. doi: 10.1073/pnas.1013800108. [DOI] [PMC free article] [PubMed] [Google Scholar]
- 20.Sridhar S, Patel B, Aphkhazava D, Macian F, Santambrogio L, Shields D, Cuervo AM. 2013. The lipid kinase PI4KIIIbeta preserves lysosomal identity. EMBO J 32:324–339. doi: 10.1038/emboj.2012.341. [DOI] [PMC free article] [PubMed] [Google Scholar]
- 21.Martina JA, Chen Y, Gucek M, Puertollano R. 2012. MTORC1 functions as a transcriptional regulator of autophagy by preventing nuclear transport of TFEB. Autophagy 8:903–914. doi: 10.4161/auto.19653. [DOI] [PMC free article] [PubMed] [Google Scholar]
- 22.Roczniak-Ferguson A, Petit CS, Froehlich F, Qian S, Ky J, Angarola B, Walther TC, Ferguson SM. 2012. The transcription factor TFEB links mTORC1 signaling to transcriptional control of lysosome homeostasis. Sci Signal 5:ra42. doi: 10.1126/scisignal.2002790. [DOI] [PMC free article] [PubMed] [Google Scholar]
- 23.Settembre C, Di Malta C, Polito VA, Garcia Arencibia M, Vetrini F, Erdin S, Erdin SU, Huynh T, Medina D, Colella P, Sardiello M, Rubinsztein DC, Ballabio A. 2011. TFEB links autophagy to lysosomal biogenesis. Science 332:1429–1433. doi: 10.1126/science.1204592. [DOI] [PMC free article] [PubMed] [Google Scholar]
- 24.Settembre C, Zoncu R, Medina DL, Vetrini F, Erdin S, Erdin S, Huynh T, Ferron M, Karsenty G, Vellard MC, Facchinetti V, Sabatini D, Ballabio A. 2012. A lysosome-to-nucleus signalling mechanism senses and regulates the lysosome via mTOR and TFEB. EMBO J 31:1095–1108. doi: 10.1038/emboj.2012.32. [DOI] [PMC free article] [PubMed] [Google Scholar]
- 25.Settembre C, De Cegli R, Mansueto G, Saha PK, Vetrini F, Visvikis O, Huynh T, Carissimo A, Palmer D, Klisch TJ, Wollenberg AC, Di Bernardo D, Chan L, Irazoqui JE, Ballabio A. 2013. TFEB controls cellular lipid metabolism through a starvation-induced autoregulatory loop. Nat Cell Biol 15:647–658. doi: 10.1038/ncb2718. [DOI] [PMC free article] [PubMed] [Google Scholar]
- 26.Qu X, Yu J, Bhagat G, Furuya N, Hibshoosh H, Troxel A, Rosen J, Eskelinen EL, Mizushima N, Ohsumi Y, Cattoretti G, Levine B. 2003. Promotion of tumorigenesis by heterozygous disruption of the beclin 1 autophagy gene. J Clin Invest 112:1809–1820. doi: 10.1172/JCI20039. [DOI] [PMC free article] [PubMed] [Google Scholar]
- 27.Iwai-Kanai E, Yuan H, Huang C, Sayen MR, Perry-Garza CN, Kim L, Gottlieb RA. 2008. A method to measure cardiac autophagic flux in vivo. Autophagy 4:322–329. doi: 10.4161/auto.5603. [DOI] [PMC free article] [PubMed] [Google Scholar]
- 28.Rikka S, Quinsay MN, Thomas RL, Kubli DA, Zhang X, Murphy AN, Gustafsson AB. 2011. Bnip3 impairs mitochondrial bioenergetics and stimulates mitochondrial turnover. Cell Death Differ 18:721–731. doi: 10.1038/cdd.2010.146. [DOI] [PMC free article] [PubMed] [Google Scholar]
- 29.Pagel-Langenickel I, Bao J, Joseph JJ, Schwartz DR, Mantell BS, Xu X, Raghavachari N, Sack MN. 2008. PGC-1alpha integrates insulin signaling, mitochondrial regulation, and bioenergetic function in skeletal muscle. J Biol Chem 283:22464–22472. doi: 10.1074/jbc.M800842200. [DOI] [PMC free article] [PubMed] [Google Scholar]
- 30.Twig G, Elorza A, Molina AJ, Mohamed H, Wikstrom JD, Walzer G, Stiles L, Haigh SE, Katz S, Las G, Alroy J, Wu M, Py BF, Yuan J, Deeney JT, Corkey BE, Shirihai OS. 2008. Fission and selective fusion govern mitochondrial segregation and elimination by autophagy. EMBO J 27:433–446. doi: 10.1038/sj.emboj.7601963. [DOI] [PMC free article] [PubMed] [Google Scholar]
- 31.Chambers KT, Leone TC, Sambandam N, Kovacs A, Wagg CS, Lopaschuk GD, Finck BN, Kelly DP. 2011. Chronic inhibition of pyruvate dehydrogenase in heart triggers an adaptive metabolic response. J Biol Chem 286:11155–11162. doi: 10.1074/jbc.M110.217349. [DOI] [PMC free article] [PubMed] [Google Scholar]
- 32.Hu J, Zacharek S, He YJ, Lee H, Shumway S, Duronio RJ, Xiong Y. 2008. WD40 protein FBW5 promotes ubiquitination of tumor suppressor TSC2 by DDB1-CUL4-ROC1 ligase. Genes Dev 22:866–871. doi: 10.1101/gad.1624008. [DOI] [PMC free article] [PubMed] [Google Scholar]
- 33.Palmieri M, Impey S, Kang H, di Ronza A, Pelz C, Sardiello M, Ballabio A. 2011. Characterization of the CLEAR network reveals an integrated control of cellular clearance pathways. Hum Mol Genet 20:3852–3866. doi: 10.1093/hmg/ddr306. [DOI] [PubMed] [Google Scholar]
- 34.Xiao Q, Yan P, Ma X, Liu H, Perez R, Zhu A, Gonzales E, Burchett JM, Schuler DR, Cirrito JR, Diwan A, Lee JM. 2014. Enhancing astrocytic lysosome biogenesis facilitates Aβ clearance and attenuates amyloid plaque pathogenesis. J Neurosci 34:9607–9620. doi: 10.1523/JNEUROSCI.3788-13.2014. [DOI] [PMC free article] [PubMed] [Google Scholar]
- 35.Sardiello M, Palmieri M, di Ronza A, Medina DL, Valenza M, Gennarino VA, Di Malta C, Donaudy F, Embrione V, Polishchuk RS, Banfi S, Parenti G, Cattaneo E, Ballabio A. 2009. A gene network regulating lysosomal biogenesis and function. Science 325:473–477. doi: 10.1126/science.1174447. [DOI] [PubMed] [Google Scholar]
- 36.Kiffin R, Christian C, Knecht E, Cuervo AM. 2004. Activation of chaperone-mediated autophagy during oxidative stress. Mol Biol Cell 15:4829–4840. doi: 10.1091/mbc.E04-06-0477. [DOI] [PMC free article] [PubMed] [Google Scholar]
- 37.Wang L, Gout I, Proud CG. 2001. Cross-talk between the ERK and p70 S6 kinase (S6K) signaling pathways. MEK-dependent activation of S6K2 in cardiomyocytes. J Biol Chem 276:32670–32677. doi: 10.1074/jbc.M102776200. [DOI] [PubMed] [Google Scholar]
- 38.Martina JA, Puertollano R. 2013. Rag GTPases mediate amino acid-dependent recruitment of TFEB and MITF to lysosomes. J Cell Biol 200:475–491. doi: 10.1083/jcb.201209135. [DOI] [PMC free article] [PubMed] [Google Scholar]
- 39.Behrends C, Sowa ME, Gygi SP, Harper JW. 2010. Network organization of the human autophagy system. Nature 466:68–76. doi: 10.1038/nature09204. [DOI] [PMC free article] [PubMed] [Google Scholar]
- 40.Menon S, Dibble CC, Talbott G, Hoxhaj G, Valvezan AJ, Takahashi H, Cantley LC, Manning BD. 2014. Spatial control of the TSC complex integrates insulin and nutrient regulation of mTORC1 at the lysosome. Cell 156:771–785. doi: 10.1016/j.cell.2013.11.049. [DOI] [PMC free article] [PubMed] [Google Scholar]
- 41.Dibble CC, Elis W, Menon S, Qin W, Klekota J, Asara JM, Finan PM, Kwiatkowski DJ, Murphy LO, Manning BD. 2012. TBC1D7 is a third subunit of the TSC1-TSC2 complex upstream of mTORC1. Mol Cell 47:535–546. doi: 10.1016/j.molcel.2012.06.009. [DOI] [PMC free article] [PubMed] [Google Scholar]
- 42.Scott I, Webster BR, Chan CK, Okonkwo JU, Han K, Sack MN. 2014. GCN5-like protein 1 (GCN5L1) controls mitochondrial content through coordinated regulation of mitochondrial biogenesis and mitophagy. J Biol Chem 289:2864–2872. doi: 10.1074/jbc.M113.521641. [DOI] [PMC free article] [PubMed] [Google Scholar]
- 43.Lai L, Leone TC, Zechner C, Schaeffer PJ, Kelly SM, Flanagan DP, Medeiros DM, Kovacs A, Kelly DP. 2008. Transcriptional coactivators PGC-1alpha and PGC-lbeta control overlapping programs required for perinatal maturation of the heart. Genes Dev 22:1948–1961. doi: 10.1101/gad.1661708. [DOI] [PMC free article] [PubMed] [Google Scholar]
- 44.Herzig S, Long F, Jhala US, Hedrick S, Quinn R, Bauer A, Rudolph D, Schutz G, Yoon C, Puigserver P, Spiegelman B, Montminy M. 2001. CREB regulates hepatic gluconeogenesis through the coactivator PGC-1. Nature 413:179–183. doi: 10.1038/35093131. [DOI] [PubMed] [Google Scholar]
- 45.Wu Z, Huang X, Feng Y, Handschin C, Feng Y, Gullicksen PS, Bare O, Labow M, Spiegelman B, Stevenson SC. 2006. Transducer of regulated CREB-binding proteins (TORCs) induce PGC-1alpha transcription and mitochondrial biogenesis in muscle cells. Proc Natl Acad Sci U S A 103:14379–14384. doi: 10.1073/pnas.0606714103. [DOI] [PMC free article] [PubMed] [Google Scholar]
- 46.Tan CY, Hagen T. 2013. Post-translational regulation of mTOR complex 1 in hypoxia and reoxygenation. Cell Signal 25:1235–1244. doi: 10.1016/j.cellsig.2013.02.012. [DOI] [PubMed] [Google Scholar]
- 47.O'Rourke EJ, Ruvkun G. 2013. MXL-3 and HLH-30 transcriptionally link lipolysis and autophagy to nutrient availability. Nat Cell Biol 15:668–676. doi: 10.1038/ncb2741. [DOI] [PMC free article] [PubMed] [Google Scholar]
- 48.Kloner RA, Hale SL, Dai W, Gorman RC, Shuto T, Koomalsingh KJ, Gorman JH III, Sloan RC, Frasier CR, Watson CA, Bostian PA, Kypson AP, Brown DA. 2012. Reduction of ischemia/reperfusion injury with bendavia, a mitochondria-targeting cytoprotective peptide. J Am Heart Assoc 1:e001644. doi: 10.1161/JAHA.112.001644. [DOI] [PMC free article] [PubMed] [Google Scholar]
- 49.Hughes AL, Gottschling DE. 2012. An early age increase in vacuolar pH limits mitochondrial function and lifespan in yeast. Nature 492:261–265. doi: 10.1038/nature11654. [DOI] [PMC free article] [PubMed] [Google Scholar]
- 50.Kurihara Y, Kanki T, Aoki Y, Hirota Y, Saigusa T, Uchiumi T, Kang D. 2012. Mitophagy plays an essential role in reducing mitochondrial production of reactive oxygen species and mutation of mitochondrial DNA by maintaining mitochondrial quantity and quality in yeast. J Biol Chem 287:3265–3272. doi: 10.1074/jbc.M111.280156. [DOI] [PMC free article] [PubMed] [Google Scholar]
- 51.Rafelski SM, Viana MP, Zhang Y, Chan YH, Thorn KS, Yam P, Fung JC, Li H, Costa LF, Marshall WF. 2012. Mitochondrial network size scaling in budding yeast. Science 338:822–824. doi: 10.1126/science.1225720. [DOI] [PMC free article] [PubMed] [Google Scholar]
- 52.Wu JJ, Quijano C, Chen E, Liu H, Cao L, Fergusson MM, Rovira II, Gutkind S, Daniels MP, Komatsu M, Finkel T. 2009. Mitochondrial dysfunction and oxidative stress mediate the physiological impairment induced by the disruption of autophagy. Aging (Albany, NY) 1:425–437. [DOI] [PMC free article] [PubMed] [Google Scholar]
- 53.Chauhan S, Goodwin JG, Chauhan S, Manyam G, Wang J, Kamat AM, Boyd DD. 2013. ZKSCAN3 is a master transcriptional repressor of autophagy. Mol Cell 50:16–28. doi: 10.1016/j.molcel.2013.01.024. [DOI] [PMC free article] [PubMed] [Google Scholar]
- 54.Pan W, Zhong Y, Cheng C, Liu B, Wang L, Li A, Xiong L, Liu S. 2013. MiR-30-regulated autophagy mediates angiotensin II-induced myocardial hypertrophy. PLoS One 8:e53950. doi: 10.1371/journal.pone.0053950. [DOI] [PMC free article] [PubMed] [Google Scholar]
- 55.Liang XH, Yu J, Brown K, Levine B. 2001. Beclin 1 contains a leucine-rich nuclear export signal that is required for its autophagy and tumor suppressor function. Cancer Res 61:3443–3449. [PubMed] [Google Scholar]
- 56.Kuiper RP, Schepens M, Thijssen J, van Asseldonk M, van den Berg E, Bridge J, Schuuring E, Schoenmakers EF, van Kessel AG. 2003. Upregulation of the transcription factor TFEB in t(6;11)(p21;q13)-positive renal cell carcinomas due to promoter substitution. Hum Mol Genet 12:1661–1669. doi: 10.1093/hmg/ddg178. [DOI] [PubMed] [Google Scholar]
- 57.Yue Z, Jin S, Yang C, Levine AJ, Heintz N. 2003. Beclin 1, an autophagy gene essential for early embryonic development, is a haploinsufficient tumor suppressor. Proc Natl Acad Sci U S A 100:15077–15082. doi: 10.1073/pnas.2436255100. [DOI] [PMC free article] [PubMed] [Google Scholar]


