

Abstract
Clostridium difficile infection (CDI) following antibiotic therapy is a major public health threat. While antibiotic disruption of the indigenous microbiota underlies the majority of cases of CDI, the early dynamics of infection in the disturbed intestinal ecosystem are poorly characterized. This study defines the dynamics of infection with C. difficile strain VPI 10463 throughout the gastrointestinal (GI) tract using a murine model of infection. After inducing susceptibility to C. difficile colonization via antibiotic administration, we followed the dynamics of spore germination, colonization, sporulation, toxin activity, and disease progression throughout the GI tract. C. difficile spores were able to germinate within 6 h postchallenge, resulting in the establishment of vegetative bacteria in the distal GI tract. Spores and cytotoxin activity were detected by 24 h postchallenge, and histopathologic colitis developed by 30 h. Within 36 h, all infected mice succumbed to infection. We correlated the establishment of infection with changes in the microbiota and bile acid profile of the small and large intestines. Antibiotic administration resulted in significant changes to the microbiota in the small and large intestines, as well as a significant shift in the abundance of primary and secondary bile acids. Ex vivo analysis suggested the small intestine as the site of spore germination. This study provides an integrated understanding of the timing and location of the events surrounding C. difficile colonization and identifies potential targets for the development of new therapeutic strategies.
INTRODUCTION
Clostridium difficile infection (CDI) is the most common cause of health care-associated infectious diarrhea and colitis. CDI results in upwards of 14,000 deaths annually and $4.8 billion in excess health care costs in the United States (1). C. difficile is a Gram-positive, anaerobic, spore-forming bacterium that produces toxins that inactivate Rho family GTPases, resulting in a loss of epithelial barrier function, mucosal inflammation, and intestinal damage (2). Individuals infected with C. difficile exhibit clinical manifestations that can range from mild diarrhea to toxic megacolon and death (2).
CDI is initiated by transmission of the environmentally stable spore form of the pathogen. To establish infection, the spore must germinate following interactions with small molecule germinants, which are primarily bile acids (3). After germination, a productive infection will result in vegetative growth of the pathogen, which then produces toxin, resulting in colitis. Thus, CDI results when C. difficile spores encounter an intestinal environment that supports all of the aspects of C. difficile physiology. The use of antibiotics is a primary risk factor for developing CDI due to loss of the protective effects of the gut microbiota, deemed colonization resistance (4–6).
The loss of colonization resistance against CDI results in an environment that allows for C. difficile germination and growth. How the gut microbiota mediates colonization resistance against C. difficile is still unclear; however, previous work has shown multiple mechanisms contribute to colonization resistance (4). Previous studies have shown that cefoperazone treatment alters the microbiome and metabolome to an environment that favors C. difficile growth (7). The microbiota is involved in bile acid regulation in the host and is essential for the biotransformation of primary bile acids into secondary bile acids, which can be highly toxic to C. difficile vegetative cells (8–10). Additionally, members of the microbiota can directly decrease C. difficile load in a mouse model of CDI (11). Although an altered microbiota underlies most cases of CDI, the dynamics by which infection is established in a susceptible host is not well defined.
Animal models have been critical for defining the pathogenic processes underlying CDI (12). Murine models of CDI have been developed where antibiotic administration renders animals susceptible to C. difficile colonization and results in the development of colitis (13). In the present study, we use a murine model of CDI to describe the early dynamics of experimental CDI following the germination and vegetative outgrowth of spores and the development of colitis. We correlated these infection dynamics with the changes in the intestinal environment brought about by antibiotic administration in order to understand the establishment of CDI.
MATERIALS AND METHODS
Ethics statement.
The University Committee on the Care and Use of Animals at the University of Michigan approved this study. The University of Michigan laboratory animal care policies follow the Public Health Service policy on Humane Care and Use of Laboratory Animals. Animals were assessed twice daily for physical condition and behavior, and those assessed as moribund were humanely euthanized by CO2 asphyxiation. Trained animal technicians performed animal husbandry in an AAALAC-accredited facility.
Animal housing and antibiotic administration.
Five- to 9-week-old C57BL/6 wild-type mice (male and female) were used from a breeding colony that was originally established using animals purchased from Jackson Laboratories for the experimental infections. Mice were housed with autoclaved food, bedding, and water with a light cycle of 12 h of light and 12 h of darkness. All cage changes were performed in a laminar flow hood. Mice were given cefoperazone (0.5 mg/ml) in sterile distilled water for 5 days ad libitum (made fresh and changed every 2 days). Mice were then given sterile distilled water for 2 days prior to C. difficile challenge.
C. difficile spore preparation and challenge.
C. difficile VPI 10463 (ATCC 43255) was grown overnight in a 5-ml culture of Columbia broth at 37°C anaerobically. The next day, the inoculum was added to a 50-ml culture of Clospore medium and incubated at 37°C for 5 days anaerobically (14). Spores were harvested by centrifugation at 1,500 × g for 20 min at 4°C. Spores were washed with cold sterile distilled water five times, resuspended in 1 ml of sterile distilled water, and stored at 4°C in sterile distilled water. C. difficile spores were heat treated for 20 min at 65°C prior to gavaging animals. A total of 100 spores were introduced by oral gavage to each animal in the study (with the exception of the mice at t = 0). Viable spores were enumerated by plating for CFU/g of luminal content on TCCFA (taurocholate, cefoxitin, cycloserine, fructose agar) after gavaging animals.
Necropsy and sample collection.
Mice (n = 5 per group) were euthanized and necropsied every 6 h throughout infection for 36 h. Mice were selected at random from multiple cages to control for any potential cage effects and sex/age differences. Additionally, every time point had both male and female mice represented. Mice were euthanized by CO2 asphyxiation, and all samples were collected within 10 min of necropsy. The small intestine was divided into sections containing proximal, mid, and distal sections as shown in the brackets (Fig. 1B). The distal small intestine and the proximal colon were cut at the base of the cecum. Luminal contents were removed for each organ and either flash frozen in liquid nitrogen or passed into an anaerobic chamber for C. difficile quantification. Tissue was placed into histology cassettes and stored in 10% buffered formalin. After 24 h, the cassettes were transferred to 70% ethanol until paraffin embedded and sectioned. Hematoxylin and eosin-stained slides were prepared for histopathological examination by the McClinchey Histology Lab, Inc. (Stockbridge, MI).
FIG 1.
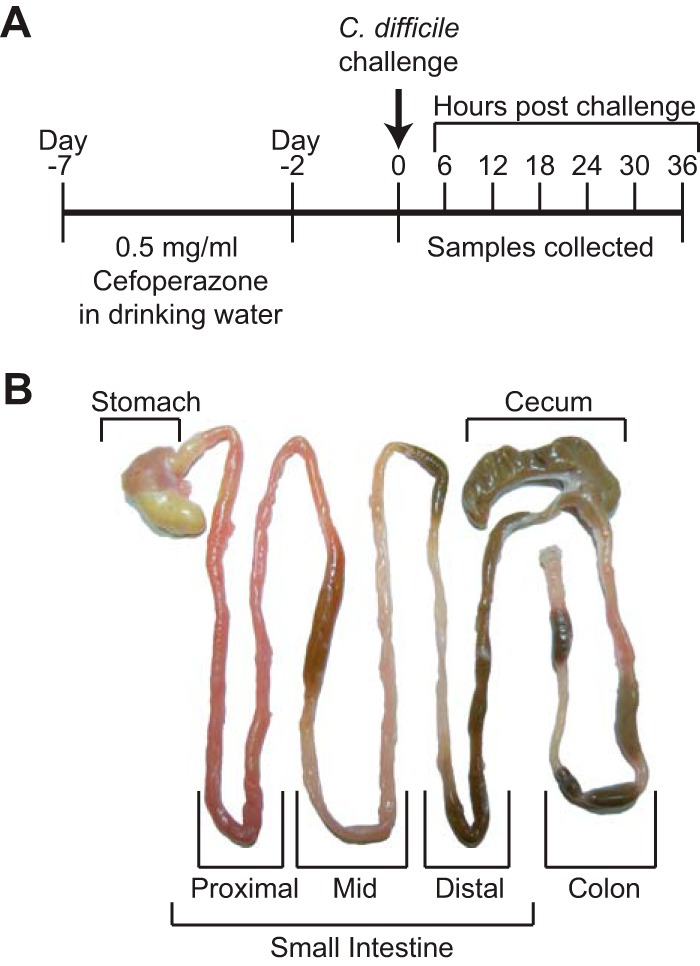
Experimental design for the present study. (A) Timeline of the course of antibiotic treatment and infection. (B) Representative gastrointestinal tract defining which samples were collected and used for study. The small intestine was divided into sections containing proximal, middle, and distal sections as indicated by brackets.
C. difficile quantification.
Luminal contents were diluted into anaerobic phosphate-buffered saline (PBS) and plated anaerobically on selective medium (TCCFA plates) in order to determine the total amount of vegetative cells and spores. The plates were incubated anaerobically at 37°C for 24 h. The percentage of spores was determined by heat treating the diluted luminal contents at 65°C to kill vegetative C. difficile and plating onto TCCFA. The plates were incubated anaerobically at 37°C for 24 h. The percentages of spores were calculated by taking the C. difficile CFU after heat treatment and dividing by the total C. difficile CFU before heat treatment and multiplying that value by 100.
Toxin assays.
Vero cell cytotoxicity assays were performed as described previously (15). Briefly, Vero cells were seeded in a 96-well flat-bottom microtiter plate at a density of 105 cells/well. Luminal contents from mice were filter sterilized using a 0.22-μm-pore-size filter and serially diluted into sterile PBS. Then, 10 μl of each of these final dilutions was added to the Vero cells no earlier than 4 h after seeding. Each well had a corresponding control, and both antitoxin and control wells were treated with purified C. difficile toxin and antitoxin (TechLab, Blacksburg, VA). The plates containing Vero cells and toxin samples were incubated at 37°C in 5% CO2 overnight. The results of the assay were determined the following morning by viewing the cells under ×200 magnification for Vero cell rounding. The cytotoxic titer was defined as the reciprocal of the highest dilution that produced rounding in at least 80% of Vero cells per gram of luminal sample under ×200 magnification. Vero cells treated with purified C. difficile toxin and antitoxin (TechLab) were used as controls.
Histopathology evaluation.
Light microscopic evaluation was performed by a board-certified veterinary pathologist (I. L. Bergin) in a blind manner (unaware of the time points and experimental design at the time of evaluation). Each tissue was scored separately and without knowledge of which other tissues belonged to that animal. Histological lesions were categorically scored from 0 (normal) to 4 (most severe) for edema, inflammation, and epithelial damage using previously established scoring criteria (15). Individual parameter scores were summed for a summary histological score with a maximum value of 12. Samples from uninfected mice included as internal negative controls received a score of zero using the same grading scale and assessed by the same pathologist.
Representative photomicrographs were taken using an Olympus DP72 12.5 megapixel digital camera mounted to an Olympus BX45 light microscope and using commercial software (CellSens Standard 1.7.1; Olympus Corp.). Photo processing and composite plate construction were performed with Adobe Photoshop CS2, version 9.0. Photo processing was confined to global adjustments of brightness, contrast, sharpness, and image size that did not alter the interpretation of the image. All images are at the same original magnification of ×200.
Illumina MiSeq sequencing of bacterial communities.
Microbial DNA was extracted from luminal contents throughout the gastrointestinal (GI) tract using the PowerSoil-htp 96-well soil DNA isolation kit (MoBio Laboratories, Inc.). The V4 region of the 16S rRNA gene was amplified from each sample using a dual-indexing sequencing strategy (16). Each 20-μl PCR mixture contained 2 μl of 10× AccuPrime PCR buffer II (Life Technologies), 0.15 μl of AccuPrime high-fidelity Taq DNA polymerase (catalog no. 12346094; Life Technologies), 2 μl of a 4.0 μM primer set, 1 μl of DNA, and 11.85 μl of sterile double-distilled H2O (ddH2O; free of DNA, RNase, and DNase contamination). PCR was performed using the following conditions: 2 min at 95°C, followed by 30 cycles of 95°C for 20 s, 55°C for 15 s, and 72°C for 5 min, followed by 72°C for 10 min. For low-biomass samples (stomachs and small intestines of cefoperazone-treated mice) a “touchdown PCR” protocol was performed. Each 20-μl PCR mixture contained 2 μl of 10× AccuPrime PCR buffer II (Life Technologies), 0.15 μl of Accuprime high-fidelity Taq DNA polymerase (catalog no. 12346094; Life Technologies), 2 μl of a 4.0 μM primer set, 1 μl of DNA, and 11.85 μl of sterile ddH2O (free of DNA, RNase, and DNase contamination). PCR was performed using the following conditions: 2 min at 95°C, followed by 20 cycles of 95°C for 20 s, 60°C for 15 s, and 72°C for 5 min (with a 0.3°C decrease of the 60°C annealing temperature each cycle), followed by 20 cycles of 95°C for 20 s, 55°C for 15 s, and 72°C for 5 min, followed by 72°C for 10 min. Libraries are normalized using a Life Technologies SequalPrep normalization plate kit (catalog no. A10510-01) according to the manufacturer's protocol. The concentration of pooled samples was determined using a library quantification kit for Illumina platforms (Kapa Biosystems, catalog no. KK4854). The sizes of the amplicons in the library were determined using the Agilent bioanalyzer high-sensitivity DNA analysis kit (catalog no. 5067-4626). The final library consists of equal molar amounts from each of the plates, normalized to the pooled plate at the lowest concentration.
Sequencing was done on the Illumina MiSeq platform, using a MiSeq reagent kit v2 at 500 cycles (catalog no. MS-102-2003), according to the manufacturer's instructions with modifications (16). Libraries are prepared according to Illumina's protocol for preparing libraries for sequencing on the MiSeq (part number 15039740 Rev-D) for 2 nM libraries. The final load concentration is 4 pM with a 10% PhiX spike to add diversity. Sequencing reagents are prepared according to the protocol: 16S sequencing with an Illumina MiSeq personal sequencer (16; updated versions of this protocol can be found at http://www.mothur.org/wiki/MiSeq_SOP). Custom reads 1 and 2 and index primers were added to the reagent cartridge, and FASTQ files were generated for paired-end reads.
Microbiome analysis.
Analysis of the V4 region of the 16S rRNA gene was done using mothur (v1.33.3) (16, 17). Briefly, the standard operating procedure (SOP; http://www.mothur.org/wiki/MiSeq_SOP) was followed to process the MiSeq data. The paired-end reads were assembled into contigs and then aligned to the Silva 16S rRNA sequence database (18). Chimeric sequences were removed using UCHIME (19). Sequence classifications were determined by comparing sequences to the Ribosomal Database Project, version 9, with the requirement that the confidence score exceed 80% (20). Sequences were clustered into operational taxonomic units (OTU) using a 3% species level definition, and a total of 2,292,859 OTU were identified. The OTU data were then filtered to include only those OTU that made up 1% or more of the total sequences. The percent relative abundance of bacterial phyla and family members in each sample was calculated.
Targeted bile acid analysis.
Luminal content from the GI tracts of mice was weighed at necropsy and flash frozen in liquid nitrogen. Samples were sent to the Michigan Regional Comprehensive Metabolomics Resource Core. The bile acids were detected by negative liquid chromatography (LC)-electrospray ionization-triple quadrupole mass spectrometry (all bile acids were detected by negative mode). Quantitation was performed by external calibration to authentic standards. The abbreviations of bile acids were as follows: LCA, lithocholate; DCA, deoxycholate; CDCA, chendeoxycholate; UDCA, ursodeoxycholate; aMCA, alpha-muricholate; bMCA, beta-muricholate; wMCA, gamma-muricholate; CA, cholate; HCA, hyocholate; GLCA, glycolithocholate; GCDCA, glycochendeoxycholate; GDCA, glycodeoxycholate; GUDCA, glycoursodeoxycholate; GCA, glycocholate; TLCA, taurolithocholate; TCDCA, taurochendeoxycholate; TDCA, taurodeoxycholate; TUDCA, tauroursodeoxycholate; and TCA, taurocholate.
Ex vivo germination and outgrowth studies in GI luminal content.
Ex vivo studies were performed as described previously (7). Briefly, mouse GI luminal content (non-antibiotic-treated and cefoperzaone-treated mice) was weighed, passed into an anaerobic chamber, and diluted at a 1:1 ratio with PBS. C. difficile spores were added to PBS-diluted luminal content and a PBS-only control and then incubated at 37°C anaerobically for 6 h to assess germination and outgrowth. After incubation, bacterial enumeration was done on TCCFA selective medium. The remaining GI luminal content was heated at 65°C for 20 min to kill off any vegetative cells, and then bacterial enumeration was performed. Samples plated without heating represented spores and vegetative cells (germination and outgrowth). Samples plated with heat treatment represented the number of spores.
C. difficile in vitro germination assays.
In vitro studies were performed as previously described by Theriot et al. (7). Spores were subjected to heat treatment (65°C for 20 min) before use for these studies. Purified C. difficile VPI 10463 spores were incubated in brain heart infusion (BHI) plus l-cysteine at 100 mg/liter supplemented with 0.005% cholate and taurochendeoxycholate in combination for 6 h anaerobically at 37°C before dilution plating for CFU. Each bile acid is represented at the physiological concentration (0.005%) found in the distal small intestine after cefoperazone treatment. Germination was assayed by comparing growth on BHI plates (vegetative cells only) with growth on BHI agar supplemented with 0.1% taurocholate (total CFU). The percent germination was calculated as follows: [(CFU on BHI)/(CFU on BHI-taurocholate)] × 100. Germination under each condition was performed in triplicate.
Statistical analysis.
Prism 6 (GraphPad Software, Inc.) was used for statistical analysis. Significance between individual groups was done by Mann-Whitney nonparametric t test. Significance between multiple groups was determined by nonparametric Kruskal-Wallis one-way analysis of variance (ANOVA), followed by Dunn's posttest. Differences were considered significant at a P value of <0.05.
RESULTS
C. difficile spore germination, vegetative outgrowth, toxin production, and colitis in antibiotic-treated animals.
We challenged cefoperazone-treated C57BL/6 mice with 100 C. difficile spores and then euthanized animals every 6 h (n = 5 per time point) for a total of 36 h. Luminal contents and tissue were collected throughout the GI tract and used to define the levels of C. difficile colonization, toxin production, sporulation, and histopathology during this early stage of infection (Fig. 1).
Vegetative C. difficile cells were present in the large intestine and feces 6 h after challenge (Fig. 2A) but were not detectable elsewhere in the GI tract. The colonization density of C. difficile in the distal GI tract increased from 102 to 103 CFU per g of intestinal content at 6 h postchallenge to 105 CFU/g at 12 h postchallenge and to nearly 108 CFU/g by 18 h. In addition, C. difficile could be isolated from the mid and distal small intestine at 18 h postchallenge at levels of 104 CFU/g. By 24 h postchallenge, C. difficile was identified throughout the GI tract, with the highest levels still in the large intestine. By 30 h postchallenge, the C. difficile density had increased in the proximal GI tract, approaching that of the large intestine. C. difficile remained detectable at every site in the GI tract until the mice became moribund and were euthanized at 36 h postchallenge.
FIG 2.

Colonization, spore formation, and cytotoxin activity throughout the GI tract during CDI. (A) Total C. difficile isolated per g of content (n = 5 animals for each group). (B) Number of C. difficile spores isolated per g of content (n = 5 animals for each group). (C) Log10 reciprocal cytotoxin titer per g of content (n = 3 to 5 animals for each group). The dashed line going across the x axis represents the limit of detection. Values not shown are below the limit of detection. NT, not tested. The time denotes hours postchallenge with C. difficile.
From t = 0 to 18 h postchallenge, there were no detectable spores at any site, despite the high numbers of C. difficile seen in the distal GI tract (Fig. 2B). However, at 24 h postchallenge, spores were detectable in the stomach of one mouse and in the large intestine of every mouse. Spores were detectable at every site of the GI tract by 30 h. Overall, the large intestine had the highest number of spores between 30 and 36 h postchallenge, with 20% of the viable C. difficile being spores. The small intestine had the lowest percentage of spores during this time frame with 3% spores.
C. difficile cytotoxic activity became detectable in the large intestine at 24 h postchallenge, coinciding with the first detection of spores (Fig. 2C). Cytotoxin activity was maximal 30 h after challenge in the cecum and colon. Although there was some cytotoxin activity in the stomach, there were no detectable histopathological changes in the stomach or small intestine at any point during infection.
The clinical onset of disease followed the timeline of detectable spores and cytotoxin activity, with a 6-h time lag. At 30 h, the mice first showed clinical signs of disease when C. difficile colonization levels were the highest throughout the GI tract. At 36 h postinfection, the mice had multiple clinical signs of disease, including hunched posture, scruffed fur, diarrhea, and closed eyes with discharge, and were approaching 20% weight loss from baseline. As with the clinical findings, no significant histological alterations were seen until 30 h postchallenge (Fig. 3). Histological changes were confined to the cecum and colon and were most severe at 36 h, coinciding with the occurrence of severe clinical signs that resulted in the mice becoming moribund, necessitating euthanasia. There were no significant histological alterations in the stomach or small intestine at any time point. As we reported previously (15), infected animals developed a severe colitis characterized by edema, neutrophilic inflammation, and various degrees of epithelial erosion (Fig. 4). Similar findings were present in the cecum (data not shown).
FIG 3.
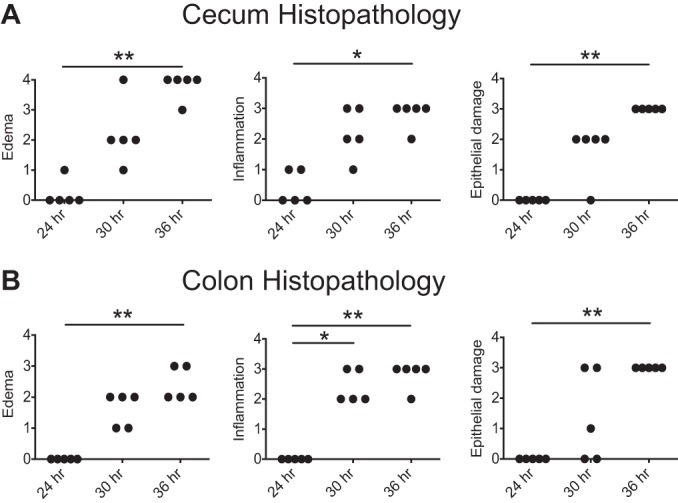
Histopathology of the cecum and colon. Histological lesions were categorically scored from 0 (normal) to 4 (most severe) for edema, inflammation, and epithelial damage for the cecum (A) and colon (B). Significance was determined by nonparametric Kruskal-Wallis one-way ANOVA followed by Dunn’s posttest (*, P < 0.05; **, P < 0.005).
FIG 4.
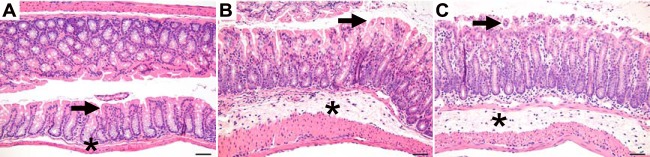
Histopathological changes in the colon throughout infection. Representative microscopic images of the colon at 24 h (A), 30 h (B), and 36 h (C) postchallenge are shown. The arrow identifies the epithelial surface, and the asterisk identifies the submucosa. The histological appearance is normal at 24 h (A) and shows submucosal edema, mucosal and submucosal inflammation, and epithelial vacuolation and erosion at 30 and 36 h (B and C). Bar, 50 μm.
Alterations in the microbiota throughout the GI tract during CDI.
Previous work has shown that alterations in the gut microbiota allow for susceptibility of CDI (7, 21). However, it is unknown how the microbiota changes during the establishment of infection. We characterized the changes in the microbiota throughout the GI tract resulting from cefoperazone treatment (see Fig. S1 in the supplemental material) and focused on the distal small intestine and the large intestine throughout infection to ascertain the possible role of the resident microbiota in resisting C. difficile colonization (Fig. 5 and see Table S1 in the supplemental material). As seen previously, the large intestinal microbiota after antibiotics becomes dominated by Lactobacillaceae. However, in the distal small intestine there was a relative increase in Lactobacillaceae following cefoperazone treatment, but a greater diversity of OTU remained compared to the large intestine (P = 0.02 [inverse Simpson index]). By 18 and 36 h postinfection, this greater diversity in the distal small intestine was lost as Lactobacillaceae eventually dominated the community. In the large intestine, C. difficile became the dominant member of the community but was less so in the small intestine.
FIG 5.

Bacterial community membership before and after cefoperazone treatment, as well as during CDI. The bar plots show the mean percent abundances of the top bacterial families (≥1% relative abundance) of the distal small intestine (A), cecum (B), and colon (C). n = 3 to 5 animals for each group. NoAbx, non-antibiotic-treated mice; 0 h, cefoperazone-treated mice prior to C. difficile challenge; 18 h, cefoperazone-treated mice at 18 h postchallenge with C. difficile; 36 h, cefoperazone-treated mice at 36 h postchallenge with C. difficile. The Peptostreptococcaceae family of bacteria includes C. difficile.
Alterations in the bile acid profile after antibiotics.
We have shown that as CDI is established, there is rapid germination, growth, and toxin production by C. difficile in the setting of a disturbed microbiome. To better understand what drives these dynamics in vivo, we also defined the metabolic environment that allows for the establishment of CDI. Since bile acids can trigger C. difficile germination as well as inhibit vegetative growth (7, 10, 22), we characterized the bile acid pool throughout the GI tract. After cefoperazone treatment, the bile acid profile was altered at each site in the GI tract (see Fig. S2 in the supplemental material). The bile acid profiles of the duodenum, jejunum, and ileum are very similar, as are the bile acid profiles of the cecum and colon. The bile acid profiles of the ileum and cecum are shown in Fig. 6A and B. In the small intestine, specifically the distal site, muricholic acids (alpha, beta, and omega) were depleted, while cholate (CA) and taurochendeoxycholate (TCDCA) were still present after cefoperazone treatment (Fig. 6A and B). The same trend with regard to muricholates could be seen in the cecum after antibiotics. Prior to antibiotics, the main difference between the small intestine and large intestine of mice was the presence of secondary bile acids deoxycholate (DCA), ursodeoxycholate (UDCA), and lithocholate (LCA), specific to the large intestine. After antibiotics, these secondary bile acids were under the limit of detection in the cecum.
FIG 6.
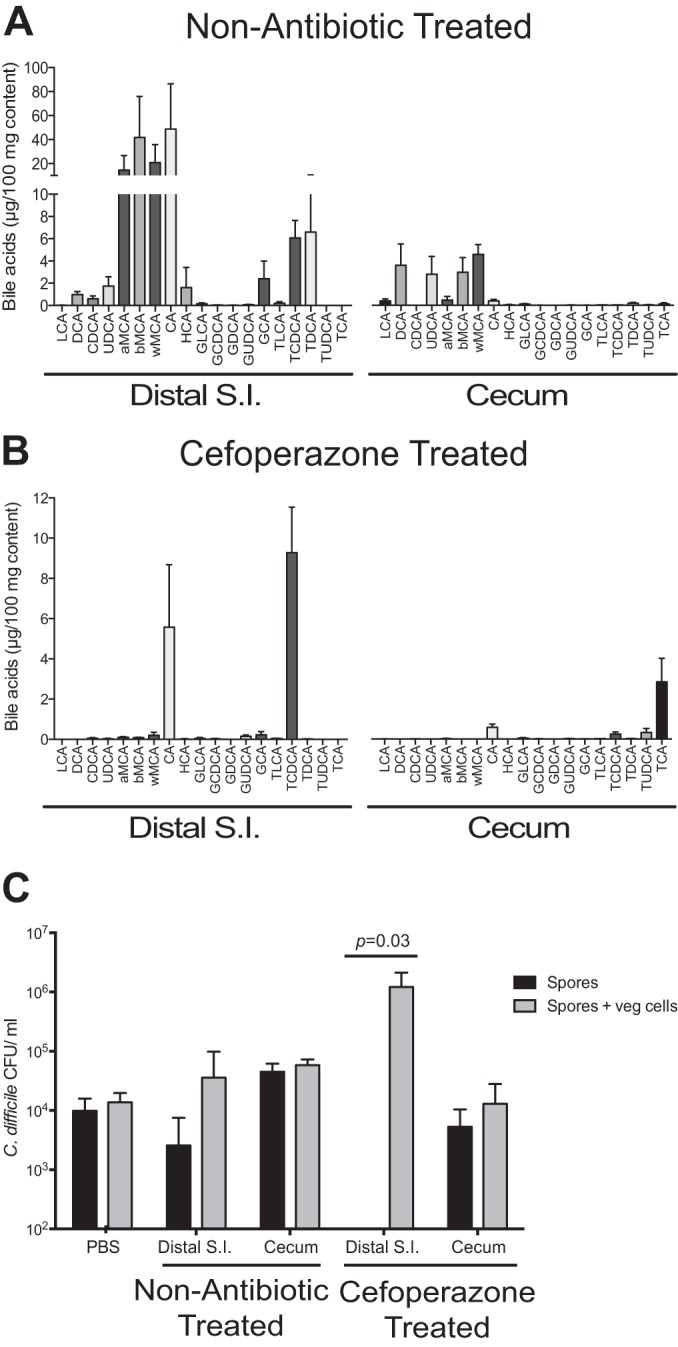
Bile acid profile and ex vivo analysis before and after cefoperazone treatment. Bile acids were analyzed by liquid chromatography-mass spectrometry from distal small intestinal (S.I.) and cecal content of non-antibiotic-treated (A) and cefoperazone-treated (B) mice (n = 5 animals for each group). (C) Ex vivo germination and outgrowth of C. difficile spores were measured in distal small intestinal and cecal content from non-antibiotic-treated and cefoperazone-treated mice (n = 4 animals for each group). Black bars depict results for spores alone, and gray bars depict results for both spores and vegetative (veg) cells that were able to outgrow after 6 h of incubation. Significance between groups was determined by using the Mann-Whitney nonparametric t test. Error bars represent the means ± standard errors of the mean.
Since bile acids can both allow the germination of C. difficile spores and inhibit vegetative cell growth, we used an ex vivo approach to determine whether the altered bile acid profile allowed C. difficile germination and outgrowth. The distal small intestine after antibiotics allowed for complete germination of C. difficile spores and outgrowth of vegetative cells, while germination did not occur in the cecal content (Fig. 6C). Interestingly, spores were also able to germinate in the small intestine prior to antibiotics, while germination was completely inhibited in the cecal content (Fig. 6C).
DISCUSSION
We determined that the dynamics of CDI throughout the GI tract was one of rapid germination and growth. In the present study, we identified the location and timing of C. difficile spore germination, growth, toxin production, and sporulation; we also addressed the environment required for the germination of spores and the establishment of infection. We identified the bile acid germinants in vivo and confirmed that they supported germination of spores in vitro. Finally, we confirmed that the germination of C. difficile spores can occur in the small intestine regardless of antibiotic pretreatment.
Disease during CDI was localized to the large intestine and did not occur in the small intestine during CDI. Despite some detectable cytotoxic activity in the ileum, histopathological analysis confirmed no signs of disease in the small intestine throughout the infection. It is interesting that a large amount of C. difficile in the small intestine at 30 h postchallenge (between 105 and 106 CFU/g) does not result in disease, whereas 107 CFU of C. difficile/g in the cecum results in an increased amount of detectable cytotoxic activity and significant histopathological signs of disease. These data further support that the cecum is the site for optimal C. difficile growth, toxin production, and disease after antibiotic treatment (7, 15, 23).
C. difficile sporulation and cytotoxic activity occurred simultaneously in the large intestine. The trigger for C. difficile sporulation is unknown and is hypothesized to involve environmental conditions such as a nutrient limitation or stress. Toxin production is regulated by many cellular proteins and is also affected by nutrient limitation, although the regulatory network is still being defined (24–26). Our in vivo experiments suggest a link between toxin expression and sporulation in C. difficile VPI 10463. Since there is a strong relationship between C. difficile metabolism and virulence, defining differences between the microbial and metabolic environment in the ileum and cecum may be important for elucidating virulence signals (27).
The role of the small intestine in C. difficile germination and pathogenesis is not well defined. Several studies have only begun to look at the environment in the small intestine for its ability to initiate C. difficile spore germination and colonization (21, 28). The Syrian hamster model was first used to establish Koch's postulates for C. difficile, where a single dose of clindamycin resulted in susceptibility to CDI (29). Using the hamster model, Wilson et al. first showed that the germination of spores in the small bowel was rapid and suggested that bile acids enhanced germination in vivo (30). More recently, using a mouse model, Giel et al. (28) suggested that primary bile acids in the small intestine were responsible for C. difficile spore germination. We have confirmed this finding in a mouse model of CDI, and we identified specific bile acids that are driving spore germination in the small intestine. Since CA and TCDCA were the major bile acids present in the small intestine after antibiotics and have been shown to be germinants in vitro (31), we sought to determine whether they could support C. difficile spore germination at the physiological concentrations. We found that CA is the preferred germinant of C. difficile spores, while TCDCA is a poor germinant (see Fig. S3 in the supplemental material); however, both could support germination in vitro at the physiological concentration, suggesting that they are sufficient for C. difficile spore germination in vivo.
Interestingly, we consistently see that the distal small intestine prior to antibiotics supports germination of C. difficile spores, suggesting C. difficile spores are able to germinate both before and after the introduction of antibiotics. This has also been reported in non-antibiotic-treated Syrian hamsters and mice (28, 30). Therefore, prevention of CDI should focus more on the role that the gut microbiota plays in colonization resistance against the outgrowth of C. difficile vegetative cells in the large intestine. Mechanisms of microbiota-dependent colonization resistance against C. difficile have been proposed, including inhibition of vegetative cells by microbiota-derived secondary bile acid, deoxycholate (7, 32, 33), and competition for nutrients such as monosaccharides, sugar alcohols, and host-liberated sugars (7, 34). The identification of vegetative growth in the large intestine as a critical point of the C. difficile life cycle during infection provides a targeted intervention site for evaluation of these and other potential microbiota-related resistance mechanisms.
Supplementary Material
ACKNOWLEDGMENTS
This study is funded by National Institutes of Health (NIH) grant U19AI090871. In addition, C.M.T. is supported by the NIH Metabolomics Common Fund and the National Institute of General Medical Science under award K01GM109236, and P.D.S. is supported by NIH grant 5R01GM099514. For bile acid analysis, we utilized the Metabolomics Core Services supported by grant U24 DK097153 of NIH Common Funds Project to the University of Michigan.
We thank Katherine Wozniak and Diane Wang for assisting with the animal studies, as well as the Host Microbiome Initiative at the University of Michigan for support.
Footnotes
Supplemental material for this article may be found at http://dx.doi.org/10.1128/IAI.02768-14.
REFERENCES
- 1.Dubberke ER, Olsen MA. 2012. Burden of Clostridium difficile on the health care system. Clin Infect Dis 55(Suppl 2):S88–S92. doi: 10.1093/cid/cis335. [DOI] [PMC free article] [PubMed] [Google Scholar]
- 2.Rupnik M, Wilcox MH, Gerding DN. 2009. Clostridium difficile infection: new developments in epidemiology and pathogenesis. Nat Rev Microbiol 7:526–536. doi: 10.1038/nrmicro2164. [DOI] [PubMed] [Google Scholar]
- 3.Paredes-Sabja D, Shen A, Sorg JA. 2014. Clostridium difficile spore biology: sporulation, germination, and spore structural proteins. Trends Microbiol 22:406–416. doi: 10.1016/j.tim.2014.04.003. [DOI] [PMC free article] [PubMed] [Google Scholar]
- 4.Britton RA, Young VB. 2012. Interaction between the intestinal microbiota and host in Clostridium difficile colonization resistance. Trends Microbiol 20:313–319. doi: 10.1016/j.tim.2012.04.001. [DOI] [PMC free article] [PubMed] [Google Scholar]
- 5.Buffie CG, Pamer EG. 2013. Microbiota-mediated colonization resistance against intestinal pathogens. Nat Rev Immunol 13:790–801. doi: 10.1038/nri3535. [DOI] [PMC free article] [PubMed] [Google Scholar]
- 6.Yurist-Doutsch S, Arrieta MC, Vogt SL, Finlay BB. 2014. Gastrointestinal microbiota-mediated control of enteric pathogens. Annu Rev Genet 48:361–382. doi: 10.1146/annurev-genet-120213-092421. [DOI] [PubMed] [Google Scholar]
- 7.Theriot CM, Koenigsknecht MJ, Carlson PE Jr, Hatton GE, Nelson AM, Li B, Huffnagle GB, Li JZ, Young VB. 2014. Antibiotic-induced shifts in the mouse gut microbiome and metabolome increase susceptibility to Clostridium difficile infection. Nat Commun 5:3114. doi: 10.1038/ncomms4114. [DOI] [PMC free article] [PubMed] [Google Scholar]
- 8.Sayin SI, Wahlstrom A, Felin J, Jantti S, Marschall HU, Bamberg K, Angelin B, Hyotylainen T, Oresic M, Backhed F. 2013. Gut microbiota regulates bile acid metabolism by reducing the levels of tauro-beta-muricholic acid, a naturally occurring FXR antagonist. Cell Metab 17:225–235. doi: 10.1016/j.cmet.2013.01.003. [DOI] [PubMed] [Google Scholar]
- 9.Ridlon JM, Kang DJ, Hylemon PB. 2006. Bile salt biotransformations by human intestinal bacteria. J Lipid Res 47:241–259. [DOI] [PubMed] [Google Scholar]
- 10.Sorg JA, Sonenshein AL. 2009. Chenodeoxycholate is an inhibitor of Clostridium difficile spore germination. J Bacteriol 191:1115–1117. doi: 10.1128/JB.01260-08. [DOI] [PMC free article] [PubMed] [Google Scholar]
- 11.Reeves AE, Koenigsknecht MJ, Bergin IL, Young VB. 2012. Suppression of Clostridium difficile in the gastrointestinal tracts of germfree mice inoculated with a murine isolate from the family Lachnospiraceae. Infect Immun 80:3786–3794. doi: 10.1128/IAI.00647-12. [DOI] [PMC free article] [PubMed] [Google Scholar]
- 12.Best EL, Freeman J, Wilcox MH. 2012. Models for the study of Clostridium difficile infection. Gut Microbes 3:145–167. doi: 10.4161/gmic.19526. [DOI] [PMC free article] [PubMed] [Google Scholar]
- 13.Lawley TD, Young VB. 2013. Murine models to study Clostridium difficile infection and transmission. Anaerobe 24:94–97. doi: 10.1016/j.anaerobe.2013.09.008. [DOI] [PMC free article] [PubMed] [Google Scholar]
- 14.Perez J, Springthorpe VS, Sattar SA. 2011. Clospore: a liquid medium for producing high titers of semipurified spores of Clostridium difficile. J AOAC Int 94:618–626. [PubMed] [Google Scholar]
- 15.Theriot CM, Koumpouras CC, Carlson PE, Bergin II, Aronoff DM, Young VB. 2011. Cefoperazone-treated mice as an experimental platform to assess differential virulence of Clostridium difficile strains. Gut Microbes 2:326–334. doi: 10.4161/gmic.19142. [DOI] [PMC free article] [PubMed] [Google Scholar]
- 16.Kozich JJ, Westcott SL, Baxter NT, Highlander SK, Schloss PD. 2013. Development of a dual-index sequencing strategy and curation pipeline for analyzing amplicon sequence data on the MiSeq Illumina sequencing platform. Appl Environ Microbiol 79:5112–5120. doi: 10.1128/AEM.01043-13. [DOI] [PMC free article] [PubMed] [Google Scholar]
- 17.Schloss PD, Westcott SL, Ryabin T, Hall JR, Hartmann M, Hollister EB, Lesniewski RA, Oakley BB, Parks DH, Robinson CJ, Sahl JW, Stres B, Thallinger GG, Van Horn DJ, Weber CF. 2009. Introducing mothur: open-source, platform-independent, community-supported software for describing and comparing microbial communities. Appl Environ Microbiol 75:7537–7541. doi: 10.1128/AEM.01541-09. [DOI] [PMC free article] [PubMed] [Google Scholar]
- 18.Pruesse E, Quast C, Knittel K, Fuchs BM, Ludwig W, Peplies J, Glockner FO. 2007. SILVA: a comprehensive online resource for quality checked and aligned rRNA sequence data compatible with ARB. Nucleic Acids Res 35:7188–7196. doi: 10.1093/nar/gkm864. [DOI] [PMC free article] [PubMed] [Google Scholar]
- 19.Edgar RC, Haas BJ, Clemente JC, Quince C, Knight R. 2011. UCHIME improves sensitivity and speed of chimera detection. Bioinformatics 27:2194–2200. doi: 10.1093/bioinformatics/btr381. [DOI] [PMC free article] [PubMed] [Google Scholar]
- 20.Cole JR, Wang Q, Cardenas E, Fish J, Chai B, Farris RJ, Kulam-Syed-Mohideen AS, McGarrell DM, Marsh T, Garrity GM, Tiedje JM. 2009. The Ribosomal Database Project: improved alignments and new tools for rRNA analysis. Nucleic Acids Res 37:D141–D145. doi: 10.1093/nar/gkn879. [DOI] [PMC free article] [PubMed] [Google Scholar]
- 21.Buffie CG, Jarchum I, Equinda M, Lipuma L, Gobourne A, Viale A, Ubeda C, Xavier J, Pamer EG. 2012. Profound alterations of intestinal microbiota following a single dose of clindamycin results in sustained susceptibility to Clostridium difficile-induced colitis. Infect Immun 80:62–73. doi: 10.1128/IAI.05496-11. [DOI] [PMC free article] [PubMed] [Google Scholar]
- 22.Sorg JA, Sonenshein AL. 2008. Bile salts and glycine as cogerminants for Clostridium difficile spores. J Bacteriol 190:2505–2512. doi: 10.1128/JB.01765-07. [DOI] [PMC free article] [PubMed] [Google Scholar]
- 23.Reeves AE, Theriot CM, Bergin IL, Huffnagle GB, Schloss PD, Young VB. 2011. The interplay between microbiome dynamics and pathogen dynamics in a murine model of Clostridium difficile infection. Gut Microbes 2:145–158. doi: 10.4161/gmic.2.3.16333. [DOI] [PMC free article] [PubMed] [Google Scholar]
- 24.Barketi-Klai A, Monot M, Hoys S, Lambert-Bordes S, Kuehne SA, Minton N, Collignon A, Dupuy B, Kansau I. 2014. The flagellin FliC of Clostridium difficile is responsible for pleiotropic gene regulation during in vivo infection. PLoS One 9:e96876. doi: 10.1371/journal.pone.0096876. [DOI] [PMC free article] [PubMed] [Google Scholar]
- 25.Underwood S, Guan S, Vijayasubhash V, Baines SD, Graham L, Lewis RJ, Wilcox MH, Stephenson K. 2009. Characterization of the sporulation initiation pathway of Clostridium difficile and its role in toxin production. J Bacteriol 191:7296–7305. doi: 10.1128/JB.00882-09. [DOI] [PMC free article] [PubMed] [Google Scholar]
- 26.Mackin KE, Carter GP, Howarth P, Rood JI, Lyras D. 2013. Spo0A differentially regulates toxin production in evolutionarily diverse strains of Clostridium difficile. PLoS One 8:e79666. doi: 10.1371/journal.pone.0079666. [DOI] [PMC free article] [PubMed] [Google Scholar]
- 27.Bouillaut L, Dubois T, Sonenshein AL, Dupuy B. Integration of metabolism and virulence in Clostridium difficile. Res Microbiol, in press. [DOI] [PMC free article] [PubMed] [Google Scholar]
- 28.Giel JL, Sorg JA, Sonenshein AL, Zhu J. 2010. Metabolism of bile salts in mice influences spore germination in Clostridium difficile. PLoS One 5:e8740. doi: 10.1371/journal.pone.0008740. [DOI] [PMC free article] [PubMed] [Google Scholar]
- 29.Bartlett JG, Onderdonk AB, Cisneros RL, Kasper DL. 1977. Clindamycin-associated colitis due to a toxin-producing species of Clostridium in hamsters. J Infect Dis 136:701–705. doi: 10.1093/infdis/136.5.701. [DOI] [PubMed] [Google Scholar]
- 30.Wilson KH, Sheagren JN, Freter R. 1985. Population dynamics of ingested Clostridium difficile in the gastrointestinal tract of the Syrian hamster. J Infect Dis 151:355–361. doi: 10.1093/infdis/151.2.355. [DOI] [PubMed] [Google Scholar]
- 31.Howerton A, Ramirez N, Abel-Santos E. 2011. Mapping interactions between germinants and Clostridium difficile spores. J Bacteriol 193:274–282. doi: 10.1128/JB.00980-10. [DOI] [PMC free article] [PubMed] [Google Scholar]
- 32.Buffie CG, Bucci V, Stein RR, McKenney PT, Ling L, Gobourne A, No D, Liu H, Kinnebrew M, Viale A, Littmann E, van den Brink MR, Jenq RR, Taur Y, Sander C, Cross J, Toussaint NC, Xavier JB, Pamer EG. Precision microbiome reconstitution restores bile acid mediated resistance to Clostridium difficile. Nature, in press. [DOI] [PMC free article] [PubMed] [Google Scholar]
- 33.Sorg JA. 2014. Microbial bile acid metabolic clusters: the bouncers at the bar. Cell Host Microbe 16:551–552. doi: 10.1016/j.chom.2014.10.015. [DOI] [PMC free article] [PubMed] [Google Scholar]
- 34.Ng KM, Ferreyra JA, Higginbottom SK, Lynch JB, Kashyap PC, Gopinath S, Naidu N, Choudhury B, Weimer BC, Monack DM, Sonnenburg JL. 2013. Microbiota-liberated host sugars facilitate post-antibiotic expansion of enteric pathogens. Nature 502:96–99. doi: 10.1038/nature12503. [DOI] [PMC free article] [PubMed] [Google Scholar]
Associated Data
This section collects any data citations, data availability statements, or supplementary materials included in this article.