

Background: The extent and mechanisms by which maternal weight loss affects the offspring were determined.
Results: Maternal weight loss affects epigenetic marks in both oocytes and two generations of offspring.
Conclusion: Maternal weight loss improves the metabolic health in offspring partially through gametic epigenetic alterations.
Significance: This finding reveals a molecular basis of how maternal lifestyle modification affects offspring.
Keywords: DNA Demethylation, DNA Methylation, Embryo, Epigenetics, Fertilization, Obesity, Oocyte, Reprogramming, Epigenetic Inheritance, Weight Loss
Abstract
The global prevalence of weight loss is increasing, especially in young women. However, the extent and mechanisms by which maternal weight loss affects the offspring is still poorly understood. Here, using an enriched environment (EE)-induced weight loss model, we show that maternal weight loss improves general health and reprograms metabolic gene expression in mouse offspring, and the epigenetic alterations can be inherited for at least two generations. EE in mothers induced weight loss and its associated physiological and metabolic changes such as decreased adiposity and improved glucose tolerance and insulin sensitivity. Relative to controls, their offspring exhibited improved general health such as reduced fat accumulation, decreased plasma and hepatic lipid levels, and improved glucose tolerance and insulin sensitivity. Maternal weight loss altered gene expression patterns in the liver of offspring with coherent down-regulation of genes involved in lipid and cholesterol biosynthesis. Epigenomic profiling of offspring livers revealed numerous changes in cytosine methylation depending on maternal weight loss, including reproducible changes in promoter methylation over several key lipid biosynthesis genes, correlated with their expression patterns. Embryo transfer studies indicated that oocyte alteration in response to maternal metabolic conditions is a strong factor in determining metabolic and epigenetic changes in offspring. Several important lipid metabolism-related genes have been identified to partially inherit methylated alleles from oocytes. Our study reveals a molecular and mechanistic basis of how maternal lifestyle modification affects metabolic changes in the offspring.
Introduction
Obesity and related metabolic syndromes are globally prevalent and rapidly becoming major global health, social, and economic problems (1, 2). They contribute to the early emergence of type 2 diabetes and its epidemic spreading (3). Having either parent with obesity is an independent risk factor for obesity in children (4). Although the impact of diet-induced paternal obesity on metabolism and adiposity has been demonstrated, increasing evidence indicates a significant role of maternally derived factors in obesity and metabolic programming of the offspring (5). Human obesity appears to be mostly related to complex interactions between genetic backgrounds and environmental factors (6). Although some alleles associated with obesity have been identified and can be inherited from parents (7), maternal environmental exposures also play an important role in affecting the offspring phenotypes (8, 9) with the potential to contribute to the rapid increase in obesity. In humans, maternal obesity during pregnancy can lead to enhanced birth weight; increased circulating insulin, glucose, and triglycerides; and glucose intolerance as well as obesity in offspring (10, 11). In rats, maternal obesity leads to early onset obesity, altered glucose metabolism, and insulin sensitivity (12, 13). In mice, offspring of obese mothers are heavier, diabetic and insulin-resistant, and produce second generation offspring with glucose intolerance and insulin resistance (14, 15). Therefore, maternal obesity may play an important role not only in programming obesity in offspring but also in the intergenerational transmission and amplification of the obesity epidemic. Collectively, these facts indicate that mothers can initiate intergenerational transmission of obesity and increase the risk for metabolic diseases in offspring.
To overcome the increased prevalence of obesity and its complications, weight loss is becoming more and more popular in modern society, particularly in young women. Although it is appealing and has health benefits for an individual (4, 16), how and to what extent it affects the offspring is still poorly understood. We reasoned that if maternal obesity contributes to obesity and its related metabolic disorders in offspring then maternal weight loss could improve the general health and metabolic parameters in the offspring, and if it does, then the mechanisms that mediate these effects can be characterized. In humans, the increased prevalence of obesity is closely correlated with the lifestyle changes in modern society such as the increase in sedentary behavior and office work. Correspondingly, outdoor exercise and playing physical games with friends are recognized as effective means to increase energy expenditure leading to weight loss. Mice living in a standard laboratory environment provide an ideal non-genetic obese model system (17, 18). They live in a small cage and have sufficient food but little exercise, therefore optimally mimicking the modern lifestyle of humans such as sedentary behavior and office work (19). Mice living in an enriched environment can be considered as a suitable weight loss model (20, 21). They live in a larger space, allowing more physical activity and social stimulation. This condition mimics weight loss behaviors in humans (such as outdoor exercise and playing physical games with friends). Importantly, these animals exhibit a significantly leaner phenotype than those living in standard laboratory conditions although they are fed ad libitum on identical diets (17). We therefore asked whether simply placing female mice in an enriched environment may induce effects that are sufficient to significantly improve the metabolic health in the offspring.
In this study, we describe a physiological and genomic screen for transgenerational effects of maternal weight loss on metabolism and gene expression in offspring of mice (see Fig. 1 for a schematic). EE2 in mothers induced improved general health such as reduced fat accumulation, enhanced metabolic parameters, and improved glucose tolerance and insulin sensitivity in offspring. The expression of thousands of genes was altered in the liver of offspring from weight loss mothers with coherent down-regulation of genes involved in lipid and cholesterol biosynthesis. Epigenomic profiling in offspring livers revealed numerous changes in cytosine methylation depending on maternal weight loss, including promoter hypermethylation of several important genes involved in lipid and cholesterol biosynthesis, correlated with their expression patterns. Embryo transplantation studies revealed the important role of oocyte alteration in determining the metabolic and molecular changes in offspring. Several genes whose methylation status was significantly altered by maternal weight loss have been identified to partially resist global demethylation postfertilization and to some extent inherit methylated alleles from oocytes. Interestingly, maternal weight loss also altered the overall transcriptome patterns in oocytes with reproducible changes of several genes involved in lipid metabolism and chromatin modification. These facts indicate that the oocyte may be a key nexus that integrates maternal metabolic information to control offspring phenotypes. Overall, this study provides a molecular basis of how a maternal lifestyle change affects the offspring and may have implications explaining the epidemiology of several major human diseases.
FIGURE 1.
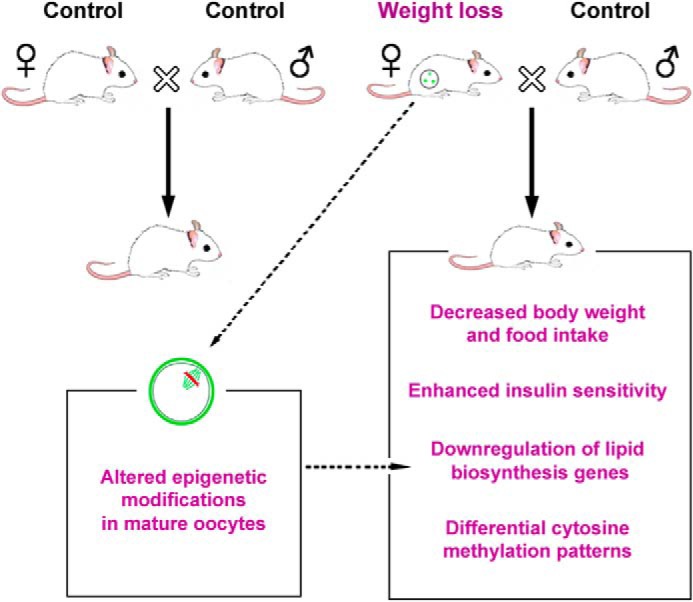
Experimental schematic. Control or EE-induced weight loss females were mated with males. Offspring of weight loss mothers exhibited improved general health such as decreased body weight and fat accumulation and enhanced glucose tolerance and insulin sensitivity. Gene expression profiling reveals coherent down-regulation of genes involved in lipid and cholesterol biosynthesis. Consistently, differential methylation patterns were observed in these animals. Maternal weight loss altered epigenetic marks in mature oocytes, which might contribute largely to the metabolic and epigenetic changes in offspring.
EXPERIMENTAL PROCEDURES
Enriched Environment Protocol
All experiments were performed with Institute of Cancer Research mice that had been raised for at least two generations in standard conditions to attempt to minimize any transgenerational effects brought about by the animal provider. All animal care and use procedures were in accordance with guidelines and approved by the Institutional Animal Care and Use Committee of the Institute of Zoology, Chinese Academy of Sciences. Maternal weight loss was performed in EE cages (Fig. 2A). Female F0 founders were first raised in a standard laboratory environment from weaning until 12 weeks of age at which point they were randomly placed into EE cages or maintained in normal cages for 4 weeks. For EE groups, mice were placed into large cages (four to six mice per cage) of 310 × 450 × 490 mm supplemented with running wheels, toys, stairs, huts, and a seesaw in addition to standard lab chow and water. All of the EE devices and plastic toys were strictly selected to be free of bisphenol A or other toxic chemicals. At 16 weeks, female F0 founders of EE or control were mated with males in standard cages under standard conditions (note that EE mothers were no longer returned to EE cages after mating). Offspring were delivered and raised in standard cages under standard conditions until 16 weeks of age.
FIGURE 2.
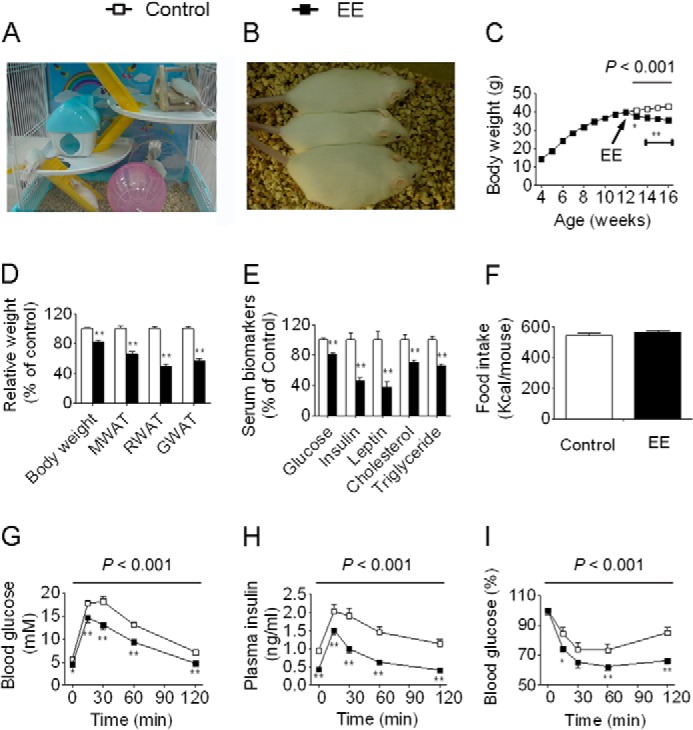
EE leads to physiological and metabolic changes in mothers. A, an EE cage. B, EE mice exhibit a leaner phenotype (top, short term EE; middle, standard EE; bottom, control). C, body weight trajectories (control and EE, n = 15 and 16, respectively). D, EE decreases body weight, weight of mesenteric white adipose tissue (MWAT), retroperitoneal white adipose tissue (RWAT), and gonadal white adipose tissue (GWAT) (n = 10 and 12, respectively). E, effects of EE on serum biomarkers (n = 10 and 12, respectively). F, total food intake (n = 6 and 5, respectively). G, blood glucose during GTT (n = 6 and 8, respectively). H, plasma insulin during GTT (n = 6 and 8, respectively). I, blood glucose during ITT (n = 6 and 8, respectively). For simplicity, body weight, weight of WAT, and serum biomarkers are displayed as the percentage of control in the figure. However, detailed data are also available in supplemental Data Set S2. Data are expressed as mean ± S.E. (error bars). For single point measurements, the asterisks indicate a significant difference between groups: *, p < 0.05; **, p < 0.01 versus control. For time course measurements, p values for significance between groups are shown at the top of the panel.
Short Term EE
4 weeks of EE was regarded as a standard EE, whereas 2 weeks of EE was regarded as a short term EE. Each EE had its age-matched unique control. For standard EE, the control mice were aged to 16 weeks, whereas for short term EE, the control mice were aged to 14 weeks.
Animal Care
Female F0 founders were raised on standard diet in a normal cage until 12 weeks of age at which point they were placed into the EE cage or still maintained in the normal cage, chosen at random, for 4 weeks. Males were always raised on standard diet in the standard cage. At 16 weeks, female F0 founders were mated with males in standard cages under controlled temperature (22 ± 2 °C) and lighting (12:12-h light/dark cycle) and had free access to sterile water and pellet food ad libitum. Control and weight loss mating cages were always interspersed with one another. After 1 or 2 days, males were removed, and pregnant females were left alone with standard diet in the standard cage until their litters were 3 weeks of age. Note that a single male was mated with a single female for only one time and thus produced only one litter. Only litter sizes between 8 and 12 were included, and litters were standardized to 10 pups at day 1 within mother groups to avoid a nutrition imbalance. Offspring were always housed in standard cages (four to six mice per cage). Note that we always used virgin males to avoid confounding effects brought about by the males (22, 23). Moreover, males mated with two female groups did not differ in phenotypic data (body weight, adiposity, and fasting blood glucose and insulin levels). At 3 weeks of age, a portion of the offspring were sacrificed, and the median lobe of liver was rapidly dissected out and flash frozen in liquid N2, each from an independent mother. Animals were sacrificed between 8 and 9 a.m. to avoid any mismatches in circadian cycle. Phenotype data from one offspring per mother, chosen at random, were generated at 16 weeks of age. Serum biomarkers, including blood glucose (Roche Diagnostics Accu-Chek), plasma insulin (ALPCO Diagnostics), leptin (ALPCO Diagnostics), triglyceride (Wako Diagnostics), total cholesterol (Wako Diagnostics), and free fatty acid (Wako Diagnostics) were determined after overnight fasting. Liver triglyceride and cholesterol were extracted in chloroform/methanol (2:1, v/v) (24) and measured as above. Body weight and food intake were monitored weekly, the latter by collecting and weighing food remaining after 24 h. Food intake was averaged across animals housed with four to six per cage to reduce stress. Diets were obtained from Beijing Vital River Co., and detailed compositions are listed in supplemental Data Set S1. For hormonal and metabolic parameters, litters ranging from five to 20 were included depending on the different tests, and one offspring per sex per litter was used for each test. For all comparisons shown, n represents the number of animals used in each test. For simplicity, body weight, weight of white adipose tissue (WAT), and serum biomarkers are displayed as percentage of control in figures. However, detailed data are also available in supplemental Data Set S2.
Glucose Tolerance Test (GTT) and Insulin Tolerance Test (ITT)
For GTT, mice were injected intraperitoneally with glucose (2 g kg−1) after overnight fasting. Blood glucose was measured at the indicated time points. For ITT, we injected insulin (1 unit kg−1) intraperitoneally into mice at 2 h of fasting. We collected blood and determined glucose using a glucometer (Roche Diagnostics Accu-Chek). Serum insulin levels were measured using an enzyme-linked immunosorbent assay kit (ultrasensitive mouse insulin ELISA kit, ALPCO Diagnostics). Blood glucose or insulin levels were measured before injection (time 0) and at 15, 30, 60, and 120 min after injection. Single time measurements were analyzed by analysis of variance or, if appropriate, by two-tailed Student's t test, and time courses were analyzed by repeated measures analysis of variance.
Microarray Expression Profiling
Total RNA was extracted from the median lobe of liver using TRIzol reagent (Invitrogen). Samples from five control and four weight loss offspring, each from an independent mother, were chosen for microarray analysis using NimbleGen Mouse Gene Expression 12 × 135K Array (Roche NimbleGen) according to the manufacturer's instructions. A series of software (NimbleScan software and Agilent GeneSpring GX software) was used for data analysis. After adjustment and normalization by the robust multichip analysis method, the data were analyzed by Significance Analysis of Microarrays (SAM) software (25). All array data and additional details on samples and analysis are available in the Gene Expression Omnibus (GEO) under accession number GSE40479. Differentially expressed genes were determined based on a -fold change >2 at a false discovery rate correction of 5%. Differentially expressed genes were functionally annotated according to gene ontology terms or Kyoto Encyclopedia of Genes and Genomes pathways using DAVID (Database for Annotation, Visualization and Integrated Discovery). Additionally, differentially expressed genes were hierarchically clustered using Cluster 3.0.
Quantitative Real Time PCR (qRT-PCR)
We analyzed mRNA levels by qRT-RCR after reverse transcription as described before (26). For liver tissues, total RNA was extracted from the median lobe of liver using TRIzol reagent (Invitrogen) and quantified by absorbance at 260 and 280 nm in a PerkinElmer Life Sciences spectrophotometer. It was then used as a template for complementary DNA (cDNA) synthesis by SuperScript III first strand synthesis (Invitrogen) with random hexamers. For oocytes, amplification of small amounts of the cDNA of the cells was based on a previous protocol (27). mRNA quantity was determined with the Roche LightCycler 480 II quantitative RT-PCR system (Roche Applied Science) using primer sequences summarized in supplemental Data Set S1 and SYBR Green SuperMix-UDG (Invitrogen). PCR was performed in a final volume of 25 μl consisting of diluted cDNA sample, 1× SYBR Green Mix (Invitrogen), primers optimized for each target gene, and nuclease-free water. The PCR condition was 40 cycles at 95 °C for 30 s, 55 °C for 1 min, and 72 °C for 30 s. Gene transcript levels were normalized to the housekeeping gene β-actin. The results were expressed as 2−(target gene number of cycles − β-actin number of cycles). Note that for Lpin1, the β isoform (transcript variant 2, GenBankTM accession number NM_015763.4) was used for analysis.
DNA Methylation Profiling
The same animals used in microarray analysis were used for the methylated DNA immunoprecipitation (MeDIP) study. We used the NimbleGen MM8 385K Promoter Plus CpG Island Microarray (Roche NimbleGen) to perform methylation analysis. The array contains 15,963 annotated CpG islands and covers all known Reference Sequence gene promoter regions (from −1300 to +500 bp relative to the transcription start site). The MeDIP method was adapted from a previous study (28). 4 μg of purified genomic DNA was fragmented to a size of 100–500 bp using a Covaris machine. After denaturation, the DNA was immunoprecipitated with 10 μg of monoclonal antibody against 5-methylcytidine (Diagenode) in 300 μl of IP buffer (10 mm sodium phosphate at pH 7.0, 140 mm NaCl, 0.05% Triton X-100) for 5 h at 4 °C and then washed three times with 800 μl of IP buffer. Immunoprecipitated DNA was recovered with proteinase K digestion followed by column-based purification (DNA Wizard, Promega). The purified immunoprecipitated DNA was used for microarray hybridization. For methylation analysis of the microarray, we adopted a method from a previous study (28). We defined promoters that gain methylation in EE groups as follows: log2 ratio in control group <0.4, Δlog2 ratio (EE versus control) >0.25, and p < 0.05. All MeDIP-chip data and additional details on samples and analysis are available in the Gene Expression Omnibus (GEO) under accession number GSE40479.
Bisulfite Sequencing
Bisulfite genomic sequencing was performed as described previously (29). Bisulfite modification was accomplished using the EZ DNA Methylation kit (Zymo Research). The converted DNA was then amplified by PCR with primers summarized in supplemental Data Set S1. The obtained PCR products were purified using the MinElute Gel Extraction kit (Invitrogen) and cloned into the pMD18-T Vector (Takara). Individual clones were grown, and the plasmids were purified using the PureLink Miniprep kit (Invitrogen). The positive clones were confirmed by PCR, and no fewer than 10 clones randomly selected for each subject were sequenced using an automatic sequencer (ABI PRISM-77). Sequencing results were analyzed using MethTools 2.0. The regions that were examined by bisulfite sequencing are as follows: Hmgcr, Chromosome 13: 97441152–97441498; Lss, Chromosome 10: 75994273–75994536; Sqle, Chromosome 15: 59146023–59146335; and Lpin1, Chromosome 12: 16596388–16596703.
mRNA-Seq
For mRNA-Seq, pooled mRNA from three animals (equally from each animal) for each group was used for analysis, and the average expression level for each group was evaluated. Briefly, naturally ovulated mature oocytes (metaphase of the second meiosis (MII stage)) were collected from three control and three EE female F0 founders (three oocytes per mouse, nine oocytes for each group). Cumulus cells were removed from oocytes by treatment with hyaluronidase. Amplification of small amounts of the cDNA of the cells was based on a previous protocol (27). The cDNAs were evenly amplified by PCR for 20 cycles. Libraries were purified and sequenced on an Applied Biosystems SOLiD sequencing system. Sequencing data were mapped to the mouse genome to extract the whole transcriptome information of oocytes. Mapped read data were analyzed by the DEGseq package as described previously (30). The detected genes with corresponding read counts greater than 200 were chosen for further analysis. The -fold change selection method was used for differentially expressed gene selection. Genes with log2 values greater than 0.584 or less than −0.584 (-fold change >1.5) were considered as up-regulated or down-regulated, respectively.
Embryo Transfer
The estrous female F0 founders were mated with males. Successful mating was determined by the presence of the vaginal plug, and the morning of the vaginal plug presence was designated day 0.5. One-cell stage embryos at day 0.5 were obtained from control or EE females and then transferred into oviducts of day 0.5 pseudopregnant females, respectively. Pregnant females were left alone in standard conditions until their litters were 3 weeks of age. Only mothers with litter sizes of 8–12 were included, and litters were standardized to 10 pups at day 1 within mother groups to avoid a nutrition imbalance. One offspring per mother chosen randomly was used for metabolic and molecular studies as described for naturally fertilized animals. For blastocysts used for bisulfite sequencing, embryonic day (E) 3.5 blastocysts were collected at day 3.5 by flushing the oviducts with M2 medium. Each bisulfite treatment was performed on 18 pooled blastocysts derived from three animals (six blastocysts randomly selected from each animal) for each group.
Oocyte in Vitro Maturation
Ovaries were isolated from 3-month-old female mice 46–48 h after intraperitoneal injection of 10 international units (IU) of pregnant mare's serum gonadotrophin. Ovaries were then placed in a Petri dish with prewarmed M2 medium supplemented with 2.5 μm milrinone to prevent oocytes from undergoing germinal vesicle breakdown. Cumulus oocyte complexes were recovered from ovaries by repeatedly puncturing antral follicles with a fine steel needle under the visual field of a dissecting microscope. After washing three times in M2 medium, the cumulus oocyte complexes were cultured for maturation in M16-based medium (containing 10% FBS) supplemented with or without glucose (5 mm), insulin (5 μg/ml), or leptin (10 ng/ml), respectively. All oocyte culture experiments were performed under mineral oil at 37 °C in a humidified atmosphere of 5% CO2 in air for 16 h. Cumulus cells were removed from oocytes by treatment with hyaluronidase, and the oocytes with a first polar body were used for further studies.
Statistical Analyses
Measurements at single time points were analyzed by analysis of variance or, if appropriate, by two-tailed Student's t test. Time courses were analyzed by repeated measurements analysis of variance. All data are shown as mean ± S.E. p < 0.05 was considered statistically significant.
Accession Numbers
All microarray data and deep sequencing data used in this study have been deposited in the NCBI Gene Expression Omnibus under accession number GSE40479.
RESULTS
EE-induced Maternal Weight Loss Leads to Physiological and Metabolic Changes in Offspring
Female F0 founders were first raised in a standard laboratory environment from weaning until 12 weeks of age at which point they were randomly placed into EE cages or maintained in normal cages for 4 weeks. Both control and EE mice had free access to normal diet and water. After 4 weeks of EE, female F0 founders displayed a ∼17% decrease in body weight compared with controls (Fig. 2, A–D, and supplemental Data Set S2). Accordingly, female EE F0 founders exhibited decreased WAT mass and plasma glucose, insulin, leptin, cholesterol, and triglyceride levels (Fig. 2, D and E, and supplemental Data Set S2). No changes were observed in energy intake between EE mice and controls (Fig. 2F), indicating that the reduced fat seen in EE mice was due to the increased energy expenditure. Moreover, upon GTTs and ITTs, EE mice showed improved glucose tolerance as well as enhanced insulin sensitivity compared with controls (Fig. 2, G–I).
To determine the potential effects of maternal weight loss on offspring, we mated female F0 founders of EE or control mice at 16 weeks of age with males in a standard laboratory environment (EE mothers were no longer returned to EE cages after mating) and examined physiological and metabolic changes in their offspring at 16 weeks of age. Maternal EE did not alter litter size or sex ratios. As several studies identified distinct phenotypes between sexes in offspring (15, 31), we first assessed female offspring after weaning onto a normal diet in a standard laboratory environment for up to 16 weeks of age. We found that female offspring of EE mothers exhibited a leaner phenotype accompanied by reduced weight gain and a marked reduction in WAT mass (Fig. 3, A, B, and D, and supplemental Data Set S2). Furthermore, these mice had less food intake compared with controls (Fig. 3E). Maternal EE led to a sharp decrease in leptin abundance corresponding to the reduced adipose tissue mass seen in these animals (Fig. 3C). Accordingly, serum concentrations of glucose, insulin, cholesterol, triglyceride, and free fatty acid were all significantly decreased (Fig. 3C and supplemental Data Set S2). GTT and ITT revealed significant augmentation in glucose metabolism in female offspring (Fig. 3, F–H). In addition, the homeostasis model assessment of insulin resistance index was significantly decreased in female offspring (Fig. 3I). Furthermore, regression analysis showed that the body mass index (BMI) and WAT weight in offspring were significantly positively correlated with the BMI in mothers (Fig. 3, J and K). We then examined the physiological and metabolic changes in male offspring and found that maternal EE led to changes in male offspring (Fig. 4) similar to those observed in females, indicating that maternal EE contributed equally to both sexes of offspring. These results suggest that maternal weight loss plays a potential antiobesity role in offspring.
FIGURE 3.
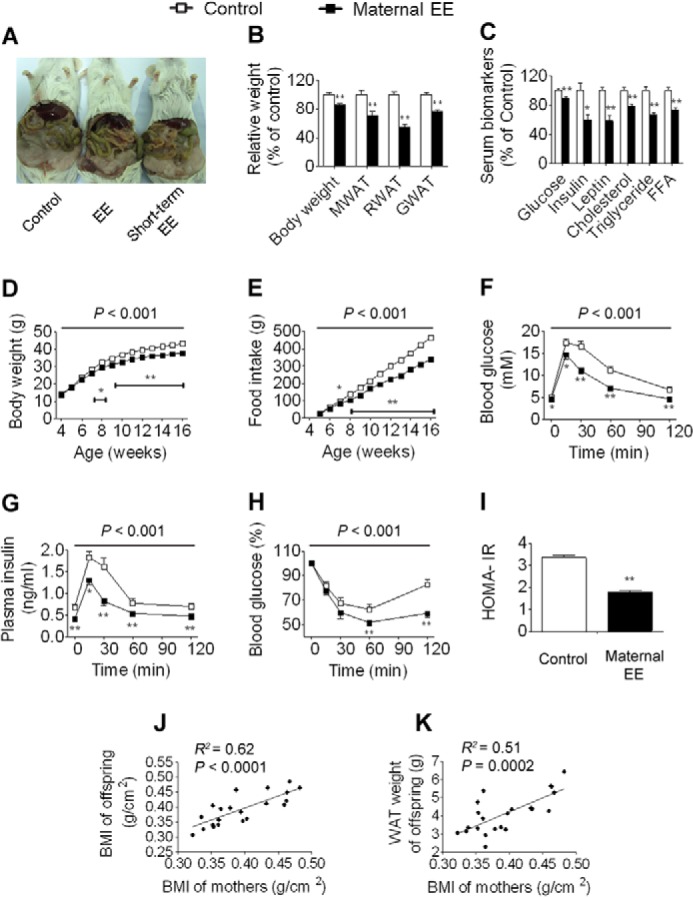
Maternal weight loss leads to physiological and metabolic changes in female offspring. A, anatomical overview of female offspring aged 16 weeks. B, body weight and weight of mesenteric WAT (MWAT), retroperitoneal WAT (RWAT), and gonadal WAT (GWAT) (control and EE, n = 10 and 12, respectively). C, serum biomarkers (n = 10 and 12, respectively). D, body weight trajectories (n = 16 and 18, respectively). E, cumulative food intake (n = 5 and 5, respectively). F, blood glucose during GTT (n = 8 and 8, respectively). G, plasma insulin during GTT (n = 8 and 8, respectively). H, blood glucose during ITT (n = 8 and 9, respectively). I, homeostasis model assessment of insulin resistance index (HOMA-IR) (n = 10 and 12, respectively). J, correlation analysis between the mother BMI and offspring BMI (n = 22). K, correlation analysis between the mother BMI and offspring WAT weight (n = 22). One offspring per mother, chosen at random, was used for each analysis. For simplicity, body weight, weight of WAT, and serum biomarkers are displayed as the percentage of control in the figure. However, detailed data are also available in supplemental Data Set S2. Data are expressed as mean ± S.E. (error bars). For single point measurements, the asterisks indicate a significant difference between groups: *, p < 0.05; **, p < 0.01 versus control. For time course measurements, p values for significance between groups are shown at the top of the panel. FFA, free fatty acid.
FIGURE 4.
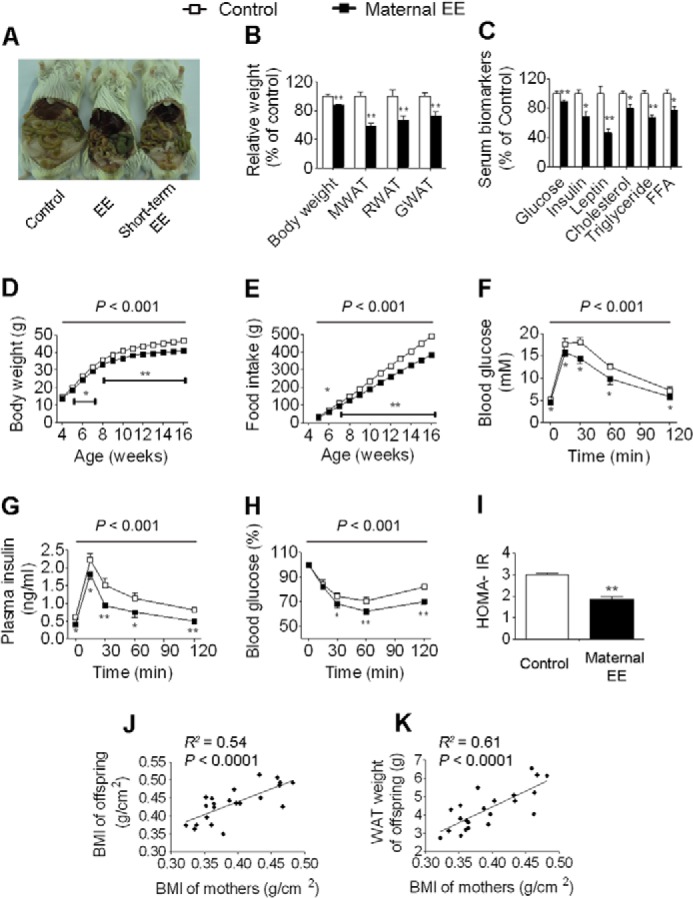
Maternal weight loss leads to physiological and metabolic changes in male offspring. A, anatomical overview of male offspring at 16 weeks of age. B, body weight and weight of WAT (control and EE, n = 10 and 12, respectively). C, serum biomarkers (n = 10 and 12, respectively). D, body weight trajectories (n = 20 and 16, respectively). E, cumulative food intake (n = 5 and 5, respectively). F, blood glucose during GTT (n = 6 and 9, respectively). G, plasma insulin during GTT (n = 6 and 9, respectively). H, blood glucose during ITT (n = 7 and 8, respectively). I, homeostasis model assessment of insulin resistance index (HOMA-IR) (n = 10 and 12, respectively). J, correlation analysis between the mother BMI and offspring BMI (n = 22). K, correlation analysis between the mother BMI and offspring WAT weight (n = 22). One offspring per mother, chosen at random, was used for each analysis. Data are expressed as mean ± S.E. (error bars). For single point measurements, the asterisks indicate a significant difference between groups: *, p < 0.05; **, p < 0.01 versus control. For time course measurements, p values for significance between groups are shown at the top of the panel. FFA, free fatty acid.
Maternal Weight Loss Alters Gene Expression Patterns in Offspring
To determine the molecular basis for the metabolic changes observed in offspring, we performed genome-wide microarray analyses. Because liver plays an important role in the metabolism and it is also the major organ responsible for the metabolism of glucose, cholesterol, and lipid, we chose liver tissues to perform the microarray analysis. Maternal weight loss altered the expression of 1,598 genes (false discovery rate < 0.05 and -fold change >2; Fig. 5A and supplemental Data Set S3) in the median lobe of liver of offspring aged 3 weeks. Functional clusters revealed that a large proportion of these genes are involved in metabolism (supplemental Data Set S3). To help better define the metabolic differences between groups, we calculated enrichments of various gene ontology terms in the differentially expressed genes. Down-regulated genes in offspring of weight loss mothers were enriched in a number of categories of genes involved in lipid and cholesterol biosynthesis, including sterol biosynthesis (p < 2 × 10⁻¹⁸), cholesterol biosynthesis (p < 8 × 10⁻¹⁶), and lipid biosynthesis (p < 7 × 10⁻¹¹; supplemental Data Set S4). Up-regulated genes were enriched for annotations such as calcium ion transport and glucose transport, which have little effect as evidenced by a high p value (p < 3 × 10⁻³ and 2 × 10⁻², respectively; supplemental Data Set S4). Kyoto Encyclopedia of Genes and Genomes pathway analysis also revealed that genes involved in steroid biosynthesis were the most enriched (p < 2 × 10⁻⁸; supplemental Data Set S4). We then focused on cholesterol and lipid biosynthetic genes to explore the correlation between hepatic gene expression and physiological changes. Interestingly, we observed coherent down-regulation of genes involved in cholesterol biosynthesis in offspring of weight loss mothers (Fig. 5B). This was confirmed by qRT-PCR, which showed a similar expression difference across 13 genes examined (Fig. 5C). Hmgcr catalyzes the first step in cholesterol biosynthesis, and its expression was decreased by ∼7-fold in offspring of weight loss mothers. A more than 6-fold decrease was also observed in nine of 15 genes involved in cholesterol biosynthesis (Fig. 5C and supplemental Data Set S3). Thus the decreased cholesterol levels were associated with changes in cholesterol biosynthetic genes.
FIGURE 5.
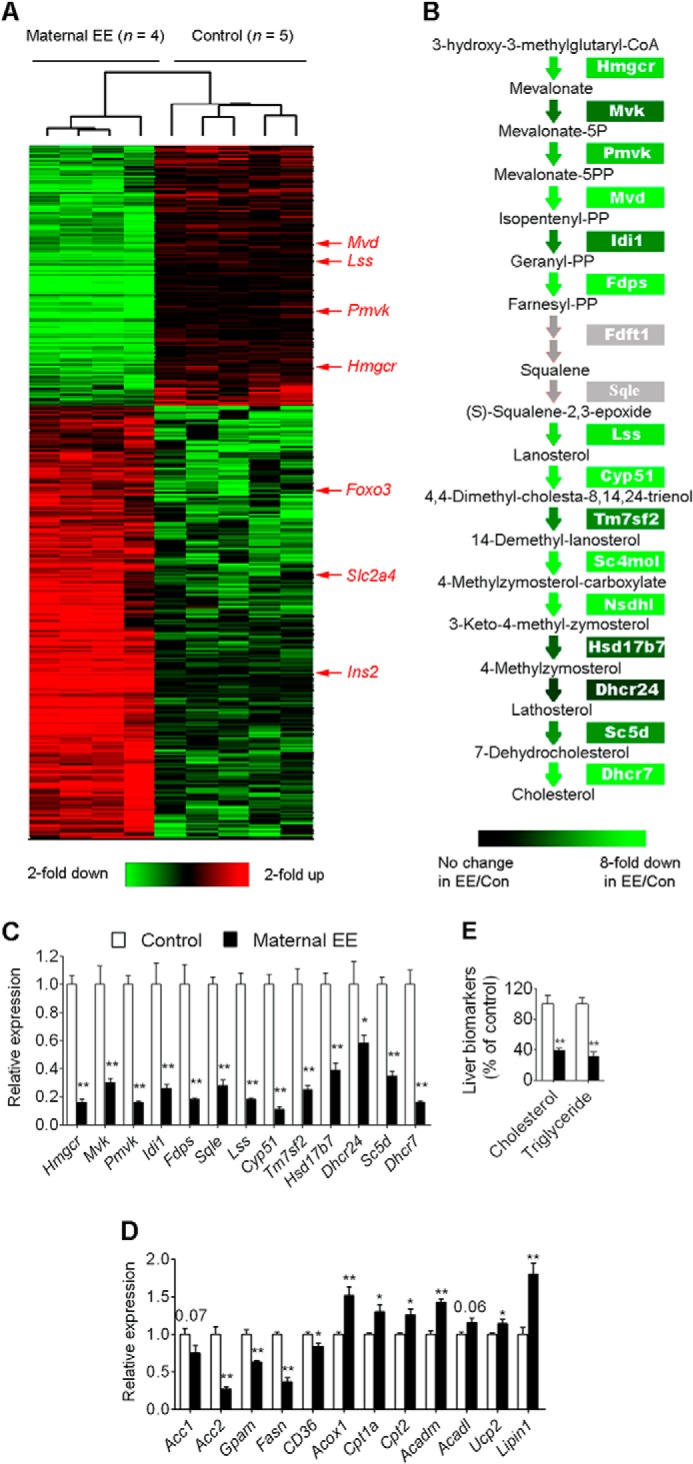
Maternal weight loss alters the expression of metabolic genes in the liver of offspring. A, hierarchical cluster of differentially expressed genes. Samples from four weight loss (left) and five control offspring (right), each from an independent mother, selected randomly were used for analysis. Red color indicates relatively up-regulated genes, and green color indicates down-regulated genes. Only genes passing the significant change (false discovery rate <0.05 and -fold change >2) are shown. B, coherent down-regulation of cholesterol biosynthesis genes with colors indicating average difference in expression in weight loss versus control comparisons. Genes without probes on microarrays (Fdft1 and Sqle) are presented as gray. C, qRT-PCR analysis confirms the decreased expression of genes involved in cholesterol biosynthesis in the liver of offspring. The same samples used in microarray analysis were used for qRT-PCR study (one offspring per mother selected randomly; n = 5, control; n = 4, weight loss). Data are expressed as mean ± S.E. (error bars). *, p < 0.05; **, p < 0.01. D, expression levels of an array of genes involved in lipid metabolism in the liver. The same samples used in microarray analysis were used for qRT-PCR study (one offspring per mother selected randomly; n = 5, control; n = 4, weight loss). Expression of these genes was measured by both microarray and qRT-PCR. For simplicity, the qRT-PCR data are presented here. However, the array data are available in the NCBI Gene Expression Omnibus under accession number GSE40479. *, p < 0.05; **, p < 0.01; or p values are shown on top of the bars. E, the levels of hepatic cholesterol and triglyceride in female offspring at 16 weeks old (one offspring per mother selected randomly; n = 10, control; n = 12, weight loss). For simplicity, only data related to females are presented here, but the data related to males are available in supplemental Data Set S2. Note that the animals used in this analysis were the same animals used in serum biomarker studies. P, phosphate; PP, pyrophosphate; Con, control.
We next assessed the expression of lipid metabolism-related genes and confirmed them by qRT-PCR. Maternal weight loss significantly suppressed lipogenic gene (including Acc1, Acc2, Gpam, and Fasn) expression in offspring (Fig. 5D). A fatty acid transporter gene (Cd36) was also significantly down-regulated (Fig. 5D). Its effects on fatty acid oxidation genes were also noted with a significant increase in the expression of Acox1, Cpt1a, Cpt2, and Acadl (Fig. 5D). Expression of Ucp2, a protein with a role in protection against oxidative damage (32), was up-regulated (Fig. 5D). Lpin1 expression reduces triglyceride release from liver, and its deficiency is associated with insulin resistance and fatty liver (33, 34). Interestingly, expression of Lpin1 was significantly increased (Fig. 5D).
To further explore the correlation between hepatic gene expression and physiology, we examined cholesterol and triglyceride levels in livers to determine whether differential expression levels of lipid metabolism-related genes were associated with changes in lipid levels. The hepatic lipid analysis showed a dramatic decrease in cholesterol and triglyceride levels in the liver of weight loss offspring (Fig. 5E and supplemental Data Set S2). Overall, these molecular findings are consistent with physiological and metabolic changes.
Maternal Weight Loss Alters the Methylation Patterns of Lipid Metabolic Genes in Offspring
Cytosine methylation is a widespread DNA modification that is critical for the regulation of gene expression and carries heritable information between generations (35–37). We then turned to genome-wide studies to search for differentially methylated loci between control and weight loss offspring. We performed MeDIP-chip to characterize cytosine methylation across all known Reference Sequence gene promoters and 15,963 annotated CpG islands. The same animals used in the microarray analysis were used for the MeDIP-chip study. Maternal weight loss altered the methylation of 2,218 promoters and 1,438 CpG islands (supplemental Data Set S5) in the liver of offspring. Kyoto Encyclopedia of Genes and Genomes pathway analysis indicated that no pathways were significantly affected in either promoter regions or CpG island-related genes as evidenced by an adjusted p value or false discovery rate markedly higher than 0.05 (supplemental Data Set S6). We then turned our attention to genes closely related to cholesterol biosynthesis and lipid metabolism to explore the correlation between hepatic gene expression and methylation changes. We found substantial increases in methylation at promoter regions of Hmgcr, Lss, and Sqle and CpG islands of Hmgcr, Idi1, Sqle, Hsd17b7, and Gpam (Fig. 6, A and B, and supplemental Data Set S5). Overall, of the 13 identified significantly down-regulated genes involved in cholesterol biosynthesis, five genes showed significantly increased methylation levels. Moreover, we also found substantial decreases in methylation at promoter regions of Cpt2 and Lpin1 (Fig. 6A) whose expression levels were significantly up-regulated. To validate the methylation data, we performed bisulfite sequencing on the promoters of Hmgcr, Lss, Sqle, and Lpin1. Pooled DNA from the same animals used for MeDIP-chip (equally from each animal) was used for analysis, and the average methylation level for each group was evaluated. The bisulfite sequencing further confirmed their methylation differences with markedly increased methylation levels of Hmgcr, Lss, and Sqle and the markedly decreased methylation level of Lpin1 (Fig. 6C). Together, these results indicate that epigenetic regulation is an upstream event that could drive a substantial fraction of the observed expression changes in offspring.
FIGURE 6.
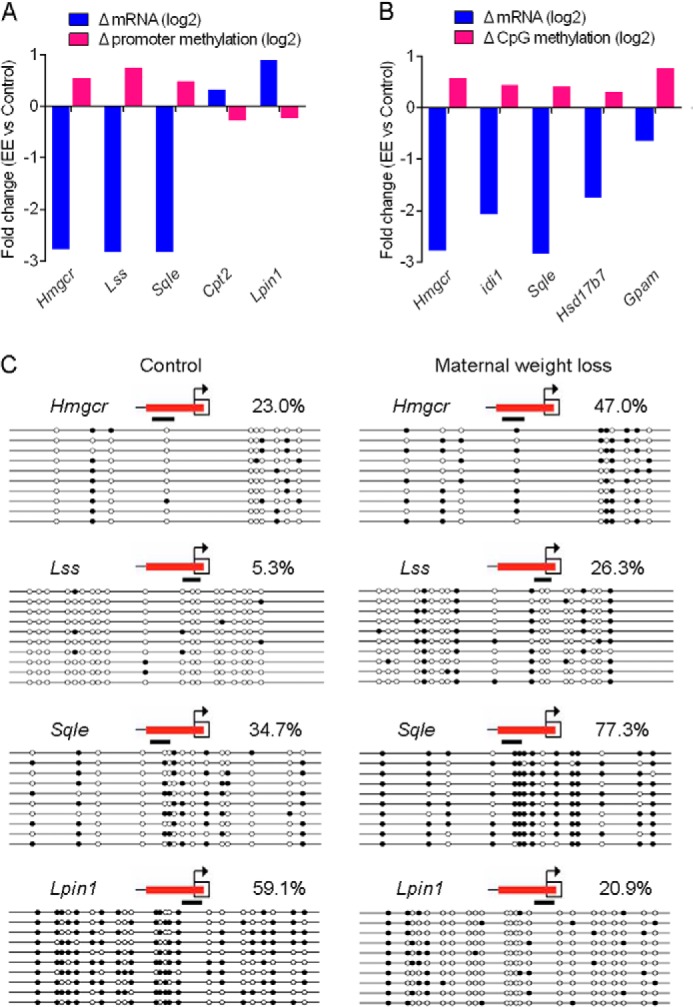
Maternal weight loss alters the methylation patterns of metabolic genes in offspring. A, gene expression changes are anti-correlated with promoter methylation changes in the indicated genes. For each gene, the average change in mRNA abundance is compared with the change in promoter methylation. Changes in mRNA levels or methylation levels between groups are shown as log2. B, gene expression changes are anti-correlated with CpG island methylation changes in the indicated genes. For each gene, the average change in mRNA abundance is compared with the change in promoter methylation. Changes in mRNA levels or methylation levels between groups are shown as log2. C, bisulfite sequencing for promoters of the indicated genes. Pooled DNA from the same animals used for MeDIP-chip (equally from each animal) was used for analysis. For each gene in each group, 10 clones randomly selected were analyzed and represent the average methylation level for the indicated genes. The red line indicates the region covered by the oligonucleotides on the microarray. The black line indicates the region amplified for bisulfite sequencing. White circles represent unmethylated CpGs, and black circles represent methylated CpGs. The percentage of CpG methylation is indicated for each promoter.
Short Term EE Does Not Have an Effect Similar to Standard EE
In humans, because women oftentimes desire fast weight loss, we next asked what effects a short term EE has on mothers and offspring. A short term EE (2 weeks of EE) led to physiological and metabolic changes similar (but somewhat weaker) to those observed in standard EE in mothers (Figs. 2B and 7, A and B, and supplemental Data Set S2). We expected that a short term EE has a similar effect on offspring. The results were quite unexpected. Short term EE led to lower body weight and reduced fat in mesenteric WAT and retroperitoneal WAT in offspring similar to that observed in the EE mice, but the gonadal WAT in offspring was largely unaffected in contrast to the significant decrease in the EE mice (Fig. 7C and supplemental Data Set S2). Although short term EE also showed altered serum biomarkers in offspring, the pattern was quite distinct from that of standard EE mice. In offspring of short term EE, glucose, insulin, and leptin were significantly reduced similar to that of EE mice (Fig. 7D and supplemental Data Set S2). However, cholesterol and triglyceride were unchanged in contrast to the significant decrease in the offspring of EE mice (Fig. 7D and supplemental Data Set S2). The hepatic concentrations of cholesterol and triglyceride were unchanged in the short term EE offspring (Fig. 7E and supplemental Data Set S2). Moreover, of the identified 13 significantly decreased cholesterol biosynthetic genes in offspring of EE mice, only three were also significantly decreased in offspring of short term EE mice. Similarly, of the identified 12 differentially expressed lipid metabolism-associated genes in offspring of EE mice, only four were also induced in offspring of short term EE mice (Fig. 7, F and G). Given the similar physiological and metabolic conditions mothers provided in short term EE and standard EE, if the metabolic and molecular changes in offspring are affected by the uterine environment, they should have a similar pattern in both environments. Therefore, the uterine environment alone is insufficient to explain EE-induced metabolic changes in offspring.
FIGURE 7.
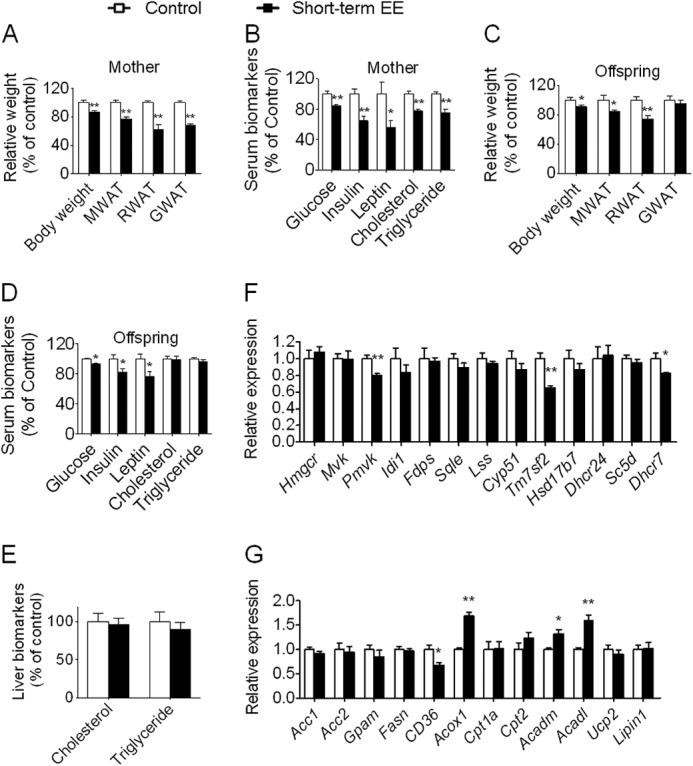
Short term EE leads to metabolic and gene expression changes in offspring with a pattern quite distinct from that of standard EE. A, body weight and weight of WAT in mothers (control and short term EE, n = 10 and 9, respectively). B, serum biomarkers in mothers (n = 10 and 9, respectively). C, body weight and weight of WAT in female offspring (n = 8 and 9, respectively). For simplicity, for C–E, only female offspring are presented here, but the data related to males are available in supplemental Data Set S2. D, serum biomarkers in female offspring (n = 8 and 9, respectively). E, the levels of hepatic triglyceride and cholesterol in female offspring (n = 8 and 9, respectively). F, a quite distinct expression pattern of genes involved in cholesterol biosynthesis in the liver of short term EE offspring (n = 8 and 9, respectively). G, a quite distinct expression pattern of genes involved in lipid metabolism in the liver of short term EE offspring (n = 8 and 9, respectively). It should be noted that short term EE has its age-matched (14 weeks) unique control. Data are expressed as mean ± S.E. (error bars). *, p < 0.05; **, p < 0.01 versus control. MWAT, mesenteric WAT; RWAT, retroperitoneal WAT; GWAT, gonadal WAT.
Embryo Transfer Reveals the Important Role of the Oocyte
The most distinctive difference between standard EE and short term EE is that the latter accumulates fewer effects on oocytes because formation of a mature oocyte involves a series of epigenetic events and needs a certain amount of time. Furthermore, although the effect of the maternal uterine environment on the metabolism of offspring has been widely accepted, increasing evidence suggests that maternal physiological and metabolic changes can lead to oocyte alterations (38, 39). These facts raise the possibility that maternal metabolic changes may affect oocytes and thereby offspring. To determine whether oocyte alteration in response to maternal metabolic conditions contributes to certain phenotypic changes in offspring, we performed embryo transplantation experiments. We transplanted weight loss or control fertilized eggs into oviducts of foster mothers, respectively. Offspring were delivered and raised on a normal diet after weaning in a standard laboratory environment until 16 weeks of age. No differences were observed in litter size or sex ratios between weight loss and control groups after embryo transfer. We first assessed physiological and metabolic changes after embryo transfer. Analysis of the offspring revealed that, although body weight and weight of mesenteric WAT were largely unaffected, the weights of retroperitoneal WAT and gonadal WAT were significantly reduced (Fig. 8A and supplemental Data Set S2). Among the serum biomarkers examined, glucose and insulin were largely unaffected, whereas leptin, cholesterol, triglyceride, and free fatty acid were significantly decreased (Fig. 8B and supplemental Data Set S2). Meanwhile, the hepatic levels of cholesterol and triglyceride exhibited a dramatic decrease (Fig. 8C and supplemental Data Set S2). In addition, GTT and ITT revealed significantly improved glucose tolerance and enhanced insulin sensitivity (Fig. 8, D and E). We then assessed molecular changes in the offspring after embryo transfer. Because the cholesterol and triglyceride levels were significantly decreased in both plasma and liver, we focused on cholesterol biosynthesis and lipid metabolism-associated genes. Of particular interest, analysis of the liver of offspring after embryo transfer revealed that the cholesterol biosynthetic genes exhibited an expression pattern similar to that of naturally fertilized animals (Fig. 8F). Of the identified 13 significantly decreased cholesterol biosynthetic genes in offspring derived from natural fertilization, 10 were also significantly down-regulated to a comparable level after embryo transfer (Fig. 8F). Meanwhile, analysis of the lipid metabolism-associated genes revealed that of the identified 12 differentially expressed lipid metabolism-associated genes in offspring derived from natural fertilization seven were also induced in offspring after embryo transfer (Fig. 8G). Moreover, Hmgcr, Lss, Sqle, and Lpin1, all of which were differentially methylated in the liver of offspring of weight loss mothers, exhibited a similar cytosine methylation pattern after embryo transfer (Figs. 9, A and B, and 10, A and B). Together, these results indicate that oocyte alterations in response to maternal metabolic conditions contribute to certain phenotypic changes in offspring.
FIGURE 8.
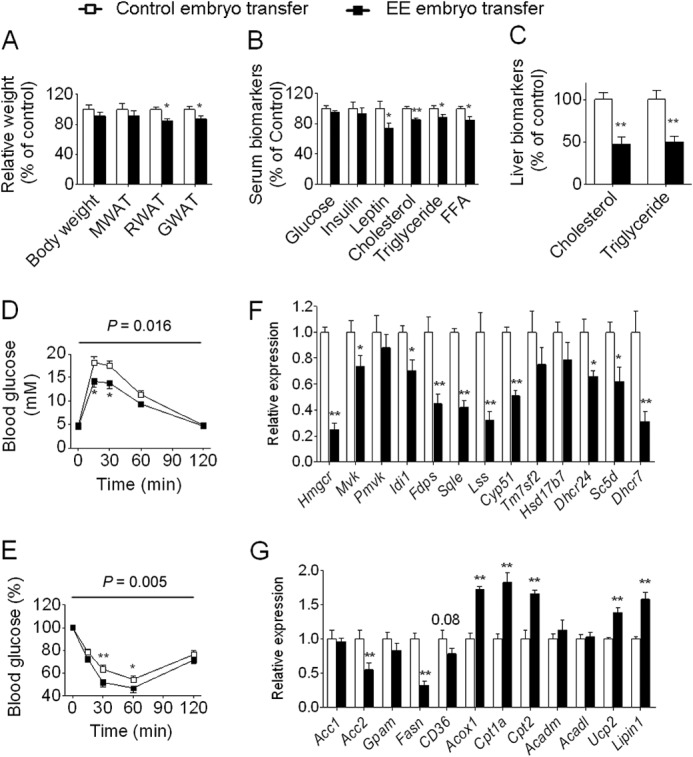
Metabolic and gene expression changes in offspring derived from embryo transfer. A, body weight and weight of WAT (control and EE, n = 8 and 8, respectively). For simplicity, for A–C, only female offspring are presented here, but the data related to males are available in supplemental Data Set S2. B, serum biomarkers (n = 8 and 8, respectively). C, the levels of hepatic triglyceride and cholesterol (n = 8 and 8, respectively). D, blood glucose during GTT (n = 6 and 8, respectively). E, blood glucose during ITT (n = 8 and 7, respectively). F, expression of genes involved in cholesterol biosynthesis in the liver of offspring at 3 weeks of age (n = 6 and 6, respectively). G, expression of genes involved in lipid metabolism in the liver of offspring at 3 weeks of age (n = 6 and 6, respectively). Data are expressed as mean ± S.E. (error bars). For single point measurements, the asterisks indicate a significant difference between groups: *, p < 0.05; **, p < 0.01 versus control. For time course measurements, p values for significance between groups are shown at the top of the panel. FFA, free fatty acid; MWAT, mesenteric WAT; RWAT, retroperitoneal WAT; GWAT, gonadal WAT.
FIGURE 9.

Inheritance of DNA methylation from oocytes. A and B, bisulfite sequencing of Hmgcr (A) and Lpin1 (B) in oocytes, E3.5 blastocysts, and day 21 liver tissues shows partial inheritance of DNA methylation from oocytes. For oocytes, bisulfite treatment was performed on 48 pooled oocytes derived from six animals (eight oocytes randomly selected from each animal) for each group. For E3.5 blastocysts, bisulfite treatment was performed on 18 pooled blastocysts derived from three animals (six blastocysts randomly selected from each animal) for each group. For day 21 livers, pooled DNA of three animals (randomly selected and equally from each animal) for each group was used for analysis. For each gene in each group, ∼15 clones randomly selected were analyzed and represent the average methylation level for the indicated genes. Genes are shown above the graphs. White circles represent unmethylated CpGs, and black circles represent methylated CpGs. Values in each bisulfite grouping indicate the percentage of CpG methylation.
FIGURE 10.

Effects of maternal weight loss on methylation of Lss and Sqle. A, bisulfite sequencing of Lss in oocytes, E3.5 blastocysts, and day 21 liver tissues shows partial inheritance of DNA methylation from oocytes. B, bisulfite sequencing of Sqle in oocytes and E3.5 blastocysts shows no change of DNA methylation between control and maternal EE groups. But changes were observed in day 21 liver tissues, indicating that the differential methylation status observed in offspring is established at some point during development. For oocytes, bisulfite treatment was performed on 48 pooled oocytes derived from six animals (eight oocytes randomly selected from each animal) for each group. For E3.5 blastocysts, bisulfite treatment was performed on 18 pooled blastocysts derived from three animals (six blastocysts randomly selected from each animal) for each group. For day 21 livers, pooled DNA of three animals (randomly selected and equally from each animal) for each group was used for analysis. For each gene in each group, ∼15 clones randomly selected were analyzed and represent the average methylation level for the indicated genes. Genes are shown above the graphs. White circles represent unmethylated CpGs, and black circles represent methylated CpGs. Values in each bisulfite grouping indicate the percentage of CpG methylation.
Inheritance of DNA Methylation from Oocytes
The link between maternal metabolic conditions and offspring methylation patterns after embryo transfer led us to consider the hypothesis that maternal weight loss affects cytosine methylation patterns in oocytes. We therefore isolated DNA from naturally ovulated mature oocytes (MII stage) from control or weight loss mothers. We assayed the Hmgcr, Lss, Sqle, and Lpin1 promoters for methylation by bisulfite sequencing. Importantly, we found a substantial increase in methylation at the promoter regions of Hmgcr and Lss in oocytes from weight loss mothers (Figs. 9A and 10A) found to be hypermethylated in livers of weight loss offspring. We also found a substantial decrease in methylation at the promoter region of Lpin1 in oocytes from weight loss mothers (Fig. 9B). In contrast, methylation of Sqle was unaltered between control and weight loss oocytes (Fig. 10B), indicating that differential methylation at this locus observed in livers is established at some point during development. To test whether genes differentially methylated are de novo methylated or potentially inherit DNA methylation from oocytes, we performed bisulfite sequencing on E3.5 blastocysts after embryo transfer of fertilized eggs. Both Hmgcr and Lss showed higher methylation levels in weight loss samples compared with controls (Figs. 9A and 10A), and Lpin1 showed lower methylation levels in weight loss samples compared with controls (Fig. 9B), suggesting that these genes partially inherit methylated alleles from oocytes. Together, these results indicate that for certain genes or regions the cytosine methylation status in oocytes is strongly predisposed toward methylation in blastocysts perhaps by incomplete postfertilization demethylation of methylated cytosines.
Maternal Weight Loss Alters Overall Transcriptional Patterns in Mature Oocytes
RNA is another potential epigenetic information carrier that plays an important role in transmitting heritable information between generations (40–42). To globally investigate effects of maternal weight loss on oocyte RNA transcription, we surveyed transcriptional patterns across the entire transcriptome via mRNA-Seq. Pooled naturally ovulated mature oocytes (MII stage) from three control and three weight loss female F0 founders (three oocytes randomly selected for each animal and a total of nine oocytes for each group) were used for analysis. We identified ∼800 differentially expressed genes in mature oocytes from weight loss compared with control groups (supplemental Data Set S7). Interestingly, weight loss oocytes consistently exhibited decreased expression of cholesterol and lipid metabolism-associated genes (Apoe, Insig1, Cd36, Elovl1, Gnpat, Acoxl, Plcb3, and Aldh5a1; Fig. 11A and supplemental Data Set S7). We also observed down-regulation of a number of glucose catabolic genes such as Pdha1 and Gpd2 (Fig. 11A and supplemental Data Set S7). Moreover, a number of transcription factors (Mapk3, Gtf3a, Fus, and Tlr3) and chromatin regulators (Carm1, Men1, Epc2, and Hdac4) were also differentially expressed (Fig. 11A and supplemental Data Set S7). Whether this reflects inheritable information is presently unknown, although we confirmed expression of these genes by qRT-PCR (Fig. 11A). To better define the alterations, we quantified the transcript levels of representative genes important for lipid biosynthesis (Apoe), transcription regulation (Mapk3), and chromatin modification (Hdac4 and Carm1) in an additional six weight loss and five control animals that were not included in the mRNA-Seq study. Importantly, we observed reproducible lower levels of Apoe and Hdac4 and higher levels of Mapk3 and Carm1 in independent weight loss mothers (Fig. 11, B–E). Moreover, short term EE led to fewer changes compared with standard EE (Fig. 11, B–E), indicating that in short term EE fewer effects on oocytes are accumulated, which may be the reason for the phenotypic differences seen in their offspring. Together, these results indicate that oocyte RNA transcription can be regulated by maternal metabolic conditions and may represent environmental information participating in early steps of development and thereby affecting offspring. However, the molecular mechanism for these observations is still unclear.
FIGURE 11.

Maternal weight loss alters overall transcriptional patterns in mature oocytes. A, quantitation and validation of the expression for the indicated genes. qRT-PCR was performed for the indicated genes, and weight loss/control ratios are shown as log2. The same samples used for mRNA-Seq were used for the qRT-PCR study. Each analysis was repeated in triplicate, and the S.E. is shown as error bars. B–E, expression of Apoe (B), Mapk3 (C), Hdac4 (D), and Carm1 (E) in oocytes from an additional six standard EE, six short term EE, and five control animals that were not included in the mRNA-Seq study. Each bar represents an independent mouse. For each mouse, three to five pooled mature oocytes were used for qRT-PCR analysis. Each sample was analyzed in triplicate, and the S.E. is shown as error bars. The dotted line represents the threshold value for gene expression of -fold change more than twice the normal level.
Effects of Maternal Weight Loss on Metabolic and Molecular Changes in the F2 Generation
In our study, the offspring (F1 generation) derived from weight loss mothers (F0 generation) lived in standard laboratory housing and exhibited a leaner phenotype (as shown in Fig. 3). We then asked whether the beneficial metabolic and molecular changes in the offspring (F1 generation) can be passed to the next generation (F2 generation). We mated the female F1 generation of weight loss or control mice with normal males and examined metabolic, transcriptional, and epigenetic changes in their offspring. We first assessed physiological and metabolic changes in the F2 generation at 16 weeks of age and found that the F2 generation also exhibited reduced body weight; decreased WAT; decreased serum concentrations of glucose, insulin, cholesterol, triglyceride, and free fatty acid; and decreased liver concentrations of cholesterol and triglyceride as seen in the F1 generation (Fig. 12, A–C, and supplemental Data Set S2). We then assessed how weight loss in the F1 generation females causes molecular changes in their offspring. We randomly selected six cholesterol biosynthetic genes and six lipid metabolism-related genes that were significantly affected by maternal weight loss from the gene expression data. qRT-PCR analysis showed that all of these genes exhibited a similar expression pattern compared with the F1 generation (Fig. 12, D and E). Moreover, we examined the methylation status of Hmgcr, Lss, Sqle, and Lpin1 (whose methylation status was significantly altered by maternal weight loss) in the liver of the F2 generation by bisulfite sequencing and found a similar methylation status compared with the F1 generation (Fig. 12F). Together, these results indicate that the beneficial effects and epigenetic marks induced by maternal weight loss can be inherited for at least two generations. Because all F1 generation animals lived in standard laboratory housing, the observed metabolic and molecular changes in the F2 generation are independent of enriched environment-mediated and other environmental factors. Therefore, the beneficial effects seen in offspring are most likely due to the weight loss-associated physiological and metabolic conditions in mothers.
FIGURE 12.
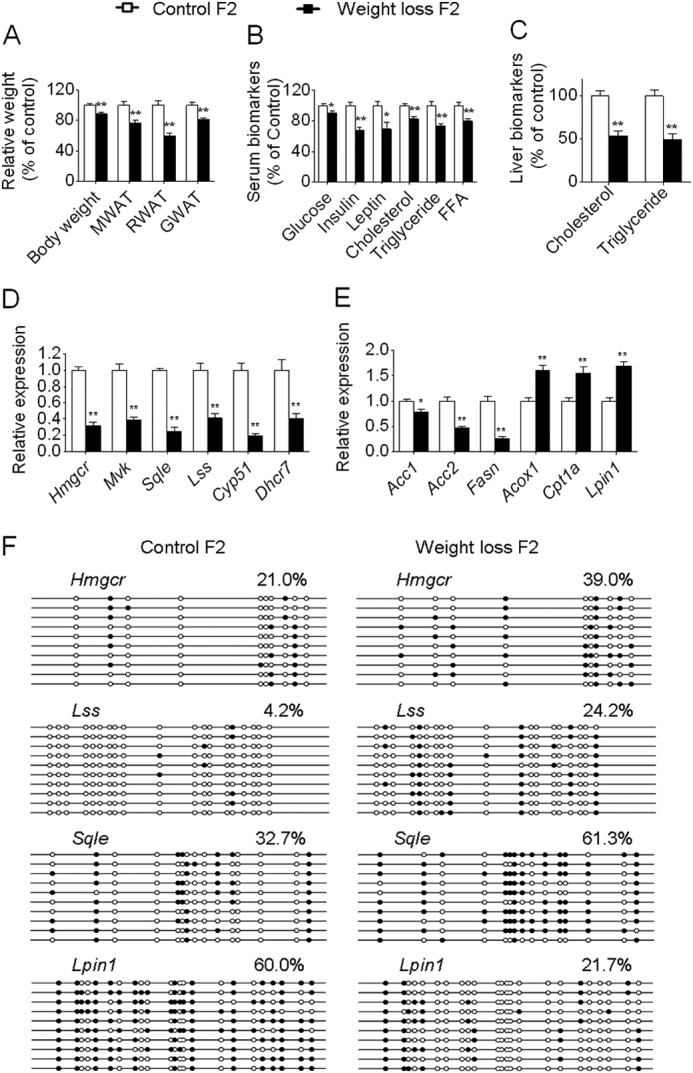
Effects of maternal weight loss on metabolic and molecular changes in the F2 generation. A, body weight and weight of WAT in female offspring (control and EE, n = 8 and 10, respectively). For simplicity, for A–C, only female offspring are presented, but the data related to males are available in supplemental Data Set S2. B, serum biomarkers (n = 8 and 10, respectively). C, levels of hepatic triglyceride and cholesterol (n = 8 and 10, respectively). D and E, qRT-PCR for the expression levels of the randomly selected six cholesterol biosynthetic genes (D) and six lipid metabolism-related genes (E) that were significantly affected by maternal weight loss in the liver (n = 8 and 10, respectively). F, bisulfite sequencing for the methylation status of the indicated genes in the liver of the F2 generation. Pooled DNA from three animals randomly selected for each group (equal amounts from each animal) was used for analysis. For each gene in each group, 10 clones randomly selected were analyzed and represent the average methylation level for the indicated genes. White circles represent unmethylated CpGs, and black circles represent methylated CpGs. Values in each bisulfite grouping indicate the percentage of CpG methylation. One offspring per mother, chosen at random, was used for each analysis. Data are expressed as mean ± S.E. (error bars). *, p < 0.05; **, p < 0.01. MWAT, mesenteric WAT; RWAT, retroperitoneal WAT; GWAT, gonadal WAT.
DISCUSSION
In the present study, we have shown that maternal weight loss improves general health, metabolic parameters, and gene expression profiles in offspring. Independent of in utero exposure, our results reveal that oocyte alteration in response to environmental conditions is a strong factor in determining metabolic changes in offspring. Overall, our study reveals a molecular and mechanistic basis of how maternal lifestyle modification affects metabolic changes in the offspring.
Obesity induces a variety of metabolic disorders such as diabetes and fatty liver disease. In contrast, weight loss ameliorates obesity-induced disorders by enhancement of numerous parameters, including decreased plasma glucose, insulin, leptin, cholesterol, and triglyceride levels. The reduced fasting glucose and insulin levels indicate improved glucose metabolism, which would play an important role in decreasing the risk of susceptibility to diabetes. Leptin is a hormone released from adipocytes that acts in the brain. It plays a critical role in energy homeostasis (43). The reduced food intake observed in the weight loss offspring is potentially due to the decreased leptin concentrations. High levels of serum triglycerides have been associated with atherosclerosis and fatty liver (44). Weight loss can significantly decrease the serum lipid levels and thus can ameliorate these obesity-related disorders. Moreover, our results suggest that not only are these beneficial effects present in the F0 generation but also in at least subsequent two generations, indicating that the mother can initiate intergenerational transmission of weight loss and its related advantages.
Our results clearly identified certain physiological pathways whose expression is sensitive to maternal weight loss. Specifically, we found that hepatic expression of genes involved in lipid and cholesterol biosynthesis can be regulated by maternal weight loss, and these molecular changes are correlated with physiological and metabolic changes in individuals. The reprogrammed gene expression state is most likely affected by epigenetic modifications. Our epigenomic profiling of offspring livers revealed numerous changes in cytosine methylation depending on maternal weight loss, including reproducible changes in promoter or CpG island methylation over several key lipid and cholesterol biosynthesis genes. Notably, of the 13 identified significantly down-regulated genes involved in cholesterol biosynthesis, we found that five genes (Hmgcr, Lss, Sqle, Idi1, and Hsd17b7) showed significantly increased methylation levels, leading to the hypothesis that epigenetic regulation is an upstream event that affects the entire gene expression status. However, changes in promoter or CpG island methylation did not globally correlate with changes in gene expression, indicating that gene expression is unlikely to be epigenetically specified at each individual gene. In fact, gene expression is regulated by a complicated network, which involves upstream and downstream factors and other regulators, and widespread expression differences can be caused by small numbers of upstream regulators (45, 46). Moreover, although we focused on the effect of cytosine methylation, which is critical for the regulation of gene expression, we cannot neglect other important epigenetic regulations, including histone modification, chromatin remodeling, non-coding RNA regulation, and others. Further analyses of the epigenetic modifications mentioned above will enhance our understanding of the transcriptional regulation affected by maternal lifestyle changes.
How maternal weight loss affects oocyte epigenomes is an intriguing question. As the oocyte matures, it accumulates epigenetic marks on both DNA and histone until the final phase of maturation before ovulation (47). The follicular fluid surrounding the oocyte varies according to maternal physiological and metabolic conditions (48), providing a unique microenvironment that reflects the outside world (Fig. 13). In responding to these environmental signals, the oocyte epigenome exhibits a moderate degree of plasticity (49, 50). In females, increased BMI has been demonstrated to be correlated with elevated glucose, insulin, leptin, triglycerides, and inflammatory biomarkers in follicular fluid (48). Corresponding with this, the receptors of glucose, insulin, and leptin have been identified in oocytes (51–53). It is conceivable that the environmental signals enter the oocyte and further affect the epigenome of the oocyte (Fig. 13).
FIGURE 13.
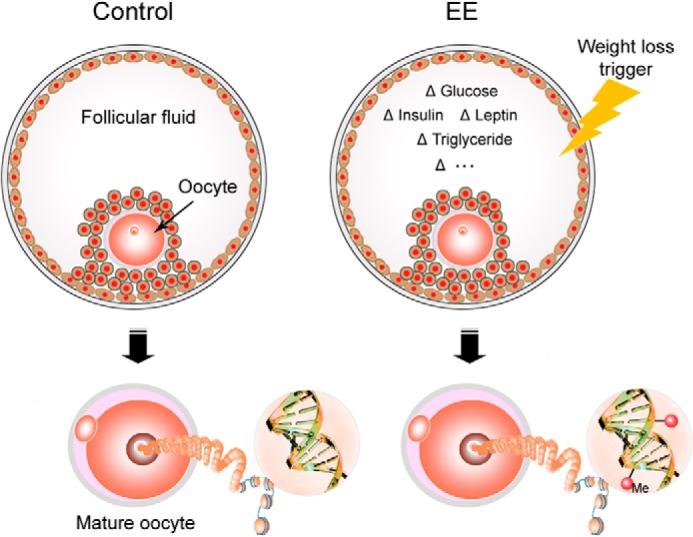
Potential mechanism of weight loss-induced epigenomic changes in oocytes. Developing oocytes are suspended in follicular fluid, which provides a unique nutritional microenvironment that represents maternal metabolic states, for example lipid and biomarkers. During oocyte maturation, its epigenetic marks are established until the final phase of maturation before ovulation. Environmental signals, which vary according to maternal metabolic conditions, may enter the oocyte and result in epigenomic alterations in oocytes.
During oocyte maturation, the de novo DNA methyltransferases Dnmt3a and Dnmt3l are necessary for the establishment of DNA methylation (54, 55). We asked whether the expression of Dnmt3a and Dnmt3l are affected by maternal weight loss. The oocyte mRNA-Seq data showed that Dnmt3a exhibited a slightly decreased expression level in weight loss oocytes with expression at 81.9% when compared with the control (supplemental Data Set S7), whereas Dnmt3l showed a moderately increased expression level with expression being 1.63 times that of the control (supplemental Data Set S7). In an additional experiment, we confirmed the mRNA-Seq results by qRT-PCR, which showed a similar expression difference between groups in both genes normalized to the housekeeping gene β-actin (Fig. 14A). Although the expression change is less than 2-fold, it should be noted that a slight perturbation for key genes during critical developmental stages may have important effects. However, the biological implications for these observations are presently unknown. We next asked whether the expression of Dnmt3a and Dnmt3l is affected by environmental signal differences that potentially exist in follicular fluid due to maternal metabolic variations. In an additional experiment, we determined the expression levels of Dnmt3a and Dnmt3l in oocytes after introduction of glucose, insulin, or leptin into the in vitro maturation culture system, respectively. The qRT-PCR results showed that glucose supplementation (5 mm) induced a significantly increased expression of Dnmt3a but with no alterations of expression of Dnmt3l (Fig. 14B). Insulin supplementation (5 μg/ml) led to no significant difference in the expression of both Dnmt3a and Dnmt3l (Fig. 14C). The presence of leptin (10 ng/ml) resulted in no alteration in Dnmt3a but a significant decrease in the expression of Dnmt3l (Fig. 14D). These results suggest that the environmental signals potentially affect the expression of Dnmt3a and Dnmt3l, which may further influence the epigenomic modification of oocytes. However, it is difficult to definitively demonstrate the causal relationships between the environmental and epigenetic changes because of the complexity of the environmental factors and the numerous epigenetic alterations in the vast genome. Moreover, previous work suggests that regional methylation levels can be secondary consequences of alterations in DNA-binding factors or histone modifications (55, 56). Thus it is possible that the differential methylation observed in our study is secondary to these upstream events. Further studies are required to completely clarify this issue.
FIGURE 14.

Effects of different supplementations during in vitro oocyte maturation on the expression of Dnmt3a and Dnmt3l. A, to validate the RNA-Seq data, quantitative RT-PCR was performed on Dnmt3a and Dnmt3l relative to the housekeeping gene β-actin, which showed a similar expression difference between groups compared with the RNA-Seq data. B, effects of glucose supplementation on the expression of Dnmt3a and Dnmt3l. C, effects of insulin supplementation on the expression of Dnmt3a and Dnmt3l. D, effects of leptin supplementation on the expression of Dnmt3a and Dnmt3l. Each experiment was repeated in triplicate. Data are expressed as mean ± S.E. (error bars). The dotted line (set as 1) represents the average of expression levels of each gene from controls. *, p < 0.05.
Maternal lifestyle could potentially affect the offspring's metabolism via a number of different mechanisms. For instance, in mice, high fat intake during pregnancy increases metabolic syndromes in several generations of offspring (57), and maternal postpartum behavior can influence multiple aspects of neurobiology and behavior in offspring (58). Here we focused on the hypothesis that environmental information does reside in oocyte epigenetic information carriers to control the offspring's phenotype (49). First, decreased ovarian temperature resulting from less fat accumulation and lower concentrations of serum biomarkers may affect DNA reprogramming and RNA transcription of the gamete (59, 60). Second, several studies reported that RNA molecules in gametes can affect the offspring phenotype (40, 41), and our transcriptome analysis found numerous differentially expressed genes in oocytes of weight loss mothers. Third, a subset of epigenetic modifications in gametes is known to be heritable (35, 36, 61–63), and we observed that a number of chromatin regulators tend to be differentially expressed in oocytes of weight loss mothers. Moreover, our methylation analysis also found that several genes tend to be differentially methylated in oocytes of weight loss mothers. Specifically, we observed that certain genes (such as Hmgcr, Lss, and Lpin1) can partially resist global demethylation postfertilization and largely inherit cytosine methylation from oocytes, further suggesting that there is intergenerational transmission of cytosine methylation at a substantial fraction of the genome. These results extend findings of researchers from a previous study (64) that identified some non-imprinted sequences that resist demethylation in preimplantation embryo development. Together with previous work showing that histone modification can also be transmitted from gametes to embryos (62, 65), this indicates that epigenetic information linked to environmental factors participates in early steps of development and thereby affects offspring.
For mammalian studies, transgenerational epigenetic inheritance is broadly used to describe the non-sequence-based effects that can be inherited from one generation to the next. However, it is important to distinguish the descriptive transgenerational effects from the truly transgenerational effects. When the F0 gestational female is exposed to the environment, both the F1 embryo and its germ line (which will produce the F2 generation) are exposed. Therefore, phenotypes from F1 and F2 may result from gestational environmental exposure, and only the F3 and later generations can be considered as truly transgenerational effects. Our embryo transfer studies indicate that maternal weight loss-associated metabolic changes affect epigenomics in oocytes and can be potentially transmitted to offspring. Because the F2 generation also exhibited significant metabolic differences, it would be expected that the epigenetic alterations still exist in oocytes of F2 females and would be potentially transmitted to the F3 generation. Further assessment on the F3 generation will be required to clarify this issue.
Together, we have shown that maternal weight loss reprograms metabolic gene expression and improves metabolic parameters in offspring and that oocyte alteration in response to maternal physiological and metabolic conditions might be a strong candidate contributor. Environmentally induced maternal metabolic changes affect epigenetic marks and can be inherited for at least two generations. These findings may have implications in explaining the prevalence of obesity, type 2 diabetes, and other chronic metabolic disease. This may also imply that in the near future epigenetic factors that are potentially heritable should be regarded as important in determining the risk of certain diseases. Epigenetic problems may be effectively solved by environmental protocols, and our present findings imply that maternal weight loss may be considered as a potential strategy to reverse prevalent obesity and related metabolic syndromes.
Acknowledgments
We thank Qing-Hua Zhang at the State Key Laboratory of Reproductive Biology for assistance with photo collections. We thank KangChen Bio-tech (Shanghai, China) for help with microarray experiments and the Beijing Genomics Institute for help with RNA sequencing.
This work was supported by National Natural Science Foundation of China Grant 3147055 and National Basic Research Program of China Grants 2012CB944404 and 2011CB944501.

This article contains supplemental Data Sets S1–S7.
- EE
- enriched environment
- WAT
- white adipose tissue
- GTT
- glucose tolerance test
- ITT
- insulin tolerance test
- qRT-PCR
- quantitative real time PCR
- MeDIP
- methylated DNA immunoprecipitation
- Seq
- sequencing
- BMI
- body mass index
- E
- embryonic day.
REFERENCES
- 1. Batsis J. A., Nieto-Martinez R. E., Lopez-Jimenez F. (2007) Metabolic syndrome: from global epidemiology to individualized medicine. Clin. Pharmacol. Ther. 82, 509–524 [DOI] [PubMed] [Google Scholar]
- 2. Wang Y., Lobstein T. (2006) Worldwide trends in childhood overweight and obesity. Int. J. Pediatr. Obes. 1, 11–25 [DOI] [PubMed] [Google Scholar]
- 3. Pinhas-Hamiel O., Zeitler P. (2005) The global spread of type 2 diabetes mellitus in children and adolescents. J. Pediatr. 146, 693–700 [DOI] [PubMed] [Google Scholar]
- 4. Whitaker R. C., Wright J. A., Pepe M. S., Seidel K. D., Dietz W. H. (1997) Predicting obesity in young adulthood from childhood and parental obesity. N. Engl. J. Med. 337, 869–873 [DOI] [PubMed] [Google Scholar]
- 5. Mühlhäusler B. S. (2007) Programming of the appetite-regulating neural network: a link between maternal overnutrition and the programming of obesity? J. Neuroendocrinol. 19, 67–72 [DOI] [PubMed] [Google Scholar]
- 6. Bouchard C. (2009) Childhood obesity: are genetic differences involved? Am. J. Clin. Nutr. 89, 1494S–1501S [DOI] [PMC free article] [PubMed] [Google Scholar]
- 7. Guo Y. F., Shen H., Liu Y. J., Wang W., Xiong D. H., Xiao P., Liu Y. Z., Zhao L. J., Recker R. R., Deng H. W. (2006) Assessment of genetic linkage and parent-of-origin effects on obesity. J. Clin. Endocrinol. Metab. 91, 4001–4005 [DOI] [PubMed] [Google Scholar]
- 8. Li L., Law C., Lo Conte R., Power C. (2009) Intergenerational influences on childhood body mass index: the effect of parental body mass index trajectories. Am. J. Clin. Nutr. 89, 551–557 [DOI] [PubMed] [Google Scholar]
- 9. Gluckman P. D., Hanson M. A., Bateson P., Beedle A. S., Law C. M., Bhutta Z. A., Anokhin K. V., Bougnères P., Chandak G. R., Dasgupta P., Smith G. D., Ellison P. T., Forrester T. E., Gilbert S. F., Jablonka E., Kaplan H., Prentice A. M., Simpson S. J., Uauy R., West-Eberhard M. J. (2009) Towards a new developmental synthesis: adaptive developmental plasticity and human disease. Lancet 373, 1654–1657 [DOI] [PubMed] [Google Scholar]
- 10. Hyppönen E., Power C., Smith G. D. (2003) Prenatal growth, BMI, and risk of type 2 diabetes by early midlife. Diabetes Care 26, 2512–2517 [DOI] [PubMed] [Google Scholar]
- 11. Boney C. M., Verma A., Tucker R., Vohr B. R. (2005) Metabolic syndrome in childhood: association with birth weight, maternal obesity, and gestational diabetes mellitus. Pediatrics 115, e290–e296 [DOI] [PubMed] [Google Scholar]
- 12. Srinivasan M., Katewa S. D., Palaniyappan A., Pandya J. D., Patel M. S. (2006) Maternal high-fat diet consumption results in fetal malprogramming predisposing to the onset of metabolic syndrome-like phenotype in adulthood. Am. J. Physiol. Endocrinol. Metab. 291, E792–E799 [DOI] [PubMed] [Google Scholar]
- 13. Chen H., Simar D., Lambert K., Mercier J., Morris M. J. (2008) Maternal and postnatal overnutrition differentially impact appetite regulators and fuel metabolism. Endocrinology 149, 5348–5356 [DOI] [PubMed] [Google Scholar]
- 14. Samuelsson A. M., Matthews P. A., Argenton M., Christie M. R., McConnell J. M., Jansen E. H., Piersma A. H., Ozanne S. E., Twinn D. F., Remacle C., Rowlerson A., Poston L., Taylor P. D. (2008) Diet-induced obesity in female mice leads to offspring hyperphagia, adiposity, hypertension, and insulin resistance: a novel murine model of developmental programming. Hypertension 51, 383–392 [DOI] [PubMed] [Google Scholar]
- 15. Dunn G. A., Bale T. L. (2009) Maternal high-fat diet promotes body length increases and insulin insensitivity in second-generation mice. Endocrinology 150, 4999–5009 [DOI] [PMC free article] [PubMed] [Google Scholar]
- 16. Tennant P. W., Rankin J., Bell R. (2011) Maternal body mass index and the risk of fetal and infant death: a cohort study from the North of England. Hum. Reprod. 26, 1501–1511 [DOI] [PMC free article] [PubMed] [Google Scholar]
- 17. Cao L., Choi E. Y., Liu X., Martin A., Wang C., Xu X., During M. J. (2011) White to brown fat phenotypic switch induced by genetic and environmental activation of a hypothalamic-adipocyte axis. Cell Metab. 14, 324–338 [DOI] [PMC free article] [PubMed] [Google Scholar]
- 18. Griffioen K. J., Mattson M. P. (2011) Playtime prevents obesity by brain-mediated fat browning. Cell Metab. 14, 287–288 [DOI] [PubMed] [Google Scholar]
- 19. Yates T., Khunti K., Wilmot E. G., Brady E., Webb D., Srinivasan B., Henson J., Talbot D., Davies M. J. (2012) Self-reported sitting time and markers of inflammation, insulin resistance, and adiposity. Am. J. Prev. Med. 42, 1–7 [DOI] [PubMed] [Google Scholar]
- 20. Cao L., Liu X., Lin E. J., Wang C., Choi E. Y., Riban V., Lin B., During M. J. (2010) Environmental and genetic activation of a brain-adipocyte BDNF/leptin axis causes cancer remission and inhibition. Cell 142, 52–64 [DOI] [PMC free article] [PubMed] [Google Scholar]
- 21. van Praag H., Kempermann G., Gage F. H. (2000) Neural consequences of environmental enrichment. Nat. Rev. Neurosci. 1, 191–198 [DOI] [PubMed] [Google Scholar]
- 22. Pryke S. R., Griffith S. C. (2009) Genetic incompatibility drives sex allocation and maternal investment in a polymorphic finch. Science 323, 1605–1607 [DOI] [PubMed] [Google Scholar]
- 23. Fricke C., Bretman A., Chapman T. (2008) Adult male nutrition and reproductive success in Drosophila melanogaster. Evolution 62, 3170–3177 [DOI] [PubMed] [Google Scholar]
- 24. Folch J., Lees M., Sloane Stanley G. H. (1957) A simple method for the isolation and purification of total lipides from animal tissues. J. Biol. Chem. 226, 497–509 [PubMed] [Google Scholar]
- 25. Tusher V. G., Tibshirani R., Chu G. (2001) Significance analysis of microarrays applied to the ionizing radiation response. Proc. Natl. Acad. Sci. U.S.A. 98, 5116–5121 [DOI] [PMC free article] [PubMed] [Google Scholar]
- 26. Wei Y., Zhu J., Huan Y., Liu Z., Yang C., Zhang X., Mu Y., Xia P. (2010) Aberrant expression and methylation status of putatively imprinted genes in placenta of cloned piglets. Cell. Reprogram. 12, 213–222 [DOI] [PubMed] [Google Scholar]
- 27. Mortazavi A., Williams B. A., McCue K., Schaeffer L., Wold B. (2008) Mapping and quantifying mammalian transcriptomes by RNA-Seq. Nat. Methods 5, 621–628 [DOI] [PubMed] [Google Scholar]
- 28. Weber M., Hellmann I., Stadler M. B., Ramos L., Pääbo S., Rebhan M., Schübeler D. (2007) Distribution, silencing potential and evolutionary impact of promoter DNA methylation in the human genome. Nat. Genet. 39, 457–466 [DOI] [PubMed] [Google Scholar]
- 29. Wei Y., Huan Y., Shi Y., Liu Z., Bou G., Luo Y., Zhang L., Yang C., Kong Q., Tian J., Xia P., Sun Q. Y. (2011) Unfaithful maintenance of methylation imprints due to loss of maternal nuclear Dnmt1 during somatic cell nuclear transfer. PLoS One 6, e20154. [DOI] [PMC free article] [PubMed] [Google Scholar]
- 30. Wang L., Feng Z., Wang X., Wang X., Zhang X. (2010) DEGseq: an R package for identifying differentially expressed genes from RNA-seq data. Bioinformatics 26, 136–138 [DOI] [PubMed] [Google Scholar]
- 31. Pembrey M. E., Bygren L. O., Kaati G., Edvinsson S., Northstone K., Sjöström M., Golding J., and ALSPAC Study Team (2006) Sex-specific, male-line transgenerational responses in humans. Eur. J. Hum. Genet. 14, 159–166 [DOI] [PubMed] [Google Scholar]
- 32. Arsenijevic D., Onuma H., Pecqueur C., Raimbault S., Manning B. S., Miroux B., Couplan E., Alves-Guerra M. C., Goubern M., Surwit R., Bouillaud F., Richard D., Collins S., Ricquier D. (2000) Disruption of the uncoupling protein-2 gene in mice reveals a role in immunity and reactive oxygen species production. Nat. Genet. 26, 435–439 [DOI] [PubMed] [Google Scholar]
- 33. Chen Z., Gropler M. C., Norris J., Lawrence J. C., Jr., Harris T. E., Finck B. N. (2008) Alterations in hepatic metabolism in fld mice reveal a role for lipin 1 in regulating VLDL-triacylglyceride secretion. Arterioscler. Thromb. Vasc. Biol. 28, 1738–1744 [DOI] [PMC free article] [PubMed] [Google Scholar]
- 34. Xu J., Lee W. N., Phan J., Saad M. F., Reue K., Kurland I. J. (2006) Lipin deficiency impairs diurnal metabolic fuel switching. Diabetes 55, 3429–3438 [DOI] [PubMed] [Google Scholar]
- 35. Cropley J. E., Suter C. M., Beckman K. B., Martin D. I. (2006) Germ-line epigenetic modification of the murine A vy allele by nutritional supplementation. Proc. Natl. Acad. Sci. U.S.A. 103, 17308–17312 [DOI] [PMC free article] [PubMed] [Google Scholar]
- 36. Rakyan V. K., Chong S., Champ M. E., Cuthbert P. C., Morgan H. D., Luu K. V., Whitelaw E. (2003) Transgenerational inheritance of epigenetic states at the murine Axin(Fu) allele occurs after maternal and paternal transmission. Proc. Natl. Acad. Sci. U.S.A. 100, 2538–2543 [DOI] [PMC free article] [PubMed] [Google Scholar]
- 37. Waterland R. A., Jirtle R. L. (2003) Transposable elements: targets for early nutritional effects on epigenetic gene regulation. Mol. Cell. Biol. 23, 5293–5300 [DOI] [PMC free article] [PubMed] [Google Scholar]
- 38. Ratchford A. M., Chang A. S., Chi M. M., Sheridan R., Moley K. H. (2007) Maternal diabetes adversely affects AMP-activated protein kinase activity and cellular metabolism in murine oocytes. Am. J. Physiol. Endocrinol. Metab. 293, E1198–E1206 [DOI] [PubMed] [Google Scholar]
- 39. Ratchford A. M., Esguerra C. R., Moley K. H. (2008) Decreased oocyte-granulosa cell gap junction communication and connexin expression in a type 1 diabetic mouse model. Mol. Endocrinol. 22, 2643–2654 [DOI] [PMC free article] [PubMed] [Google Scholar]
- 40. Rassoulzadegan M., Grandjean V., Gounon P., Vincent S., Gillot I., Cuzin F. (2006) RNA-mediated non-mendelian inheritance of an epigenetic change in the mouse. Nature 441, 469–474 [DOI] [PubMed] [Google Scholar]
- 41. Wagner K. D., Wagner N., Ghanbarian H., Grandjean V., Gounon P., Cuzin F., Rassoulzadegan M. (2008) RNA induction and inheritance of epigenetic cardiac hypertrophy in the mouse. Dev. Cell 14, 962–969 [DOI] [PubMed] [Google Scholar]
- 42. Kiani J., Grandjean V., Liebers R., Tuorto F., Ghanbarian H., Lyko F., Cuzin F., Rassoulzadegan M. (2013) RNA-mediated epigenetic heredity requires the cytosine methyltransferase Dnmt2. PLoS Genet. 9, e1003498. [DOI] [PMC free article] [PubMed] [Google Scholar]
- 43. Lago R., Gómez R., Lago F., Gómez-Reino J., Gualillo O. (2008) Leptin beyond body weight regulation—current concepts concerning its role in immune function and inflammation. Cell. Immunol. 252, 139–145 [DOI] [PubMed] [Google Scholar]
- 44. Ooi E. M., Ng T. W., Watts G. F., Barrett P. H. (2013) Dietary fatty acids and lipoprotein metabolism: new insights and updates. Curr. Opin. Lipidol. 24, 192–197 [DOI] [PubMed] [Google Scholar]
- 45. Horton J. D., Shah N. A., Warrington J. A., Anderson N. N., Park S. W., Brown M. S., Goldstein J. L. (2003) Combined analysis of oligonucleotide microarray data from transgenic and knockout mice identifies direct SREBP target genes. Proc. Natl. Acad. Sci. U.S.A. 100, 12027–12032 [DOI] [PMC free article] [PubMed] [Google Scholar]
- 46. Rakhshandehroo M., Sanderson L. M., Matilainen M., Stienstra R., Carlberg C., de Groot P. J., Müller M., Kersten S. (2007) Comprehensive analysis of PPARα-dependent regulation of hepatic lipid metabolism by expression profiling. PPAR Res. 2007, 26839. [DOI] [PMC free article] [PubMed] [Google Scholar]
- 47. Reik W., Dean W., Walter J. (2001) Epigenetic reprogramming in mammalian development. Science 293, 1089–1093 [DOI] [PubMed] [Google Scholar]
- 48. Robker R. L., Akison L. K., Bennett B. D., Thrupp P. N., Chura L. R., Russell D. L., Lane M., Norman R. J. (2009) Obese women exhibit differences in ovarian metabolites, hormones, and gene expression compared with moderate-weight women. J. Clin. Endocrinol. Metab. 94, 1533–1540 [DOI] [PubMed] [Google Scholar]
- 49. Lane M., Robker R. L., Robertson S. A. (2014) Parenting from before conception. Science 345, 756–760 [DOI] [PubMed] [Google Scholar]
- 50. Anckaert E., Romero S., Adriaenssens T., Smitz J. (2010) Effects of low methyl donor levels in culture medium during mouse follicle culture on oocyte imprinting establishment. Biol. Reprod. 83, 377–386 [DOI] [PubMed] [Google Scholar]
- 51. Cioffi J. A., Van Blerkom J., Antczak M., Shafer A., Wittmer S., Snodgrass H. R. (1997) The expression of leptin and its receptors in pre-ovulatory human follicles. Mol. Hum. Reprod. 3, 467–472 [DOI] [PubMed] [Google Scholar]
- 52. Acevedo N., Ding J., Smith G. D. (2007) Insulin signaling in mouse oocytes. Biol. Reprod. 77, 872–879 [DOI] [PubMed] [Google Scholar]
- 53. Sutton-McDowall M. L., Gilchrist R. B., Thompson J. G. (2010) The pivotal role of glucose metabolism in determining oocyte developmental competence. Reproduction 139, 685–695 [DOI] [PubMed] [Google Scholar]
- 54. Smallwood S. A., Tomizawa S., Krueger F., Ruf N., Carli N., Segonds-Pichon A., Sato S., Hata K., Andrews S. R., Kelsey G. (2011) Dynamic CpG island methylation landscape in oocytes and preimplantation embryos. Nat. Genet. 43, 811–814 [DOI] [PMC free article] [PubMed] [Google Scholar]
- 55. Tomizawa S., Nowacka-Woszuk J., Kelsey G. (2012) DNA methylation establishment during oocyte growth: mechanisms and significance. Int. J. Dev. Biol. 56, 867–875 [DOI] [PubMed] [Google Scholar]
- 56. Stadler M. B., Murr R., Burger L., Ivanek R., Lienert F., Schöler A., van Nimwegen E., Wirbelauer C., Oakeley E. J., Gaidatzis D., Tiwari V. K., Schübeler D. (2011) DNA-binding factors shape the mouse methylome at distal regulatory regions. Nature 480, 490–495 [DOI] [PubMed] [Google Scholar]
- 57. Jimenez-Chillaron J. C., Isganaitis E., Charalambous M., Gesta S., Pentinat-Pelegrin T., Faucette R. R., Otis J. P., Chow A., Diaz R., Ferguson-Smith A., Patti M. E. (2009) Intergenerational transmission of glucose intolerance and obesity by in utero undernutrition in mice. Diabetes 58, 460–468 [DOI] [PMC free article] [PubMed] [Google Scholar]
- 58. Champagne F. A. (2008) Epigenetic mechanisms and the transgenerational effects of maternal care. Front. Neuroendocrinol. 29, 386–397 [DOI] [PMC free article] [PubMed] [Google Scholar]
- 59. Aitken R. J., Koopman P., Lewis S. E. (2004) Seeds of concern. Nature 432, 48–52 [DOI] [PubMed] [Google Scholar]
- 60. Du Plessis S. S., Cabler S., McAlister D. A., Sabanegh E., Agarwal A. (2010) The effect of obesity on sperm disorders and male infertility. Nat. Rev. Urol. 7, 153–161 [DOI] [PubMed] [Google Scholar]
- 61. Brykczynska U., Hisano M., Erkek S., Ramos L., Oakeley E. J., Roloff T. C., Beisel C., Schübeler D., Stadler M. B., Peters A. H. (2010) Repressive and active histone methylation mark distinct promoters in human and mouse spermatozoa. Nat. Struct. Mol. Biol. 17, 679–687 [DOI] [PubMed] [Google Scholar]
- 62. Hammoud S. S., Nix D. A., Zhang H., Purwar J., Carrell D. T., Cairns B. R. (2009) Distinctive chromatin in human sperm packages genes for embryo development. Nature 460, 473–478 [DOI] [PMC free article] [PubMed] [Google Scholar]
- 63. Ost A., Lempradl A., Casas E., Weigert M., Tiko T., Deniz M., Pantano L., Boenisch U., Itskov P. M., Stoeckius M., Ruf M., Rajewsky N., Reuter G., Iovino N., Ribeiro C., Alenius M., Heyne S., Vavouri T., Pospisilik J. A. (2014) Paternal diet defines offspring chromatin state and intergenerational obesity. Cell 159, 1352–1364 [DOI] [PubMed] [Google Scholar]
- 64. Borgel J., Guibert S., Li Y., Chiba H., Schübeler D., Sasaki H., Forné T., Weber M. (2010) Targets and dynamics of promoter DNA methylation during early mouse development. Nat. Genet. 42, 1093–1100 [DOI] [PubMed] [Google Scholar]
- 65. Puschendorf M., Terranova R., Boutsma E., Mao X., Isono K., Brykczynska U., Kolb C., Otte A. P., Koseki H., Orkin S. H., van Lohuizen M., Peters A. H. (2008) PRC1 and Suv39h specify parental asymmetry at constitutive heterochromatin in early mouse embryos. Nat. Genet. 40, 411–420 [DOI] [PubMed] [Google Scholar]