

Abstract
Colonization of vacant environments may catalyze adaptive diversification and be followed by competition within the nascent community. How these interactions ultimately stabilize and affect productivity are central problems in evolutionary ecology. Diversity can emerge by character displacement, in which selection favors phenotypes that exploit an alternative resource and reduce competition, or by facilitation, in which organisms change the environment and enable different genotypes or species to become established. We previously developed a model of long-term experimental evolution in which bacteria attach to a plastic bead, form a biofilm, and disperse to a new bead. Here, we focus on the evolution of coexisting mutants within a population of Burkholderia cenocepacia and how their interactions affected productivity. Adaptive mutants initially competed for space, but later competition declined, consistent with character displacement and the predicted effects of the evolved mutations. The community reached a stable equilibrium as each ecotype evolved to inhabit distinct, complementary regions of the biofilm. Interactions among ecotypes ultimately became facilitative and enhanced mixed productivity. Observing the succession of genotypes within niches illuminated changing selective forces within the community, including a fundamental role for genotypes producing small colony variants that underpin chronic infections caused by B. cenocepacia.
Keywords: Diversity, experimental evolution, productivity, resource limitation
A key attribute of many stable ecosystems is a high level of biodiversity, which can enhance productivity by positive interactions among coexisting species (Zhang 2003; Isbell et al. 2009). A major misconception is that competition for a shared, limiting resource should favor the superior competitor and reduce both diversity and overall output (Schluter and McPhail 1992; Tilman et al. 1994; Rainey et al. 2000; Day and Young 2004). However, if species inhabit complementary niches with some alternative resources, the antagonistic effects of competition are minimized, leading to greater community fitness (Brockhurst et al. 2006; Ashton et al. 2010; Fig.1). Such communities may arise by an ecological process of species colonization that avoids niche overlap, or by an evolutionary process of character displacement in situ (Brown and Wilson 1956; Schluter et al. 1985; Dayan et al. 1989; Schluter and McPhail 1992; Grant and Grant 2006). Once separated in niche space, a species may alter the environment and directly or indirectly enhance its own growth and persistence, a process referred to as niche construction, which enables different genotypes to become established and promotes facilitation (Whittaker 1977; Bruno et al. 2003; Day and Young 2004; Kylafis and Loreau 2008; Callahan et al. 2014; Fig.1). Facilitation is an ecological process that promotes positive interactions among species by mechanisms such as increased access to limiting resources or protection from competition (Day and Young 2004). Although facilitation is often studied at the species level, the effects of facilitation, that is, altered competitive interactions, are often observed at the community level, which may include effects on biodiversity and fitness (Stachowicz 2001; Day and Young 2004).
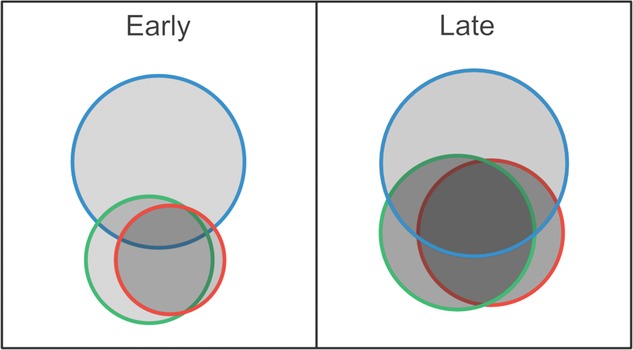
Figure 1.
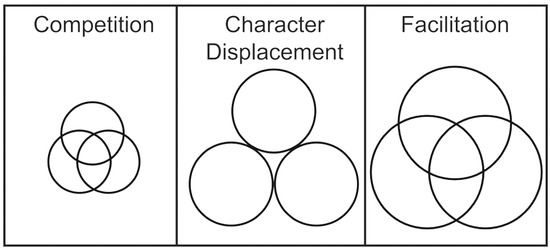
Models of niche overlap for three coexisting species driven by different mechanisms of interspecies interaction. Circle size reflects productivity of these species during interactions. When resources are shared and limiting (left panel), niche overlap is considerable and species compete, which decreases productivity of each species and the overall community. When species inhabit complementary niches with alternative resources (middle panel), niches do not overlap and the antagonistic effects of competition are minimized, leading to increased community productivity. When species are facilitative (right panel; larger circles), the presence of one species enhances the fitness of the others, which increases productivity in a synergistic manner.
Extant patterns of diversity and species interactions provide evidence of competition (Neill 1975; Rajaneimi 2003), displacement (Schluter 2000; Muchhala and Potts 2007), and facilitation (Pugnaire et al. 1996; Stachowicz 2001) influencing community productivity. To better define the role of displacement in particular, Schluter and McPhail proposed a universal set of criteria for its study (Schluter and McPhail 1992): (1) distinct traits must have a genetic basis, (2) differences in traits should be explained by processes other than chance, (3) morphological differences in traits must be related to resource use, (4) resources within the system are limiting, be they food, space, or other shared resources, (5) differences between sympatric and allopatric communities are not related to differences in resource availability between sites, and (6) distinct traits must have evolved in situ. However, the genetic and ecological interactions that generated extant patterns of diversity remain difficult to examine, even given these standardized criteria. Furthermore, disentangling the effects of facilitation and character displacement in extant populations is not feasible because both processes have the same downstream effect: that is, enhanced productivity over time.
Experimental bacterial populations have enabled investigators to examine the process of diversification in real time, and these models have illustrated how competitive and facilitative interactions among distinct genotypes may evolve and contribute to their coexistence (Turner et al. 1996; Rainey et al. 2000; Day and Young 2004; Brockhurst et al. 2006). Yet, most prior studies have focused on the origins of diversity rather than their long-term maintenance and evolutionary interplay (Kassen et al. 2004; Brockhurst et al. 2006). Using a novel model of long-term biofilm selection, we sought to understand the ecological mechanisms affecting both diversity and productivity in an evolving community as they happened. Recently, the adaptive mutations resulting from biofilm selection in this model were characterized in a representative, experimentally evolved community to reveal the molecular basis of adaptation and diversification (Traverse et al. 2013). In the current study, we focused on how the succession of genotypes was linked to changing ecological interactions and to associate specific mutations with functions in the community.
Here, using the opportunistic pathogen Burkholderia cenocepacia, we investigated how ecological diversity was maintained in an evolving biofilm community over hundreds of generations and how interactions among ecotypes changed over time to affect community productivity. Examining interactions among ecotypes isolated from early and late samples of the evolved community allowed us to test the key predictions of character displacement (Schluter and McPhail 1992) and facilitation (Day and Young 2004). Specifically, we compared observed and expected community productivity over time to determine if interactions evolved to be neutral (character displacement) or synergistic (facilitation). We further quantified the extent of physical segregation among ecotypes and the strength of competition for limiting resources, and found that both traits evolved to limit interactions. Lastly, shifts in ecological function were associated with several previously identified distinguishing mutations in genes that likely affect metabolism of cyclic diguanosine monophosphate (c-di-GMP), a signaling molecule that controls motility and biofilm formation in many bacterial species (Romling et al. 2005; Tamayo et al. 2007; Traverse et al. 2013).
Methods
STRAINS, MEDIA, CULTURE CONDITIONS, AND FLUORESCENT MARKING
Mixed population samples were frozen every 50 generations at 80°C in glycerol during long-term serial passage of B. cenocepacia HI2424 in the selective environment, which was a 7-mm polystyrene bead suspended in 5 mL of 3% galactose minimal media (GMM), an M9 minimal medium (40 mM Na2HPO4, 20 mM KH2PO4, 9 mM NaCl, 20 mM NH4Cl, 1 mM MgSO4, 1 mM CaCl2) containing 3% (1 M) galactose (Poltak and Cooper 2011). A Studded (S), Ruffled (R), and Wrinkly (W) clone from 315 (Early) and 1050 (Late) generations was isolated by streaking frozen cultures onto half-strength T-soy agar and incubating at 37°C for 24 h, and then at room temperature for 48 h. Clones were picked and frozen individually at 80°C in glycerol. Escherichia coli strains harboring fluorescent plasmids were recovered from frozen stocks and streaked to isolation on T-soy agar containing 50 μg/mL chloramphenicol (Cm). Fluorescent plasmids were used to label the isolated clones from the Early and Late populations for use in confocal microscopy. Plasmids pSPR, which harbors the red fluorescent protein gene from DsRedExpress, and pSPY, which harbors the EYFP yellow fluorescent protein gene, were constructed as previously described (Poltak and Cooper 2011). Plasmids were introduced to ecotype clones by electroporation and selection on T-soy agar containing 100 μg/mL Cm. Growth of frozen stocks began in T-soy broth for 24 h followed by at least 24 h in the selective medium to precondition genotypes to this environment. Genotypes of all isolates used in this study are reported in Traverse et al. (2013; Table S1).
LIMITING RESOURCE EXPERIMENT
To determine if nutrients were a limiting resource, productivity (final colony forming units/mL, or CFU/mL) of the Early and Late populations was quantified from a single bead after 24 h of bacterial growth at 37°C in 5 mL M9 minimal medium containing 0.01%, 0.1%, 1%, 3% (selective concentration), or 5% galactose. To determine if space was a limiting resource, productivity (final CFU/mL) of the Early and Late populations was quantified from either one or two beads after 24 h of bacterial growth at 37°C in 5 mL 3% GMM (selective medium). Adherent cells were removed by vortexing in 1× phosphate-buffered saline (PBS) for two periods of 10 sec and analyzed by plating on half-strength T-soy agar. For both experiments, bacterial cultures contained starting inoculums of ∼2.0 × 10⁶ CFU/mL.
PRODUCTIVITY, FITNESS, AND COMPETITION EXPERIMENTS
Following preconditioning of each clone in the selective environment, clonal populations and mixed communities of the Early and Late clones were constructed by growing 7(S):2(R):1(W) combinations of each ecotype for 24 h, thus recreating the ecotype frequencies observed at 1050 generations (Poltak and Cooper 2011). We also replicated this experiment with 1(S):1(R):1(W) starting combinations to confirm that the results were not biased toward increased productivity in the Late clones (data not shown). Productivity was measured as CFU/mL from a single bead after 24 h of growth. Expected individual productivity of ecotypes growing in a mixed community was calculated as the observed monoculture yield multiplied by the starting proportion of the ecotypes in mixture (Loreau and Hector 2001). Expected community productivity was the sum of expected ecotype productivities. By comparing expected (exp.) and observed (obs.) productivities, interactions between ecotypes were characterized as positive (obs. > exp.), negative (obs. < exp.), or neutral (obs. = exp.). The cost of growing in mixture was measured for each ecotype as the ratio of ecotype productivity when grown with its coevolved partners versus ecotype productivity when grown alone. For pair-wise competitions, Early, Late, and wild-type clones were preconditioned as described above and inoculated into the selective environment at varying starting yields, whereas the other competitor was started at a constant yield. Absolute fitness was quantified from vortexed beads after 24 h of growth and measured as the Malthusian parameter: ω = ln(Nt = 24 / Nt = 0).
CONFOCAL MICROSCOPY
Ecotypes harboring pSPR or pSPY were preconditioned on beads for 24 h; beads were then removed, vortexed in 1× PBS, and used to construct community mixtures in a 7(S):2(R):1(W) ratio. These mixtures were grown for 24 h under selective conditions and then colonized beads were transferred to a fresh tube with a 7.5 mm × 7.5 mm glass coverslip to mimic the surface area of a new bead. Z-stack images of biofilms adhering to the glass coverslip were preserved with 0.1 M DABCO and captured with a Zeiss LSM510 Meta microscope (New York, NY) using the 20× objective lens, a 0.8 aperture, and the HFT UV/488/543/633, NFT 635 VIS, and NFT 545 lasers at 488 nm (3%) and 543 nm (50%). Fluorescent biofilms were quantified by pixel density in three dimensions using COMSTAT2 software (Heydorn et al. 2000). The quantity of S relative to R and W together was determined as the quantity of red fluorescent protein (S) to yellow fluorescent protein (R and W). We justified combining R and W by assuming they would occupy very similar areas of the biofilm based on their similar growth rates, biofilm outputs, and productivities in mixture.
PHENOTYPE CHARACTERIZATION
Biofilm production was measured by crystal violet staining of stationary phase cultures grown in 3% GMM in 96-well plates as described previously (O'Toole 2011). Swimming motility was measured as diameters of spread on 0.3% T-soy agar following 24 h of incubation at 37°C. Growth curves of individual ecotypes were created by growing each in monoculture in 3% GMM in 96-well plates and measuring OD600 every 15 min for 24 h. Maximum growth rate, or Vmax (OD600/h) was determined as the slope of the growth curve in exponential phase (OD600 @ Time 2 – OD600 @ Time 1/Time 2 – Time 1).
GENOME SEQUENCING AND POPULATION GENETIC INFERENCE
A complete description of our approach is described in Traverse et al. (2013). Briefly, we used BWA (Li and Durbin 2009) to map Illumina reads (provided by a JGI Community Sequencing project) against the HI2424 ancestral genome and call variants. Only variant reads with Phred scores greater than 30 and with a putative mutation covered by two forward and two reverse reads were considered for future analysis. This study focuses only on the clones, which were sequenced to 103–229× coverage, and not the metagenomes described previously, making mutational inference straightforward. Most SNPs were subsequently verified by Sanger sequencing (Traverse et al. 2013).
Results
Our novel method of long-term experimental biofilm evolution requires cells to attach to a plastic bead in a test tube, to form a biofilm, and then disperse to colonize a new bead each day (Poltak and Cooper 2011; Traverse et al. 2013). Importantly, its regular cycle allows faithful archiving and reconstruction of communities as they evolve, which is impossible in many closed biofilm culture systems. Previously, we found that six replicate populations of B. cenocepacia evolved for 1050 generations and diversified into three distinct colony types: Studded (S), Ruffled (R), and Wrinkly (W) (Fig.2; Poltak and Cooper 2011). These types produce different levels of biofilm and attach to abiotic and biotic surfaces in different ways, which strongly suggested adaptation to different niches and defines them as separate ecotypes (Cohan 2001; Poltak and Cooper 2011). Ecotype clones from Early and Late population samples were fully sequenced to elucidate the molecular bases of their different phenotypes (Traverse et al. 2013). This genetic analysis revealed that Early types evolved independently through distinct mutations, whereas Later types evolved anew from a more derived S lineage (Fig. S1). Because the Late community exhibited significantly greater productivity than expected from the output of its constituent clones (Poltak and Cooper 2011), we hypothesized that the changing genetic composition of the community was associated with the ecological dynamics of character displacement, facilitation, or a combination of both processes.
Figure 2.
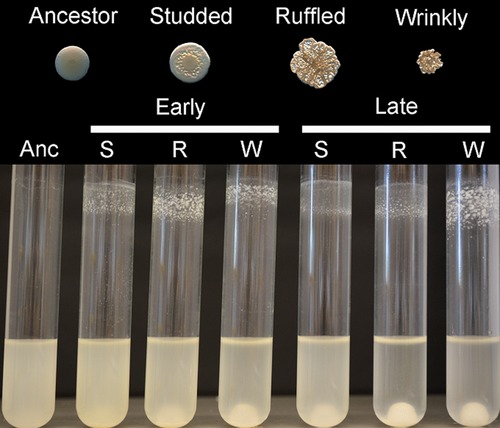
Ecotypes that adaptively evolved in a biofilm environment for 1050 generations are phenotypically distinct from each other and the wild-type ancestor. Top: colony morphologies of each biofilm ecotype and the founding clone. Bottom: patterns of biofilm formation in the selective environment by the ancestor (Anc), after 315 generations (Early) and after 1050 generations (Late).
ECOTYPES EVOLVED TO SEGREGATE BIOFILM SPACE
Character displacement involves adaptations that relax competition for a shared, limiting resource within the community. Two primary resources in the system were potentially limiting: galactose, the sole carbon source in the environment, and space on the bead for attachment. We tested if galactose was limiting by measuring the cellular productivity (yield, or final CFU/mL) of the Early (315 generations) and Late (1050 generations) populations in different concentrations of this resource. Productivity of both Early and Late populations varied as a function of galactose concentration (F = 102.57, df = 9, P = 4.84 × 10⁻²⁰; Fig.3A). Yield increased with added galactose until the concentration exceeded that of the selective environment (3%), when yield decreased significantly in both populations (P < 0.001; Fig.3A). Because additional galactose reduced growth, and it was plentiful in the selective environment, competition for this nonlimiting substrate was likely too weak to favor character displacement. Nonetheless, cellular yield in the selective condition (3% galactose) was 1.7 times higher in the Late than in the Early population (P = 0.08; Fig.3A), so the community still adapted to growth in 3% galactose.
Figure 3.
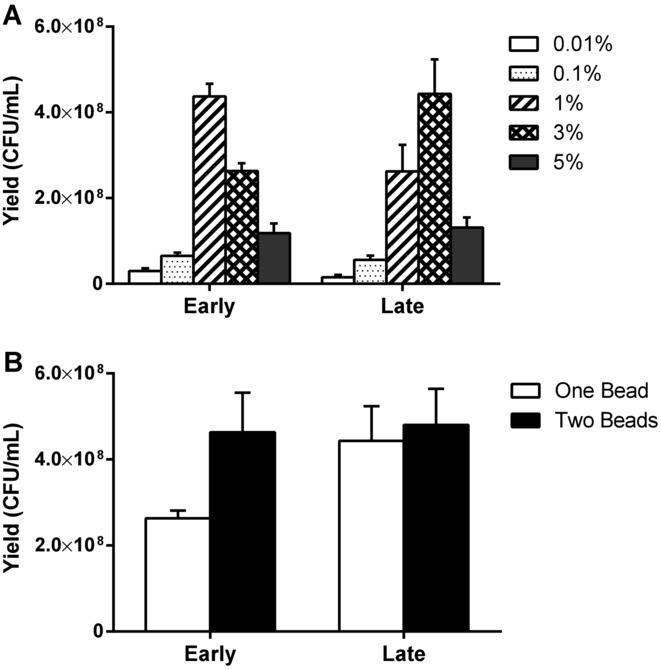
Surface area for binding, and not available nutrients, is a limiting resource during long-term experimental evolution under biofilm conditions. Phenotypes of isolates from the Early (315 generations) and Late (1050 generations) communities are compared here. (A) Effects of variation in galactose concentration on yield of attached cells. (B) Effects of variation in binding surface area (one bead or two beads) on yield of attached cells in 3% galactose. Results were evaluated using log10 transformed data, a two-way ANOVA, and Tukey's HSD post hoc tests (P < 0.05). Error bars are 95% confidence intervals (df = 3).
We then tested whether space on the plastic bead was a limiting resource by measuring the yield of Early and Late populations on one bead and two beads. Increased productivity with an additional bead would indicate competition for attachment space. Early productivity nearly doubled with a second bead, indicating that space on the bead limited growth (P = 0.002; Fig.3B). However, Late productivity was not statistically different when a second bead was added, suggesting that attachment space in that community was no longer limiting (P = 0.90). We then used confocal microscopy to examine how ecotypes evolved to inhabit bead space and form a biofilm. Two types of structures were evident: tall, heterogeneous clumps of biofilm comprising mixtures of all three ecotypes (Fig. S2), and flat, homogeneous films produced primarily by the S type that surrounded the heterogeneous clumps (not shown). S occupied 84.5% of the mixed clumps in the Early biofilm, but it only occupied 50.4% of the clumps in the Late biofilm, despite the S type being numerically dominant at all time samples (>70%; t = –2.71, df = 3.79, P = 0.05; Fig. S2). Thus, the S type appears to have evolved physical displacement from other types in the biofilm. We observed no significant difference in how R and W colonized the biofilm at either time point, indicating that their similar attachment patterns persisted. Swapping fluorescent markers among ecotypes also had no effect on these patterns (data not shown).
REDUCED COMPETITION FOR SPACE ENHANCED COMMUNITY PRODUCTIVITY
Character displacement predicts that the cost of competition in mixture decreases over time for community members. We quantified the cost of competition as the ratio of ecotype productivity when grown in mixture to its productivity when grown alone. Each Early ecotype was more productive when grown alone and experienced a cost when grown as a mixture, especially the R and W ecotypes (Table1). This cost was significantly reduced for the Late ecotypes (F = 83.93, df = 5, P = 6.53 × 10⁻⁹), and S actually benefited from growth in mixture; however, productivity of R and W was still highest when grown alone.
Table 1.
Productivity (CFU/mL) of each ecotype grown for 24 h in the mixed community relative to its yield in monoculture
| Ecotype | Early1 | Late1 | t Statistic | P value | df | Interpretation |
|---|---|---|---|---|---|---|
| S | 0.75 | 1.65 | −5.437 | 0.006 | 4 | A benefit evolves for growth in mixture. |
| R | 0.03 | 0.13 | −3.555 | 0.024 | 4 | Performs better alone, but growth in mixture improves. |
| W | 0.02 | 0.04 | −2.288 | 0.084 | 4 | Performs better alone. Growth does not improve in mixture. |
Pairwise differences between phenotypically similar ecotypes from Early and Late populations were determined by Tukey's HSD post hoc tests (P < 0.05, n = 5) after one-way ANOVA using log10 transformed data.
Ratio, CFU/mL in mixed culture: CFU/mL in solitary culture.
Reduced competition between cohabitating ecotypes supported the hypothesis of character displacement, but the benefit of S to growing in mixture suggested facilitative or synergistic interaction. We further evaluated the type of interactions (i.e., competitive, synergistic, or neutral) within the Early and Late populations by comparing observed to expected community productivity. Neutral relationships between ecotypes, as produced by displacement, would result in community yield that is equal to what is expected from additive effects scaled by initial frequencies. Interactions in the Early community appeared roughly additive, or neutral (t = 1.41, df = 12, P = 0.18), but the lower-than-expected fractions of R and W were consistent with competition (Fig.4A). In fact, the net neutrality within the Early community is largely explained by limited effects of competition on S, because its observed and expected productivity did not differ. In contrast, interactions in the Late community were greater than additive, or synergistic (t = 25.25, df = 12, P < 0.0001), owing mostly to greater-than-expected S productivity (Fig.4A). This is consistent with previous results that described the increased productivity of this population when measured in mixture (Poltak and Cooper 2011). Moreover, interactions between R and W appear less competitive in the Late population compared to the Early one (Table1), suggesting that niche overlap between R and W may have declined over time.
Figure 4.
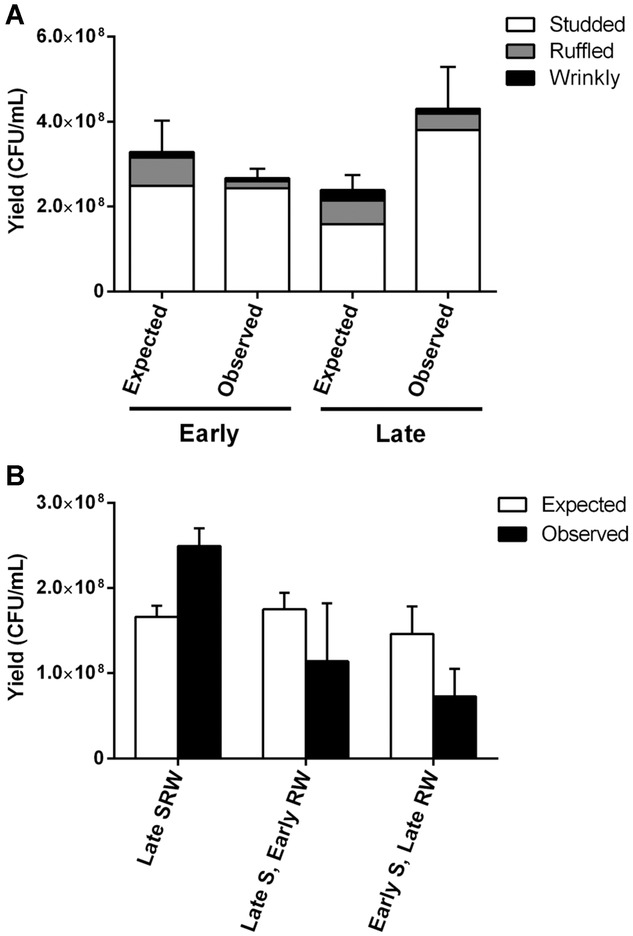
The biofilm community is initially competitive but evolves to become synergistic. (A) Productivity (CFU/mL) of the evolved biofilm community (observed) was quantified using clones representing the dominant members of the population at the Early and Late time points. The Late community is significantly more productive than expected (t = 25.25, df = 12, P < 0.0001). (B). Effect of swapping the Early and Late S clones between these communities. Mixtures of Late and Early ecotypes were significantly less productive than the Late community (Late S, Early RW: t = 4.57, df = 4, P < 0.01; Early S, Late RW: t = 3.91, df = 4, P < 0.02). Expected productivity in mixture (expected) was calculated using observed monoculture yield after 24 h multiplied by the starting proportion of the ecotypes in the mixed population. Results were analyzed using log10 transformed data, a one-way ANOVA, and Tukey's HSD post hoc tests (P < 0.05). Error bars are 95% confidence intervals (df = 3).
This decline in apparent competition over time, which is evidently associated most with changes in the S type, lends itself to the straightforward prediction that swapping the S clones between the Early and Late communities should also interfere with the observed synergy. As expected, both mixtures of Late and Early ecotypes were significantly less productive than the Late community (Late S, Early RW: t = 4.57, df = 4, P < 0.01; Early S, Late RW: t = 3.91, df = 4, P < 0.02; Fig.4B). Furthermore, the interactions between Early and Late ecotypes showed no evidence of facilitation and instead were less productive than expected, consistent with competition.
To further evaluate the prediction that competition between S and the rarer R and W ecotypes decreased in the Late community, we quantified fitness in pairwise competition experiments over a range of starting densities of the W type. S fitness was nearly constant despite increasing W density (Fig.5A); however, both R and W fitness declined with increasing W density (Fig.5B), again consistent with competition between R and W. In addition, W fitness was greatest at low starting density, regardless of the competitor. This advantage when rare likely explains the low frequency of W throughout the entire ∼1050-generation experiment.
Figure 5.
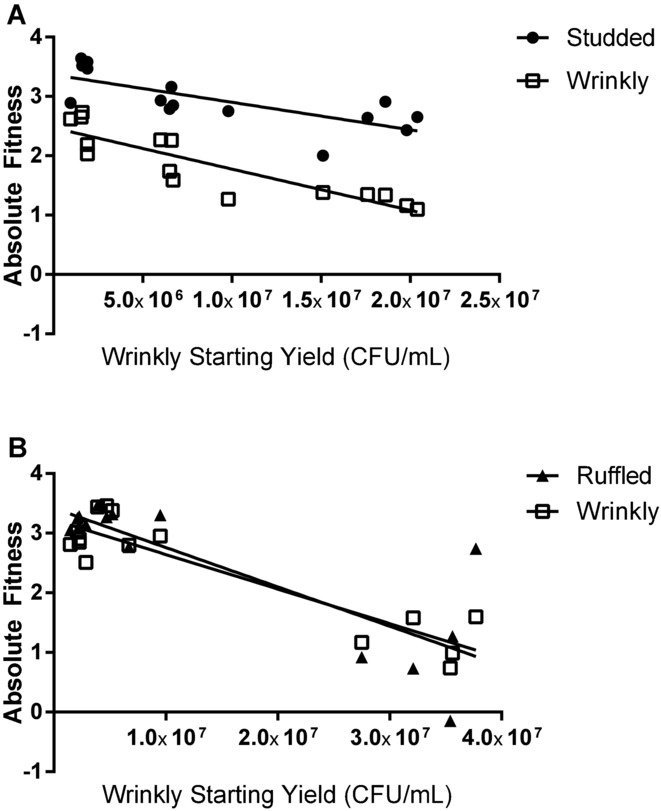
Competitions in the selective environment between Late ecotypes reveal (A) fitness of Studded (circle) remains nearly constant when competing with Wrinkly (open square), regardless of Wrinkly starting density, but (B) fitness of Ruffled (triangle) declines as Wrinkly density increases. Wrinkly fitness is also greatest at low density, regardless of its competitor. Starting yield of Wrinkly varied across experiments, whereas the yield of the other competitor was kept constant.
NICHE COMPLEMENTARITY AMONG ECOTYPES RESULTED IN WEAK TRADE-OFFS BETWEEN PRODUCTIVITY AND BIOFILM OUTPUT
We expected that niche-specific adaptation by each ecotype would result in trade-offs between the benefits of avoiding competition and the costs accrued in other fitness components. Here, we define a trade-off as a change in one phenotype (biofilm output) that is linked to a detrimental change in another phenotype (growth rate). We measured growth rate (Vmax) and biofilm output as fitness components of each ecotype (Table2). In the Early population, ecotypes grew at statistically indistinguishable rates, and only W showed a significant difference in biofilm formation compared to the others (t = 5.48, df = 30, P < 0.001). No relationship between growth rate and biofilm production was found (r = 0.67, n = 4, P = 0.54). In the Late population, S had the highest growth rate (t = 2.75, df = 30, P < 0.01) and the lowest biofilm output (t = 14.18, df = 30, P < 0.001). Only S evolved a significant increase in growth rate (t = 2.40, df = 30, P < 0.05), however, it also produced the least amount of biofilm compared to its Early predecessor (S: t = 4.04, df = 30, P < 0.001; R: t = 18.76, df = 30, P < 0.0001; W: t = 15.95, df = 30, P < 0.0001). Biofilm output inversely correlated with growth rate among Late ecotypes (r = –0.80, n = 4, P = 0.41), although this relationship was not significant; therefore, the trade-off between biofilm output and growth rate is weak at best. We also measured motility for all ecotypes (Table2). Biofilm production and motility were also inversely correlated (Early: r = –0.13, n = 4, P = 0.92; Late: r = –0.99, n = 3, P = 0.01), which has been demonstrated in previous studies (Nadell and Bassler 2011).
Table 2.
Phenotypes of evolved ecotypes from the Early (315 generations) and Late (1050 generations) populations
| Ecotype | Population | Biofilm output1 | V2max | Motility3 |
|---|---|---|---|---|
| Studded | Early | 0.810 (0.012) | 0.031 (0.004) | 1.74 (0.037) |
| Ruffled | Early | 0.786 (0.061) | 0.036 (0.001) | 0.70 (0.037) |
| Wrinkly | Early | 1.057 (0.022) | 0.039 (0.006) | 1.03 (0.025) |
| Studded | Late | 0.993 (0.012) | 0.045 (0.002) | 1.45 (0.048) |
| Ruffled | Late | 1.632 (0.036) | 0.028 (0.005) | 0.92 (0.031) |
| Wrinkly | Late | 1.777 (0.017) | 0.037 (0.001) | 0.85 (0.018) |
Vmax is maximum growth rate of a single ecotype grown in 3% GMM (Methods). A one-way ANOVA and post hoc Tukey's HSD tests were used to determine significant differences between means (P < 0.05, n = 6). Numbers in parentheses are SEs.
Absorbance of Crystal Violet extracted from biofilm, 600 nm.
Absorbance of bacterial monoculture, 600 nm.
Swimming radius (cm).
ADAPTIVE DIVERSIFICATION WAS DRIVEN BY MUTATIONS AFFECTING A BIOFILM SIGNAL
The adaptive mutations of several ecotypes were recently characterized (Traverse et al. 2013), enabling us to examine the mechanisms of reduced competition among different biofilm colonists and their eventual synergistic interactions. Early ecotype clones were distinguished primarily by unique mutations in genes governing metabolism of cyclic diguanosine monophosphate (c-di-GMP; Traverse et al. 2013), a second messenger that regulates the switch from planktonic to biofilm growth and affects attachment dynamics (Figs.2, S1, Table S1). The R clone acquired a single mutation (Fig. S1, Table S1) that distinguished it from the ancestor and affected the sensor domain of yciR (known also as rpfR; Deng et al. 2012), a gene encoding both diguanylate cyclase (GGDEF) and phosphodiesterase (EAL) domains. This enzyme has been characterized in many species as predominantly a phosphodiesterase that would degrade c-di-GMP and diminish biofilm production (Sommerfeldt et al. 2009; Deng et al. 2012; Spurbeck et al. 2012). The increased biofilm production of the R clone implies that the yciR mutation interferes with phosphodiesterase activity. The S clone experienced a deletion of this yciR gene along with 94 other neighboring genes, abolishing YciR activity and producing a distinct biofilm phenotype. The W clone acquired a mutation in a signal-receiving component of a predicted membrane-bound complex for surface growth (wspA, part of (Bcen2424_3785…Bcen2424_3792), which in Pseudomonas transduces signals to a protein complex that promotes c-di-GMP synthesis (O'Connor et al. 2012). We recently showed that single missense mutations in this complex are sufficient to explain the evolution of wrinkly small colony variants in B. cenocepacia and represent a plausible mechanism of ecological differentiation (Cooper et al. 2014), similar to other studies of biofilm adaptation in Pseudomonas (McDonald et al. 2009).
In contrast to the unique mutations among Early ecotypes, the Late isolates shared a common set of mutations demonstrating that each evolved anew from a common adaptive haplotype derived from the Early S clone (Fig. S1). This common haplotype was marked primarily by the deletion of yciR, a mutation in mannose-1-phosphate guanylyltransferase (manC), which promoted biofilm production, and a mutation altering the promoter of a gene encoding the iron storage protein bacterioferritin that increased its expression. This new genotype rose to high frequency after 600 generations (Traverse et al. 2013). The distinguishing mutations for Late R and W isolates were new mutations in the wsp operon and these genotypes displaced prior R and W lineages (Traverse et al. 2013; Table1). Here, we suggest that these new specialists improved S fitness by forming a thicker biofilm and facilitating adherence, and the increased S growth rate, which was potentially enhanced by a further 45-gene deletion, led to greater community productivity (Table2, Fig.4A).
Discussion
Following six months of experimental evolution under conditions favoring a cycle of biofilm formation and dispersal, phenotypically distinct isolates from one focal Burkholderia community met five of the six criteria defined as evidence of character displacement (Schluter and McPhail 1992). First, the phenotypes that differentiate the three ecotypes are heritable and linked to distinct mutations (Traverse et al. 2013). Second, the same three ecotypes also evolved in five other replicate populations (Poltak and Cooper 2011), albeit by different mutations, offering strong evidence that the ecotypes were adaptive and not arising by chance. Third, the system itself has at least one limiting resource: adherence space on the bead (this study). Fourth, the defining characteristics of the ecotypes—colony morphology and biofilm production—relate to how each exploits the limiting resource (this study). Lastly, the differences in biofilm formation and morphology evolved in situ (Poltak and Cooper 2011). The only criterion not clearly met by our model was the evolution of these ecotypes in allopatry to compare to these sympatric types, although colony variants such as these have been reported previously (Haussler et al. 2003a,b; Zlosnik et al. 2011).
Recently, studies of ecological character displacement were criticized for various shortcomings, including their failure to quantify competition for a shared resource when sympatric species use different resources, inability to meet some of the above criteria, or a lack of connection between phenotypic displacement to a genetic or physiological mechanism (Stuart and Losos 2013). Our study addresses these limitations not only by meeting these criteria but also by providing the capacity to connect the displaced phenotypes to specific adaptive mutations (Traverse et al. 2013). Furthermore, our study, which examined the effects of long-term coevolution (several months) among many competing haplotypes, builds significantly upon previous microbial microcosm experiments in which adaptive radiation and single-step mutations were examined over short periods of time (several days; Rainey and Travisano 1998; Brockhurst et al. 2006; McDonald et al. 2009).
We were also motivated to understand how new ecological strategies evolved that influenced community function. During the selection experiment, only cells adhering to a plastic bead were transferred to the next culture each day, so competition for attachment space was strong. Selection therefore favored ecotypes that were capable of occupying the bead by attaching to other cells as well as the bead itself (Poltak and Cooper 2011), thus driving early diversification in adherence traits. However, competition among Early ecotypes for space reduced community productivity (Fig.4A, Table1). With the numerical dominance of the S type, R and W types competed for limited space on the bead surface and were far less productive in mixture than when grown in isolation (Table1). Although these biofilm specialist types remained in the minority, when they evolved anew from the S haplotype, competition among these related ecotypes relaxed and the physical overlap in the biofilm declined over time (Fig. S2). Here and previously (Poltak and Cooper 2011), S was observed growing as a thin film around or atop the biofilm created by R and W. This layered attachment likely resulted in more efficient use of the available adherence space; as evidence, model biofilms composed of R and W but not S were clearly less productive (not shown). The mixture of R and W types in the same biofilm regions also explains why neither benefited in absolute numbers from growth in the mixed community. It is not surprising that the R and W ecotypes still compete because they only differ by point mutations occurring in the same operon (Table S1) and both produce robust biofilm directly on polystyrene (Fig. S2). We are currently investigating how variation in the timing and levels of c-di-GMP production produce distinct biofilm phenotypes.
Character displacement set the stage for, but did not fully explain, how mixed biofilm communities became more productive than any ecotype growing alone (Table1, Fig.4A). Selection for distinct biofilm attachment patterns caused by mutations in either yciR or wsp gene was associated with initial gains in productivity; however, positive interactions between S, R, and W evolved over following generations, which increased fitness of the whole community (Fig.6). These positive interactions may have been made possible first by reduced niche overlap and more efficient use of available resources (Fig.1; Futuyma and Slatkin 1983), but the link between evolved mutations and ecological facilitation is uncertain, especially as different mutations in the same genes (yciR and wsp) are implicated. One innovation shared by all Late ecotypes was enhanced storage of limiting iron by upregulated bacterioferritin, which increased efficiency of the entire community (Fig. S1). The advantage-when-rare phenotype of the W variant provides another clue for the increased productivity. We previously found that the rare W ecotype grew well in the waste products of the dominant S ecotype but not in its own, a cross-feeding phenotype that has been detailed elsewhere (Saxer et al. 2009; Poltak and Cooper 2011). Additionally, the S ecotype grew well in the waste products of all three ecotypes (Poltak and Cooper 2011). Here, we find new evidence for synergistic utilization of limited space for attachment, so inefficiencies in both metabolism and biofilm assembly evolved into net benefits for the community and for the S genotype in particular, the S genotype is facilitated by the presence of R and W by their earlier attachment to the plastic surface and by their production of metabolic byproducts.
Figure 6.
Model of niche overlap for three coexisting ecotypes that evolved during selection in a biofilm environment for 1050 generations. Size of the circles correlates to absolute fitness of each ecotype, when growing in mixture, relative to the ancestral clone. Shading of the circles represents biofilm output relative to the ancestral clone. In the Early population, attachment space is limiting and generates competition among ecotypes, which limits fitness and reduces overall community productivity. The Studded type (blue) pays minimal costs of competition in mixture, which suggests that its niche overlaps less with either Ruffled (green) or Wrinkly (red) than they do with one another. In the Late population, attachment space is evidently no longer limiting due to earlier displacement by Studded, but competition between Ruffled and Wrinkly persists. Nonetheless, displacement allowed facilitative interactions to evolve between Studded and the others, which improved fitness for all ecotypes and increased productivity in a synergistic manner.
The genetic basis of the benefit of S growing in the presence of R and W remains uncertain. Each of the Late clones evolved from a common haplotype with five mutations and S morphology; from this lineage, the S clone acquired two new mutations, the R clone gained four new mutations, and the W clone gained one new mutation (Fig. S1, Table S1). We recently showed that mutations in the wsp operon are sufficient to explain the R and W colony types and their biofilm specialization (Cooper et al. 2014), and the experiments presented here show that these types still compete and reduce productivity of the other in mixture (Fig.5). Therefore, the synergy of the mixture of all three types either traces to a unique S mutation or the fact that each ecotype shares a common haplotype. Although the experiment in which Early and Late S clones were swapped demonstrates that the particular Late S genotype is critical for the observed synergy (Fig.4B), it does not distinguish between these both possibilities. However, because the S type accrues most of the benefit of growing in the mixed community, a novel mutation in S seems the more likely explanation. The only unique S mutation that is likely to influence genotype and community function is a deletion of 45 genes (Table S1), whose putative functions suggest various candidates that could produce an advantage of mixture. (The other unique S mutation is synonymous [Table S1].) Unfortunately, pinpointing which of these deleted genes was both adaptive to the clone and to the community requires further study.
In summary, we defined dynamics consistent with character displacement in a model biofilm population, characterized the community dynamics that increased productivity, and correlated mutations with these dynamics, all of which have implications for understanding how diversity is maintained in a range of both natural and infectious biofilms. For example, natural biofilms that inhabit marine surfaces are necessary for colonization by marine invertebrates in areas of low carbon availability and the integrity of these biofilms is influenced by abiotic environmental factors (Johnson et al. 1996). Cardinale et al. (2002) examined benthic biofilm communities in natural stream ecosystems and showed that substrate heterogeneity was essential for productivity and metabolism, and when heterogeneity was reduced, ecosystem function decreased. Similar patterns were observed in this system here and previously (Poltak and Cooper 2011), and its ease of manipulation enables further tests of factors affecting biofilm stability, especially when modeling effects of ecological disturbance that may leave existing niches empty.
This model may also be used to identify previously unknown biotic or abiotic factors that influence community dynamics, particularly those that may reduce productivity of harmful biofilms. The ecotypes isolated from this long-term experimental evolution are similar to those commonly isolated from lung infections of persons with cystic fibrosis (CF) (Zlosnik et al. 2011). The W types in particular closely resemble the small colony variants that are associated with high patient mortality (Haussler et al. 2003a). Burkholderia cenocepacia is an intrinsically antibiotic resistant, opportunistic pathogen of CF patients who can produce robust biofilms that enhance colonization and persistence in the CF lung (Cunha et al. 2004). Burkholderia cenocepacia isolates recovered from the lungs of infected CF patients often exhibit diverse phenotypes, most obvious of which is colony morphology, suggesting a history of adaptation to distinct niches within the biofilm structure (Haussler et al. 2003b). These convergent phenotypes thus suggest the hypothesis that productivity of clinical biofilms may also be influenced by interactions between diverse types and modulation of signals such as c-di-GMP. Moreover, the rigorous antibiotic treatment commonly used to treat these infections could vacate niches that allow colonization by B. cenocepacia (Starkey et al. 2009; Traverse et al. 2013). Although models of character displacement cannot yet forecast how biofilm diversity is borne out by fine-tuned signaling, our system may help us identify factors that change or reduce productivity of bacterial biofilms, which could enhance antimicrobial therapies.
DATA ARCHIVING
The doi for our data is 10.1111/evo.12581.
Acknowledgments
We thank S. Poltak, M. Dillon, and K. Flynn for useful feedback and two anonymous reviewers for the comments on constructive recommendations. This work was supported by National Science Foundation CAREER award DEB-0845851 to VSC. CE, CT, and LMS together performed culture-based experiments, data analysis, and statistics. CE completed the confocal microscopy and image analysis. All authors wrote the manuscript.
Supporting Information
Disclaimer: Supplementary materials have been peer-reviewed but not copyedited.
Figure S1. Mutational phylogeny of the biofilm population, from bottom to top.
Figure S2. Early and late biofilm populations imaged using confocal scanning laser microscopy.
Table S1. Genotypes of evolved ecotypes from the early (315 generations) and late (1050 generations) populations.
LITERATURE CITED
- Ashton IW, Miller AE, Bowman WD. Suding KN. Niche complementarity due to plasticity in resource use: plant partitioning of chemical N forms. Ecology. 2010;91:3252–3260. doi: 10.1890/09-1849.1. [DOI] [PubMed] [Google Scholar]
- Brockhurst MA, Hochberg ME, Bell T. Buckling A. Character displacement promotes cooperation in bacterial biofilms. Curr. Biol. 2006;16:2030–2034. doi: 10.1016/j.cub.2006.08.068. [DOI] [PubMed] [Google Scholar]
- Brown WL., Jr Wilson EO. Character displacement. Syst. Biol. 1956;5:49–64. [Google Scholar]
- Bruno JF, Stachowicz JJ. Bertness MD. Inclusion of facilitation into ecological theory. Trends Ecol. Evol. 2003;18:119–125. [Google Scholar]
- Callahan BJ, Fukami T. Fisher DS. Rapid evolution of adaptive niche construction in experimental microbial populations. Evolution. 2014;68:3307–3316. doi: 10.1111/evo.12512. [DOI] [PubMed] [Google Scholar]
- Cardinale BJ, Palmer MA, Swan CM, Brooks S. Poff NL. The influence of substrate heterogeneity on biofilm metabolism in a stream ecoystem. Ecology. 2002;83:412–422. [Google Scholar]
- Cohan FM. Bacterial species and speciation. Syst. Biol. 2001;50:513–524. doi: 10.1080/10635150118398. [DOI] [PubMed] [Google Scholar]
- Cooper VS, Staples RK, Traverse CC. Ellis CN. 2014. pp. 447–452. and Parallel evolution of small colony variants in Burkholderia cenocepacia biofilms. Genomics. [DOI] [PubMed]
- Cunha MV, Sousa SA, Leitao JH, Moreira LM, Videira PA. Sa-Correia I. Studies on the involvement of the exopolysaccharide produced by cystic fibrosis-associated isolates of the Burkholderia cepacia complex in biofilm formation and in persistence of respiratory infections. J. Clin. Microbiol. 2004;42:3052–3058. doi: 10.1128/JCM.42.7.3052-3058.2004. [DOI] [PMC free article] [PubMed] [Google Scholar]
- Day T. Young KA. Competitive and facilitative evolutionary diversification. BioScience. 2004;54:101–109. [Google Scholar]
- Dayan T, Simberloff D, Tchernov E. Yom-Tov Y. Inter- and intraspecific character displacement in mustelids. Ecology. 1989;70:1526–1539. [Google Scholar]
- Deng Y, Schmid N, Wang C, Wang J, Pessi G, Wu D, Lee J, Aguilar C, Ahrens CH, Chang C, et al. Cis-2-dodecenoic acid receptor RpfR links quorum-sensing signal perception with regulation of virulence through cyclic dimeric guanosine monophosphate turnover. Proc. Natl. Acad. Sci. 2012;109:15479–15484. doi: 10.1073/pnas.1205037109. [DOI] [PMC free article] [PubMed] [Google Scholar]
- Futuyma D. Slatkin M. Coevolution. Sunderland, MA: Sinauer; 1983. [Google Scholar]
- Grant PR. Grant BR. Evolution of character displacement in Darwin's finches. Science. 2006;313:224–226. doi: 10.1126/science.1128374. [DOI] [PubMed] [Google Scholar]
- Haussler S, Lehmann C, Breselge C, Rohde M, Classen M, Tummler B, Vandamme P. Steinmetz I. Fatal outcome of lung transplantation in cystic fibrosis patients due to small-colony variants of the Burkholderia cepacia complex. Eur. J. Clin. Microbiol. Infect. Dis. 2003a;22:249–253. doi: 10.1007/s10096-003-0901-y. [DOI] [PubMed] [Google Scholar]
- Haussler S, Ziegler I, Lottel A, von Gotz F, Rohde M, Wehmhohner D, Saravanamuthu S, Tummler B. Steinmetz I. Highly adherent small-colony variants of Pseudomonas aeruginosa in cystic fibrosis lung infection. J. Med. Microbiol. 2003b;52:295–301. doi: 10.1099/jmm.0.05069-0. [DOI] [PubMed] [Google Scholar]
- Heydorn A, Nielsen AT, Hentzer M, Sternberg C, Givskov M, Ersboll BK. Molin S. Quantification of biofilm structures by the novel computer program COMSTAT. Microbiology. 2000;146(10):2395–2407. doi: 10.1099/00221287-146-10-2395. [DOI] [PubMed] [Google Scholar]
- Isbell FI, Polley HW. Wilsey BJ. Biodiversity, productivity and the temporal stability of productivity: patterns and processes. Ecol. Lett. 2009;12:443–451. doi: 10.1111/j.1461-0248.2009.01299.x. [DOI] [PubMed] [Google Scholar]
- Johnson CR, Lewis TE, Nichols DS. Degnan BM. 1996. pp. 1219–1224. , and Bacterial induction of settlement and metamorphosis in marine invertebrates. Proceedings of the 8th International Coral Reef Symposium, Panama.
- Kassen R, Llewellyn M. Rainey PB. Ecological constraints on diversification in a model adaptive radiation. Nature. 2004;431:984–988. doi: 10.1038/nature02923. [DOI] [PubMed] [Google Scholar]
- Kylafis G. Loreau M. Ecological and evolutionary consequences of niche construction for its agent. Ecol. Lett. 2008;11:1072–1081. doi: 10.1111/j.1461-0248.2008.01220.x. [DOI] [PubMed] [Google Scholar]
- Li H. Durbin R. Fast and accurate short read alignment with Burrows-Wheeler transform. Bioinformatics. 2009;25:1754–1760. doi: 10.1093/bioinformatics/btp324. [DOI] [PMC free article] [PubMed] [Google Scholar]
- Loreau M. Hector A. Partitioning selection and complementarity in biodiversity experiments. Nature. 2001;412:72–76. doi: 10.1038/35083573. [DOI] [PubMed] [Google Scholar]
- McDonald MJ, Gehrig SM, Meintjes PL, Zhang X-X. Rainey PB. Adaptive divergence in experimental populations of Pseudomonas fluorescens. IV. Genetic constraints guide evolutionary trajectories in a parallel adaptive radiation. Genetics. 2009;183:1041–1053. doi: 10.1534/genetics.109.107110. [DOI] [PMC free article] [PubMed] [Google Scholar]
- Muchhala N. Potts MD. Character displacement among bat-pollinated flowers of the genus Burmeistera: analysis of mechanism, process and pattern. Proc. Biol. Sci. 2007;274:2731–2737. doi: 10.1098/rspb.2007.0670. [DOI] [PMC free article] [PubMed] [Google Scholar]
- Nadell CD. Bassler BL. A fitness trade-off between local competition and dispersal in Vibrio cholerae biofilms. Proc. Natl. Acad. Sci. USA. 2011;108:14181–14185. doi: 10.1073/pnas.1111147108. [DOI] [PMC free article] [PubMed] [Google Scholar]
- Neill WE. Experimental studies of microcrustacean competition, community composition and efficiency of resource utilization. Ecology. 1975;56:809–826. [Google Scholar]
- O'Connor JR, Kuwada NJ, Huangyutitham V, Wiggins PA. Harwood CS. Surface sensing and lateral subcellular localization of WspA, the receptor in a chemosensory-like system leading to c-di-GMP production. Mol. Microbiol. 2012;86:720–729. doi: 10.1111/mmi.12013. [DOI] [PMC free article] [PubMed] [Google Scholar]
- O'Toole GA. Microtiter dish biofilm formation assay. J. Vis. Exp. 2011;47:2437. doi: 10.3791/2437. [DOI] [PMC free article] [PubMed] [Google Scholar]
- Poltak SR. Cooper VS. Ecological succession in long-term experimentally evolved biofilms produces synergistic communities. ISME J. 2011;5:369–378. doi: 10.1038/ismej.2010.136. [DOI] [PMC free article] [PubMed] [Google Scholar]
- Pugnaire FI, Haase P. Puigdefabregas J. Facilitation between higher plant species in a semiarid environment. Ecology. 1996;77:1420–1426. [Google Scholar]
- Rainey PB. Travisano M. Adaptive radiation in a heterogeneous environment. Nature. 1998;394:69–72. doi: 10.1038/27900. [DOI] [PubMed] [Google Scholar]
- Rainey PB, Buckling A, Kassen R. Travisano M. The emergence and maintenance of diversity: insights from experimental bacterial populations. Trends Ecol. Evol. 2000;15:243–247. doi: 10.1016/s0169-5347(00)01871-1. [DOI] [PubMed] [Google Scholar]
- Rajaneimi TK. Explaining productivity-diversity relationships in plants. Oikos. 2003;101:449–457. [Google Scholar]
- Romling U, Gomelsky M. Galperin MY. C-di-GMP: the dawning of a novel bacterial signalling system. Mol. Microbiol. 2005;57:629–639. doi: 10.1111/j.1365-2958.2005.04697.x. [DOI] [PubMed] [Google Scholar]
- Saxer G, Doebeli M. Travisano M. Spatial structure leads to ecological breakdown and loss of diversity. Proc. Biol. Sci. 2009;276:2065–2070. doi: 10.1098/rspb.2008.1827. [DOI] [PMC free article] [PubMed] [Google Scholar]
- Schluter D. Ecological character displacement in adaptive radiation. Am. Nat. 2000;156:S4–S16. [Google Scholar]
- Schluter D. McPhail JD. Ecological character displacement and speciation in sticklebacks. Am. Nat. 1992;140:85–108. doi: 10.1086/285404. [DOI] [PubMed] [Google Scholar]
- Schluter D, Price TD. Grant PR. Ecological character displacement in darwin's finches. Science. 1985;227:1056–1059. doi: 10.1126/science.227.4690.1056. [DOI] [PubMed] [Google Scholar]
- Sommerfeldt N, Possling A, Becker G, Pesavento C, Tschowri N. Hengge R. Gene expression patterns and differential input into curli fimbriae regulation of all GGDEF/EAL domain proteins in Escherichia coli. Microbiology. 2009;155:1318–1331. doi: 10.1099/mic.0.024257-0. [DOI] [PubMed] [Google Scholar]
- Spurbeck RR, Tarrien RJ. Mobley HL. Enzymatically active and inactive phosphodiesterases and diguanylate cyclases are involved in regulation of motility or sessility in Escherichia coli CFT073. MBio. 2012;3:e00307–e00312. doi: 10.1128/mBio.00307-12. [DOI] [PMC free article] [PubMed] [Google Scholar]
- Stachowicz JJ. Mutualism, facilitation, and the structure of ecological communities. BioScience. 2001;51:235–246. [Google Scholar]
- Starkey M, Hickman JH, Ma L, Zhang N, De Long S, Hinz A, Palacios S, Manoil C, Kirisits MJ, Starner TD, et al. Pseudomonas aeruginosa rugose small colony variants have adaptations likely to promote persistence in the cystic fibrosis lung. J. Bacteriol. 2009;191:3492–3503. doi: 10.1128/JB.00119-09. [DOI] [PMC free article] [PubMed] [Google Scholar]
- Stuart YE. Losos JB. Ecological character displacement: glass half full or half empty. Trends Ecol. Evol. 2013;28:402–408. doi: 10.1016/j.tree.2013.02.014. [DOI] [PubMed] [Google Scholar]
- Tamayo R, Pratt JT. Camilli A. Roles of cyclic diguanylate in the regulation of bacterial pathogenesis. Annu. Rev. Microbiol. 2007;61:131–148. doi: 10.1146/annurev.micro.61.080706.093426. [DOI] [PMC free article] [PubMed] [Google Scholar]
- Tilman D, May RM, Lehman CL. Nowak MA. Habitat destruction and the extinction debt. Nature. 1994;371:65–66. [Google Scholar]
- Traverse CC, Mayo-Smith LM, Poltak SR. Cooper VS. Tangled bank of experimentally evolved Burkholderia biofilms reflects selection during chronic infections. Proc. Natl. Acad. Sci. 2013;110:E250–E259. doi: 10.1073/pnas.1207025110. [DOI] [PMC free article] [PubMed] [Google Scholar]
- Turner PE, Souza V. Lenski RE. Tests of ecological mechanisms promoting the stable coexistence of two bacterial genotypes. Ecology. 1996;77:2119–2129. [Google Scholar]
- Whittaker RH. Evolution of species diversity in land communities. In: Hect MK, Steere WC, Wallace B, editors. Evolutionary biology. New York: Plenum Press; 1977. pp. 1–67. [Google Scholar]
- Zhang Z. Mutualism or cooperation among competitors promotes coexistence and competitive ability. Ecol. Modell. 2003;164:271–282. [Google Scholar]
- Zlosnik JE, Costa PS, Brant R, Mori PY, Hird TJ, Fraenkel MC, Wilcox PG, Davidson AG. Speert DP. Mucoid and nonmucoid Burkholderia cepacia complex bacteria in cystic fibrosis infections. Am. J. Respir. Crit. Care. Med. 2011;183:67–72. doi: 10.1164/rccm.201002-0203OC. [DOI] [PubMed] [Google Scholar]
Associated Data
This section collects any data citations, data availability statements, or supplementary materials included in this article.
Supplementary Materials
Figure S1. Mutational phylogeny of the biofilm population, from bottom to top.
Figure S2. Early and late biofilm populations imaged using confocal scanning laser microscopy.
Table S1. Genotypes of evolved ecotypes from the early (315 generations) and late (1050 generations) populations.