

Abstract
The 1957 A/H2N2 influenza virus caused an estimated 2 million fatalities during the pandemic. Since viruses of the H2 subtype continue to infect avian species and pigs, the threat of reintroduction into humans remains. To determine factors involved in the zoonotic origin of the 1957 pandemic, we performed analyses on genetic sequences of 175 newly sequenced human and avian H2N2 virus isolates and all publicly available influenza virus genomes.
TEXT
Influenza A viruses are ecologically successful pathogens that infect a wide range of host species and that have periodically emerged in humans to cause pandemics (1). The “Asian pandemic” of 1957 was caused by an H2N2 influenza A virus generated by reassortment of the previously circulating human H1N1 virus and an avian H2N2 virus that contributed the polymerase basic 1 (PB1), hemagglutinin (HA), and neuraminidase (NA) genes to the pandemic strain (2). Here, we investigate genetic markers that are linked to the generation of human H2N2 viruses, by studying the genetic variation of H2N2 influenza A viruses in human hosts from 1957 to 1968 based on newly generated sequences from this study and all available sequences in public databases. The combined knowledge of which virus subtypes can potentially become pandemic and the characterization of changes essential for adaptation of individual viruses to humans will improve pandemic preparedness by allowing surveillance activities to identify specific genetic and phenotypic changes and allowing vaccine preparation for the most urgent threats.
The complete genomes of the 175 archived H2N2 influenza viruses isolated from humans (1957 to 1968) and birds (1961 to 2012) were sequenced using a high-throughput next-generation sequencing pipeline on a 454/Roche GS-FLX and Illumina HiSeq 2000 platform, as described previously (3–5), and consensus sequences were deposited in GenBank (see Table S1 in the supplemental material). Nucleotide sequences of each gene segment were initially aligned using MAFFT (6) and then manually corrected and assembled to include only coding regions. To determine the most closely related avian and human clades, maximum likelihood (ML) trees were inferred based on nucleotide alignments using the program FastTree version 2.1.5 (7) under the generalized time-reversible (GTR) model with gamma-distributed rates among sites (GTR+Γ) (see Fig. S1 in the supplemental material). The ML trees were used to select the avian viruses most closely related to the human H2N2 viruses for further analysis. Temporal phylogenies were then inferred using Bayesian Markov chain Monte Carlo (MCMC) methods in BEAST v1.8.0. Nucleotide substitution rates and times to most recent common ancestor (TMRCAs) for H2 viruses were estimated (Fig. 1A; also see Fig. S2 in the supplemental material) under a relaxed clock model as described previously (8, 9).
FIG 1.
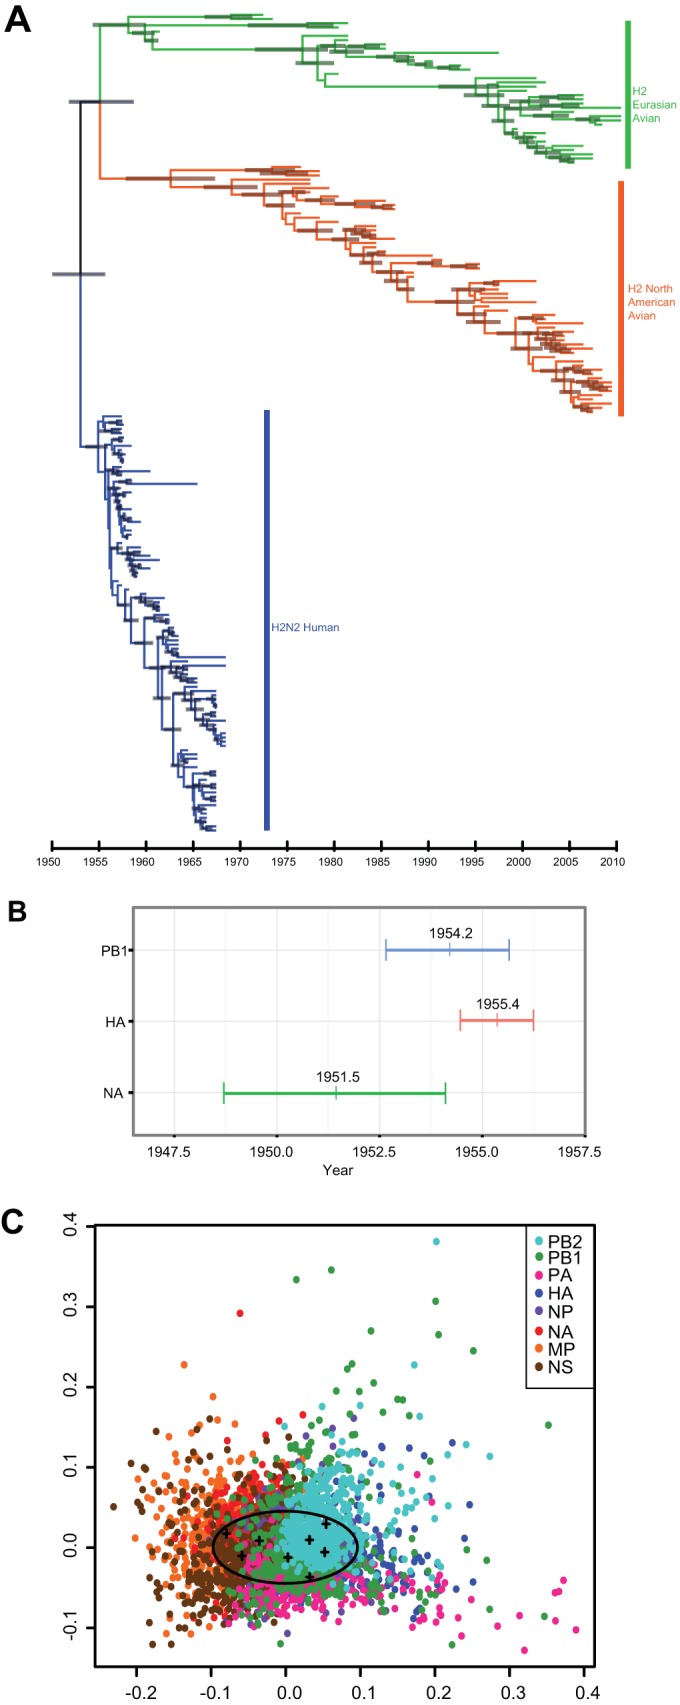
Evolution and reassortment of H2 viruses. Maximum-clade credibility temporal tree of H2N2 influenza A virus segment. (A) HA of Eurasian avian (green), North American avian (orange), and human (blue) virus isolates (n = 194). Gray bars represent the 95% highest posterior density (HPD) of age for each node. (B) Ninety-five percent HPDs of times to most recent common ancestor (TMRCAs) for avian-derived H2N2 human segments PB1 (blue), HA (red), and NA (green). Mean TMRCA values are indicated at the center of each bar. (C) Multidimensional scaling (MDS) plot of uncertainty of TMRCAs between samples of 500 trees for each segment of pandemic H2N2 viruses (n = 49) sampled between 1957 and 1968. In this analysis, the tree-to-tree variation in posterior distribution of 500 trees for each segment is plotted as a cloud of points where the mean is represented by the centroid of the cloud (crosses), while the spread of points indicates the degree of statistical uncertainty in the phylogenetic history of each gene segment. The space occupied by human H3N2 viruses is indicated by the oval (15).
The mean nucleotide substitution rate of human H2N2 HA genes from 1957 to 1968 was estimated at 3.59 × 10⁻³ substitutions/site/year (subs/site/yr) (95% highest posterior density [HPD], 3.00 × 10⁻³ to 4.22 × 10⁻³ subs/site/yr) (Table 1), comparable to the rate within the avian cluster (3.50 × 10⁻³ subs/site/yr; 95% HPD, 3.00 × 10⁻³ to 4.06 × 10⁻³ subs/site/yr) and which is consistent with previous reports. However, the substitution rates of human H2N2 PB1 and NA genes (1.13 × 10⁻³ and 0.89 × 10⁻³ subs/site/yr, respectively; 95% HPD, 0.89 × 10⁻³ to 1.38 × 10⁻³ and 0.68 × 10⁻³ to 1.11 × 10⁻³ subs/site/yr, respectively) were lower than previous estimates and those of avian PB1 and NA (1.76 × 10⁻³ and 2.57 × 10⁻³ subs/site/yr, respectively; 95% HPD, 1.55 × 10⁻³ to 1.98 × 10⁻³ and 2.24 × 10⁻³ to 2.89 × 10⁻³ subs/site/yr, respectively) (10, 11). The mean TMRCAs (Fig. 1B) of the novel-origin genes provide evidence suggesting that the PB1 and NA genes (1954 and early 1951, respectively) circulated in mammals before the HA was acquired (mid-1955), indicating a series of reassortment events in the years before pandemic emergence, consistent with previous analyses (8). This hypothesis is further supported by the significantly lower substitution rates observed in the human H2N2 PB1 and NA segments than in the HA (Bayes factors of >1,000, calculated as previously described [12]), suggesting prior mammalian adaptation. The lack of avian viruses isolated before 1957 precludes further validation of this hypothesis (8, 13).
TABLE 1.
Nucleotide substitution rates and times to most recent common ancestor (TMRCAs) of H2N2 segments analyzed
| Origin and gene | Lineage | Nucleotide substitution rate (subs/site/yr) |
TMRCA (yr) |
||||
|---|---|---|---|---|---|---|---|
| Mean | 95% HPD |
Mean | 95% HPD |
||||
| Lower | Upper | Lower | Upper | ||||
| Avian | |||||||
| HA | Human H2N2 | 3.59E−03 | 3.00E−03 | 4.22E−03 | 1955.39 | 1956.25 | 1954.47 |
| Avian H2N2 | 3.50E−03 | 3.00E−03 | 4.06E−03 | 1949.03 | 1956.77 | 1940.95 | |
| NA | Human H2N2 | 0.91E−03 | 0.68E−03 | 1.15E−03 | 1951.47 | 1954.11 | 1948.73 |
| Avian H2N2 | 2.57E−03 | 2.24E−03 | 2.89E−03 | 1954.89 | 1961.33 | 1948.16 | |
| PB1 | Human H2N2 | 1.13E−03 | 0.89E−03 | 1.38E−03 | 1954.24 | 1955.66 | 1952.66 |
| Avian H2N2 | 1.76E−03 | 1.55E−03 | 1.98E−03 | 1973.03 | 1975.40 | 1970.58 | |
| Human | |||||||
| PB2 | H1N1, H2N2 | 1.46E−03 | 1.25E−03 | 1.67E−03 | 1923.83 | 1928.70 | 1918.34 |
| PA | H1N1, H2N2 | 1.30E−03 | 1.09E−03 | 1.51E−03 | 1923.01 | 1928.30 | 1917.38 |
| NP | H1N1, H2N2 | 1.46E−03 | 1.20E−03 | 1.73E−03 | 1926.06 | 1929.83 | 1922.18 |
| MP | H1N1, H2N2 | 1.08E−03 | 8.69E−04 | 1.29E−03 | 1923.58 | 1928.46 | 1918.52 |
| NS | H1N1, H2N2 | 1.73E−03 | 1.27E−03 | 2.19E−03 | 1925.06 | 1929.20 | 1920.55 |
To determine the degree of reassortment present in human H2N2 viruses, we used a multidimensional scaling (MDS) plot of uncertainty of TMRCAs between samples of 500 trees for each gene segment, as previously described (14, 15). In this analysis, we assume that gene segments with similar evolutionary histories will occupy similar positions in the MDS plot. Our analysis showed considerable overlap in the phylogenetic histories of all H2N2 gene segments during the 10-year period that they circulated in humans, indicating a relatively homogenous virus population with little evidence for ongoing reassortment in the human population (Fig. 1C).
We investigated natural selection on the virus populations by estimating the global ratio of nonsynonymous (dN) and synonymous (dS) substitutions per codon (dN/dS ratio) for each gene using single-likelihood ancestor counting (SLAC) as implemented in Datamonkey (16, 17). Results indicate that H2N2 pandemic virus genes were generally under higher selection pressures than were those observed in avian hosts (Table 2). In particular, the H2N2 PB1, HA, and NA genes had a higher dN/dS ratio in the human clade than in the avian group, while the human H1N1-derived genes show increased dN/dS ratios compared to the ancestral H1N1 viruses circulating in mammals. These results likely reflect increased adaptive pressure on the newly generated H2N2 strain to both the new genome constellation and the new host.
TABLE 2.
Selection pressures of H2N2 segments compared to their respective avian or H1N1 precursors
| Origin and gene | Lineage | Global dN/dS |
Branch model dN/dS |
Sites under positive selectiona | ||||
|---|---|---|---|---|---|---|---|---|
| Mean | 95% CId |
|||||||
| Lower | Upper | External | Internal | Internal/external ratio | ||||
| Avian | ||||||||
| HA | Human H2N2 | 0.448 | 0.402 | 0.497 | 0.287 | 0.272 | 0.948 | 5 (S72R/I; N181I; N192D/E/K; E211K/D; K217Eb) |
| Avian H2N2 | 0.120 | 0.110 | 0.129 | 0.114 | 0.062 | 0.538 | ||
| NA | Human H2N2 | 0.347 | 0.295 | 0.405 | 0.324 | 0.330 | 1.020 | |
| Avian H2N2 | 0.170 | 0.158 | 0.182 | 0.473 | 0.210 | 0.444 | ||
| PB1 | Human H2N2 | 0.130 | 0.106 | 0.158 | 0.068 | 0.054 | 0.794 | |
| Avian H2N2 | 0.031 | 0.028 | 0.035 | 0.111 | 0.080 | 0.723 | ||
| Human | ||||||||
| PB2 | H2N2 | 0.116 | 0.094 | 0.142 | 0.067 | 0.045 | 0.671 | |
| H1N1 | 0.072 | 0.061 | 0.083 | 0.079 | 0.052 | 0.655 | ||
| PA | H2N2 | 0.147 | 0.119 | 0.179 | 0.112 | 0.098 | 0.871 | |
| H1N1 | 0.085 | 0.074 | 0.097 | 0.076 | 0.066 | 0.880 | ||
| NP | H2N2 | 0.221 | 0.181 | 0.267 | 0.133 | 0.123 | 0.924 | |
| H1N1 | 0.165 | 0.132 | 0.204 | 0.166 | 0.104 | 0.627 | ||
| M1 | H2N2 | 0.224 | 0.167 | 0.291 | 0.161 | 0.083 | 0.513 | |
| H1N1 | 0.128 | 0.105 | 0.154 | 0.157 | 0.073 | 0.467 | ||
| M2c | H2N2 | 0.309 | 0.187 | 0.475 | 0.163 | 0.115 | 0.708 | |
| H1N1 | 0.405 | 0.322 | 0.502 | 0.534 | 0.435 | 0.814 | ||
| NS1 | H2N2 | 0.500 | 0.398 | 0.618 | 0.406 | 0.321 | 0.790 | |
| H1N1 | 0.287 | 0.251 | 0.326 | 0.281 | 0.239 | 0.852 | ||
| NS2c | H2N2 | 0.300 | 0.200 | 0.428 | 0.371 | 0.569 | 1.534 | |
| H1N1 | 0.215 | 0.170 | 0.268 | 0.182 | 0.192 | 1.053 | ||
Only sites that were significant in both the MEME method, with a P cutoff of <0.05, and the Tdg09 method, with a false discovery rate cutoff of <0.05, are reported.
Letters refer to single-letter amino acid abbreviations.
The MP and NS comprise two open reading frames with partial overlap, giving rise to two gene products of significant length. Selection pressures reflected in the overlapping part in either gene segment cannot be attributed to one of the two open reading frames, and the reported dN/dS values should be interpreted with caution.
CI, confidence interval.
A comparison of branch-wise dN/dS ratios of internal branches (ancestral nodes) and external branches (tips of the tree) was made using the 2-ratio model in CODEML (18). Pandemic H2N2 PB1, HA, and NA genes have a higher internal/external ratio than that in the avian background, indicating accumulation of amino acid mutations in these genes, probably as a consequence of adaptation to the new host (Table 2). The lower external dN/dS ratios suggest higher selective constraints resulting in deleterious nonsynonymous changes that were ultimately not fixed in the population (19) and may explain the lower evolutionary rates observed for this lineage. The internal versus external dN/dS ratios of the remaining gene segments that previously circulated in humans are comparable between the H2N2 and H1N1 backgrounds, indicating the absence of particular adaptive pressures after reassortment.
Previous studies on antibody profiling and comparative alignments of avian and human H2N2 virus isolates have reported amino acid differences between the two virus populations and suggested that they may be adaptive (2, 10, 20–22). Here, we analyze the significance of these changes by comparing selection pressures between human and avian viruses. Site-specific selection on amino acids was analyzed using two different methods and was considered relevant if the two methods detected the same codons. The mixed-effect model of evolution (MEME) method detects both fixed and episodic diversifying selection between branches (23), while the Tdg09 program (24) relies on the designation of host-specific lineages to determine amino acid mutations that might have been important for the host shift event. Our analyses detected five positively selected sites in the HA gene only (Table 2). Of these, one residue—Asn-192-Asp/Glu/Lys—was in the receptor-binding site (RBS) of the HA protein (see Fig. S3A in the supplemental material). The remaining four sites—Ser-72-Arg/Ile, Asn-181-Ilu, Glu-211-Lys/Asp, and Lys-217-Glu—are in antigenic regions of the HA protein (10, 11, 22). It is also worth noting that, although not identified as being under significant positive selection in our analysis, most human H2N2 virus HA genes had a Glu-221-Lys and Gly-223-Ser mutation (positions 226 and 228 in H3 numbering, respectively) that is known to be significant in the adaptation of the H2N2 and H3N2 viruses in humans and results in increased binding affinity to α-2,6-linked sialic acid host receptors in H2N2 and H3N2 viruses (25–28).
Studies on the adaptation of influenza A H1 and H3 viruses describe a decrease in the observed-to-expected CpG content as an evolutionary mechanism to evade immune responses through viral mimicry of the host genome (29). CpG motifs in DNA—the repeated succession of the nucleotide cytosine by guanine—are known to play an important role in immune reactions of vertebrates (30). Emerging evidence indicates similar functions of CpG motifs in RNA as well (31). However, analysis of CpG content showed no consistent pattern in the number of CpG motifs after the host switch from birds to humans in the PB1, HA, and NA genes (see Fig. S3B in the supplemental material). Similarly, an increase in the uracil content of avian-derived influenza A viruses following establishment and circulation in mammalian hosts is thought to reflect mammalian adaptation (29, 32, 33). RNA editing enzymes (e.g., Apobec) can convert the nucleotide cytosine to uracil, which is involved in pathogen recognition (34). Changes in the average content of U would suggest the activity of such an antiviral protein during host adaptation to humans. However, our results show either no change, or a slight decrease, in uracil content of the avian-derived PB1, HA, and NA genes (Fig. 2).
FIG 2.

Uracil content patterns. Uracil content in H2N2 human (solid triangles) gene segments in comparison to the respective H2 avian (asterisks) or H1 mammalian (open circles) isolates from which each segment is derived, depicted per year. Best-fit regression lines are shown with the 95% confidence interval shaded gray.
This analysis provides the first large-scale comparative genomic analysis of the adaptation of pandemic H2N2 viruses to humans. We found that pandemic H2N2 viruses have higher dN/dS ratios across the genome than do avian viruses, reflecting relaxed purifying selective constraints on the viruses during adaptation to humans. We identified five amino acid residues under significant positive selection in the RBS and antigenic regions of the HA protein involved in efficient binding to human-like receptors and immune escape (2, 21, 22). Further means of viral adaptation to humans, such as decreased CpG and uracil content, were inconclusive, possibly due to the brief circulation of H2N2 viruses in humans (10 years), whereas previous studies looked at H1 and H3 viruses over a period of 20 to 70 years (29, 32). Finally, our analysis on the temporal phylogenies of the avian-origin genes supports, as previously reported, the staggered introduction of each novel segment over 2 to 6 years prior to the emergence of the 1957 pandemic (8).
Jones et al. (35) provided a comprehensive risk assessment for the potential reintroduction in humans of H2N2 viruses currently circulating in wild birds and found that while the risk was low, these viruses exhibited pathogenicity, replicative competency, and direct-contact transmission in experimental mammalian systems. Moreover, a lack of sustained systematic global influenza surveillance in birds and other animals severely limits the power of any risk assessment. Consequently, as periodic bottlenecks can greatly influence the genetic characteristics of circulating avian influenza viruses (29), the deduced characteristics of the current avian population (i.e., after 1980) may not be the same as those of the virus population that provided genes to the H2N2 pandemic strain. Although the exact mechanism of adaptation from the zoonotic ancestor remains unknown, historical evidence of successful H2N2 infection and transmission in humans, combined with an immunologically naive population for H2N2 below approximately 50 years of age, highlights the need for continued monitoring of this subtype for pandemic preparedness planning.
Nucleotide sequence accession numbers.
A total of 1,426 new sequences were generated and deposited in GenBank. The accession numbers are CY116723 to CY117556, CY121897 to CY122051, CY122056 to CY122315, CY125822 to CY125925, KM885170 to KM885178, and KP098381 to KP098444.
Supplementary Material
ACKNOWLEDGMENTS
This study was supported by contracts HHSN266200700010C, HHSN272201400008C, HHSN266200700005C, HHSN272200900007C, and HHSN272201400006C from the National Institute of Allergy and Infectious Diseases (NIAID), National Institutes of Health (NIH), Department of Health and Human Services, United States, and by the Duke-NUS Signature Research Program funded by the Agency of Science, Technology and Research, Singapore, and the Ministry of Health, Singapore.
We thank Mathieu Fourment (University of Sydney) for providing the R script for MDS plotting. We are grateful to the H2N2 Working Group, who collected and contributed influenza A H2 subtype viruses to this study.
The collaborators contributing to the NIAID/NIH Centers of Excellence in Influenza Research and Surveillance (CEIRS) H2N2 Working Group are as follows: David Stallknecht (University of Georgia), Adolfo Garcia-Sastre (Icahn School of Medicine at Mount Sinai), Richard Slemons (Ohio State University), David Suarez (Southeast Poultry Research Laboratory), Malik Peiris and Yi Guan (University of Hong Kong), Jeffery Hall (USGS National Wildlife Health Center), Carol Cardona (University of Minnesota), and Robert Webster (St. Jude Children's Research Hospital).
The manuscript was prepared while D. E. Wentworth was employed at the J. Craig Venter Institute. The opinions expressed in this article are the author's own and do not reflect the view of the Centers for Disease Control, the Department of Health and Human Services, or the United States government.
Footnotes
Supplemental material for this article may be found at http://dx.doi.org/10.1128/JVI.02590-14.
REFERENCES
- 1.Webster RG, Bean WJ, Gorman OT, Chambers TM, Kawaoka Y. 1992. Evolution and ecology of influenza A viruses. Microbiol Rev 56:152–179. [DOI] [PMC free article] [PubMed] [Google Scholar]
- 2.Schafer JR, Kawaoka Y, Bean WJ, Suss J, Senne D, Webster RG. 1993. Origin of the pandemic 1957 H2 influenza A virus and the persistence of its possible progenitors in the avian reservoir. Virology 194:781–788. doi: 10.1006/viro.1993.1319. [DOI] [PubMed] [Google Scholar]
- 3.Zhou B, Donnelly ME, Scholes DT, St. George K, Hatta M, Kawaoka Y, Wentworth DE. 2009. Single-reaction genomic amplification accelerates sequencing and vaccine production for classical and swine origin human influenza A viruses. J Virol 83:10309–10313. doi: 10.1128/JVI.01109-09. [DOI] [PMC free article] [PubMed] [Google Scholar]
- 4.Depew J, Zhou B, McCorrison JM, Wentworth DE, Purushe J, Koroleva G, Fouts DE. 2013. Sequencing viral genomes from a single isolated plaque. Virol J 10:181. doi: 10.1186/1743-422X-10-181. [DOI] [PMC free article] [PubMed] [Google Scholar]
- 5.Djikeng A, Halpin R, Kuzmickas R, Depasse J, Feldblyum J, Sengamalay N, Afonso C, Zhang X, Anderson NG, Ghedin E, Spiro DJ. 2008. Viral genome sequencing by random priming methods. BMC Genomics 9:5. doi: 10.1186/1471-2164-9-5. [DOI] [PMC free article] [PubMed] [Google Scholar]
- 6.Katoh K, Misawa K, Kuma K, Miyata T. 2002. MAFFT: a novel method for rapid multiple sequence alignment based on fast Fourier transform. Nucleic Acids Res 30:3059–3066. doi: 10.1093/nar/gkf436. [DOI] [PMC free article] [PubMed] [Google Scholar]
- 7.Price MN, Dehal PS, Arkin AP. 2010. FastTree 2—approximately maximum-likelihood trees for large alignments. PLoS One 5:e9490. doi: 10.1371/journal.pone.0009490. [DOI] [PMC free article] [PubMed] [Google Scholar]
- 8.Smith GJD, Bahl J, Vijaykrishna D, Zhang J, Poon LLM, Chen H, Webster RG, Peiris JSM, Guan Y. 2009. Dating the emergence of pandemic influenza viruses. Proc Natl Acad Sci U S A 106:11709–11712. doi: 10.1073/pnas.0904991106. [DOI] [PMC free article] [PubMed] [Google Scholar]
- 9.Drummond AJ, Suchard MA, Xie D, Rambaut A. 2012. Bayesian phylogenetics with BEAUti and the BEAST 1.7. Mol Biol Evol 29:1969–1973. doi: 10.1093/molbev/mss075. [DOI] [PMC free article] [PubMed] [Google Scholar]
- 10.Lindstrom SE, Cox NJ, Klimov A. 2004. Genetic analysis of human H2N2 and early H3N2 influenza viruses, 1957–1972: evidence for genetic divergence and multiple reassortment events. Virology 328:101–119. doi: 10.1016/j.virol.2004.06.009. [DOI] [PubMed] [Google Scholar]
- 11.Klimov AI, Bender CA, Hall HE, Cox NJ. 1996. Evolution of human influenza A (H2N2) viruses, p 546–552 InBrown LE, Hampson AW, Webster RG (ed), Options for the control of influenza III. Elsevier Science BV, Amsterdam, The Netherlands. [Google Scholar]
- 12.Bahl J, Vijaykrishna D, Holmes EC, Smith GJD, Guan Y. 2009. Gene flow and competitive exclusion of avian influenza A virus in natural reservoir hosts. Virology 390:289–297. doi: 10.1016/j.virol.2009.05.002. [DOI] [PMC free article] [PubMed] [Google Scholar]
- 13.Kilbourne ED. 2006. Influenza pandemics of the 20th century. Emerg Infect Dis 12:9–14. doi: 10.3201/eid1201.051254. [DOI] [PMC free article] [PubMed] [Google Scholar]
- 14.Bahl J, Krauss S, Kühnert D, Fourment M, Raven G, Pryor SP, Niles LJ, Danner A, Walker D, Mendenhall IH, Su YCF, Dugan VG, Halpin RA, Stockwell TB, Webby RJ, Wentworth DE, Drummond AJ, Smith GJD, Webster RG. 2013. Influenza A virus migration and persistence in North American wild birds. PLoS Pathog 9:e1003570. doi: 10.1371/journal.ppat.1003570. [DOI] [PMC free article] [PubMed] [Google Scholar]
- 15.Rambaut A, Pybus OG, Nelson MI, Viboud C, Taubenberger JK, Holmes EC. 2008. The genomic and epidemiological dynamics of human influenza A virus. Nature 453:615–619. doi: 10.1038/nature06945. [DOI] [PMC free article] [PubMed] [Google Scholar]
- 16.Delport W, Poon AF, Frost SD, Kosakovsky Pond SL. 2010. Datamonkey 2010: a suite of phylogenetic analysis tools for evolutionary biology. Bioinformatics 26:2455–2457. doi: 10.1093/bioinformatics/btq429. [DOI] [PMC free article] [PubMed] [Google Scholar]
- 17.Kosakovsky Pond SL, Frost SD. 2005. Not so different after all: a comparison of methods for detecting amino acid sites under selection. Mol Biol Evol 22:1208–1222. doi: 10.1093/molbev/msi105. [DOI] [PubMed] [Google Scholar]
- 18.Yang Z. 2007. PAML 4: phylogenetic analysis by maximum likelihood. Mol Biol Evol 24:1586–1591. doi: 10.1093/molbev/msm088. [DOI] [PubMed] [Google Scholar]
- 19.Pybus OG, Rambaut A, Belshaw R, Freckleton RP, Drummond AJ, Holmes EC. 2007. Phylogenetic evidence for deleterious mutation load in RNA viruses and its contribution to viral evolution. Mol Biol Evol 24:845–852. doi: 10.1093/molbev/msm001. [DOI] [PubMed] [Google Scholar]
- 20.Herlocher ML, Bucher D, Webster RG. 1992. Host range determination and functional mapping of the nucleoprotein and matrix genes of influenza viruses using monoclonal antibodies. Virus Res 22:281–293. doi: 10.1016/0168-1702(92)90058-H. [DOI] [PubMed] [Google Scholar]
- 21.Matrosovich M, Tuzikov A, Bovin N, Gambaryan A, Klimov A, Castrucci MR, Donatelli I, Kawaoka Y. 2000. Early alterations of the receptor-binding properties of H1, H2, and H3 avian influenza virus hemagglutinins after their introduction into mammals. J Virol 74:8502–8512. doi: 10.1128/JVI.74.18.8502-8512.2000. [DOI] [PMC free article] [PubMed] [Google Scholar]
- 22.Tsuchiya E, Sugawara K, Hongo S, Matsuzaki Y, Muraki Y, Li ZN, Nakamura K. 2001. Antigenic structure of the haemagglutinin of human influenza A/H2N2 virus. J Gen Virol 82:2475–2484. [DOI] [PubMed] [Google Scholar]
- 23.Murrell B, Wertheim JO, Moola S, Weighill T, Scheffler K, Kosakovsky Pond SL. 2012. Detecting individual sites subject to episodic diversifying selection. PLoS Genet 8:e1002764. doi: 10.1371/journal.pgen.1002764. [DOI] [PMC free article] [PubMed] [Google Scholar]
- 24.Tamuri AU, Dos Reis M, Hay AJ, Goldstein RA. 2009. Identifying changes in selective constraints: host shifts in influenza. PLoS Comput Biol 5:e1000564. doi: 10.1371/journal.pcbi.1000564. [DOI] [PMC free article] [PubMed] [Google Scholar]
- 25.Vines A, Wells K, Matrosovich M, Castrucci MR, Ito T, Kawaoka Y. 1998. The role of influenza A virus hemagglutinin residues 226 and 228 in receptor specificity and host range restriction. J Virol 72:7626–7631. [DOI] [PMC free article] [PubMed] [Google Scholar]
- 26.Pappas C, Viswanathan K, Chandrasekaran A, Raman R, Katz JM, Sasisekharan R, Tumpey TM. 2010. Receptor specificity and transmission of H2N2 subtype viruses isolated from the pandemic of 1957. PLoS One 5:e11158. doi: 10.1371/journal.pone.0011158. [DOI] [PMC free article] [PubMed] [Google Scholar]
- 27.Medina RA, García-Sastre A. 2011. Influenza A viruses: new research developments. Nat Rev Microbiol 9:590–603. doi: 10.1038/nrmicro2613. [DOI] [PMC free article] [PubMed] [Google Scholar]
- 28.Xu R, McBride R, Paulson JC, Basler CF, Wilson IA. 2010. Structure, receptor binding, and antigenicity of influenza virus hemagglutinins from the 1957 H2N2 pandemic. J Virol 84:1715–1721. doi: 10.1128/JVI.02162-09. [DOI] [PMC free article] [PubMed] [Google Scholar]
- 29.Greenbaum BD, Levine AJ, Bhanot G, Rabadan R. 2008. Patterns of evolution and host gene mimicry in influenza and other RNA viruses. PLoS Pathog 4:e1000079. doi: 10.1371/journal.ppat.1000079. [DOI] [PMC free article] [PubMed] [Google Scholar]
- 30.Krieg AM. 2000. The role of CpG motifs in innate immunity. Curr Opin Immunol 12:35–43. doi: 10.1016/S0952-7915(99)00048-5. [DOI] [PubMed] [Google Scholar]
- 31.Sivori S, Falco M, Della Chiesa M, Carlomagno S, Vitale M, Moretta L, Moretta A. 2004. CpG and double-stranded RNA trigger human NK cells by Toll-like receptors: induction of cytokine release and cytotoxicity against tumors and dendritic cells. Proc Natl Acad Sci U S A 101:10116–10121. doi: 10.1073/pnas.0403744101. [DOI] [PMC free article] [PubMed] [Google Scholar]
- 32.Worobey M, Han GZ, Rambaut A. 2014. A synchronized global sweep of the internal genes of modern avian influenza virus. Nature 508:254–257. doi: 10.1038/nature13016. [DOI] [PMC free article] [PubMed] [Google Scholar]
- 33.Rabadan R, Levine AJ, Robins H. 2006. Comparison of avian and human influenza A viruses reveals a mutational bias on the viral genomes. J Virol 80:11887–11891. doi: 10.1128/JVI.01414-06. [DOI] [PMC free article] [PubMed] [Google Scholar]
- 34.Bishop KN, Holmes RK, Sheehy AM, Malim MH. 2004. APOBEC-mediated editing of viral RNA. Science 305:645. doi: 10.1126/science.1100658. [DOI] [PubMed] [Google Scholar]
- 35.Jones JC, Baranovich T, Marathe BM, Danner AF, Seiler JP, Franks J, Govorkova EA, Krauss S, Webster RG. 2014. Risk assessment of H2N2 influenza viruses from the avian reservoir. J Virol 88:1175–1188. doi: 10.1128/JVI.02526-13. [DOI] [PMC free article] [PubMed] [Google Scholar]
Associated Data
This section collects any data citations, data availability statements, or supplementary materials included in this article.