

Abstract
Research into environmental factors associated with suicide has historically focused on meteorological variables. Recently, a heightened risk of suicide related to short-term exposure to airborne particulate matter was reported. Here, we examined the associations between short-term exposure to nitrogen dioxide, particulate matter, and sulfur dioxide and completed suicide in Salt Lake County, Utah (n = 1,546) from 2000 to 2010. We used a time-stratified case-crossover design to estimate adjusted odds ratios for the relationship between suicide and exposure to air pollutants on the day of the suicide and during the days preceding the suicide. We observed maximum heightened odds of suicide associated with interquartile-range increases in nitrogen dioxide during cumulative lag 3 (average of the 3 days preceding suicide; odds ratio (OR) = 1.20, 95% confidence interval (CI): 1.04, 1.39) and fine particulate matter (diameter ≤2.5 μm) on lag day 2 (day 2 before suicide; OR = 1.05, 95% CI: 1.01, 1.10). Following stratification by season, an increased suicide risk was associated with exposure to nitrogen dioxide during the spring/fall transition period (OR = 1.35, 95% CI: 1.09, 1.66) and fine particulate matter in the spring (OR = 1.28, 95% CI: 1.01, 1.61) during cumulative lag 3. Findings of positive associations between air pollution and suicide appear to be consistent across study locations with vastly different meteorological, geographical, and cultural characteristics.
Keywords: air pollution, case-crossover studies, environmental exposure, nitrogen dioxide, particulate matter, risk factors, suicide
Editor's note: An invited commentary on this article appears on page 304, and the authors’ response appears on page 309.
Suicide is the tenth leading cause of death in the United States (1) and the eighth leading cause in Utah (2). Multiple interacting factors influence a person's risk of suicide, including the presence of psychiatric and/or physical illness, previous and current social experiences, genetic susceptibility, and exposure to environmental factors. Despite being recognized as major contributors to suicide risk, the environmental risk factors associated with suicide remain poorly understood.
Research into the environmental factors associated with suicide has focused largely on the relationship between suicide risk and meteorological variables. Peak suicide rates have been shown to be positively correlated with increasing durations of sunshine and ambient temperatures (3) and negatively correlated with decreasing amounts of precipitation (4). Recently, the search for environmental risk factors associated with suicide has broadened beyond meteorological variables to include exposure to air pollutants. Studies conducted in the Republic of Korea (5) and Taiwan (6) have identified a heightened risk of suicide related to short-term exposure to particulate matter. Further, Kim et al. (5) conducted a stratified analysis and found that suicide risk was greatest among males and persons aged 36–64 years, while a peak seasonal association was identified during the “transition period,” defined as spring and fall combined.
A similar relationship may exist between air pollution and suicide risk in US populations, but this has yet to be examined. Substantial differences in epidemiologic suicide patterns, including higher average suicide rates, lower male:female suicide ratios, and higher elderly:general population suicide ratios in Asian countries compared with the United States (7), suggest that the relationship between air pollution exposure and suicide in US populations may be hard to predict based on recent findings in Asian populations.
In this study, we used a time-stratified case-crossover design to investigate the associations between acute exposure to airborne particulate matter and gaseous air pollutants (nitrogen dioxide and sulfur dioxide) and suicide risk among completed suicides occurring in Salt Lake County, Utah, from 2000 to 2010. The Salt Lake Valley regularly experiences wintertime inversions (a product of its geography and weather), in which a mass of trapped cold air blankets the valley floor. These intermittent inversions are often characterized by an accumulation of air pollutants with daily average levels exceeding the Environmental Protection Agency's National Ambient Air Quality Standards (8). Researchers have used data from these winter inversion events, in contrast with data from improved wintertime air quality days, to describe associations between air pollution and increased rates of daily mortality (9), hospital admissions for respiratory disease (10), and emergency department visits for asthma (11). We hypothesized that Salt Lake County's poor wintertime air quality might show similar adverse associations with risk of suicide completion.
Our primary objectives in this study were to investigate the suicide risk associated with short-term air pollution exposure. In addition, we examined how the relationship between acute air pollution and suicide risk varied by suicide characteristics, including season, method of death (violent vs. nonviolent), sex, and age.
METHODS
Data on suicide decedents
The Utah Department of Health's Office of the Medical Examiner provided data on all completed suicides occurring in Salt Lake County, Utah, between January 1, 2000, and December 31, 2010 (n = 1,546; Table 1). Data acquired on each suicide decedent included date of death, age, sex, and method of death. Age was categorized on the basis of similar published studies (5). Method of death was classified as violent or nonviolent. Nonviolent methods of death included drug overdose, drowning, poisoning, and gas; all other methods of death were categorized as violent.
Table 1.
Characteristics of Decedents in 1,546 Completed Suicides, Salt Lake County, Utah, 2000–2010
| Characteristic | Males (n = 1,210) |
Females (n = 336) |
||
|---|---|---|---|---|
| No. | % | No. | % | |
| Age, years | ||||
| ≤35 | 506 | 41.8 | 122 | 36.3 |
| 36–64 | 575 | 47.5 | 198 | 58.9 |
| ≥65 | 128 | 10.6 | 15 | 4.5 |
| Missing data | 1 | 0.1 | 1 | 0.3 |
| Season | ||||
| Spring | 334 | 27.6 | 74 | 22.0 |
| Summer | 293 | 24.2 | 89 | 26.5 |
| Fall | 317 | 26.2 | 99 | 29.5 |
| Winter | 266 | 22.0 | 74 | 22.0 |
| Method of deatha | ||||
| Violent | 1,016 | 84.0 | 173 | 51.5 |
| Nonviolent | 193 | 16.0 | 161 | 47.9 |
| Missing data | 1 | 0.1 | 2 | 0.6 |
a Nonviolent methods of death included drug overdose, drowning, poisoning, and gas; all other methods of death were categorized as violent.
Air pollution and meteorological data
Data on 4 air pollutants—including nitrogen dioxide (2 monitors), particulate matter with an aerodynamic diameter ≤2.5 μm (PM2.5; 4 monitors), particulate matter with an aerodynamic diameter ≤10 μm (PM10; 4 monitors), and sulfur dioxide (3 monitors)—were acquired for the study period (December 29, 1999–December 31, 2010) from the Environmental Protection Agency's AirData website (http://www.epa.gov/airquality/airdata/). The daily exposure to air pollutants assigned to Salt Lake County residents from January 1, 2000, to December 31, 2010, was estimated by averaging hourly air pollution measures across all monitors for a particular pollutant. Data were 99.9% complete for PM2.5, 71.5% complete for PM10, 94.9% complete for nitrogen dioxide, and 95.9% complete for sulfur dioxide during the study period. Multiple imputation of missing air pollutant data was conducted in SAS, version 9.3 (SAS Institute, Inc., Cary, North Carolina) using PROC MI. Five copies of the original data set were made and 5 estimates of missing data were generated, producing 5 complete data sets available for the analysis.
Meteorological data on daily mean temperature (°F), daily mean dew point temperature (°F), and daily mean air pressure (mb) for Salt Lake City International Airport were downloaded from the National Oceanic and Atmospheric Administration's National Climatic Data Center (Global Surface Summary of the Day data (https://data.noaa.gov/dataset/global-surface-summary-of-the-day-gsod)). Information on mean daily sunlight (KJ/m2) for Salt Lake County was downloaded from the Centers for Disease Control and Prevention's WONDER website (http://wonder.cdc.gov/).
Statistical analyses
A time-stratified case-crossover design (12) was used to examine the relationship between suicide risk and air pollutant exposure among suicide decedents who had resided in Salt Lake County, Utah. The day of the suicide was selected as the case period, and the control period consisted of all days falling on the same day of the week within the same month as the case period. Each control period per case period was comprised of 3 or 4 control days. The time-stratified design was selected because it is not subject to time-trend bias and because it controls for seasonality, day of the week, and cross-subject variability (13).
Conditional logistic regression models were formulated to measure the association of individual air pollutants (nitrogen dioxide, PM2.5, PM10, and sulfur dioxide) with suicide risk, as represented by the odds ratios and 95% confidence intervals related to an interquartile-range (IQR) increase in mean air pollutant concentration. The strength of the relationship was also measured as the percent change in suicide odds associated with an IQR increase in pollutant concentration. A series of models were fitted considering exposure to single-lag and cumulative-lag air pollution values. The single-lag models examined the relationship between suicide risk and air pollutant concentration on the day of the suicide (lag day 0) and on each of the 3 days preceding the suicide (lag day 1, lag day 2, and lag day 3). For the cumulative-lag models, 3 cumulative pollutant concentrations were estimated separately for each pollutant, where cumulative lag 1 was defined as the average concentration for the day of the suicide and the day preceding the suicide, cumulative lag 2 was the average concentration for the day of the suicide and the 2 days preceding the suicide, and cumulative lag 3 was the average for the day of the suicide and the 3 days preceding the suicide.
The models included adjustment for the confounding effects of meteorological variables, including average daily sunlight during the previous 3 days, daily mean temperature, daily mean temperature for the previous 3 days, mean dew point temperature, mean dew point temperature for the previous 3 days, daily mean air pressure, and daily mean air pressure for the previous 3 days. All meteorological variables except average daily sunlight were cubic spline–transformed prior to being added to the models.
Further analyses were performed to evaluate variation in the strength of the association between acute exposure to nitrogen dioxide and PM2.5 and suicide risk on lag days 2 and 3 and during cumulative lags 2 and 3 by suicide characteristic or population subgroup. In this secondary analysis, data in the models were stratified by age group (≤35 years, 36–64 years, or ≥65 years), sex, season of death (spring, summer, fall, or winter), and method of death (violent vs. nonviolent). To allow for comparison of this study's findings with those of the Kim et al. study (5) by season, we also categorized season of death into 2 periods: winter/summer (the “stable period”) and spring/fall (the “transition period”).
Separate models were formulated for each of the 5 data sets in which missing data were imputed. The MIANALYZE procedure in SAS 9.3 was used to combine model output and to generate overall parameter estimates and standard errors. Institutional review board–exempted approval was obtained for this study from the University of Utah.
RESULTS
Study characteristics
The case and control periods included the 1,546 case days and 4,297 control days. The sample of completed suicides that occurred in Salt Lake County during the study period was comprised predominately of males (78%). For both males and females, the majority of completed suicides occurred in the age group 36–64 years (48% for males and 59% for females). The largest percentage of suicides occurred in the spring for males (28%) and in the fall for females (30%). Suicides were fewest in the winter for both males (22%) and females (22%). Violent methods of death were proportionally more common among men (84%) than among women (52%; Table 1).
Air pollution concentrations
The distributions of air pollutant concentrations during case and control periods are shown in Table 2. Differences in mean air pollution concentrations between case and control periods were found for nitrogen dioxide on lag day 2 (P = 0.04), on lag day 3 (P = 0.02), during cumulative lag 2 (P = 0.03), and during cumulative lag 3 (P = 0.02) (Table 2). Mean air pollution concentrations during case periods were higher than mean air pollution concentrations during control periods for the majority of the air pollutants, except for PM2.5 on lag day 0 (the actual day of the suicide; mean difference = −0.06) and sulfur dioxide on lag day 3 (mean difference = −0.03). Among case periods, PM2.5 and nitrogen dioxide pollutants displayed a pattern of increasing concentration with increasing lag and cumulative lag times. This pattern was not observed for PM2.5 and nitrogen dioxide pollutants during the control periods.
Table 2.
Mean Air Pollution Concentrations and Mean Differences in Air Pollution Concentrations Between Case and Control Periods for All Completed Suicides, Salt Lake County, Utah, 2000–2010
| Pollutant and Measure | Mean (SD) Pollutant Concentration |
Mean Difference in Pollutant Concentration | Interquartile Range | P Value | |
|---|---|---|---|---|---|
| Case Periods | Control Periods | ||||
| PM2.5, μg/m3 | |||||
| LD 0 | 10.99 (10.5) | 11.05 (10.3) | −0.06 | 5.6–11.6 | 0.84 |
| LD 1 | 11.18 (10.5) | 11.01 (10.4) | 0.17 | 5.6–11.7 | 0.57 |
| LD 2 | 11.33 (10.7) | 10.95 (10.4) | 0.38 | 5.7–11.7 | 0.22 |
| LD 3 | 11.38 (11.0) | 11.10 (10.8) | 0.28 | 5.6–11.5 | 0.38 |
| CL 1 | 11.18 (10.5) | 11.01 (10.4) | 0.17 | 5.6–11.7 | 0.57 |
| CL 2 | 11.23 (10.0) | 10.95 (9.8) | 0.28 | 5.8–11.7 | 0.33 |
| CL 3 | 11.26 (9.8) | 10.99 (9.6) | 0.27 | 6.0–11.8 | 0.33 |
| PM10, μg/m3 | |||||
| LD 0 | 33.16 (18.7) | 32.84 (20.1) | 0.32 | 19.5–41.3 | 0.63 |
| LD 1 | 33.18 (19.4) | 32.46 (20.3) | 0.72 | 19.5–40.7 | 0.30 |
| LD 2 | 33.21 (18.7) | 32.21 (21.3) | 1.00 | 19.3–40.0 | 0.14 |
| LD 3 | 33.01 (18.6) | 32.30 (20.0) | 0.71 | 19.0–40.5 | 0.29 |
| CL 1 | 33.18 (19.4) | 32.46 (20.3) | 0.72 | 19.5–40.7 | 0.30 |
| CL 2 | 33.21 (17.5) | 32.40 (18.7) | 0.81 | 20.3–40.6 | 0.17 |
| CL 3 | 33.00 (16.4) | 32.28 (16.9) | 0.72 | 20.9–39.3 | 0.18 |
| Nitrogen dioxide, ppb | |||||
| LD 0 | 39.34 (11.2) | 39.23 (11.3) | 0.11 | 32.0–46.0 | 0.75 |
| LD 1 | 39.57 (11.5) | 39.05 (11.4) | 0.52 | 32.0–45.5 | 0.13 |
| LD 2 | 39.65 (11.4) | 38.94 (11.3) | 0.72 | 32.0–45.5 | 0.04 |
| LD 3 | 39.72 (11.4) | 38.91 (11.6) | 0.81 | 32.0–45.5 | 0.02 |
| CL 1 | 39.57 (11.5) | 39.05 (11.4) | 0.52 | 32.0–45.5 | 0.13 |
| CL 2 | 39.65 (10.6) | 38.98 (10.5) | 0.67 | 32.3–45.3 | 0.03 |
| CL 3 | 39.66 (10.0) | 38.94 (9.9) | 0.72 | 32.7–44.8 | 0.02 |
| Sulfur dioxide, ppb | |||||
| LD 0 | 7.90 (5.1) | 7.87 (5.3) | 0.03 | 4.7–9.7 | 0.83 |
| LD 1 | 8.02 (4.9) | 7.85 (5.1) | 0.17 | 4.7–10.0 | 0.24 |
| LD 2 | 7.96 (4.8) | 7.94 (5.3) | 0.02 | 4.7–10.0 | 0.88 |
| LD 3 | 7.98 (5.3) | 8.00 (5.4) | −0.03 | 4.7–10.0 | 0.87 |
| CL 1 | 8.02 (4.9) | 7.85 (5.1) | 0.17 | 4.7–10.0 | 0.24 |
| CL 2 | 7.98 (4.1) | 7.88 (4.3) | 0.10 | 5.0–9.8 | 0.42 |
| CL 3 | 7.97 (3.8) | 7.90 (3.9) | 0.06 | 5.2–9.9 | 0.57 |
Abbreviations: CL, cumulative lag; LD, lag day; PM2.5, particulate matter with an aerodynamic diameter ≤2.5 μm; PM10, particulate matter with an aerodynamic diameter ≤10 μm; ppb, parts per billion; SD, standard deviation.
Statistical models
Figure 1 displays the percent change in odds of suicide associated with IQR increases in nitrogen dioxide, PM2.5, PM10, and sulfur dioxide for the entire study sample. An increased risk of suicide was associated with IQR increases in the mean nitrogen dioxide concentration on lag day 2 (odds ratio (OR) = 1.13, 95% confidence interval (CI): 1.01, 1.27), on lag day 3 (OR = 1.16, 95% CI: 1.05, 1.28), and during cumulative lag 3 (OR = 1.20, 95% CI: 1.04, 1.39). An increased risk of suicide was also associated with IQR increases in the mean PM2.5 concentration on lag day 2 (OR = 1.05, 95% CI: 1.01, 1.10). The point estimate for percent change in the relative odds of suicide associated with IQR increases in mean pollutant concentrations was greater than 0% for all pollutant/lag combinations except PM10 on lag day 0 and sulfur dioxide on lag days 0 and 3.
Figure 1.
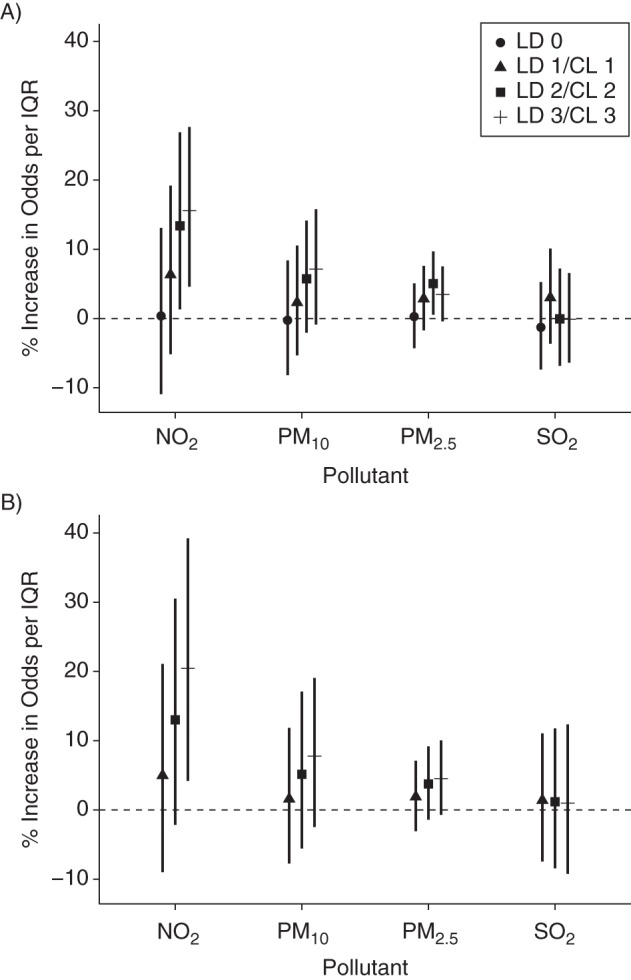
Percent change in the odds of suicide associated with interquartile-range (IQR) increases in exposure to nitrogen dioxide (NO2), particulate matter with an aerodynamic diameter ≤10 μm (PM10), particulate matter with an aerodynamic diameter ≤2.5 μm (PM2.5), and sulfur dioxide (SO2) on lag days (LDs) 0 (day of the suicide), 1, 2, and 3 (A) and during cumulative lags (CLs) 1, 2, and 3 (B), Salt Lake County, Utah, 2000–2010. The results were adjusted for average daily sunlight during the previous 3 days, daily mean temperature, daily mean temperature for the previous 3 days, mean dew point temperature, mean dew point temperature for the previous 3 days, daily mean air pressure, and daily mean air pressure for the previous 3 days.
We investigated how the association between short-term air pollution exposure and suicide risk varied by suicide characteristic and subgroup membership, including season, age, sex, and method of death (Table 3). Our analysis showed that the increased risk of suicide associated with exposure to both nitrogen dioxide and PM2.5 was strongest among males. The risk of suicide was also heightened among persons aged 36–64 years who had been exposed to nitrogen dioxide on lag day 3 and during cumulative lags 2 and 3 and exposed to PM2.5 on lag day 2. Variation by season was found, as the risk of suicide increased following exposure to PM2.5 in the spring and during the spring/fall transition period on lag day 2. The risk of suicide following acute exposure to nitrogen dioxide was heightened in the fall on lag day 3 and in the transition period during cumulative lag 3. Finally, violent deaths were associated with an increased risk of suicide following acute exposure to both PM2.5 and nitrogen dioxide on lag days 2 and 3 and during cumulative lag 3.
Table 3.
Adjusted Odds of Suicide Associated With Interquartile-Range Increases in PM2.5 and Nitrogen Dioxide Concentrations, by Lag and Subgroup, Salt Lake County, Utah, 2000–2010
| Subgroup and Air Pollutant | Lag or Lag Period |
|||||||
|---|---|---|---|---|---|---|---|---|
| Lag Day 2 |
Lag Day 3 |
Cumulative Lag 2 |
Cumulative Lag 3 |
|||||
| ORa | 95% CI | ORa | 95% CI | ORa | 95% CI | ORa | 95% CI | |
| Sex | ||||||||
| Male | ||||||||
| PM2.5 | 1.06 | 1.01, 1.12 | 1.06 | 1.01, 1.10 | 1.05 | 0.99, 1.11 | 1.06 | 1.00, 1.13 |
| NO2 | 1.18 | 1.04, 1.34 | 1.19 | 1.06, 1.33 | 1.16 | 0.98, 1.36 | 1.25 | 1.07, 1.47 |
| Female | ||||||||
| PM2.5 | 1.00 | 0.91, 1.09 | 0.95 | 0.87, 1.04 | 0.99 | 0.89, 1.11 | 0.97 | 0.87, 1.09 |
| NO2 | 0.97 | 0.76, 1.23 | 1.04 | 0.83, 1.29 | 1.03 | 0.75, 1.40 | 1.04 | 0.77, 1.41 |
| Age, years | ||||||||
| ≤35 | ||||||||
| PM2.5 | 1.02 | 0.95, 1.09 | 1.03 | 0.97, 1.09 | 1.04 | 0.96, 1.13 | 1.04 | 0.96, 1.13 |
| NO2 | 1.08 | 0.91, 1.28 | 1.06 | 0.90, 1.24 | 1.21 | 0.96, 1.51 | 1.20 | 0.96, 1.51 |
| 36–64 | ||||||||
| PM2.5 | 1.07 | 1.01, 1.15 | 1.03 | 0.97, 1.09 | 1.03 | 0.95, 1.11 | 1.03 | 0.96, 1.12 |
| NO2 | 1.15 | 0.97, 1.37 | 1.20 | 1.05, 1.39 | 1.01 | 0.82, 1.25 | 1.13 | 0.92, 1.39 |
| ≥65 | ||||||||
| PM2.5 | 1.06 | 0.91, 1.24 | 1.09 | 0.96, 1.24 | 1.00 | 0.81, 1.22 | 1.05 | 0.86, 1.28 |
| NO2 | 1.16 | 0.78, 1.72 | 1.36 | 0.96, 1.94 | 1.26 | 0.75, 2.13 | 1.51 | 0.88, 2.58 |
| Season | ||||||||
| Spring | ||||||||
| PM2.5 | 1.18 | 1.01, 1.38 | 1.08 | 0.94, 1.25 | 1.25 | 1.00, 1.56b | 1.28 | 1.01, 1.61 |
| NO2 | 1.23 | 0.98, 1.53 | 1.17 | 0.95, 1.45 | 1.28 | 0.92, 1.77 | 1.41 | 1.00, 1.99b |
| Summer | ||||||||
| PM2.5 | 1.05 | 0.86, 1.27 | 0.99 | 0.80, 1.21 | 1.02 | 0.79, 1.33 | 1.02 | 0.76, 1.35 |
| NO2 | 1.14 | 0.87, 1.50 | 1.06 | 0.83, 1.36 | 1.01 | 0.71, 1.44 | 1.05 | 0.73, 1.51 |
| Fall | ||||||||
| PM2.5 | 1.08 | 0.95, 1.22 | 1.05 | 0.94, 1.18 | 1.08 | 0.94, 1.25 | 1.09 | 0.94, 1.26 |
| NO2 | 1.08 | 0.87, 1.33 | 1.31 | 1.04, 1.65 | 1.17 | 0.87, 1.57 | 1.30 | 0.98, 1.73 |
| Winter | ||||||||
| PM2.5 | 1.00 | 0.93, 1.07 | 1.01 | 0.96, 1.07 | 0.95 | 0.87, 1.04 | 0.97 | 0.89, 1.06 |
| NO2 | 1.03 | 0.83, 1.28 | 1.04 | 0.88, 1.23 | 0.94 | 0.71, 1.26 | 0.98 | 0.75, 1.29 |
| Transition period (spring/fall) | ||||||||
| PM2.5 | 1.11 | 1.01, 1.22 | 1.06 | 0.98, 1.16 | 1.10 | 0.99, 1.23 | 1.11 | 0.99, 1.25 |
| NO2 | 1.15 | 0.99, 1.33 | 1.24 | 1.07, 1.44 | 1.22 | 0.99, 1.51 | 1.35 | 1.09, 1.66 |
| Stable period (summer/winter) | ||||||||
| PM2.5 | 1.02 | 0.96, 1.08 | 1.02 | 0.97, 1.07 | 0.99 | 0.92, 1.07 | 1.00 | 0.93, 1.08 |
| NO2 | 1.09 | 0.93, 1.29 | 1.06 | 0.92, 1.22 | 1.02 | 0.82, 1.25 | 1.05 | 0.85, 1.30 |
| Method of deathc | ||||||||
| Violent | ||||||||
| PM2.5 | 1.07 | 1.02, 1.12 | 1.06 | 1.01, 1.10 | 1.06 | 1.00, 1.12b | 1.07 | 1.01, 1.13 |
| NO2 | 1.16 | 1.02, 1.32 | 1.20 | 1.06, 1.35 | 1.17 | 0.99, 1.37 | 1.27 | 1.07, 1.50 |
| Nonviolent | ||||||||
| PM2.5 | 1.02 | 0.93, 1.11 | 0.99 | 0.91, 1.07 | 1.00 | 0.90, 1.13 | 1.00 | 0.89, 1.11 |
| NO2 | 1.09 | 0.86, 1.38 | 1.08 | 0.88, 1.33 | 1.09 | 0.80, 1.50 | 1.13 | 0.83, 1.52 |
Abbreviations: CI, confidence interval; NO2, nitrogen dioxide; OR, odds ratio; PM2.5, particulate matter with an aerodynamic diameter ≤2.5 μm.
a Adjusted for average daily sunlight during the previous 3 days, daily mean temperature, daily mean temperature for the previous 3 days, mean dew point temperature, mean dew point temperature for the previous 3 days, daily mean air pressure, and daily mean air pressure for the previous 3 days.
b 95% CI excluded 1.00 before rounding to 2 decimal places.
c Nonviolent methods of death included drug overdose, drowning, poisoning, and gas; all other methods of death were categorized as violent.
DISCUSSION
To our knowledge, this is the first US-based study to have found an association between short-term air pollution exposure and heightened suicide risk. We found that increased suicide risk was associated with single-day and cumulative exposure to PM2.5 and nitrogen dioxide on and during the 2–3 days preceding a suicide in a sample of 1,546 completed suicides in Salt Lake County, Utah. Associations were strongest among males and persons aged 36–64 years. Suicide risk varied by season; it was heightened in both the spring and the spring/fall transition period following acute exposure to PM2.5 and in both the fall and the spring/fall transition period following acute exposure to nitrogen dioxide.
Previous research on suicide risk and air pollution is limited but includes investigations of the associations of criteria air pollutants with risk of suicide completion in the Republic of Korea (PM2.5 and PM10) (5) and Taiwan (nitrogen oxide, carbon monoxide, sulfur dioxide, PM10) (6) and with emergency room visits for suicide attempts in Vancouver, British Columbia, Canada (nitrogen dioxide, carbon monoxide, sulfur dioxide, PM10) (14). Our findings advance support for an influential role of air pollution in suicide risk, but the study was conducted in Salt Lake County, Utah, a location possessing different climatic, geographical, and cultural characteristics than the locations considered in previous studies.
In this study, we found statistically significant associations of IQR increases in PM2.5 (but not in PM10) with maximum increased suicide risks of 5% in the entire study population on lag day 2. In comparison, Kim et al. (5) found associations between IQR increases in both PM2.5 (10.1% maximum increase) and PM10 (9.0% maximum increase) and completed suicide, but the associations with PM10 were more consistent and were especially amplified during cumulative lags 1 and 2. Yang et al. (6) identified a link between PM10 exposure in the spring and suicide in the early summer, while Szyszkowicz et al. (14) measured an excess suicide-attempt risk of 16% in relation to an IQR increase in PM10 exposure during the cold period (October–March) on lag day 0 in males. Szyszkowicz et al. also explored the relationship between nitrogen dioxide exposure and suicide attempts and found a maximum increased risk of 23.9% among males exposed to nitrogen dioxide during the cold period on lag day 1 (14). In our study, which explored the link between nitrogen dioxide and completed suicide, transient exposure to an IQR increase in nitrogen dioxide was associated with maximum increased suicide risks of 20% in the entire study population and 25% among males during cumulative lag 3.
A number of mechanisms have been proposed to explain the deleterious association between air pollutants, including fine particulate matter (PM2.5) and nitrogen dioxide, and suicide risk. Both PM2.5 and nitrogen dioxide may pose risks to physical and mental health, because they can efficiently permeate the thoracic airways due to their small size (15). They are potent oxidants, and their inhalation has been shown to reduce respiratory function, leading to decreased oxygen saturation, oxidative stress, and hypoxemia (16, 17). Studies of hypobaric hypoxia have shown that exposure can cause an increase in brain dopamine and tyrosine hydroxylase levels and a decrease in serotonin and tryptophan hydroxylase levels (18). Decreased levels of serotonin have been implicated in the neurobiology of suicide (19).
Fine particulate matter and nitrogen dioxide also have strong inflammatory effects (20) and may increase suicide risk by altering the functioning of the central nervous system through a proinflammatory response pathway. Inflammatory responses are linked to the pathophysiology of depression through the release of proinflammatory cytokines (21). Persons whose depression is exacerbated by air pollutants may be at increased risk for suicide. Similarly, exposure to PM2.5 has been shown to exacerbate physical health conditions such as cardiovascular and respiratory illness (22). Exacerbation of preexisting physical health conditions can trigger depression and depressive symptoms, which may ultimately increase a person's risk of suicide (23).
Although nitrogen dioxide and particulate matter share plausible biological mechanisms with regard to suicide, more research attention has historically been paid to the detrimental health effects of particulate matter than to those of nitrogen dioxide. However, both particulate matter exposure and nitrogen dioxide exposure have been linked to emergency room visits for depression and symptoms of depression (24, 25). Further, outdoor PM2.5 and nitrogen dioxide concentrations have been found to be highly correlated, as they are both products of industrial and domestic combustion (26). This correlation can make it challenging to separate the contributions of individual pollutants (27), and investigators have reported that correlated air pollutants can have confounding (28) or modifying (29) effects. In contrast, other studies have found that controlling for multiple pollutants in an analysis did not have substantial impacts on an individual pollutant's risk estimate (25, 30).
In this study, suicide risk fluctuated with season and peaked in the spring (PM2.5) and during the spring/fall transition period (nitrogen dioxide). The springtime peak observed in this study is consistent with the seasonality patterns associated with suicide rates—a well-documented phenomenon (31, 32) that is often attributed to the effects of meteorological factors (3). In this and previous studies (5, 14), heightened suicide risk during the spring and the transition period persisted after controlling for the confounding effects of meteorological variables.
Salt Lake County, Utah, experiences wintertime temperature inversions that trap air pollutants, principally particulate matter, in a layer of cold air (33), a scenario which has been associated with poor physical health outcomes (9–11). Because particulate matter concentrations peak during the winter in Salt Lake County (34), we expected air pollution to be associated with the greatest risk of suicide during the winter. However, our findings did not support this hypothesis. In contrast, the suicide risk peaks observed during the spring and the transition period suggested that air pollution may interact with additional spring or spring/fall suicide risk factors to increase risk among susceptible individuals, such as those with certain psychiatric conditions (e.g., mood disorders) (35) or pollen allergies (36).
This study supports previous findings that males (5, 14) and persons aged 35–64 years (5) are subgroups for which the association between air pollution and suicide is especially strong. In the United States, men are at greater risk for suicide than women and, in general, suicide risk increases linearly with age (37). Persons in these subgroups may be more sensitive to air pollution because their exposure is greater. Alternatively, the individual-level susceptibility factors that increase a person's risk following exposure may be more common among men and persons aged 36–64 years. Conversely, limited sample sizes may have precluded the identification of heightened suicide risk in other subgroups, as insufficient power for detecting associations can be an issue in case-crossover analyses (38).
Although many of our findings are consistent with previous studies, there are a few possible explanations for between-study discrepancies. First, our daily PM10 data were 71.5% complete for our study period, and multiple imputation was conducted to estimate missing data. However, the approach we took of imputing a data set missing 30% of its data 5 times was expected to yield estimates with 94% precision (39), which suggests that incompleteness of PM10 data was not a study limitation. Second, air pollution compositions are likely to vary within and across urban study sites as a result of differences in meteorological, topographical, and environmental variables and differences in the type and location of emission sources (40). We and previous investigators used citywide (5, 6, 14) or countywide daily average air pollutant concentrations to assign individual exposures, which may have biased estimates of association towards the null (41). To reduce bias, future studies should use air pollution exposure assessment tools with finer spatial and temporal resolution to characterize individual exposure, such as land-use regression models (42, 43) or interpolation methods (44). Third, population-level differences, including the incidence of comorbid conditions and personal risk factors, may be partly responsible for discrepancies between locations. In particular, Kim et al. (5) showed that the association with PM10 exposure was especially acute in persons with cardiovascular disease. However, the incidence of conditions such as cardiovascular disease varies geographically among populations (45) and may be considerably different between the Republic of Korea and Salt Lake County, Utah. Although our use of individual-level data was a study strength, we did not have access to data on other valuable individual-level characteristics, including the presence of physical and mental comorbidity, smoking behavior, and socioeconomic class. Another study limitation may have been the potential misclassification of some nonsuicide deaths as suicides. However, the Utah Department of Health's Office of the Medical Examiner considers interview data and evidence from the site of death in determining whether suicide was a cause of death, which may minimize misclassification. Air pollution data for this study were specific to Salt Lake County, Utah, and findings may not be generalizable to other parts of Utah or to the United States as a whole. Finally, exposure to air pollutants was assumed to occur among residents of Salt Lake County; alternative sources of air pollution exposure, including occupational and household exposures, were not considered in this study.
This study focused on suicide decedents and did not include persons who attempted suicide, because these 2 groups share some risk factors (e.g., the presence of a psychiatric diagnosis) but also have distinct risk factors (e.g., sex, the presence of stressful life events) (46–48). We hypothesize that the relationship between air pollution and suicide differs between attempters and completers and that these differences are biologically meaningful. Variation in findings between our study and that of Szyszkowicz et al. (14), which explored the relationship between ambient air pollution and suicide attempts, suggests that this might be the case.
In summary, we identified an increased risk of suicide associated with acute exposure to nitrogen dioxide and PM2.5 during the days preceding suicide in Salt Lake County, Utah. Previous studies of completed suicide focused largely on the relationship with particulate matter, and to our knowledge this was the first study to explicitly explore nitrogen dioxide's role. In the context of prior studies of air pollution and suicide, findings of overall positive associations between air pollution and suicide are consistent. Thus, the observed association appears to be present across environments with different meteorological conditions, geographical features, and population attributes.
ACKNOWLEDGMENTS
Author affiliations: Department of Psychiatry, School of Medicine, University of Utah, Salt Lake City, Utah (Amanda V. Bakian, Hilary Coon, Douglas Gray, William M. McMahon, Perry F. Renshaw); The Brain Institute, University of Utah, Salt Lake City, Utah (Rebekah S. Huber, Perry F. Renshaw); Veterans Integrated Service Network 19, Mental Illness Research, Education, and Clinical Center, George E. Whalen Department of Veterans Affairs Medical Center, Salt Lake City, Utah (Douglas Gray, Perry F. Renshaw); and Intermountain Health Care, Salt Lake City, Utah (Phillip Wilson).
This work was supported by Veterans Integrated Service Network 19 (Mental Illness Research, Education, and Clinical Center), the Utah Science Technology and Research Initiative, grant R01MH099134 from the National Institute of Mental Health, and grant DA031247 from the National Institute on Drug Abuse. Research support was provided by the Department of Psychiatry at the University of Utah School of Medicine.
We thank the Utah Department of Health's Office of the Medical Examiner, especially Shannon Skiles, for providing data essential to this study. We thank Dr. Carol Sweeney for her feedback on a previous version of the manuscript.
Partial findings from this study were presented at the 47th Annual Conference of the American Association of Suicidology, Los Angeles, California, April 10–12, 2014.
The views presented in this paper are those of the authors and do not necessarily represent the official policy or position of the Department of Veterans Affairs or the US government.
Conflict of interest: none declared.
REFERENCES
- 1.Centers for Disease Control and Prevention. Suicide among adults aged 35–64 years—United States, 1999–2000. MMWR Morb Mortal Wkly Rep. 2013;62(17):321–325. [PMC free article] [PubMed] [Google Scholar]
- 2.Utah Department of Health. Utah Health Status Update: Leading Causes of Mortality and Morbidity in Utah. Salt Lake City, UT: Utah Department of Health; 2010. http://health.utah.gov/opha/publications/hsu/10Oct_LCMM.pdf . Accessed July 29, 2014. [Google Scholar]
- 3.Petridou E, Papadopoulos FC, Frangakis CE, et al. A role of sunshine in the triggering of suicide. Epidemiology. 2002;13(1):106–109. doi: 10.1097/00001648-200201000-00017. [DOI] [PubMed] [Google Scholar]
- 4.Nicholls N, Butler CD, Hanigan I. Inter-annual rainfall variations and suicide in New South Wales, Australia, 1964–2001. Int J Biometeorol. 2006;50(3):139–143. doi: 10.1007/s00484-005-0002-y. [DOI] [PubMed] [Google Scholar]
- 5.Kim C, Jung SH, Kang DR, et al. Ambient particulate matter as a risk factor for suicide. Am J Psychiatry. 2010;167(9):1100–1107. doi: 10.1176/appi.ajp.2010.09050706. [DOI] [PubMed] [Google Scholar]
- 6.Yang AC, Tsai SJ, Huang NE. Decomposing the association of completed suicide with air pollution, weather, and unemployment data at different time scales. J Affect Disord. 2011;129(1-3):275–281. doi: 10.1016/j.jad.2010.08.010. [DOI] [PubMed] [Google Scholar]
- 7.Chen YY, Wu KC, Yousuf S, et al. Suicide in Asia: opportunities and challenges. Epidemiol Rev. 2012;34(1):129–144. doi: 10.1093/epirev/mxr025. [DOI] [PubMed] [Google Scholar]
- 8.Silcox GD, Kelly KE, Crosman ET, et al. Wintertime PM2.5 concentrations during persistent, multi-day cold-air pools in a mountain valley. Atmos Environ. 2012;46:17–24. [Google Scholar]
- 9.Pope CA, 3rd, Hill RW, Villegas GM. Particulate air pollution and daily mortality on Utah's Wasatch Front. Environ Health Perspect. 1999;107(7):567–573. doi: 10.1289/ehp.99107567. [DOI] [PMC free article] [PubMed] [Google Scholar]
- 10.Pope CA., 3rd Respiratory disease associated with community air pollution and a steel mill, Utah Valley. Am J Public Health. 1989;79(5):623–628. doi: 10.2105/ajph.79.5.623. [DOI] [PMC free article] [PubMed] [Google Scholar]
- 11.Beard JD, Beck C, Graham R, et al. Winter temperature inversions and emergency department visits for asthma in Salt Lake County, Utah, 2003–2008. Environ Health Perspect. 2012;120(10):1385–1390. doi: 10.1289/ehp.1104349. [DOI] [PMC free article] [PubMed] [Google Scholar]
- 12.Levy D, Lumley T, Sheppard L, et al. Referent selection in case-crossover analyses of acute health effects of air pollution. Epidemiology. 2001;12(2):186–192. doi: 10.1097/00001648-200103000-00010. [DOI] [PubMed] [Google Scholar]
- 13.Janes H, Sheppard L, Lumley T. Case-crossover analyses of air pollution exposure data: referent selection strategies and their implications for bias. Epidemiology. 2005;16(6):717–726. doi: 10.1097/01.ede.0000181315.18836.9d. [DOI] [PubMed] [Google Scholar]
- 14.Szyszkowicz M, Willey JB, Grafstein E, et al. Air pollution and emergency department visits for suicide attempts in Vancouver, Canada. Environ Health Insights. 2010;4:79–86. doi: 10.4137/EHI.S5662. [DOI] [PMC free article] [PubMed] [Google Scholar]
- 15.Pope CA., 3rd Epidemiology of fine particulate air pollution and human health: biologic mechanisms and who's at risk? Environ Health Perspect. 2000;108(suppl 4):713–723. doi: 10.1289/ehp.108-1637679. [DOI] [PMC free article] [PubMed] [Google Scholar]
- 16.DeMeo DL, Zanobetti A, Litonjua AA, et al. Ambient air pollution and oxygen saturation. Am J Respir Crit Care Med. 2004;170(4):383–387. doi: 10.1164/rccm.200402-244OC. [DOI] [PubMed] [Google Scholar]
- 17.Gong H, Jr, Linn WS, Clark KW, et al. Respiratory responses to exposures with fine particulates and nitrogen dioxide in the elderly with and without COPD. Inhal Toxicol. 2005;17(3):123–132. doi: 10.1080/08958370590904481. [DOI] [PubMed] [Google Scholar]
- 18.Ray K, Dutta A, Panjwani U, et al. Hypobaric hypoxia modulates brain biogenic amines and disturbs sleep architecture. Neurochem Int. 2011;58(1):112–118. doi: 10.1016/j.neuint.2010.11.003. [DOI] [PubMed] [Google Scholar]
- 19.Pandey GN. Biological basis of suicide and suicidal behavior. Bipolar Disord. 2013;15(5):524–541. doi: 10.1111/bdi.12089. [DOI] [PMC free article] [PubMed] [Google Scholar]
- 20.Salvi S, Blomberg A, Rudell B, et al. Acute inflammatory responses in the airways and peripheral blood after short-term exposure to diesel exhaust in healthy human volunteers. Am J Respir Crit Care Med. 1999;159(3):702–709. doi: 10.1164/ajrccm.159.3.9709083. [DOI] [PubMed] [Google Scholar]
- 21.Smith RS. The macrophage theory of depression. Med Hypotheses. 1991;35(4):298–306. doi: 10.1016/0306-9877(91)90272-z. [DOI] [PubMed] [Google Scholar]
- 22.Dominici F, Peng RD, Bell ML, et al. Fine particulate air pollution and hospital admission for cardiovascular and respiratory diseases. JAMA. 2006;295(10):1127–1134. doi: 10.1001/jama.295.10.1127. [DOI] [PMC free article] [PubMed] [Google Scholar]
- 23.Dantzer R, O'Connor JC, Freund GG, et al. From inflammation to sickness and depression: when the immune system subjugates the brain. Nat Rev Neurosci. 2008;9(1):46–56. doi: 10.1038/nrn2297. [DOI] [PMC free article] [PubMed] [Google Scholar]
- 24.Szyszkowicz M, Rowe BH, Colman I. Air pollution and daily emergency department visits for depression. Int J Occup Med Environ Health. 2009;22(4):355–362. doi: 10.2478/v10001-009-0031-6. [DOI] [PubMed] [Google Scholar]
- 25.Lim YH, Kim H, Kim JH, et al. Air pollution and symptoms of depression in elderly adults. Environ Health Perspect. 2012;120(7):1023–1028. doi: 10.1289/ehp.1104100. [DOI] [PMC free article] [PubMed] [Google Scholar]
- 26.Sarnat JA, Schwartz J, Catalano PJ, et al. Gaseous pollutants in particulate matter epidemiology: confounders or surrogates? Environ Health Perspect. 2001;109(10):1053–1061. doi: 10.1289/ehp.011091053. [DOI] [PMC free article] [PubMed] [Google Scholar]
- 27.Seaton A, Dennekamp M. Hypothesis: ill health associated with low concentrations of nitrogen dioxide—an effect of ultrafine particles? Thorax. 2003;58(12):1012–1015. doi: 10.1136/thorax.58.12.1012. [DOI] [PMC free article] [PubMed] [Google Scholar]
- 28.Bell ML, Kim JY, Dominici F. Potential confounding of particulate matter on the short-term association between ozone and mortality in multisite time-series studies. Environ Health Perspect. 2007;115(11):1591–1595. doi: 10.1289/ehp.10108. [DOI] [PMC free article] [PubMed] [Google Scholar]
- 29.Katsouyanni K, Touloumi G, Samoli E, et al. Confounding and effect modification in the short-term effects of ambient particles on total mortality: results from 29 European cities within the APHEA2 project. Epidemiology. 2001;12(5):521–531. doi: 10.1097/00001648-200109000-00011. [DOI] [PubMed] [Google Scholar]
- 30.Schwartz J. Assessing confounding, effect modification, and thresholds in the association between ambient particles and daily deaths. Environ Health Perspect. 2000;108(6):563–568. doi: 10.1289/ehp.00108563. [DOI] [PMC free article] [PubMed] [Google Scholar]
- 31.Kevan SM. Perspectives on season of suicide: a review. Soc Sci Med Med Geogr. 1980;14(4):369–378. doi: 10.1016/0160-8002(80)90005-2. [DOI] [PubMed] [Google Scholar]
- 32.Chew KS, McCleary R. The spring peak in suicides: a cross-national analysis. Soc Sci Med. 1995;40(2):223–230. doi: 10.1016/0277-9536(94)e0070-9. [DOI] [PubMed] [Google Scholar]
- 33.Wallace J, Kanaroglou P. The effect of temperature inversions on ground-level nitrogen dioxide (NO2) and fine particulate matter (PM2.5) using temperature profiles from the Atmospheric Infrared Sounder (AIRS) Sci Total Environ. 2009;407(18):5085–5095. doi: 10.1016/j.scitotenv.2009.05.050. [DOI] [PubMed] [Google Scholar]
- 34.Kelly KE, Kotchenruther R, Kuprov R, et al. Receptor model source attributions for Utah's Salt Lake City airshed and the impacts of wintertime secondary ammonium nitrate and ammonium chloride aerosol. J Air Waste Manag Assoc. 2013;63(5):575–590. doi: 10.1080/10962247.2013.774819. [DOI] [PubMed] [Google Scholar]
- 35.Postolache TT, Mortensen PB, Tonelli LH, et al. Seasonal spring peaks of suicide in victims with and without prior history of hospitalization for mood disorders. J Affect Disord. 2010;121(1-2):88–93. doi: 10.1016/j.jad.2009.05.015. [DOI] [PMC free article] [PubMed] [Google Scholar]
- 36.Qin P, Waltoft BL, Mortensen PB, et al. Suicide risk in relation to air pollen counts: a study based on data from Danish registers. BMJ Open. 2013;3(5):e002462. doi: 10.1136/bmjopen-2012-002462. [DOI] [PMC free article] [PubMed] [Google Scholar]
- 37.Maris RW. Suicide. Lancet. 2002;360(9329):319–326. doi: 10.1016/S0140-6736(02)09556-9. [DOI] [PubMed] [Google Scholar]
- 38.Künzli N, Schindler C. A call for reporting the relevant exposure term in air pollution case-crossover studies. J Epidemiol Community Health. 2005;59(6):527–530. doi: 10.1136/jech.2004.027391. [DOI] [PMC free article] [PubMed] [Google Scholar]
- 39.Schafer JL, Olsen MK. Multiple imputation for multivariate missing-data problems: a data analyst's perspective. Multivariate Behav Res. 1998;33(4):545–571. doi: 10.1207/s15327906mbr3304_5. [DOI] [PubMed] [Google Scholar]
- 40.Wise EK, Comrie AC. Meteorologically adjusted urban air quality trends in the southwestern United States. Atmos Environ. 2005;39(16):2969–2980. [Google Scholar]
- 41.Thomas D, Stram D, Dwyer J. Exposure measurement error: influence on exposure-disease relationships and methods of correction. Annu Rev Public Health. 1993;14:69–93. doi: 10.1146/annurev.pu.14.050193.000441. [DOI] [PubMed] [Google Scholar]
- 42.Briggs DJ, Collins S, Elliot P, et al. Mapping urban air pollution using GIS: a regression-based approach. Int J Geogr Inf Sci. 1997;11(7):699–718. [Google Scholar]
- 43.Briggs D. The role of GIS: coping with space (and time) in air pollution exposure assessment. J Toxicol Environ Health A. 2005;68(13-14):1243–1261. doi: 10.1080/15287390590936094. [DOI] [PubMed] [Google Scholar]
- 44.Jerrett M, Burnett RT, Kanaroglou P, et al. A GIS–environmental justice analysis of particulate air pollution in Hamilton, Canada. Environ Plann A. 2001;33(6):955–973. [Google Scholar]
- 45.Yusuf S, Reddy S, Ounpuu S, et al. Global burden of cardiovascular diseases: part II: variations in cardiovascular disease by specific ethnic groups and geographic regions and prevention strategies. Circulation. 2001;104(23):2855–2864. doi: 10.1161/hc4701.099488. [DOI] [PubMed] [Google Scholar]
- 46.Beautrais AL. Suicides and serious suicide attempts: two populations or one? Psychol Med. 2001;31(5):837–845. doi: 10.1017/s0033291701003889. [DOI] [PubMed] [Google Scholar]
- 47.DeJong TM, Overholser JC, Stockmeier CA. Apples to oranges?: a direct comparison between suicide attempters and suicide completers. J Affect Disord. 2010;124(1-2):90–97. doi: 10.1016/j.jad.2009.10.020. [DOI] [PMC free article] [PubMed] [Google Scholar]
- 48.Giner L, Blasco-Fontecilla H, Mercedes Perez-Rodriguez M, et al. Personality disorders and health problems distinguish suicide attempters from completers in a direct comparison. J Affect Disord. 2013;151(2):474–483. doi: 10.1016/j.jad.2013.06.029. [DOI] [PubMed] [Google Scholar]