

Abstract
Great progress has been made in single cell genomics and transcriptomics. Here, we present an integrative method, termed Single-Cell Transcriptogenomics (SCTG), in which whole exome sequencing and RNA-seq is performed concurrently on single cells. This methodology enables one to track germline and somatic variants directly from the genome to the transcriptome in individual cells. Mouse embryonic fibroblasts were treated with the powerful mutagen ethylnitrosourea (ENU) and subjected to SCGT. Interestingly, while germline variants were found to be transcribed in an allelically balanced fashion, a significantly different pattern of allelic exclusion was observed for ENU-mutant variants. These results suggest that the adverse effects of induced mutations, in contrast to germline variants, may be mitigated by allelically biased transcription. They also illustrate how SCGT can be instrumental in the direct assessment of phenotypic consequences of genomic variants.
Keywords: SCTG, ENU, germline, somatic, SNV, allelic exclusion
1. Introduction
One of the central goals of biology is to elucidate the relationship between genotype and phenotype [1, 2]. Conventionally, DNA-directed RNA transcription is examined at the bulk level, tacitly assuming sample homogeneity. This is probably valid for germline variation, which is universally present throughout the organism, or somatic mutations in clonal lineages, but it does not hold for sporadic somatic mutations across tissues. Indeed, there is abundant evidence for extensive genetic mosaicism of somatic tissues [3–5], indicating the existence of profound cell-to-cell variation. Especially in functionally complex tissues this necessitates a single cell approach to dissect and examine the consequences of genomic heterogeneity.
With the advent of massively parallel sequencing (MPS), genome-wide mutation profiles can be obtained at single nucleotide resolution. MPS has been successfully used to identify de novo germline mutations across human generations [6, 7]. However, in contrast to germline variants, randomly occurring, low-abundance somatic mutations are very difficult to detect. When a heterogeneous tissue or cell population is examined by MPS, individual mutant allele is almost always outnumbered by wild type alleles rendering it indistinguishable from amplification and sequencing errors. We previously demonstrated that sporadic somatic mutations can be reliably detected at the single cell level [8]. In a diploid cell, after whole genome amplification (WGA) and MPS, an authentic mutation resulting in heterozygosity can be confidently detected by its consensus presence in ~50% of the sequencing reads, whereas amplification errors and sequencing artifacts can be effectively filtered out [8].
In principle, single cell analysis has the potential to directly assess the functional consequence of DNA sequence variants at the RNA level. Accumulating evidence indicates that DNA-directed RNA transcription has profound flexibility, as illustrated by the observation of allelically biased transcription [9] and RNA editing [10]. Therefore, an integrative assay which can simultaneously analyze the genome and transcriptome of the same single cell would be critically important to assess how specific patterns of DNA sequence variants affect transcriptional profiles.
In the present study, we report the concurrent genomic and transcriptomic analysis of the same single cell after treatment with the powerful mutagen ethylnitrosourea (ENU). This assay, termed “single-cell transcriptogenomics (SCTG)”, allowed us to track germline and somatic variants directly from the genome to the transcriptome. The results indicated, not unexpectedly, independent transcription of alleles containing germline sequence variants. However, surprisingly, alleles containing ENU-induced somatic mutations were significantly less frequently transcribed. This transcriptional bias against ENU-mutated alleles suggests a new layer of maintaining genome integrity.
2. Materials and Methods
2.1. Mutagenesis
Two groups of early passage, sub-confluent MEFs derived from different C57BL/6J parents were treated with 500 µg/ml (4.3 mM) ENU (Sigma) for 30 min and cultured for 72 hours [8]. Single MEFs were collected and snap-frozen in dry ice as described [8, 11]
2.2. SCTG
After cell lysis, the mRNAs of single frozen MEFs were selectively pulled down by biotinylated oligo-dT peptidyl nucleic acids and streptavidin-beads using a mTRAP midi kit (Active Motif). The streptavidin beads were washed three times with increasing stringency. Subsequently, the purified beads were subjected to whole transcriptome amplification [11, 12]. The exogenous polyC/G tails were cleaved at a MmeI site embedded in the primers (Supplementary Table 1). The MmeI-digested WTA amplicons were subjected to RNA-seq. Single cell genomic DNAs were ethanol-precipitated from the RNA wash-off fractions in the presence of glycogen and excess tRNA [13]. After tRNA-removal by RNase A, whole genome amplifications were performed using a Qiagen REPLI-g kit [8]. After a locus dropout test, the WGA amplicons exhibiting balanced amplification were subjected to whole exome sequencing.
2.3. Data analysis
For the WES data, the pipeline of sequence alignment and variant calling was described in detail before [8]. For the RNA-seq data, Illumina sequencing data were first subjected to computational trimming of residual adaptors, and then aligned to mouse mm9 reference genome using gsnap [14], followed by HTSeq-count and DESeq [15]. Detected genomic and transcriptomic variants were verified by integrative genomics viewer (IGV) validated by Sanger sequencing and compared directly.
For full details, see the extended Materials and Methods in the Supplementary Materials.
3 Results
3.1. SCTG: concurrent genomic and transcriptomic variant analysis of the same cell
Figure 1 schematically depicts the SCTG procedure. Previously, we successfully used a RT-PCR-based, unbiased global mRNA amplification procedure to append a poly C and a poly G tail on the 5’ and 3’ end of cDNA, respectively, allowing PCR amplification using a homopolymer primer with high annealing temperature [11, 12]. We adapted this procedure for SCTG (Figure 1). Briefly, after cell lysis, mRNAs were selectively pulled down for whole transcriptome amplification (WTA). Subsequently, the poly C/G tails of cDNAs were trimmed via a MmeI site embedded in the PCR primers (Supplementary Table 1). The processed cDNAs were then subjected to RNA-seq (Supplementary Table 2). Meanwhile, the genomic DNA in the wash-off fractions of mRNA pull-down was precipitated [13] and subjected to WGA using multiple displacement amplification (MDA) [8]. We used a locus drop-out (LDO) test [8] to positively select the least biased MDA amplicons (Supplementary Table 3), which were subjected to whole exome sequencing (WES).
Figure 1. Schematic illustration of single-cell transcriptogenomics (SCTG).

After cell lysis, the polyA tailed (AAA) mRNAs (black lines) are selectively pulled down by oligo-dT peptidyl nucleic acid (PNA) beads. After reverse transcription (RT) and terminal deoxynucleotide transferation (TdT), global mRNA amplification is performed by PCR using poly C primers. The resultant cDNA products are subjected to RNA-seq. After alignment to the RefSeq, the cDNAs exhibit discontinued alignment patterns, with discrete exons (solid lines) linked by introns (dashed lines) that have been spliced out. The PNA wash-off fractions containing genomic DNAs (gDNAs, blue lines) are collected, and gDNAs are precipitated, pre-treated with RNaseA and subjected to whole genome amplification (WGA). The WGA products are subjected to whole exome sequencing (WES). The WES and RNA-seq data are subjected to mutation detection analysis. Direct comparison of the mutation profiles from gDNAs and cDNAs reveals the expression of a genomic mutation, such as a heterozygous point mutation (red circles).
SCTG was performed in mouse embryonic fibroblasts (MEFs) treated with 500 µg/ml ENU [8]. This dose has virtually no effect on cell survival but increased somatic mutation frequency by 35-fold [8]. For technical replication, we performed SCTG in two groups of MEFs derived from two different C57BL/6J mice. MEF1 to 4 and MEF8 were from one mouse; MEF5 to 7 and MEF9 to 10 were from another mouse. Those two groups of MEFs were treated with ENU independently.
A total of 10 cells showed satisfactory WGA (Figure 2A) with acceptable LDO profiles (Supplementary Table 3, Figure 2B), as well as seemingly successful WTA (Figure 2C, Supplementary Figure 1). Those single-cell samples were subsequently subjected to WES and RNA-seq. Unamplified genomic DNAs from two untreated MEF populations were used as the bulk controls to define the germline background. The statistics of sequencing and alignment is summarized in Table 1 and Supplementary Table 2. The negligible amount of genomic DNA observed in WTA amplicons (Supplementary Table 2A) indicates the high specificity of the RNA pull down and amplification. Of the 10 MEFs sequenced, three (termed MEF8-10) showed low exomic coverage both for WES and RNA-seq (Table 1). In our multi-dimensional scaling plot of RNA-seq profiles, MEF1-7 clustered tightly with the unamplified bulk (Supplementary Figure 2A). In contrast, MEF8-10 appeared as outliers (Supplementary Figure 2A), indicating deficient WTA. Therefore, we excluded MEF8-10 in our further SCTG analysis.
Figure 2. Validation of successful WGA and WTA from the same single cell.
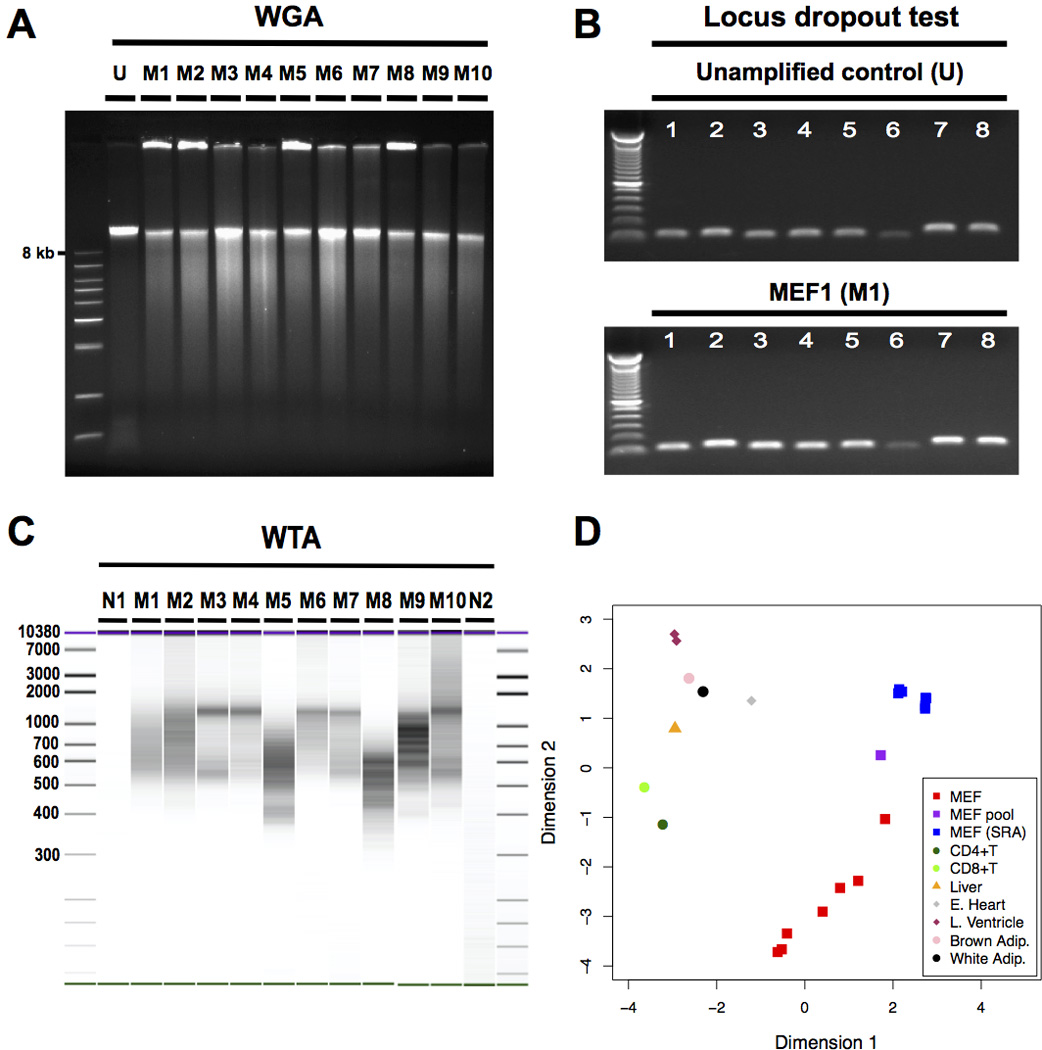
(A) Agarose electrophoresis indicated the high-molecular weight amplification product expected after successful whole genome amplification (WGA). (B) An example of a locus dropout test (LDO) covering 8 loci on 4 chromosomes indicating successful, relatively unbiased WGA. Numbers 1 to 8 indicate the LDO primer pairs. (C) BioAnalyzer (BA) image indicated successful whole transcriptome amplification (WTA). Samples N1 to M8 were run on one BA High Sensitivity DNA chip, with samples M9 to N2 on another. The two BA runs underwent identical image processing and were combined into one image. (D) Multi-dimensional scaling (MDS) plot confirmed MEF-specificity of single cell WTA amplicons. The MDS plot illustrates that when clustering the top 500 most variable genes between the MEF bulk and a number of publicly available RNA-seq data sets from MEFs and other cells and tissues, single amplified MEFs tended to cluster together with MEF cell populations but not with other types of cells/tissues. Abbreviation: Adip: adipose tissue; CD4+T: CD4+ T cell; CD8+T: CD8+ T cell; E. Heart: embryonic heart; L. Ventricle: left ventricle; M1 to M10: MEF1 to MEF10; MEF: single amplified MEF of the current study; MEF pool: unamplified MEF bulk of the current study; MEF (sra): RNA-seq data of MEF bulk downloaded from sequence read archive; N1: negative control 1 (no reverse transcriptase); N2: negative control 2 (no cell); U: Unamplified control.
Table 1.
Sequencing statistics of WES and RNA-seq in SCTG of single MEFs
| Sample ID | Number of bases |
Overlap with the SureSelect-exome (SSE)* |
||||||
|---|---|---|---|---|---|---|---|---|
| sequenced (Gb) |
mapped (Gb) |
Num. SSE bases covered (bp) |
avg. coverage (fold) |
Percentage of SSE with coverage of |
||||
| ≥1X | ≥5X | ≥10X | ≥20X | |||||
| Bulk1-WES | 7.1 | 7.0 | 51,779,114 | 71 | 99.7 | 99.6 | 98.8 | 95.2 |
| MEF1-WES | 5.8 | 4.7 | 50,680,965 | 56 | 97.6 | 92 | 84.9 | 71.9 |
| MEF2-WES | 5.7 | 5.0 | 50,907,662 | 59 | 98.0 | 93.1 | 86.6 | 74.5 |
| MEF3-WES | 6.7 | 6.1 | 50,788,767 | 68 | 97.8 | 93.6 | 87.6 | 76.5 |
| MEF4-WES | 11.3 | 8.6 | 47,215,249 | 61 | 90.9 | 85.5 | 79.6 | 70.7 |
| Bulk2-WES | 7.3 | 6.3 | 51,664,417 | 77 | 99.5 | 99.2 | 97.5 | 92.4 |
| MEF5-WES | 11.1 | 8.2 | 49,860,043 | 101 | 96.0 | 91.1 | 85.6 | 76.4 |
| MEF6-WES | 7.3 | 6.5 | 49,012,258 | 74 | 94.4 | 88.9 | 83.0 | 73.2 |
| MEF7-WES | 12.8 | 10.0 | 48,375,846 | 114 | 93.1 | 87.4 | 82.1 | 74.0 |
| MEF8-WES | 5.3 | 3.9 | 46,938,561 | 48 | 90.4 | 78.0 | 68.4 | 55.1 |
| MEF9-WES | 6.2 | 4.8 | 41,899,982 | 101 | 81.1 | 67.7 | 62.1 | 55.5 |
| MEF10-WES | 5.9 | 5.1 | 41,360,563 | 95 | 80.1 | 71.9 | 66.8 | 59.5 |
| Bulk-RNAseq | 7.9 | 7.2 | 28,229,859 | 34 | 54.6 | 42.8 | 38.3 | 33.2 |
| MEF1-RNAseq | 18.3 | 6.9 | 9,778,121 | 26 | 18.9 | 14.2 | 11.2 | 7.6 |
| MEF2-RNAseq | 16.3 | 6.7 | 16,097,775 | 24 | 31.2 | 22.6 | 16.9 | 10.8 |
| MEF3-RNAseq | 14.8 | 7.1 | 14,912,833 | 13 | 28.9 | 16.4 | 10.0 | 4.9 |
| MEF4-RNAseq | 30.7 | 13.2 | 6,912,063 | 32 | 13.4 | 9.3 | 8.0 | 6.3 |
| MEF5-RNAseq | 15.8 | 3.7 | 4,670,310 | 42 | 9.0 | 5.8 | 5.3 | 4.6 |
| MEF6-RNAseq | 19.3 | 9.9 | 8,928,712 | 35 | 17.3 | 12.8 | 10.9 | 8.5 |
| MEF7-RNAseq | 24.8 | 10.8 | 7,162,216 | 26 | 13.9 | 7.7 | 6.5 | 5.1 |
| MEF8-RNAseq | 16.6 | 3.7 | 3,083,821 | 20 | 6.0 | 3.7 | 2.8 | 1.8 |
| MEF9-RNAseq | 10.9 | 4.2 | 1,901,612 | 31 | 3.7 | 2.1 | 1.9 | 1.7 |
| MEF10-RNAseq | 12.4 | 4.8 | 3,059,393 | 25 | 5.9 | 3.4 | 2.8 | 2.2 |
The target size of SureSelectExome (SSE): 51,942,733 bp
SCTG was performed in two groups of MEFs. MEF1-4 and MEF8 formed group 1; MEF5-7 and MEF9-10 formed group 2.
For the seven remaining MEFs, we obtained 70% or higher on-target efficiency at ≥20X coverage in WES (Table 1), a depth which was used for variant-calling [8]. The corresponding RNA-seq patterns showed ~10% average exonic overlap at ≥ 10X coverage (Table 1), a depth at which we assessed allele-specific transcription. To maximize overlap between exome and transcriptome, we used random priming for initiating reverse transcription to avoid a strong 3’-end bias associated with polyT priming (see Methods). This inevitably led to a high, remaining fraction of rRNA, but this did not adversely affect our results. To account for a possible random priming effect, we included two cells (MEF5 and 9) primed with only polyT. As compared to published single MEF RNA-seq data obtained by SMART-Seq2 [32, 33] there was no significant difference in the number of transcribed genes (≥ 10 transcripts per gene) (Supplementary Table 2C), indicating that the transcriptomic complexity of our single MEFs was similar to the reported results [32, 33]. When comparing the transcriptome profiles from our amplified single MEFs with our own unamplified bulk, as well as with publicly available RNA-seq data from bulk populations of MEFs and unrelated tissues, the RNA-seq profiles from our 7 single MEFs were found to cluster with the unamplified MEF profiles, but not with that of heart, liver, adipocyte or immune cells (Figure 2D). These results indicate that our single-cell amplified mRNA profiles were truly MEF-specific, thereby validating that the single cell RNA-seq part of SCTG was successfully performed.
3.2. Mutation analysis of single-cell exomes
We then moved on to analyze germline variants and somatic mutations in the exomes of the 7 cells, using the computational pipeline described previously [8]. After alignment, germline single nucleotide variants (gSNVs) were defined as sequence differences present in both the unamplified bulk control and the single cell, whereas somatic mutations representing those variants present only in the latter [8]. In the exomes of the seven MEFs, we detected an average of 3.1 gSNVs per megabase (Mb) at ≥ 20X coverage (Supplementary Table 4). This gSNV frequency is very similar to that previously found in C57BL/6NJ mice [34]. Most gSNVs were homozygous (Fig. 3A,B), consistent with a mouse strain maintained at inbred condition, with only 6.3% heterozygous gSNVs. These heterozygous gSNVs, a result of ongoing germline mutagenesis, were used as an internal control when analyzing the ENU-induced somatic SNVs.
Figure 3. Allelic distribution of detected single nucleotide variants (SNVs).

(A) The allelic distribution of the germline SNVs of 7 single MEFs combined. (B) The allelic distribution of germline SNVs in the unamplified, bulk control (C) The allelic distribution of somatic SNVs from 7 single MEFs combined.
In contrast, most somatic SNVs (sSNVs) appeared to be heterozygous (Supplementary Figure 3A), as expected for randomly induced mutations. The prominent homozygous peak for some cells (Supplementary Figure 3B), which reflects 8.5% of all sSNVs, is most likely due to amplification bias. Indeed, allelic dropout associated with MDA has been reported at 9.5% [35]. If we dismiss those allelic dropout reads, the allele frequencies of the sSNVs are best fitted by a distribution of heterozygous events, peaking near 50% of the reads (Figure 3C). The presence of allelic dropouts suggests that due to MDA bias a seemingly homozygous SNV may in fact be heterozygous. For this reason we excluded all homozygous SNVs, both germline and somatic, from allelic-specific transcription analysis.
All heterozygous sSNVs exhibited a random pattern, without redundancy of sSNVs among the 7 individual cells (Supplementary Figure 4A). The unique occurrence of sSNVs is in sharp contrast to gSNVs, which consistently appear in all 7 single cells and two bulk controls (Supplementary Figure 4B). The average sSNV frequency was found to be 4.7 and 2.8 SNVs per Mb at ≥ 20X coverage in two groups of MEFs, respectively (Supplementary Table 4), similar to our previous results [8]. The difference in sSNV rate between these two groups of MEFs may reflect their independent ENU treatment.
The molecular nature of the gSNVs and ENU-induced sSNVs was distinct. In comparison with gSNVs (Supplementary Table 5) or spontaneous somatic mutations [8], the mutation spectrum of sSNVs exhibited a significantly higher rate of AT:TA transversions, the signature mutations of ENU [36, 37]. Furthermore, in comparison with the sSNVs, the gSNVs detected in exons comprised no nonsense variants and a significantly lower ratio of mis-sense to silent variants (Supplementary Table 6, p = 0.049, t-test), which is to be expected because of negative selection. By contrast, among the sSNVs detected in the exons of 7 single cells combined we found a total of 46 nonsense mutations (STOPgain), 564 mis-sense (nonsynonymous) mutations, 242 silent (synonymous) mutations and 2 make-sense (STOPloss) mutations (Supplementary Table 6). The percentage of mutation subtypes matched perfectly with the predicted percentage of ENU-induced SNV subtypes based on ENU-induced mutation spectrum and mouse codon usage [38] (Supplementary Table 6). In conclusion, the elevated ENU mutation frequency and spectrum, similar to what we published previously [8] validates the accuracy of our variant-calling in the SCTG assay.
3.3. Tracking exome mutations to the transcriptome
One key advantage of SCTG is its ability to directly track genomic variants to the transcriptome of the same single cell. Hence, we directly compared the exonic/UTR germline and somatic variants with their corresponding transcripts (Figure 4). Importantly, in our mutagenesis protocol ENU treatment of sub-confluent MEFs was followed by a 72-hour recovery period during which cells were actively proliferating. Since DNA damage repair is very fast and completed well within 72 hours [39], virtually none of the observed mutations can be a result of persistent, ENU-induced lesions, for example, through amplificational mispairing. Likewise, due to rapid mRNA decay [40], the observed variants in mRNAs are unlikely to be a consequence of residual ENU-lesions. Hence, the same variants observed in exome and transcriptome can safely be considered as a result of faithful transcription from the mutant DNA templates.
Figure 4. Integrative genomics viewer (IGV) images comparing specific mutations present in both exome and transcriptome from the same single cell.

The genetic background is defined by the unamplified control (Unamp). (A) The presence of a germline SNV in mRNAs. (B) The presence of a heterozygous somatic A:T transversion, a signature ENU-induced mutation, in mRNAs. (C) A heterozygous somatic SNV absent from mRNAs. (D) A somatic C to A transversion generating a nonsense mutation; no mutant transcript detected. (E) A heterogyzous bi-nucleotidyl CG-deletion absent from mRNAs. (F) The binucleotidyl deletion induces a premature TAG (CTA in the illustration; Sfi1 gene is transcribed in reversed order) stop codon (red arrows) in a downstream exon.
To directly compare exomic and transcriptomic profiles, we focused on mRNAs with 10 or more reads (Supplementary Figure 5), close to the detection limit of single-cell RNA-seq [18, 19]. For heterozygous gSNVs in the transcribed regions, we observed three types of transcripts: (1) those solely transcribed from the variant (v) allele; (2) those solely transcribed from the wild type (w) allele; or (3) those derived from both alleles (v+w). Intuitively, one would expect a heterozygous SNV to have 50% v and 50% w transcripts. However, due to the well-documented stochastic bursts of transcription of an individual allele [41, 42], each single cell transcriptome is in essence a snapshot [43] and can exhibit one of four (v, v+w, w or untranscribed) situations of each locus [43]. The same transcription pattern was also observed in single cells from early embryo’s of CAST/EiJ X C57BL/6J hybrid mice [44]. Of note, such a single cell transcription pattern would go unnoticed if analyzed at bulk level. For single cell transcriptomics, repetitive sampling and/or pooling should reconstitute the whole transcription pattern. In our case, this can be accomplished by generating a composite transcription pattern of all heterozygous variants in the same single cell. Assuming each allele is transcribed in an independent and stochastic manner without allelic bias, a balanced distribution is expected and was indeed observed (Table 2). This observation is in agreement with previous reports that germline variants have a very low percentage of allelically biased transcription [9, 45].
Table 2.
Comparison of mutation profile between the gDNA and mRNA of the same single cell
| Germline SNVs |
Somatic SNVs |
p value |
|||||||||||
|---|---|---|---|---|---|---|---|---|---|---|---|---|---|
| in exome | in mRNA* | in exome | in mRNA* | Fisher’s exact test |
|||||||||
| Genotype | total | transcribed | v | v + w | w | Genotype | total | transcribed | m | m + w | w | ||
| MEF1 | v/w | 34 | 14 | 6 | 5 | 3 | m/w | 142 | 34 | 0 | 7 | 14 | 0.00143 |
| MEF2 | v/w | 66 | 22 | 1 | 9 | 4 | m/w | 169 | 57 | 0 | 7 | 30 | 0.00076 |
| MEF3 | v/w | 51 | 29 | 5 | 6 | 8 | m/w | 141 | 46 | 0 | 1 | 11 | 0.02182 |
| MEF4 | v/w | 46 | 15 | 2 | 5 | 5 | m/w | 129 | 21 | 0 | 1 | 11 | 0.03311 |
| MEF5 | v/w | 46 | 13 | 7 | 1 | 1 | m/w | 112 | 11 | 1 | 1 | 7 | 0.00601 |
| MEF6 | v/w | 47 | 17 | 6 | 5 | 3 | m/w | 83 | 15 | 0 | 3 | 7 | 0.02147 |
| MEF7 | v/w | 40 | 12 | 3 | 0 | 2 | m/w | 90 | 16 | 0 | 0 | 7 | 0.04545 |
| Total | – | 296 | 122 | 30 | 31 | 26 | – | 724 | 200 | 1 | 20 | 87 | 1.44×10⁻¹⁵ |
SNVs in exon/UTR region only; allelic-specific transcription was only performed for loci with >=10 mRNA reads Since germline SNVs are present in all cells, in the total number of gSNVs, the same gSNVs could be counted multiple times.
“v”: germline variant allele; “m:” somatic mutant allele; “w”: the wild type allele;
In genome, “v/w” and “m/w” stands for heterozygous germline variance and somatic mutation, respectively; “v/v” and “m/m” stands for homozygous germline variance and somatic mutation, respectively;
For mRNAs,”v” and “m” stands for mRNAs solely transcribed from the variant/mutant allele; “v+w” and “m+w” stands for mRNAs transcribed from both variant/mutant and wild type alleles. “w” stands for mRNAs solely transcribed from the wild type allele.
In ENU-treated MEFs, sSNVs exhibited a strikingly different transcription pattern. Interestingly, the composite transcription patterns of heterozygous sSNVs were significantly skewed to wild type transcripts (Table 2). This was validated by Sanger sequencing (Supplementary Figure 6). For each individual single cell, there was a significant difference between the composite transcription pattern of heterozygous gSNVs versus heterozygous sSNVs (p = 1.44×10⁻¹⁵ for all cells combined; Fisher’s exact test, Table 2). In single cell RNA-seq measuring low-abundant mRNAs is complicated due to severe technical bias and only measuring those mRNAs with moderate or high expression are reliable [46]. So we also examined moderately and highly transcribed genes, with their log2CPM (counts per million) values [30] equal or larger than the median and 75% quartile of the whole transcriptome, respectively (Supplementary Table 7), for performing allele-specific transcription analysis. The allelic exclusion pattern remained the same in moderately and highly transcribed genes (Supplementary Table 8). Hence, this observation was not due to under-sampling bias. Furthermore, this allelic exclusion was not biased by random priming. The one cell (MEF5) subjected to polyT priming, showed similar bias against mutant transcripts (Table 2).
One possible explanation for the observed allelic bias is the existence of transcriptional bias against mutant alleles. Indeed, at least part of the absence of mutant transcripts can be explained by nonsense-mediated decay (NMD) due to a premature stop codon (8 out of 103 exonic sSNVs) [47]. In those cases it is not surprising that the wild type mRNAs prevailed (Supplementary Figure 6E, Supplementary Table 7B). NMD-induced allelic exclusion of mutant transcripts was also observed for 1 germline heterozygous CG-deletion (Figure 4E–F; Supplementary Figure 6F) and 2 heterozygous somatic indels (data not shown), which also induced premature stop codons in downstream exons by frame-shifting. Hence, NMD can account for a fraction of the untranscribed mutant alleles, but not for all of them.
4. Discussion
In this present work we demonstrate, for the first time, the feasibility of performing concurrent, whole exome and transcriptome sequence analysis from the same single cell. This SCTG method combines two unique advantages. First, SCTG is capable of accurately detecting combinations of common germline variants and somatic mutations unique for each cell. Such variant patterns cannot be obtained at the bulk level. Indeed, it is the combination of genomic variants (and their altered function in signaling and regulatory networks), rather than individual mutations, that is considered the key determinant of the cellular phenotype. Therefore, it is crucial to define the full repertoire of all variants/mutations in a genome, which can only be achieved by single cell sequencing.
Second, SCTG allows to directly track genomic variants to the transcriptome. Such a direct comparison of genomic and transcriptomic variation cannot be done through analysis at the bulk level, thereby precluding the unraveling of critical genotype/phenotype relationships. Although in the current study we combined WES and RNA-seq, SCTG can be easily expanded to whole genome sequencing. Since the majority of trait and disease-associated germline variants are localized in non-coding regulatory regions, such as distantly-acting enhancers [48], SCTG could be used for a comprehensive evaluation of the consequences of somatic mutation perturbation of genome-wide gene regulatory networks.
For germline variants, we observed that heterozygous gSNVs were faithfully transcribed. This high concordance between germline variants and their corresponding mRNAs validates the accuracy of SCTG. However, unlike the expected and observed balanced transcription pattern of gSNVs (Table 2), the sSNV alleles in each cell were significantly under-transcribed (Table 2). The same massive allelic bias was not only observed in MEF1-7 (Table 2), but also in MEF8-10 (data not shown), despite their exclusion from SCTG due to their poor coverage. Such a massive allelic bias against sSNVs cannot be explained by biased mRNA amplification, because it was not observed for gSNVs amplified from the same cell. One extreme possibility is that at a certain mutant locus, all aligned cDNA reads are actually PCR products derived from the same mRNA template, which can consequently generate an all-WT or an all-mutant artifact. Such a problem is more severe when the RT is performed using a uniform (polyT) primer. In our case however, we performed RT using random primers. Indeed, the aligned reads are clearly initiated from multiple locations (Supplementary Figure 7), providing conclusive evidence that those cDNA reads are derived from different mRNA templates. The observed allelic bias is also unlikely to be a consequence of alignment errors. Indeed, at only 3–4 ENU-induced mutations per Mb, evenly distributed across the genome [8], it is very unlikely for two or more ENU-induced SNVs to occur in the same sequencing read (150bp), resulting in serious mis-alignment. Furthermore, since our measured germline and somatic SNV rates are quite similar (Supplementary Table 4), the misalignment problem should then have affected transcripts from germline and somatic SNVs in the same way. No allelic bias for germline SNVs was observed.
In addition, we considered the possibility that the observed exclusion of exonic mutations was caused by unrepaired ENU-lesions in the nontranscribed strands. We deduced whether the original ENU-lesion of a somatic SNV was located in the transcribed or nontranscribed strand [8] (Supplementary Table 7B). Allelic avoidance of somatic SNVs was observed for ENU-lesions located both in the transcribed and in the nontranscribed strands (Supplementary Table 7B). The slightly higher number of mutations occurring at nontranscribed strands most likely reflects the operation of transcription-coupled repair [8, 36]. The low density of ENU-induced mutations also rules out the possibility that mutant alleles are not transcribed due to a concomitant mutation in the promoter region of the same allele. Hence, the observed allelic bias may reveal a genuine, novel form of transcription suppression due to ENU-induced somatic mutations.
Previously, severe allelic exclusion of mutant transcripts has been reported at the bulk level in primary triple negative breast cancers [49] and non-Hodgkins lymphoma cells [50]. However, the notorious intra-tumor heterogeneity, strong selection and epigenetic reprogramming confounded the interpretation of those data. At single cell resolution, our present observations therefore provide the first unambiguous evidence for the existence of massive allelic exclusion of somatic mutant alleles in normal cells.
In part, such a massive allelic bias could be explained, as we showed, by NMD. However, the majority of the somatic mutations were not nonsense mutations (Supplementary Table 6). While PolyPhen-2 analysis [51] indicated that some of the mutations have a high likelihood to elicit detrimental function, many of the mutant alleles that were avoided appeared to be neutral, including silent mutations as well as benign mis-sense mutations (Supplementary Table 7B).
A quality control system at the transcriptional level to evade potentially adverse mutations, somewhat analogous to the well-described phenotypic buffering systems that conceal the effects of mutations [52], is an intriguing possibility. The most likely mechanism for such a system is through epigenetic memory of the ENU-induced damage. Indeed, compromised chromatin organization during DNA damage processing has been documented and evidence has been obtained that new histone variants are incorporated as an imprint for newly repaired chromatin [53, 54]. Such a transcriptional suppressor signal may well persist over short periods of time, i.e., under the conditions our experiments were carried out, but removed during germ cell development or after fertilization [55], which would explain why we see no sign of allelic exclusion of germline variants. Our observation that a small percentage of ENU-induced SNVs did have bi-allelic transcripts (Table 2), indicates that exclusion of mutant alleles is not complete. Incomplete exclusion was also observed in tumors [49, 50].
In summary, we described a novel method to directly examine the transcription pattern of genotypic variants at single cell resolution. Using germline variants from the same single cell as internal controls, we unexpectedly observed extensive phenotypic discordance of somatic mutations. Such a genotype-phenotype discordance indicates that, rather than a rigid deterministic mechanism, transcription is not hardwired and able to select against potentially adverse changes in the DNA template. Such transcription avoidance may be yet another layer of protection against the detrimental consequences of mutations and provide further clues to understanding its possible consequences, including reduced penetrance and variable expressivity.
Supplementary Material
Highlights.
A novel method of concurrent genomic and transcriptomic analysis of a single cell
Direct analysis of allele-specific transcription from germline and somatic variants
Extensive transcriptional exclusion of ENU-induced mutant alleles
Exclusion of mutant alleles may contribute to the maintenance of genome integrity
Acknowledgments
We thank Shahina Maqbool of Einstein’s Epigenomic Core Facility for her assistance in RNA-seq and Jennifer Bae and her colleagues in Axeq/Macrogen for their assistance in WES. We thank Moonsook Lee for experimental assistance and Dr. Ivan Adzhubei for his assistance with the PolyPhen-2 assay. This work was supported by NIH grants R01AG034421, P01AG17242, R21AG030567, R21ES019520, U54RR024346 and AG038072 to J.V. and The Glenn Foundation for Medical Research. There is no any conflict of interests.
Footnotes
Publisher's Disclaimer: This is a PDF file of an unedited manuscript that has been accepted for publication. As a service to our customers we are providing this early version of the manuscript. The manuscript will undergo copyediting, typesetting, and review of the resulting proof before it is published in its final citable form. Please note that during the production process errors may be discovered which could affect the content, and all legal disclaimers that apply to the journal pertain.
Data access: Our original sequencing data have been submitted to Sequence Read Archive (SRA), with an accession code of SRP040646.
Conflict of Interest statement
The authors declare that there is no conflict of interest.
References
- 1.Tang F, Lao K, Surani MA. Development and applications of single-cell transcriptome analysis. Nat Methods. 2011;8:S6–S11. doi: 10.1038/nmeth.1557. [DOI] [PMC free article] [PubMed] [Google Scholar]
- 2.Rutherford SL. From genotype to phenotype: buffering mechanisms and the storage of genetic information. Bioessays. 2000;22:1095–1105. doi: 10.1002/1521-1878(200012)22:12<1095::AID-BIES7>3.0.CO;2-A. [DOI] [PubMed] [Google Scholar]
- 3.Baillie JK, Barnett MW, Upton KR, Gerhardt DJ, Richmond TA, et al. Somatic retrotransposition alters the genetic landscape of the human brain. Nature. 2011;479:534–537. doi: 10.1038/nature10531. [DOI] [PMC free article] [PubMed] [Google Scholar]
- 4.Jacobs KB, Yeager M, Zhou W, Wacholder S, Wang Z, et al. Detectable clonal mosaicism and its relationship to aging and cancer. Nat Genet. 2012;44:651–658. doi: 10.1038/ng.2270. [DOI] [PMC free article] [PubMed] [Google Scholar]
- 5.Piotrowski A, Bruder CE, Andersson R, Diaz de Stahl T, Menzel U, et al. Somatic mosaicism for copy number variation in differentiated human tissues. Hum Mutat. 2008;29:1118–1124. doi: 10.1002/humu.20815. [DOI] [PubMed] [Google Scholar]
- 6.Kong A, Frigge ML, Masson G, Besenbacher S, Sulem P, et al. Rate of de novo mutations and the importance of father's age to disease risk. Nature. 2012;488:471–475. doi: 10.1038/nature11396. [DOI] [PMC free article] [PubMed] [Google Scholar]
- 7.Conrad DF, Keebler JE, DePristo MA, Lindsay SJ, Zhang Y, et al. Variation in genome-wide mutation rates within and between human families. Nat Genet. 2011;43:712–714. doi: 10.1038/ng.862. [DOI] [PMC free article] [PubMed] [Google Scholar]
- 8.Gundry M, Li W, Maqbool SB, Vijg J. Direct, genome-wide assessment of DNA mutations in single cells. Nucleic Acids Res. 2012;40:2032–2040. doi: 10.1093/nar/gkr949. [DOI] [PMC free article] [PubMed] [Google Scholar]
- 9.Gimelbrant A, Hutchinson JN, Thompson BR, Chess A. Widespread monoallelic expression on human autosomes. Science. 2007;318:1136–1140. doi: 10.1126/science.1148910. [DOI] [PubMed] [Google Scholar]
- 10.Nishikura K. Functions and regulation of RNA editing by ADAR deaminases. Annu Rev Biochem. 2010;79:321–349. doi: 10.1146/annurev-biochem-060208-105251. [DOI] [PMC free article] [PubMed] [Google Scholar]
- 11.Bahar R, Hartmann CH, Rodriguez KA, Denny AD, Busuttil RA, et al. Increased cell-to-cell variation in gene expression in ageing mouse heart. Nature. 2006;441:1011–1014. doi: 10.1038/nature04844. [DOI] [PubMed] [Google Scholar]
- 12.Hartmann CH, Klein CA. Gene expression profiling of single cells on large-scale oligonucleotide arrays. Nucleic Acids Res. 2006;34:e143. doi: 10.1093/nar/gkl740. [DOI] [PMC free article] [PubMed] [Google Scholar]
- 13.Klein CA, Seidl S, Petat-Dutter K, Offner S, Geigl JB, et al. Combined transcriptome and genome analysis of single micrometastatic cells. Nat Biotechnol. 2002;20:387–392. doi: 10.1038/nbt0402-387. [DOI] [PubMed] [Google Scholar]
- 14.Wu TD, Nacu S. Fast and SNP-tolerant detection of complex variants and splicing in short reads. Bioinformatics. 2010;26:873–881. doi: 10.1093/bioinformatics/btq057. [DOI] [PMC free article] [PubMed] [Google Scholar]
- 15.Anders S, Huber W. Differential expression analysis for sequence count data. Genome Biol. 2010;11:R106. doi: 10.1186/gb-2010-11-10-r106. [DOI] [PMC free article] [PubMed] [Google Scholar]
- 16.Islam S, Kjallquist U, Moliner A, Zajac P, Fan JB, et al. Characterization of the single-cell transcriptional landscape by highly multiplex RNA-seq. Genome Res. 2011;21:1160–1167. doi: 10.1101/gr.110882.110. [DOI] [PMC free article] [PubMed] [Google Scholar]
- 17.Tang F, Barbacioru C, Wang Y, Nordman E, Lee C, et al. mRNA-Seq whole-transcriptome analysis of a single cell. Nat Methods. 2009;6:377–382. doi: 10.1038/nmeth.1315. [DOI] [PubMed] [Google Scholar]
- 18.Hashimshony T, Wagner F, Sher N, Yanai I. CEL-Seq: single-cell RNA-Seq by multiplexed linear amplification. Cell Rep. 2012;2:666–673. doi: 10.1016/j.celrep.2012.08.003. [DOI] [PubMed] [Google Scholar]
- 19.Ramskold D, Luo S, Wang YC, Li R, Deng Q, et al. Full-length mRNA-Seq from single-cell levels of RNA and individual circulating tumor cells. Nat Biotechnol. 2012;30:777–782. doi: 10.1038/nbt.2282. [DOI] [PMC free article] [PubMed] [Google Scholar]
- 20.Morgan RD, Bhatia TK, Lovasco L, Davis TB. MmeI: a minimal Type II restriction-modification system that only modifies one DNA strand for host protection. Nucleic Acids Res. 2008;36:6558–6570. doi: 10.1093/nar/gkn711. [DOI] [PMC free article] [PubMed] [Google Scholar]
- 21.Meyer M, Kircher M. Illumina sequencing library preparation for highly multiplexed target capture and sequencing. Cold Spring Harb Protoc 2010. 2010 doi: 10.1101/pdb.prot5448. pdb prot5448. [DOI] [PubMed] [Google Scholar]
- 22.Li H, Durbin R. Fast and accurate short read alignment with Burrows-Wheeler transform. Bioinformatics. 2009;25:1754–1760. doi: 10.1093/bioinformatics/btp324. [DOI] [PMC free article] [PubMed] [Google Scholar]
- 23.DePristo MA, Banks E, Poplin R, Garimella KV, Maguire JR, et al. A framework for variation discovery and genotyping using next-generation DNA sequencing data. Nat Genet. 2011;43:491–498. doi: 10.1038/ng.806. [DOI] [PMC free article] [PubMed] [Google Scholar]
- 24.Li H, Handsaker B, Wysoker A, Fennell T, Ruan J, et al. The Sequence Alignment/Map format and SAMtools. Bioinformatics. 2009;25:2078–2079. doi: 10.1093/bioinformatics/btp352. [DOI] [PMC free article] [PubMed] [Google Scholar]
- 25.Koboldt DC, Chen K, Wylie T, Larson DE, McLellan MD, et al. VarScan: variant detection in massively parallel sequencing of individual and pooled samples. Bioinformatics. 2009;25:2283–2285. doi: 10.1093/bioinformatics/btp373. [DOI] [PMC free article] [PubMed] [Google Scholar]
- 26.Reumers J, De Rijk P, Zhao H, Liekens A, Smeets D, et al. Optimized filtering reduces the error rate in detecting genomic variants by short-read sequencing. Nat Biotechnol. 2012;30:61–68. doi: 10.1038/nbt.2053. [DOI] [PubMed] [Google Scholar]
- 27.Cibulskis K, Lawrence MS, Carter SL, Sivachenko A, Jaffe D, et al. Sensitive detection of somatic point mutations in impure and heterogeneous cancer samples. Nat Biotechnol. 2013;31:213–219. doi: 10.1038/nbt.2514. [DOI] [PMC free article] [PubMed] [Google Scholar]
- 28.Robinson JT, Thorvaldsdottir H, Winckler W, Guttman M, Lander ES, et al. Integrative genomics viewer. Nat Biotechnol. 2011;29:24–26. doi: 10.1038/nbt.1754. [DOI] [PMC free article] [PubMed] [Google Scholar]
- 29.Dobin A, Davis CA, Schlesinger F, Drenkow J, Zaleski C, et al. STAR: ultrafast universal RNA-seq aligner. Bioinformatics. 2013;29:15–21. doi: 10.1093/bioinformatics/bts635. [DOI] [PMC free article] [PubMed] [Google Scholar]
- 30.Anders S, McCarthy DJ, Chen Y, Okoniewski M, Smyth GK, et al. Count-based differential expression analysis of RNA sequencing data using R and Bioconductor. Nat Protoc. 2013;8:1765–1786. doi: 10.1038/nprot.2013.099. [DOI] [PubMed] [Google Scholar]
- 31.Quinlan AR, Hall IM. BEDTools: a flexible suite of utilities for comparing genomic features. Bioinformatics. 2010;26:841–842. doi: 10.1093/bioinformatics/btq033. [DOI] [PMC free article] [PubMed] [Google Scholar]
- 32.Picelli S, Faridani OR, Bjorklund AK, Winberg G, Sagasser S, et al. Full-length RNA-seq from single cells using Smart-seq2. Nat Protoc. 2014;9:171–181. doi: 10.1038/nprot.2014.006. [DOI] [PubMed] [Google Scholar]
- 33.Picelli S, Bjorklund AK, Faridani OR, Sagasser S, Winberg G, et al. Smart-seq2 for sensitive full-length transcriptome profiling in single cells. Nat Methods. 2013;10:1096–1098. doi: 10.1038/nmeth.2639. [DOI] [PubMed] [Google Scholar]
- 34.Keane TM, Goodstadt L, Danecek P, White MA, Wong K, et al. Mouse genomic variation and its effect on phenotypes and gene regulation. Nature. 2011;477:289–294. doi: 10.1038/nature10413. [DOI] [PMC free article] [PubMed] [Google Scholar]
- 35.Evrony GD, Cai X, Lee E, Hills LB, Elhosary PC, et al. Single-neuron sequencing analysis of L1 retrotransposition and somatic mutation in the human brain. Cell. 2012;151:483–496. doi: 10.1016/j.cell.2012.09.035. [DOI] [PMC free article] [PubMed] [Google Scholar]
- 36.Op het Veld CW, van Hees-Stuivenberg S, van Zeeland AA, Jansen JG. Effect of nucleotide excision repair on hprt gene mutations in rodent cells exposed to DNA ethylating agents. Mutagenesis. 1997;12:417–424. doi: 10.1093/mutage/12.6.417. [DOI] [PubMed] [Google Scholar]
- 37.Tosal L, Comendador MA, Sierra LM. In vivo repair of ENU-induced oxygen alkylation damage by the nucleotide excision repair mechanism in Drosophila melanogaster. Mol Genet Genomics. 2001;265:327–335. doi: 10.1007/s004380000419. [DOI] [PubMed] [Google Scholar]
- 38.Takahasi KR, Sakuraba Y, Gondo Y. Mutational pattern and frequency of induced nucleotide changes in mouse ENU mutagenesis. BMC Mol Biol. 2007;8:52. doi: 10.1186/1471-2199-8-52. [DOI] [PMC free article] [PubMed] [Google Scholar]
- 39.Bielas JH, Heddle JA. Proliferation is necessary for both repair and mutation in transgenic mouse cells. Proc Natl Acad Sci U S A. 2000;97:11391–11396. doi: 10.1073/pnas.190330997. [DOI] [PMC free article] [PubMed] [Google Scholar]
- 40.Sharova LV, Sharov AA, Nedorezov T, Piao Y, Shaik N, et al. Database for mRNA half-life of 19 977 genes obtained by DNA microarray analysis of pluripotent and differentiating mouse embryonic stem cells. DNA Res. 2009;16:45–58. doi: 10.1093/dnares/dsn030. [DOI] [PMC free article] [PubMed] [Google Scholar]
- 41.Raj A, van Oudenaarden A. Nature, nurture, or chance: stochastic gene expression and its consequences. Cell. 2008;135:216–226. doi: 10.1016/j.cell.2008.09.050. [DOI] [PMC free article] [PubMed] [Google Scholar]
- 42.Dar RD, Razooky BS, Singh A, Trimeloni TV, McCollum JM, et al. Transcriptional burst frequency and burst size are equally modulated across the human genome. Proc Natl Acad Sci U S A. 2012;109:17454–17459. doi: 10.1073/pnas.1213530109. [DOI] [PMC free article] [PubMed] [Google Scholar]
- 43.Shapiro E, Biezuner T, Linnarsson S. Single-cell sequencing-based technologies will revolutionize whole-organism science. Nat Rev Genet. 2013;14:618–630. doi: 10.1038/nrg3542. [DOI] [PubMed] [Google Scholar]
- 44.Deng Q, Ramskold D, Reinius B, Sandberg R. Single-cell RNA-seq reveals dynamic, random monoallelic gene expression in mammalian cells. Science. 2014;343:193–196. doi: 10.1126/science.1245316. [DOI] [PubMed] [Google Scholar]
- 45.Li SM, Valo Z, Wang J, Gao H, Bowers CW, et al. Transcriptome-wide survey of mouse CNS-derived cells reveals monoallelic expression within novel gene families. PLoS One. 2012;7:e31751. doi: 10.1371/journal.pone.0031751. [DOI] [PMC free article] [PubMed] [Google Scholar]
- 46.Brennecke P, Anders S, Kim JK, Kolodziejczyk AA, Zhang X, et al. Accounting for technical noise in single-cell RNA-seq experiments. Nat Methods. 2013;10:1093–1095. doi: 10.1038/nmeth.2645. [DOI] [PubMed] [Google Scholar]
- 47.Chang YF, Imam JS, Wilkinson MF. The nonsense-mediated decay RNA surveillance pathway. Annu Rev Biochem. 2007;76:51–74. doi: 10.1146/annurev.biochem.76.050106.093909. [DOI] [PubMed] [Google Scholar]
- 48.Maurano MT, Humbert R, Rynes E, Thurman RE, Haugen E, et al. Systematic localization of common disease-associated variation in regulatory DNA. Science. 2012;337:1190–1195. doi: 10.1126/science.1222794. [DOI] [PMC free article] [PubMed] [Google Scholar]
- 49.Shah SP, Roth A, Goya R, Oloumi A, Ha G, et al. The clonal and mutational evolution spectrum of primary triple-negative breast cancers. Nature. 2012;486:395–399. doi: 10.1038/nature10933. [DOI] [PMC free article] [PubMed] [Google Scholar]
- 50.Morin RD, Mendez-Lago M, Mungall AJ, Goya R, Mungall KL, et al. Frequent mutation of histone-modifying genes in non-Hodgkin lymphoma. Nature. 2011;476:298–303. doi: 10.1038/nature10351. [DOI] [PMC free article] [PubMed] [Google Scholar]
- 51.Adzhubei IA, Schmidt S, Peshkin L, Ramensky VE, Gerasimova A, et al. A method and server for predicting damaging missense mutations. Nat Methods. 2010;7:248–249. doi: 10.1038/nmeth0410-248. [DOI] [PMC free article] [PubMed] [Google Scholar]
- 52.Jarosz DF, Taipale M, Lindquist S. Protein homeostasis and the phenotypic manifestation of genetic diversity: principles and mechanisms. Annu Rev Genet. 2010;44:189–216. doi: 10.1146/annurev.genet.40.110405.090412. [DOI] [PubMed] [Google Scholar]
- 53.Polo SE, Roche D, Almouzni G. New histone incorporation marks sites of UV repair in human cells. Cell. 2006;127:481–493. doi: 10.1016/j.cell.2006.08.049. [DOI] [PubMed] [Google Scholar]
- 54.Adam S, Polo SE, Almouzni G. Transcription recovery after DNA damage requires chromatin priming by the H3.3 histone chaperone HIRA. Cell. 2013;155:94–106. doi: 10.1016/j.cell.2013.08.029. [DOI] [PubMed] [Google Scholar]
- 55.Sabour D, Scholer HR. Reprogramming and the mammalian germline: the Weismann barrier revisited. Curr Opin Cell Biol. 2012;24:716–723. doi: 10.1016/j.ceb.2012.08.006. [DOI] [PubMed] [Google Scholar]
Associated Data
This section collects any data citations, data availability statements, or supplementary materials included in this article.