Abstract
We describe the design, synthesis and in vitro evaluation of a multimodal and multimeric contrast agent. The agent consists of three macrocyclic Gd(III) chelates conjugated to a fluorophore and possesses high relaxivity, water solubility, and is nontoxic. The modular synthesis is amenable for the incorporation of a variety of fluorophores to generate molecular constructs for a number of applications.
The advent of a number of highly sensitive, tomographic imaging modalities has enabled scientists and clinicians to acquire in vivo images of animals without the need for sacrifice.1–3 Each modality possesses unique strengths where the combination of two or more imaging modalities continues to impact our understanding of complex biological processes and drug development.4 Techniques for in vivo imaging include positron emission tomography (PET), single-photon emission computed tomography (SPECT), and magnetic resonance (MR).5 Although each modality provides high resolution in vivo tomographic information, MR imaging is well suited for longitudinal assessment of in vivo processes because it does not require ionizing radiation (CT) or the use of radioactive tracers (PET and SPECT). For example, MRI has been used to fate map cells in developing embryos where the descendants of individual precursors were labeled with a stable, nontoxic, lineage tracer (MRI contrast agent) which allowed researchers to determine the cell location and migration responsible for embryonic development.6 However, the low probe sensitivity and limited spatial resolution of MRI preclude the observation of molecular events.
Optical imaging is a modality that provides high resolution and probe sensitivity to detect subcellular localization and molecular interactions. The integration of optical and MR imaging is therefore an appealing approach to facilitate applications such as fate mapping transplanted stem cells,7–9 early detection of cancer,10 tracking gene expression,11 and importantly, histological validation of MR signal.
There have been an increasing number of reports of multimodal MR-optical contrast agents using a wide variety of nanoconjugates and fluorophores.12,13 However, the intrinsic variability of nanoparticles can be an obstacle for some applications. In order to address this issue, researchers have developed small molecule MR-optical contrast agents consisting of a Gd(III)-based chelate conjugated to near-IR dyes,14 rhodamine,15,16 cyanine7,17 and fluorescein.17 Typically, these agents have been shown to have relatively low relaxivities and limited water solubility. Further, conjugating agents to dendrimer scaffolds has been shown to increase relaxivity, but the resultant agents are polydisperse and difficult to characterize.18,19
To overcome these limitations we report the synthesis, characterization and in vitro evaluation of a high relaxivity, multimeric and multimodal MR-optical contrast agent. The design is based upon our previously reported agent where three Gd(III) chelates are conjugated to a phenolic core.20 We modified this design to allow conjugation of fluorescein to generate a highly water-soluble MR-optical agent which labels cells with high efficiency and generates significant MR contrast enhancement at clinical (1.4 T) and research (7 T) magnetic field strengths.
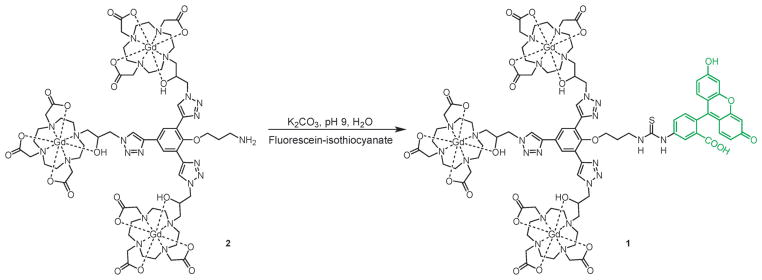
To facilitate conjugation of 2 to fluorescein isothiocyanate, an amine-functionalized linker was introduced onto the phenolic core of the complex (see Fig. S1–S3, ESI† for further details). 1 was synthesized via the direct reaction of complex 2 with commercially available fluorescein isothiocyanate in water at pH 9.0 using potassium carbonate (Scheme 1). The reaction was performed in the dark due to the photo-instability of fluorescein.
Scheme 1.

Synthetic route to fluorescein-conjugated contrast agent 1. 2 was designed for orthogonal modification through isothiocyanate conjugation to the primary amine. For complete synthetic details, see Fig. S1–S3, ESI.†
The relaxivity of 1 and 2 were determined to be 17.0 ± 0.5 mM−1 s−1 and 14.9 ± mM−1 s−1 respectively at 1.41 T (Table 1). The observed ionic relaxivities decrease to 4.7 ± 0.3 mM−1 s−1 for 1 and 5.2 ± 0.3 mM−1 s−1 for 2 at 7 T and are consistent with values obtained from agents generated from similar scaffolds.20,21
Table 1.
Relaxivities of 1 and 2 in 10 mM PBS buffer (pH 7.4) at 1.41 T (37 °C) and 7 T (25 °C)
| 1.41 T (60 MHz)
|
7 T (300 MHz)
|
|||
|---|---|---|---|---|
| Ionic (mM−1 s−1) | Molecular (mM−1 s−1) | Ionic (mM−1 s−1) | Molecular (mM−1 s−1) | |
| 1 | 17.0 ± 0.5 | 51.0 ± 1.5 | 4.7 ± 0.3 | 14.1 ± 0.9 |
| 2 | 14.9 ± 0.5 | 45.0 ± 1.5 | 5.2 ± 0.3 | 15.9 ± 0.9 |
The complexes were further characterized by quantum yield and octanol–water partition coefficients (log P) measurements. The quantum yield of 1 was determined to be 0.56. The log P values of 1 and 2 were −2.0 and −1.9 respectively. These negative log P values are characteristic of high water solubility, indicating that conjugation of fluorescein to the contrast agent scaffold did not significantly impact solubility. As a result, incubation concentrations for in vitro studies can be made in the mM range which is important for maximizing intracellular agent concentration.
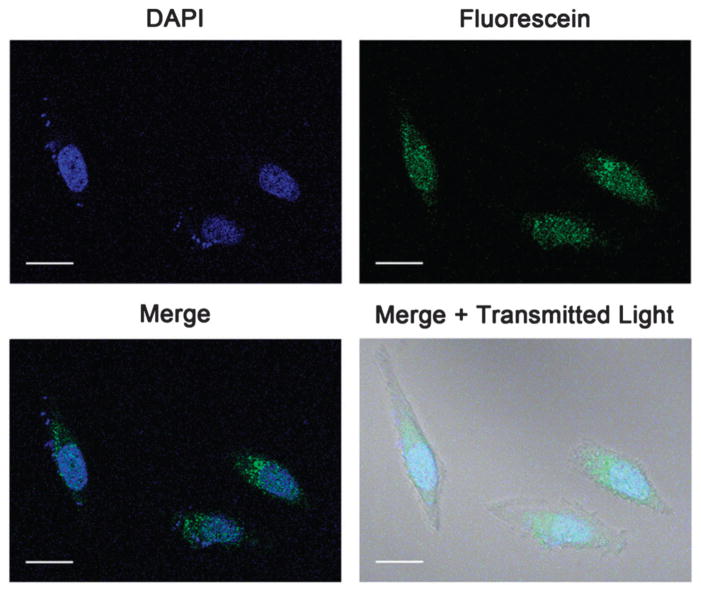
Efficient cell penetration is crucial for the use of imaging probes to investigate biological mechanisms such as fate mapping cells. Cellular localization of 1 was determined using confocal laser scanning microscopy where micrographs showed intracellular accumulation of the probe (Fig. 1, see ESI† for z-stacks and images of unlabeled cells). Larger cell populations were examined with analytical flow cytometry to determine the efficiency of cell labeling. Specifically, HeLa cells were incubated with 21 to 170 μM of 1 and showed increasing accumulation of fluorescein with increasing incubation concentration (Fig. S25, ESI†). Labeling efficiency of 100% was attained at each concentration examined.
Fig. 1.
Confocal fluorescence micrographs of HeLa cells incubated with 85 μM of 1 for 4 hours and 1 μM DAPI for 10 minutes. Images show intracellular accumulation of 1. Images of unlabeled cells and z-stacks can be found in the ESI.† Scale bar = 20 μm. Blue = DAPI, green = fluorescein.
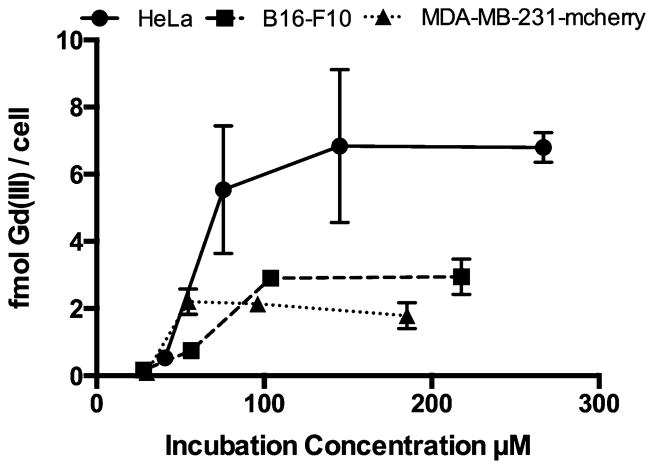
Cellular uptake of Gd(III) was investigated by incubating HeLa, B16-F10, or MDA-MB-231-mcherry cells with concentrations of 1 ranging from 27 to 260 μM (Fig. 2). Cells were washed and pelleted prior to analysis to reduce non-specific binding. The cell lines were chosen to address variability in labeling arising from differences in tissue of origin (cervix, breast, and skin), species of origin (human and mouse), cell size (12–20 μm diameter),22,23 and cell growth rate (20–38 h doubling times).24–26 Cell uptake increased with cell volume with the highest labeling achieved in HeLa cells (6.8 fmol Gd(III) per cell), followed by B16-F10 cells (2.9 fmol Gd(III) per cell), and MDA-MB-213-mcherry cells (2.2 fmol Gd(III) per cell). In all cell lines, uptake plateaued indicating that cells were saturated with 1. These values represent a 10-fold increase in cell uptake compared to ProHance® (Fig. S27, ESI†).
Fig. 2.
Concentration-dependent cell uptake was determined by incubating HeLa, B16-F10, or MDA-MB-231-mcherry cells with varying concentrations of 1 for 24 hours. In all cell lines, uptake reached a plateau indicating that cells were saturated with probe. Error bars represent ± standard deviation the mean of triplicate experiments.
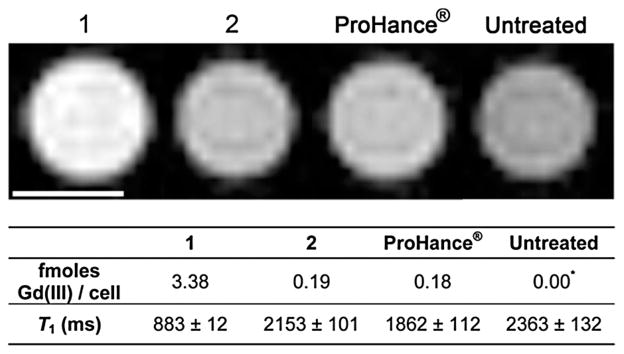
To demonstrate that cell labeling of 1 is sufficient to produce T1-weighted contrast enhancement of cell populations, MR images of cell pellets were acquired at 7 T at cell densities that approximate tumor densities in vivo (Fig. 3). HeLa cells were incubated with 250 μM equalized Gd(III) of 1, 2, or ProHance® (the concentration of ProHance® is 3× higher than 1 or 2). The most significant contrast enhancement was observed in cells labeled with 1 with a 64% reduction in T1 compared to untreated cells, followed by ProHance® (20% reduction in T1), and 2 (8% reduction in T1).
Fig. 3.

T1-weighted cell pellet images of HeLa cells incubated with 1, 2, and ProHance® acquired at 7 T. TE = 11 ms, TR = 500 ms, MTX = 256 × 256, and slice thickness is 1.0 mm. Scale bars represent 1 mm. Error represents ± standard deviation of the mean of 4 slices. These images show that at incubation concentrations of 250 μM Gd(III), (i.e. 83 μM 1 and 2 and 250 μM ProHance®) 1 produces the greatest image contrast.
In conclusion, we have developed a new multimeric and multimodal contrast agent that contains three Gd(III) chelates conjugated to a fluorophore. The agent has high relaxivity at both low (1.4 T) and high magnetic fields (7 T), is highly water soluble, cell-permeable, and possesses excellent cell labeling capabilities. The agent shows significantly increased labeling and image contrast at 7 T compared to clinically available ProHance®. Further, the molecular architecture described can accommodate a large variety of fluorophores to generate additional molecular constructs for enhanced multimodal imaging.
Supplementary Material
Acknowledgments
This work was supported by the National Institutes of Health (NIH grant R01EB005866) and by a National Science Foundation Graduate Research Fellowship (C.C.). Imaging was performed at the Northwestern University Center for Advanced Molecular Imaging generously supported by NCI CCSG P30 CA060553 awarded to the Robert H Lurie Comprehensive Cancer Center.
Footnotes
Electronic supplementary information (ESI) available: Experimental procedures, 1H, 13C, and mass spectra of compounds, cellular toxicity, and cellular labelling of 2. See DOI: 10.1039/c4cc05651e
Notes and references
- 1.Frullano L, Meade TJ. J Biol Inorg Chem. 2007;12:939–949. doi: 10.1007/s00775-007-0265-3. [DOI] [PubMed] [Google Scholar]
- 2.Waerzeggers Y, Monfared P, Ullrich R, Viel T, Jacobs AH. Trends on the Role of PET in Drug Development. 2012:319–382. [Google Scholar]
- 3.Louie A. Chem Rev. 2010;110:3146–3195. doi: 10.1021/cr9003538. [DOI] [PMC free article] [PubMed] [Google Scholar]
- 4.Lipani E, Laurent S, Surin M, Elst LV, Leclere P, Muller RN. Langmuir. 2013;29:3419–3427. doi: 10.1021/la304689d. [DOI] [PubMed] [Google Scholar]
- 5.Rudin M, Weissleder R. Nat Rev Drug Discovery. 2003;2:123–131. doi: 10.1038/nrd1007. [DOI] [PubMed] [Google Scholar]
- 6.Louie AY, Huber MM, Ahrens ET, Rothbacher U, Moats R, Jacobs RE, Fraser SE, Meade TJ. Nat Biotechnol. 2000;18:321–325. doi: 10.1038/73780. [DOI] [PubMed] [Google Scholar]
- 7.Modo M, Roberts T, Sandhu J, Brekke C, Ashioti M, Meade TJ, Price J, Williams SCR. Neurobiol Aging. 2004;25:S19. [Google Scholar]
- 8.Modo M, Beech JS, Meade TJ, Williams SCR, Price J. NeuroImage. 2009;47:T133–T142. doi: 10.1016/j.neuroimage.2008.06.017. [DOI] [PMC free article] [PubMed] [Google Scholar]
- 9.Modo M, Cash D, Mellodew K, Williams SCR, Fraser SE, Meade TJ, Price J, Hodges H. NeuroImage. 2002;17:803–811. [PubMed] [Google Scholar]
- 10.Penet MF, Mikhaylova M, Li C, Krishnamachary B, Glunde K, Pathak AP, Bhujwalla ZM. Future Med Chem. 2010;2:975–988. doi: 10.4155/fmc.10.25. [DOI] [PMC free article] [PubMed] [Google Scholar]
- 11.Keliris A, Ziegler T, Mishra R, Pohmann R, Sauer MG, Ugurbil K, Engelmann J. Bioorg Med Chem. 2011;19:2529–2540. doi: 10.1016/j.bmc.2011.03.023. [DOI] [PubMed] [Google Scholar]
- 12.Mulder WJM, Griffioen AW, Strijkers GJ, Cormode DP, Nicolay K, Fayad ZA. Nanomedicine. 2007;2:307–324. doi: 10.2217/17435889.2.3.307. [DOI] [PubMed] [Google Scholar]
- 13.Lee DE, Koo H, Sun IC, Ryu JH, Kim K, Kwon IC. Chem Soc Rev. 2012;41:2656–2672. doi: 10.1039/c2cs15261d. [DOI] [PubMed] [Google Scholar]
- 14.Guo K, Berezin MY, Zheng J, Akers W, Lin F, Teng B, Vasalatiy O, Gandjbakhche A, Griffiths GL, Achilefu S. Chem Commun. 2010;46:3705–3707. doi: 10.1039/c000536c. [DOI] [PMC free article] [PubMed] [Google Scholar]
- 15.Rivas C, Stasiuk GJ, Gallo J, Minuzzi F, Rutter GA, Long NJ. Inorg Chem. 2013;52:14284–14293. doi: 10.1021/ic402233g. [DOI] [PMC free article] [PubMed] [Google Scholar]
- 16.Huber MM, Staubli AB, Kustedjo K, Gray MHB, Shih J, Fraser SE, Jacobs RE, Meade TJ. Bioconjugate Chem. 1998;9:242–249. doi: 10.1021/bc970153k. [DOI] [PubMed] [Google Scholar]
- 17.Yamane T, Hanaoka K, Muramatsu Y, Tamura K, Adachi Y, Miyashita Y, Hirata Y, Nagano T. Bioconjugate Chem. 2011;22:2227–2236. doi: 10.1021/bc200127t. [DOI] [PubMed] [Google Scholar]
- 18.Kotkova Z, Kotek J, Jirak D, Jendelova P, Herynek V, Berkova Z, Hermann P, Lukes I. Chem – Eur J. 2010;16:10094–10102. doi: 10.1002/chem.200903519. [DOI] [PubMed] [Google Scholar]
- 19.Talanov VS, Regino CAS, Kobayashi H, Bernardo M, Choyke PL, Brechbiel MW. Nano Lett. 2006;6:1459–1463. doi: 10.1021/nl060765q. [DOI] [PubMed] [Google Scholar]
- 20.Mastarone DJ, Harrison VSR, Eckermann AL, Parigi G, Luchinat C, Meade TJ. J Am Chem Soc. 2011;133:5329–5337. doi: 10.1021/ja1099616. [DOI] [PMC free article] [PubMed] [Google Scholar]
- 21.Carney CE, MacRenaris KW, Mastarone DJ, Kasjanski DR, Hung AH, Meade TJ. Bioconjugate Chem. 2014;25:945–954. doi: 10.1021/bc500083t. [DOI] [PMC free article] [PubMed] [Google Scholar]
- 22.Kim U, Shu CW, Dane KY, Daugherty PS, Wang JYJ, Soh HT. Proc Natl Acad Sci U S A. 2007;104:20708–20712. doi: 10.1073/pnas.0708760104. [DOI] [PMC free article] [PubMed] [Google Scholar]
- 23.Wang Y, Maslov K, Zhang Y, Hu S, Yang LM, Xia YN, Liu JA, Wang LHV. J Biomed Opt. 2011;16:011014. doi: 10.1117/1.3525643. [DOI] [PMC free article] [PubMed] [Google Scholar]
- 24.Jacobson BS, Ryan US. Tissue Cell. 1982;14:69–83. doi: 10.1016/0040-8166(82)90008-8. [DOI] [PubMed] [Google Scholar]
- 25.Jessani N, Humphrey M, McDonald WH, Niessen S, Masuda K, Gangadharan B, Yates JR, Mueller BM, Cravatt BF. Proc Natl Acad Sci U S A. 2004;101:13756–13761. doi: 10.1073/pnas.0404727101. [DOI] [PMC free article] [PubMed] [Google Scholar]
- 26.Ohira T, Ohe Y, Heike Y, Podack ER, Olsen KJ, Nishio F, Nishio M, Miyahara Y, Funayama Y, Ogasawara H, Arioka H, Kunikane H, Fukuda M, Kato H, Saijo N. J Cancer Res Clin Oncol. 1994;120:631–635. doi: 10.1007/BF01245372. [DOI] [PubMed] [Google Scholar]
Associated Data
This section collects any data citations, data availability statements, or supplementary materials included in this article.


