

Abstract
Older adults often show different functional activation patterns than younger adults in prefrontal cortex (PFC) when performing cognitive control tasks. These differences include age-related increases in PFC activation magnitude and reorganized PFC functional connectivity patterns. However, it remains unclear whether age-related alterations in brain activation patterns reflect a positive mechanism (e.g. compensatory response) or a sign of brain dysfunction (e.g. reduced efficiency). Here we used functional magnetic resonance imaging (fMRI) to compare PFC activation magnitudes and PFC connectivity patterns between younger and older adult groups during performance of a task switching paradigm. Results indicated age-related increases both in PFC activation magnitudes and in PFC functional connectivity with inferotemporal (IT) regions. However, these age-related fMRI increases were differentially associated with task performance. Whereas increased PFC activation magnitudes tended to be either unrelated to task RT or associated with poorer task performance, increased PFC-IT connectivity was associated with better task performance in older adults. Our results provide new evidence suggesting that mechanisms subserving age-related reductions in efficiency and successful compensation can coexist in older adults in the context of the same task.
Keywords: aging, fMRI, task-related functional connectivity, gPPI, compensation, efficiency
1 INTRODUCTION
Functional brain imaging studies have shown that human aging is accompanied by marked shifts in cortical activation patterns during cognitive task performance (Drag & Bieliauskas, 2010; Spreng, Wojtowicz, & Grady, 2010). Within prefrontal cortex (PFC), an often observed finding has been increased activation in older adults compared to younger adults (Cabeza, 2001; Grady, 2008; Reuter-Lorenz & Cappell, 2008). A central question in this literature is whether age-related PFC activation increases represent a positive compensatory mechanism (e.g. recruitment of additional cognitive resources that aid performance), reduced efficiency, or reduced cortical specialization (e.g. dedifferentiation; Cabeza, 2001; Cabeza & Dennis, 2012; Colcombe, Kramer, Erickson, & Scalf, 2005; Grady, 2012; Park, 2004; Park & Reuter-Lorenz, 2009a; Reuter-Lorenz & Cappell, 2008; Reuter-Lorenz & Park, 2010; Zarahn, Rakitin, Abela, Flynn, & Stern, 2007). Adjudicating between these opposing views may have practical implications in establishing desired end-points of intervention strategies in older adults.
Evidence in support of either of these different theories depends upon the relationships between age-related functional activation alterations and cognitive performance. In general, positive relationships between activation and performance (e.g. increased BOLD response associated with higher accuracy or faster response time) can be viewed as evidence for successful compensation (Cabeza & Dennis, 2012; Park & Reuter-Lorenz, 2009a; Phillips & Andres, 2010), while higher activation in older adults that does not facilitate performance can be characterized as either evidence for reduced efficiency (Gold, Johnson, & Powell, 2013; Rypma, Berger, Genova, Rebbechi, & D’Esposito, 2005; Rypma et al., 2006; Stern, 2009, 2010; Zhu, Johnson, Kim, & Gold, 2013) or a “failed attempt” at compensation (Cabeza & Dennis, 2012).
Activation patterns within PFC serve as an attractive model for potential evidence in support of age-related compensation because PFC contributes to most if not all high level cognitive functions. PFC activation patterns also serve as an attractive model to look for evidence in favor of brain dysfunction theories of neurocognitive aging because PFC is particularly vulnerable to age-related declines (i.e. ‘frontal lobe hypothesis’; c.f. West, 1996). However, another unique feature of PFC organization has been relatively overlooked in motivating analyses related to compensation and brain dysfunction theories. Namely, that PFC is connected with most if not all other cortical regions and contributes to cognition through its distributed connections with other brain structures (Duncan, 2001; Goldman-Rakic, 1987; Miller & Cohen, 2001). Consequently, age-related changes in PFC functional connectivity (fC) are likely to affect cognitive functions and may have important implications for the debate between compensation and dysfunction theories.
In younger adults, increased connectivity during task performance tends to predict improved cognitive function (e.g. resistance to distraction, Yoon, Curtis, & D’Esposito, 2006; visual search efficiency, Rotshtein, Soto, Grecucci, Geng, & Humphrey, 2011; long-term memory encoding, Ranganath, Heller, Cohen, Brozinsky, & Rissman, 2005). However, the link between functional connectivity and task performance is less clear in older adults. While results from several studies suggest that functional networks may become reorganized or diluted with age (Davis, Kragel, Madden, & Cabeza, 2012; Gazes, Rakitin, Habeck, Steffener, & Stern, 2012; Geerligs, Saliasi, Maurits, & Lorist, 2012; Grady, McIntosh, & Craik, 2003; Grady et al., 2010; Madden et al., 2010; St Jacques, Dolcos, & Cabeza, 2010), there is increasing evidence that age-related changes in fC may reflect successful compensatory mechanisms (Davis et al., 2012; Gazes et al., 2012; Grady et al., 2003; for review see Phillips & Andres, 2010).
In the current study we examined age-related differences in PFC activation magnitudes, PFC connectivity patterns, and their association with task performance. PFC connectivity patterns were explored using a generalized psychophysiological interaction (gPPI) approach (McLaren, Ries, Xu, & Johnson, 2012). The value of gPPI over other methods of fC analysis is that it uses all of the available data in the estimation of connectivity. In addition to the PPI terms, the gPPI model included “box-car” regressors that accounted for both between-condition and between-group differences in BOLD magnitude, leaving fC to be evaluated independent of the influence of differences in task-evoked BOLD magnitude. This was particularly important in the current study which sought to investigate task-related fC associated with regions of the PFC exhibiting age-related BOLD magnitude increases. Thus, it was critical that gPPI be used to evaluate fC patterns independent of group differences in BOLD magnitude.
2 METHODS
2.1 Participants
A total of 65 right-handed, English speaking adults (32 younger adults, 33 older adults) participated. Written informed consent was obtained from each participant under an approved University of Kentucky Institutional Review Board protocol. Participants were recruited from the community and were monetarily reimbursed for their participation. Exclusionary criteria for the study included the following: color blindness, major head injury, stroke, neurological or psychiatric disorder, high blood pressure, diabetes, heart disease, the use of psychotropic drugs, and or the presence of metal fragments and/or metallic implants contraindicated for MRI.
Task switching performance is known to be correlated with intelligence and digit span (Kray & Lindenberger, 2000). The task switching paradigm employed in the present study involved switching between non-verbal perceptual judgments. Thus, the Cattell Culture Fair Intelligence Test (Cattell & Cattell, 1960) was used as a measure of intelligence because it assesses non-verbal intelligence associated with perceiving inductive relationships in shapes and figures. Digit span forward and backward were assessed with The Digit Span Subtests of the Wechsler Memory Scale (WMS III; Wechsler Memory Scale, Third edition, San Antonio, TX: Harcourt Assessment.). Totals for the digit span forward and digit span backward were based on the number of trials that were accurately reported in the correct order. There was no significant difference between younger and older groups in male/female ratio (X2 = 1.85, p = 0.17), years of education (t(63)=0.20, p=0.84), IQ (t(61)=1.20, p=0.24), digit span forward (t(61)=0.32, p=0.75), or digit span backward (t(61)=0.35, p=0.73; see Table 1).
TABLE 1.
Demographic Data and Neuropsychological Scores
| Age Group | Age Range | Mean Age | N (female) | Education (Yrs) | IQ | DF | DB |
|---|---|---|---|---|---|---|---|
| Younger | 25-40 | 32.1 (3.6) | 32 (15) | 16.4 (2.8) | 124.5 (20.7) | 10.6 (2.3) | 9.8 (2.8) |
| Older | 63-83 | 68.4 (5.4) | 33 (21) | 16.5 (2.8) | 130.2 (17.0) | 10.4 (2.0) | 10.0 (2.5) |
Notes. IQ, Cattell Culture Fair Intelligence Test; DF, digit span forward; DB, digit span backward. Values for IQ and DB are age-scaled scores. Standard deviations in parentheses. DF, & DB scores were missing from two participants in the older group.
2.2 Materials and Procedure
Participants completed a color-shape task switching paradigm (Figure 1). The stimuli consisted of two possible shapes (circle or square), in one of two possible colors (red or blue), presented in the center of the screen. In the color block, participants were required to judge if each stimulus was red or blue. In the shape block, participants were required to judge if each stimulus was a circle or a square. In the switch block, participants alternated between shape and color judgments. Responses were made using MRI compatible response boxes (one in each hand). Participants were asked to press the left or right button to indicate whether the stimulus was blue or red, or circle or square, depending upon the cue word. Participants were asked to respond as quickly and accurately as possible.
Figure 1. Color-Shape Task Switching Paradigm.
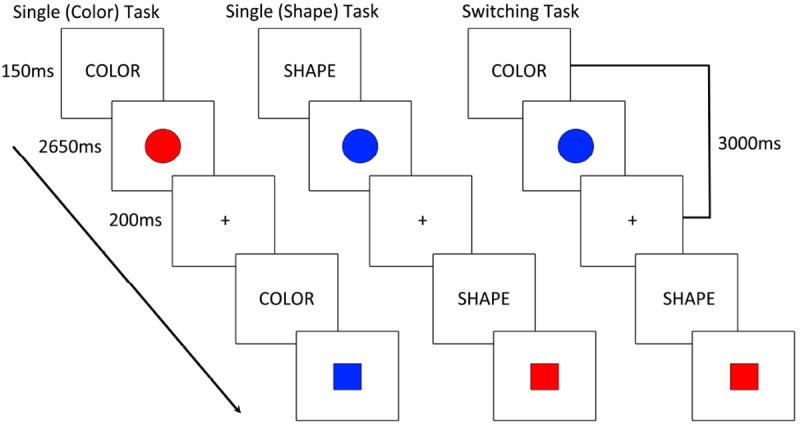
Each trial started with an instructional cue (150ms) followed by a colored-shape (2650ms). Trials within task blocks were separated by a 200ms fixation point. (LEFT) Single task blocks involved repetition of either the color or shape judgments for the duration of the block. (RIGHT) Switching task blocks involved pseudorandomly switching between color and shape judgments.
Participants were given an instructional cue at the beginning of each trial (the word “color” or “shape”) which was displayed for 150ms center-screen. The instructional cue was replaced by the target stimulus which was displayed for 2650ms and did not terminate upon a response. Each trial ended with 200ms of central fixation (plus-sign) prior to the start of the next trial. During shape or color task blocks (i.e. “single task”) participants made the same judgment on every trial (e.g. the instructional cue was also repeated on every trial). During switching blocks the task alternated pseudorandomly across trials, with a 50% chance of repeating/switching in consecutive trials for a total of approximately 40 switches per participant (see Figure 1).
Task blocks were 60 seconds in duration (20 trials per block), and fixation periods were 30 seconds in duration. There were three runs. Each run contained 4 task blocks and 5 fixation periods. One run consisted of two blocks of each of the color task and shape task. The other two runs contained one block each of the color task and shape task and two switching blocks. The order of runs, task blocks within runs, and stimulus-response mappings were counterbalanced across participants. Task stimuli were generated by E-prime software (Psychology Software Tools, Inc, Pittsburgh, PA) and projected to a mirror mounted on the MRI head coil using an MRI compatible projector. Response time and accuracy for subject responses on each trial were recorded by the stimulus presentation program.
Prior to scanning, participants received task instructions along with a maximum of 60 trials of practice for each condition (i.e. each single task and the switching task) to reach 75% accuracy criterion before proceeding to the scanner. All participants reached this accuracy criterion within the allotted 60 trial maximum. After the scan session participants were given a brief break followed by administration of the neuropsychological measures.
2.3 Imaging Data Acquisition
Imaging data was collected on a 3T Siemens TIM scanner at the University of Kentucky’s Magnetic Resonance Imaging and Spectroscopy Center. Four types of images were collected: 1) high-resolution T1-weighted image for functional image registration; 2) T2*-weighted images sensitive to the BOLD signal; 3) diffusion tensor images (not reported here); and 4) B0 field map sequence for geometric unwarping of functional images.
High-resolution T1-weighted images were collected using an MPRAGE sequence (TR = 2100ms; TE = 2.93ms; FA = 12 degrees; resolution = 1 × 1 × 1mm isotropic). Functional images were collected using a T2*-weighted gradient echo-planar sequence (TR = 2000ms, TE = 30ms, FA = 77 degrees, FOV = 224mm2, matrix = 64 × 64, resolution = 3.5 mm isotropic, 33 interleaved slices). B0 field map images were collected using a double-echo planar imaging sequence (TE1 = 5.19ms; TE2 = 7.65ms).
2.4 Imaging Data Preprocessing
Imaging data were preprocessed and analyzed using FMRIB’s Software Library (FSL) and fMRI Expert Analysis Tool (FEAT; Jenkinson, Beckmann, Behrens, Woolrich, & Smith, 2012; Smith et al., 2004). Functional data were brain-extracted (i.e. skull-stripped) and motion-corrected to the median functional image using b-spline interpolation (4 df). The resulting functional images were unwarped via B0 field maps to reduce magnetic field distortions, high-pass filtered (60 s/cycle), and spatially smoothed [9 mm full width at half maximum (FWHM), isotropic]. The anatomical volume was brain-extracted and registered to standard space T1 MNI 2 × 2 × 2mm template with FMRIB’s Non-linear Image Registration Tool (FNIRT; Andersson, Jenkinson, & Smith, 2010). Each participant’s median functional image was co-registered to their anatomical volume and warped to standard space using the non-linear warping matrix generated by the transformation of anatomical volume to standard space (Andersson et al., 2010). All resulting functional images were interpolated to 2 × 2 × 2mm resolution for group analysis in MNI standard space.
2.5 Subject-Level Analysis
Functional data was first modeled at the individual subject level by fitting a voxel-wise General Linear Model (GLM) to the BOLD data acquired for each run. Each run was modeled separately and included task regressors for the color, shape, and switching task blocks. Task regressors were modeled as a box-car function and convolved with a canonical double-gamma hemodynamic response function. Lower-level contrast maps for single (average of color and shape task) and switching task were passed to a 2nd level fixed effects model. In the 2nd level model maps for each condition were averaged across the three runs.
2.6 Group Analyses
We first performed a combined-group analysis on BOLD fMRI data to identify PFC regions showing robust sensitivity to task switching in our study participants for subsequent region of interest (ROI) analyses. These regions were identified via a repeated measures contrast between switching and single task conditions across all participants. To perform this contrast, each participant’s single and switching task contrast maps from the 2nd level fixed effects model were entered into a group GLM along with an additional regressor per participant to account for subject-specific variance.
2.7 Thresholding and ROI Definition
Monte Carlo simulations using the AlphaSim program were used to empirically derive an appropriate combination of voxel-significance and cluster extent required to reach a whole-brain corrected significance threshold of p < 0.05, taking into account both native space voxel dimensions and the effective smoothness estimated directly from our preprocessed data (http://afni.nimh.nih.gov/pub-/dist/doc/manual/AlphaSim.pdf). The Monte Carlo simulations used 1000 iterations and indicated a voxel-significance level of p < 0.001 and a minimum cluster extent of 22 contiguously significant voxels (176 mm3) in order to reach a whole-brain corrected significance level of p < 0.05. This threshold was applied to each contrast described here.
2.8 BOLD Magnitude ROI Analyses
Mean BOLD magnitude estimates (z-transformed parameter estimates for each condition versus implicit baseline) were extracted from five significant PFC clusters from the switching > single task contrast described above. These PFC ROIs identified in our participants (ACC, bilateral DLPFC and bilateral VLPFC) have frequently been reported to show sensitivity to task switching in previous studies of younger adults and older adults (DiGirolamo et al., 2001; Gold, Powell, Xuan, Jicha, & Smith, 2010; Kim, Cilles, Johnson, & Gold, 2012; Madden et al., 2010). ROI masks were generated with a 5mm-radius sphere centered on the peak voxel coordinate within each cluster. Group comparisons were conducted on ROI data to determine which of these regions showed age-related changes in BOLD magnitude. To limit the number of comparisons associated with functional correlates of age-related over-recruitment in regions of the PFC, subsequent correlation analyses tested for possible relationships between RT and BOLD magnitude in ROIs showing (1) sensitivity to task-switching across participants and (2) age-related over-recruitment. Two regions met these criteria: the left VLPFC and left DLPFC. These BOLD-performance correlations focused on RTs rather than accuracies, which were near ceiling.
2.9 Task-Related Functional Connectivity (fC) Analysis
The left DLPFC ROI (-44, 22, 28) was selected as the seed for the fC analysis. A generalized form of the psychophysiological interaction (gPPI) model was implemented to examine task-dependent functional connectivity (McLaren et al., 2012). Each run of each participant’s functional scans was modeled separately and recombined in a fixed-effects 2nd level model before proceeding to group analysis. The gPPI model involved general linear modeling of the task conditions (psychological terms), the seed timecourse (physiological term), and an interaction term for each task condition × the seed timecourse. The resultant 1st level model for each participant included the following regressors: color task (single), shape task (single), switching task, the seed timecourse, color task × seed PPI, shape task × seed PPI, switching task × seed PPI, and 6 motion parameters as confound regressors.
Before proceeding to a group fC model, a repeated measures t-test for each single task (color and shape) was conducted within each group. As no difference in fC between the single tasks was observed in either group, a single gPPI term corresponding to the average of fC across the two single task conditions was passed to the group level. After averaging each participant’s 1st level gPPI terms in a 2nd level fixed-effects model two group models were constructed in order to accurately parse group-specific error variance. The first group model represented a 2 (task condition: single/switching) × 2 (group: younger/older) Mixed Effects ANOVA where the main-effect of task condition and task condition × group interaction terms were estimated. In the 2 × 2 ANOVA, each participant’s single task and switching task gPPI maps were entered along with a single regressor per participant to account for subject-specific variance (i.e. repeated measures). The second group model represented an independent samples t-test where the main-effect of group was evaluated. In this model the average of each participant’s single task and switching task gPPI maps were entered and a two-tailed group comparison was conducted.
3 RESULTS
3.1 Behavior (Error Rates and RT)
A 2 (group) × 2 (task condition) repeated measures ANOVA on error rate reveal a significant main-effect of task condition (F(1,63) = 31.94, MSE = 173, p < 0.001) where overall error rates were higher for the switching task (M = 4.7, SD = 4.5) than the single task (M = 2.4, SD = 2.5; t(64) = 14.27, (p < 0.001). No significant main-effect of group (F(1,63) =0.01, MSE = 0.25, p = 0.91) or group × task condition interaction was observed (F(1,63) = 0.25, MSE = 1.37, p = 0.62). Overall error rates were low for both groups (younger: M = 3.5, SD = 3.4; older: M = 3.6, SD = 3.2).
A 2 (group) × 2 (task condition) repeated measures ANOVA on mean RT revealed a significant main-effect of group (F(1,63) = 22.15, MSE = 942069, p < 0.001), where older adults (M = 882, SD = 147) were overall slower than younger adults (M = 712, SD = 145; t(63) = 4.7, p < 0.001) and task condition (F(1,63) = 211.12, MSE = 1691838, p < 0.001) where participants were overall faster during the single (M = 684, SD = 136) than switching task (M = 913, SD = 216; t(64) = 14.27, p < 0.01), and a marginal group × task condition interaction (F(1,63) = 3.63, MSE = 29058, p = 0.06). To control for the possibility that the marginal group × task interaction emerged as a multiplicative effect of general age-related slowing (Salthouse, 2000) we conducted a second repeated measures ANOVA on log-transformed mean RT data (also see Mayr, 2001). The results of this control test revealed that the marginal interaction between group and task condition is better accounted for by general RT slowing in the older adult group (corrected group × condition, F(1,63) = 0.08, MSE = 0.001, p = 0.78).
3.2 Functional Activations During Task Switching
The switching > single task contrast across all participants revealed significant activation differences in brain regions within all four lobes, prominently including frontoparietal regions. In particular, increased activation in the switching task was observed in multiple regions of PFC including ACC, bilateral DLPFC, and bilateral VLPFC (Figure 2a). In contrast, there were no regions showing significantly greater activation in the single than the switching task condition.
Figure 2. Functional Activation During Single and Switching Task Blocks.
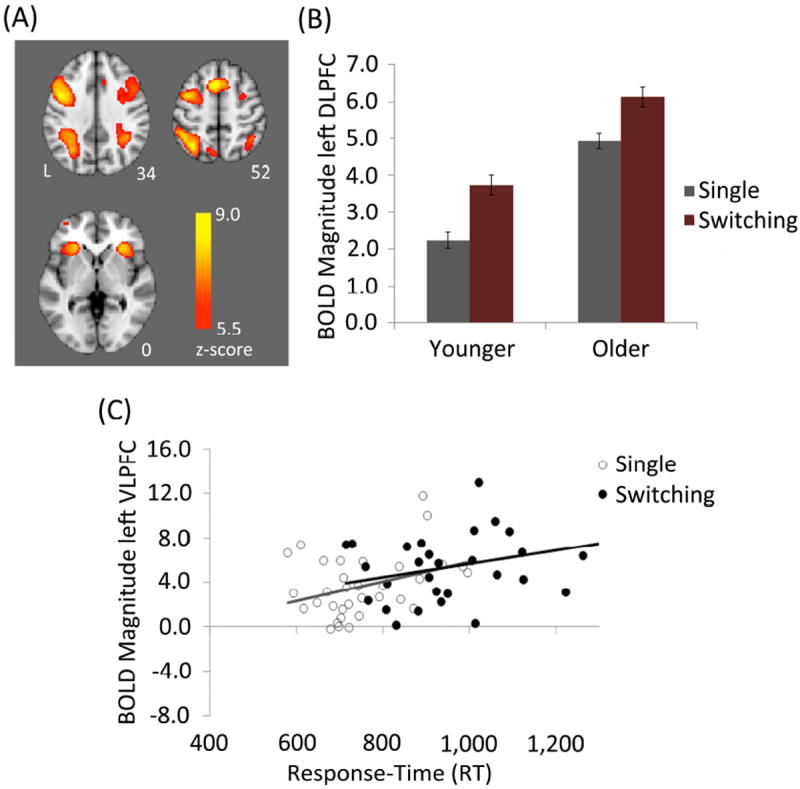
(A) Voxelwise results from the switching > single task contrast across groups. (B) Older adults showed higher activation in the left DLPFC during both task conditions. (C) A significant relationship was observed in the older adult group between left VLPFC BOLD magnitude and RT for both single and switching task conditions.
3.3 ROI BOLD Magnitude
Two of the five PFC regions showing significant sensitivity to task switching, the left VLPFC and the left DLPFC, showed significantly greater BOLD response in older adults compared to younger adults. The results of 2 (group) × 2 (task condition) mixed effects ANOVAs on BOLD magnitude in the left VLPFC ROI revealed a significant main-effect of group (F(1,63) = 12.0, MSE = 3147, p = 0.001) and task condition (F(1,63) = 89.3, MSE = 3198, p < 0.001), but no group × task condition interaction (F(1,63) = 0.26, MSE = 9.28, p = 0.61). Similarly, significant main-effects of group (F(1,63) = 8.04, MSE = 7744, p = 0.006) and task condition (F(1,63) = 95.7, MSE = 10609, p < 0.001) were observed in the left DLPFC ROI in the absence of a group × task condition interaction (F(1,63) = 0.06, MSE = 6.41, p = 0.81). Follow-up t-tests on the main-effects of group revealed that in each of these regions, age-related BOLD increases were observed in both the single task (left VLPFC: t(63) = 3.30, p = 0.002; left DLPFC: t(63) = 3.98, p < 0.001) and the switching task (left VLPFC: t(63) = 3.22, p = 0.002; left DLPFC: t(63) = 3.51, p = 0.001; Figure 2b).
In the left VLPFC region that showed age-related over-recruitment, there was a significant positive correlation between BOLD magnitude and RT in the single (r = 0.35, p = 0.048) and switching tasks (r = 0.39, p = 0.026) in the older group (Figure 2c). In the left DLPFC region that showed age-related over-recruitment, there was no correlation between BOLD magnitude and RT in the single or switching tasks (both p’s ≥ 0.66) in the older group. There was no correlation between RT and BOLD magnitude in either of these regions, in either condition, in the younger adult group (all p’s ≥ 0.26). The full set of correlations in the five PFC regions showing sensitivity to task switching in our participants (including the three that did not show age-related over-recruitment) are summarized in Table 2 for completeness and comparison with future studies but are not interpreted further.
TABLE 2.
Correlations between PFC ROIs and RT by Age Group
| Age Group | ACC (-4, 14, 52) |
right DLPFC (44, 28, 30) |
right VLPFC (30, 26, 2) |
left VLPFC (-28, 25, 6) |
left DLPFC (-44, 22, 28) |
|---|---|---|---|---|---|
| Younger | |||||
| Single Task | -.11 | .17 | -.10 | -.16 | -.20 |
| Switching Task | .21 | .35* | .22 | .07 | -.02 |
| Older | |||||
| Single Task | .05 | .29 | .28 | .35* | .07 |
| Switching Task | .16 | .27 | .32† | .39* | -.04 |
= p < 0.05,
= p < 0.1; MNI coordinates for each ROI in parentheses (x, y, z)
3.4 Task-related functional connectivity (fC)
The left DLPFC ROI (-44, 22, 28) was selected as the seed for the fC analysis based on the voxelwise and BOLD magnitude results (above). This region showed increased BOLD response in older adults that did not facilitate performance. It was thus of theoretical interest to this study to determine if the same region that was over-recruited at the local response level was associated with a change in connectivity at the network level. The results of the 2 (group) × 2 (task condition) mixed effects ANOVA on PPI maps revealed no significant main-effect of task condition or group × task condition interactions. However, the results of our group comparison revealed a significant main-effect of group across several regions of the brain (Table 3). Evaluation of one-way group PPI maps (mean positive fC and mean inverse fC across task conditions) revealed several regions of positive and inverse fC overlap between groups. For example, the left DLPFC in both older and younger adults showed patterns of inverse fC with bilateral superior/middle temporal gyrus (STG/MTG), regions of the basal ganglia, and midline regions of the prefrontal and parietal cortices. Further, a common region of positive fC included the superior parietal cortex (Figure 4).
TABLE 3.
Main-effect of Group for Functional Connectivity
| Region | Voxels | Z-MAX | X | Y | Z | Group |
|---|---|---|---|---|---|---|
| Right Visual/Temporal Cortex | 3271 | 4.66 | 34 | -38 | -16 | |
| Inferotemporal Cortex | 52 | -62 | -14 | O+ | ||
| Primary Visual Cortex | 2 | -82 | -8 | O+ | ||
| Occipital Fusiform | 42 | -60 | -8 | O+ | ||
| Temporal Occipital Fusiform | 36 | -46 | -18 | O+/Y- | ||
| Lateral Occipital Cortex | 44 | -72 | 12 | O+/Y- | ||
| Lateral Dorsal Occipital Cortex | 34 | -78 | 30 | O+/Y- | ||
| Right Temporal Pole | 102 | 4.19 | 50 | 14 | -34 | Y- |
| Left Visual/Temporal Cortex | 3184 | 4.85 | -14 | -44 | -12 | |
| Occipital Fusiform | -32 | -64 | -12 | O+ | ||
| Lateral Occipital Cortex | -32 | -84 | 8 | O+ | ||
| Parrahippocampal Gyrus | -24 | -26 | -14 | O+/Y- | ||
| Lingual/Parrahippocampal | ||||||
| Gyrus | -16 | -44 | -12 | O+/Y- | ||
| Middle Temporal Gyrus | 116 | 3.67 | -68 | -16 | -8 | Y- |
| Inferotemporal Cortex | 30 | 3.63 | -54 | -60 | -18 | O+ |
| PFC | ||||||
| Left Superior Frontal Gyrus | 636 | 5.09 | -12 | 54 | 42 | Y- |
| Left Medial Frontal Cortex | 192 | 4.11 | -8 | 44 | -8 | Y- |
| Right Inferior Frontal Gyrus | 60 | 3.76 | 52 | 38 | 4 | Y- |
| Subgenual Anterior Cingulate | ||||||
| Cortex | 33 | 3.52 | -4 | 28 | -10 | Y- |
| Right Precentral Gyrus | 25 | 3.45 | 44 | 4 | 24 | Y- |
| Parietal | ||||||
| Right Postcentral Gyrus | 672 | 5.09 | 52 | -20 | 34 | Y- |
| Left Postcentral Gyrus | 272 | 4.30 | -54 | -24 | 50 | Y- |
| Left Supramarginal Gyrus | 126 | 3.81 | -54 | -60 | 24 | Y- |
| Precuneus | 39 | 3.60 | 0 | -40 | 72 | O+>Y+ |
| Left Posterior Cingulate Gyrus | 37 | 3.53 | -12 | -54 | 44 | Y- |
Regions in italics = local peaks from the two large clusters observed spanning visual/temporal cortex; Group = denotes which group (or both, e.g. “O+/Y-”) drove the main-effect of age
Figure 4. Positive and Inverse Group PPI Maps.
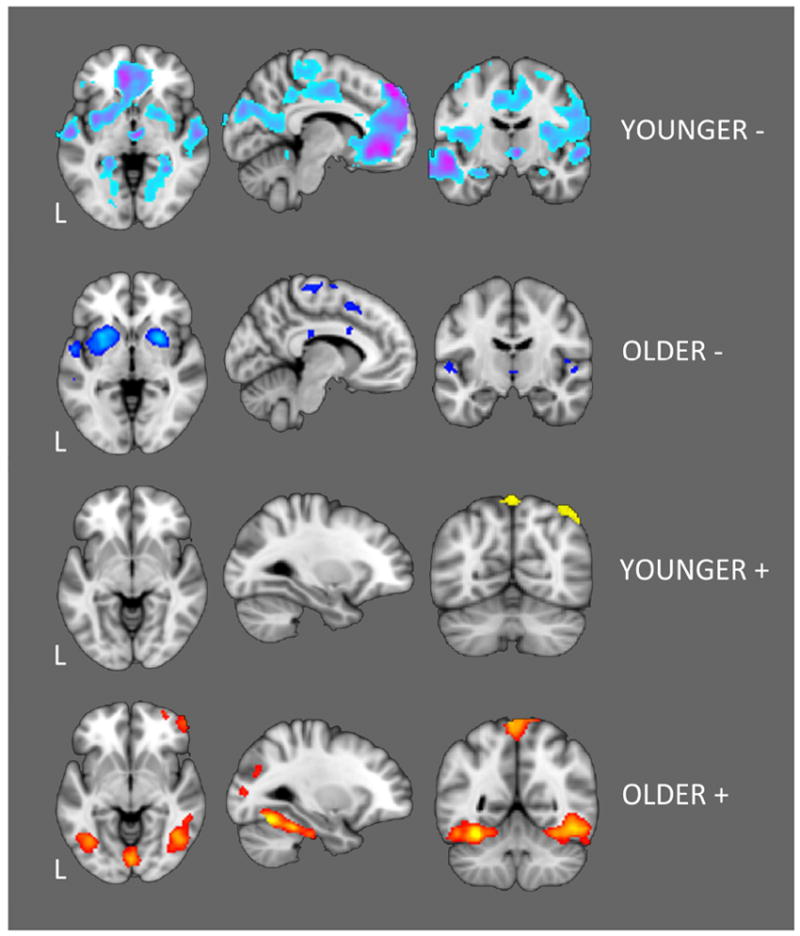
Younger adults tended to show widespread inverse fC between left DLPFC and task-negative regions whereas older adults tended to show widespread positive fC with task-positive areas of ventral primary and association visual cortices. The results presented in this figure provide an overview of within-group connectivity patterns. However, apparent between-group differences may in part reflect thresholding effects and should thus only be interpreted in the direct comparison results shown in Figure 5.
Direct group comparison of mean task-related fC revealed several significant group differences in fC (Figure 5). Generally, greater positive fC was observed in older adults between the left DLPFC and areas of the inferior occipital and temporal lobes. In contrast, greater inverse fC was observed in younger adults across areas of the midline prefrontal and parietal cortices and the MTG. Given this pattern in between-group directional fC results, for the purpose of subsequent fC-performance correlation analyses, it was important to identify those age-related fC increases resulting from a true positive increase in older adults from those due to relatively greater negative fC effect in the younger adults. Thus, we summarized mean fC within 5mm-radius spherical masks centered on the peak group difference within each cluster and then coded each cluster based on whether the region, in either group, showed significant non-zero positive or inverse fC with the region. In order to provide a conservative determination of non-zero connectivity strength (i.e. identify true group-specific effects) this analysis was performed at the ROI-based threshold of p < 0.05. The results of this analysis are color-coded in Figure 5.
Figure 5. Main-effect of Age.
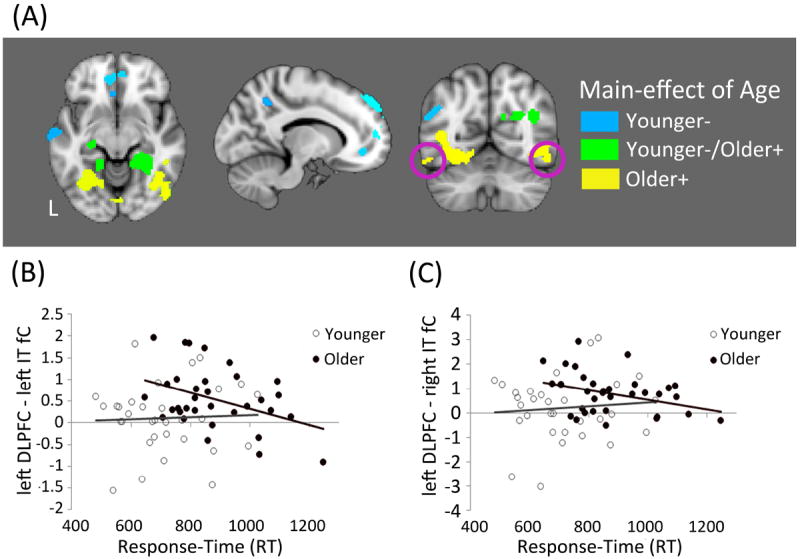
(A) Direct comparison between older and younger adults revealed a number of group differences in task-related fC. The purple circles identify the area of IT cortex shown in the scatter-plots. Task-related fC between the left DLPFC and (B) left IT cortex and (C) right IT cortex was negatively correlated with RT in the older group.
3.5 Task-related fC and Performance in Older Adults
We observed a significant increase in fC among regions of primary and visual association cortex that was specific to the older adult group (see Table 3 “O+” regions). In order to examine whether age-related change in fC might be compensatory in nature we conducted a correlation analysis between left DLPFC fC and mean RT during task performance. From among these six regions (labeled O+ in Table 3), a significant negative correlation between left DLPFC fC and mean RT was observed in both the left IT cortex only in the older adult group (r = -0.40, p = 0.021) and the right IT cortex only in the older adult group (r = -0.35, p = 0.047; see Figure 5 for scatter-plots).
4 DISCUSSION
We compared relationships between PFC BOLD magnitude and PFC connectivity patterns and task switching performance in older and younger adult groups. In general, higher BOLD magnitude in PFC regions was either unrelated to task RT or associated with slower RT in older adults, suggesting reduced efficiency. In contrast, age-related increases in connectivity between a region of the left DLPFC and ventral visual cortex was associated with faster task performance, suggesting successful compensation. Our results are among the first to provide evidence that mechanisms of reduced efficiency (in terms of activation magnitude) and successful compensation (in terms of task-related fC) can operate in the same older adult participant, under the same task conditions. As such, our results provide an instance in which compensation and efficiency mechanisms may co-exist rather than being mutually exclusive.
Age-related increases in PFC recruitment have been observed across a number of task domains (Drag & Bieliauskas, 2010; Reuter-Lorenz & Park, 2010; Spreng et al., 2010). However, it remains debated whether PFC increases reflect an adaptive, compensatory response (Cabeza & Dennis, 2012; Grady, 2012; Park & Reuter-Lorenz, 2009b; Reuter-Lorenz & Cappell, 2008) or are more reflective of age-related brain dysfunction (Colcombe et al., 2005; Gold, Kim, Johnson, Kryscio, & Smith, 2013; Rypma et al., 2005; Rypma et al., 2006; Stern, 2009, 2010; Zarahn et al., 2007; Zhu et al., 2013). In the present study we found that higher PFC BOLD magnitudes were either associated with poorer task performance or unrelated to performance. In addition, the same trend in BOLD-RT relationships in PFC was observed in younger adults such that higher activation was unrelated to performance or associated with slower performance.
In contrast, we did not observe any instances in either group or condition in which BOLD magnitude in PFC was associated with faster performance. Given that switching and single task conditions were performed with high accuracy, our findings are consistent with efficiency accounts of individual differences in BOLD response, which suggests that faster performers may require less frontal recruitment in order to accurately perform the task (Colcombe et al., 2005; Gold, Kim, et al., 2013; Rypma et al., 2005; Rypma et al., 2006; Stern, 2009, 2010; Zarahn et al., 2007; Zhu et al., 2013). With respect to compensatory models of age-related BOLD activation increases, this pattern is often characterized as a “failed attempt” at compensation, i.e. increased activation being unrelated to performance (Cabeza & Dennis, 2012).
However, evidence of successful compensation among older adults was observed in the results of our functional connectivity analysis. Specifically, older adults showed (1) a marked increase in positive fC between the left DLPFC and ventral visual regions compared to younger adults and (2) these age-related connectivity increases were correlated with faster task performance. This finding is particularly noteworthy in that although increasing BOLD response levels in left DLPFC did not aid performance, increased coupling of BOLD response in this region with response in distal ventral visual regions was associated with better performance. Thus, our results provide evidence of age-related compensation in the form of increased functional connectivity among large-scale brain networks (for additional evidence of fC compensation see Davis et al., 2012; Gazes et al., 2012; Grady et al., 2003).
It is important to highlight that the relationship between PFC-IT fC and performance observed here in older adults was observed for older adults compared to younger adults across both task conditions (a main-effect of group but no effect of task or age by task interaction). Consequently, our findings do not suggest that age-related increase in fC facilitates task switching ability, per se. Rather, age-related increases in fC may facilitate a cognitive process that is common to both the single and switching task contexts. Our task switching paradigm involved two types of perceptual judgments (color & shape) performed on a common set of stimuli (colored shapes). Given all stimuli in the single- and switching-task blocks were bivalent (affording a response associated with each task set) the demand to selectively attend the relevant stimulus dimension was present in both task conditions. Thus, age-related increases in fC between the PFC and visual association cortices observed in our study may emerge in response to increased pressure placed on selective attention resources in older adults.
Younger adults would be expected to upregulate executive resources to bias competition between visual feature dimensions primarily in the switching condition (Duncan, 2001; Miller & Cohen, 2001). However, older adults may upregulate similar executive resources even during single-task blocks (DiGirolamo et al., 2001) in an attempt to combat age-related declines in selective attention (e.g. reduced distractor suppression, Gazzaley, Cooney, Rissman, & D’Esposito, 2005; c.f. Reuter-Lorenz & Park, 2010). Our results suggest that increased PFC-IT fC may contribute to such a compensatory response in older adults.
IT cortex has been shown to exhibit object-specific patterns of activation in humans and monkeys (Kriegeskorte et al., 2008; J. Tanaka, 1999; K. Tanaka, 1996; Tong, Rademaker, & Cohen, 2012). Given the known role of ventral visual association cortex in object identification (Mishkin, Ungerleider, & Macko, 1983), IT cortex would be a reasonable target of compensatory control signaling from the PFC in older adults. The results of our fC analysis showed that younger adults, on average, did not maintain sustained fC between the left DLPFC and IT cortex. The lack of positive fC observed in the younger group, however, was not attributable to a lack of BOLD activation in this region as a follow-up analysis revealed significant BOLD activation in the left DLPFC for both the single and switching task conditions in the younger adult group.
The results of our fC analysis align well with previous reports of age-related alterations in task-related fC, although the direction of these alterations has varied (Davis et al., 2012; Gazes et al., 2012; Geerligs, Maurits, Renken, & Lorist, 2012; Grady et al., 2003; Grady et al., 2010; Madden et al., 2010; St Jacques et al., 2010). Of particular relevance, a previous investigation using a task switching paradigm reported age-related decreases in fC (Madden et al., 2010). Importantly, however, this previous study evaluated fC at the onset of instructional cues to switch tasks (e.g. event-related fC through beta-series analysis). Previous work has demonstrated that older adults may show difficulty with task demands at both the level of task blocks and local trials (Kray & Lindenberger, 2000; Mayr, 2001). Given these impairments may map separately onto sustained and dynamic cognitive processes, the difference between the findings by Madden and colleagues (2010) and the current results may in part be explained by the difference in fC approach (e.g. sustained block-level and local preparation-related fC).
We note several caveats associated with our study. Although the gPPI method we employed has a number of important strengths (as discussed in the Introduction), like all methods, it also has some limitations. One limitation of the gPPI method is that it suffers from a degree of colinearity with block-level, physiological, and interaction regressors all part of the same model (McLaren et al., 2012). It is possible that our failure to observe a change in fC between single and switching task conditions emerged as a function of colinearity between regressors within subject-level models. However, as the goal of the current study was to evaluate age-related changes in fC, inspection of within-group PPI maps (e.g. Figure 3) and the results of our group comparison confirm that the gPPI method was efficient at modeling task-related fC and provided insight into age-related changes in task-related fC.
Figure 3. Location of the left DLPFC seed region.
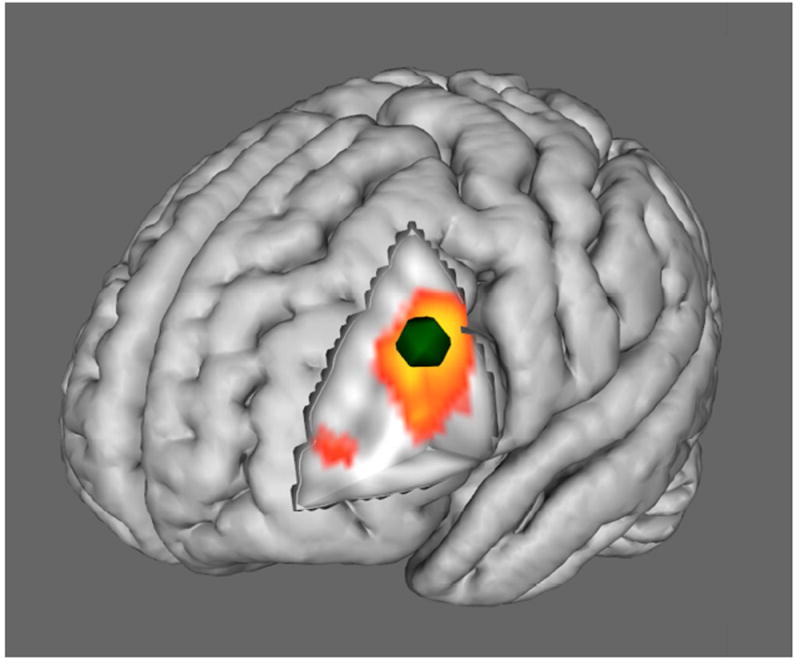
The peak of a cluster located in the left DLPFC (-44, 22, 8) was selected from voxelwise results (in Figure 2a) as the seed region for the functional connectivity analysis. The location of the left DLPFC seed region is displayed in green.
A related caveat associated with most fC studies involves the requirement to define a seed region. While a seed-based analysis allowed us to identify PFC-IT connections of functional significance to older adult performance, future work applying latent variable and model-free approaches will help to expand the scope of age-related changes in fC during task performance. Given that regions beyond the PFC are involved in executive cognition (e.g. the superior parietal lobe; Esterman, Chiu, Tamber-Rosenau, & Yantis, 2009; Kim, Johnson, Cilles, & Gold, 2011) future investigations should examine age-related changes in fC using other non-PFC seed regions. Lastly, it should be noted that our ROI analyses were not corrected for multiple comparisons. It is thus the overall pattern of findings linking compensation more strongly with age-related increases in PFC functional connectivity than local PFC magnitude that forms our strongest conclusion. In contrast, conclusions regarding any specific relationship between PFC regions and performance should be considered preliminary and interpreted with due caution.
5 CONCLUSIONS
Our results suggest that aging can be associated with coexisting reductions in efficiency and successful compensation under the same task conditions. Whereas age-related increase in BOLD magnitudes in PFC regions such as left DLPFC were not facilitative of task performance, age-related connectivity increases between the same left DLPFC region and ventral visual cortex were associated with faster RT. These age-related increases in PFC-ventral visual connectivity may emerge from increased pressure to selectively attend to relevant stimulus feature dimensions in aging. By upregulating this form of cognitive control, older adults may reduce competition between stimulus feature dimensions and improve their performance.
Acknowledgments
This study was supported by the National Institute on Aging of the National Institutes of Health under award number R01AG033036. The content is solely the responsibility of the authors and does not necessarily represent the official views of these granting agencies. We thank Sara Cilles and Chobok Kim for their assistance in recruiting and testing participants. In addition, we wish to thank our study volunteers for their participation in this research.
Footnotes
Publisher's Disclaimer: This is a PDF file of an unedited manuscript that has been accepted for publication. As a service to our customers we are providing this early version of the manuscript. The manuscript will undergo copyediting, typesetting, and review of the resulting proof before it is published in its final citable form. Please note that during the production process errors may be discovered which could affect the content, and all legal disclaimers that apply to the journal pertain.
References
- Andersson JLR, Jenkinson M, Smith S. Non-linear registrationm, aka spatial normalisation. FMRIB technical report TR07JA2 2010 [Google Scholar]
- Cabeza R. Cognitive neuroscience of aging: contributions of functional neuroimaging. Scand J Psychol. 2001;42(3):277–286. doi: 10.1111/1467-9450.00237. [DOI] [PubMed] [Google Scholar]
- Cabeza R, Dennis NA. Frontal lobes and aging: Deterioration and compensation. In: K R, Stuss DT, editors. Principles of Frontal Lobe Function. 2. New York: Oxford University Press; 2012. pp. 628–652. [Google Scholar]
- Cattell RB, Cattell AKS. Handbook for the individual or group culture fair intelligence test. USA: IPAT; 1960. [Google Scholar]
- Colcombe SJ, Kramer AF, Erickson KI, Scalf P. The implications of cortical recruitment and brain morphology for individual differences in inhibitory function in aging humans. Psychol Aging. 2005;20(3):363–375. doi: 10.1037/0882-7974.20.3.363. [DOI] [PubMed] [Google Scholar]
- Davis SW, Kragel JE, Madden DJ, Cabeza R. The architecture of cross-hemispheric communication in the aging brain: linking behavior to functional and structural connectivity. Cereb Cortex. 2012;22(1):232–242. doi: 10.1093/cercor/bhr123. [DOI] [PMC free article] [PubMed] [Google Scholar]
- DiGirolamo GJ, Kramer AF, Barad V, Cepeda NJ, Weissman DH, Milham MP, McAuley E, et al. General and task-specific frontal lobe recruitment in older adults during executive processes: A fMRI investigation of task-switching. Neuroreport. 2001;12(9):2065–2071. doi: 10.1097/00001756-200107030-00054. [DOI] [PubMed] [Google Scholar]
- Drag LL, Bieliauskas LA. Contemporary Review 2009: Cognitive Aging. Journal of Geriatric Psychiatry and Neurology. 2010;23(2):75–93. doi: 10.1177/0891988709358590. [DOI] [PubMed] [Google Scholar]
- Duncan J. An adaptive coding model of neural function in prefrontal cortex. Nature Reviews Neuroscience. 2001;2(11):820–829. doi: 10.1038/35097575. [DOI] [PubMed] [Google Scholar]
- Esterman M, Chiu YC, Tamber-Rosenau BJ, Yantis S. Decoding cognitive control in human parietal cortex. Proc Natl Acad Sci U S A. 2009;106(42):17974–17979. doi: 10.1073/pnas.0903593106. [DOI] [PMC free article] [PubMed] [Google Scholar]
- Gazes Y, Rakitin BC, Habeck C, Steffener J, Stern Y. Age differences of multivariate network expressions during task-switching and their associations with behavior. Neuropsychologia. 2012;50(14):3509–3518. doi: 10.1016/j.neuropsychologia.2012.09.039. [DOI] [PMC free article] [PubMed] [Google Scholar]
- Gazzaley A, Cooney JW, Rissman J, D’Esposito M. Top-down suppression deficit underlies working memory impairment in normal aging. Nature Neuroscience. 2005;8(10):1298–1300. doi: 10.1038/nn1543. [DOI] [PubMed] [Google Scholar]
- Geerligs L, Maurits NM, Renken RJ, Lorist MM. Reduced specificity of functional connectivity in the aging brain during task performance. Hum Brain Mapp. 2012 doi: 10.1002/hbm.22175. [DOI] [PMC free article] [PubMed] [Google Scholar]
- Geerligs L, Saliasi E, Maurits NM, Lorist MM. Compensation through increased functional connectivity: neural correlates of inhibition in old and young. J Cogn Neurosci. 2012;24(10):2057–2069. doi: 10.1162/jocn_a_00270. [DOI] [PubMed] [Google Scholar]
- Gold BT, Johnson NF, Powell DK. Lifelong bilingualism contributes to cognitive reserve against white matter integrity declines in aging. Neuropsychologia. 2013;51(13):2841–2846. doi: 10.1016/j.neuropsychologia.2013.09.037. [DOI] [PMC free article] [PubMed] [Google Scholar]
- Gold BT, Kim C, Johnson NF, Kryscio RJ, Smith CD. Lifelong bilingualism maintains neural efficiency for cognitive control in aging. J Neurosci. 2013;33(2):387–396. doi: 10.1523/JNEUROSCI.3837-12.2013. [DOI] [PMC free article] [PubMed] [Google Scholar]
- Gold BT, Powell DK, Xuan L, Jicha GA, Smith CD. Age-related slowing of task switching is associated with decreased integrity of frontoparietal white matter. Neurobiology of Aging. 2010;31(3):512–522. doi: 10.1016/j.neurobiolaging.2008.04.005. [DOI] [PMC free article] [PubMed] [Google Scholar]
- Goldman-Rakic PS. Circuitry of primate prefrontal cortex and regulation of behavior by representational memory. Comprehensive Physiology 1987 [Google Scholar]
- Grady CL. Cognitive neuroscience of aging. Ann N Y Acad Sci. 2008;1124:127–144. doi: 10.1196/annals.1440.009. [DOI] [PubMed] [Google Scholar]
- Grady CL. BRAIN AGEING The cognitive neuroscience of ageing. Nature Reviews Neuroscience. 2012;13(7):491–505. doi: 10.1038/nrn3256. [DOI] [PMC free article] [PubMed] [Google Scholar]
- Grady CL, McIntosh AR, Craik FIM. Age-related differences in the functional connectivity of the hippocampus during memory encoding. Hippocampus. 2003;13(5):572–586. doi: 10.1002/hipo.10114. [DOI] [PubMed] [Google Scholar]
- Grady CL, Protzner AB, Kovacevic N, Strother SC, Afshin-Pour B, Wojtowicz M, McIntosh AR, et al. A Multivariate Analysis of Age-Related Differences in Default Mode and Task-Positive Networks across Multiple Cognitive Domains. Cereb Cortex. 2010;20(6):1432–1447. doi: 10.1093/cercor/bhp207. [DOI] [PMC free article] [PubMed] [Google Scholar]
- Jenkinson M, Beckmann CF, Behrens TE, Woolrich MW, Smith SM. Fsl. Neuroimage. 2012;62(2):782–790. doi: 10.1016/j.neuroimage.2011.09.015. [DOI] [PubMed] [Google Scholar]
- Kim C, Cilles SE, Johnson NF, Gold BT. Domain general and domain preferential brain regions associated with different types of task switching: a meta-analysis. Hum Brain Mapp. 2012;33(1):130–142. doi: 10.1002/hbm.21199. [DOI] [PMC free article] [PubMed] [Google Scholar]
- Kim C, Johnson NF, Cilles SE, Gold BT. Common and distinct mechanisms of cognitive flexibility in prefrontal cortex. J Neurosci. 2011;31(13):4771–4779. doi: 10.1523/JNEUROSCI.5923-10.2011. [DOI] [PMC free article] [PubMed] [Google Scholar]
- Kray J, Lindenberger U. Adult age differences in task switching. Psychol Aging. 2000;15(1):126–147. doi: 10.1037//0882-7974.15.1.126. [DOI] [PubMed] [Google Scholar]
- Kriegeskorte N, Mur M, Ruff DA, Kiani R, Bodurka J, Esteky H, Bandettini PA, et al. Matching Categorical Object Representations in Inferior Temporal Cortex of Man and Monkey. Neuron. 2008;60(6):1126–1141. doi: 10.1016/j.neuron.2008.10.043. [DOI] [PMC free article] [PubMed] [Google Scholar]
- Madden DJ, Costello MC, Dennis NA, Davis SW, Shepler AM, Spaniol J, Cabeza R, et al. Adult age differences in functional connectivity during executive control. Neuroimage. 2010;52(2):643–657. doi: 10.1016/j.neuroimage.2010.04.249. [DOI] [PMC free article] [PubMed] [Google Scholar]
- Mayr U. Age differences in the selection of mental sets: the role of inhibition, stimulus ambiguity, and response-set overlap. Psychol Aging. 2001;16(1):96–109. doi: 10.1037/0882-7974.16.1.96. [DOI] [PubMed] [Google Scholar]
- McLaren DG, Ries ML, Xu GF, Johnson SC. A generalized form of context-dependent psychophysiological interactions (gPPI): A comparison to standard approaches. Neuroimage. 2012;61(4):1277–1286. doi: 10.1016/j.neuroimage.2012.03.068. [DOI] [PMC free article] [PubMed] [Google Scholar]
- Miller EK, Cohen JD. An integrative theory of prefrontal cortex function. Annual Review of Neuroscience. 2001;24:167–202. doi: 10.1146/annurev.neuro.24.1.167. [DOI] [PubMed] [Google Scholar]
- Mishkin M, Ungerleider LG, Macko KA. Object Vision and Spatial Vision - 2 Cortical Pathways. Trends in Neurosciences. 1983;6(10):414–417. [Google Scholar]
- Park DC. The cognitive neuroscience of aging. International Journal of Psychology. 2004;39(5-6):373–373. [Google Scholar]
- Park DC, Reuter-Lorenz P. The Adaptive Brain: Aging and Neurocognitive Scaffolding. Annu Rev Psychol. 2009a;60:173–196. doi: 10.1146/annurev.psych.59.103006.093656. [DOI] [PMC free article] [PubMed] [Google Scholar]
- Park DC, Reuter-Lorenz P. The adaptive brain: aging and neurocognitive scaffolding. Annu Rev Psychol. 2009b;60:173–196. doi: 10.1146/annurev.psych.59.103006.093656. [DOI] [PMC free article] [PubMed] [Google Scholar]
- Phillips LH, Andres P. The cognitive neuroscience of aging: New findings on compensation and connectivity. Cortex. 2010;46(4):421–424. doi: 10.1016/j.cortex.2010.01.005. [DOI] [PubMed] [Google Scholar]
- Ranganath C, Heller A, Cohen MX, Brozinsky CJ, Rissman J. Functional connectivity with the hippocampus during successful memory formation. Hippocampus. 2005;15(8):997–1005. doi: 10.1002/hipo.20141. [DOI] [PubMed] [Google Scholar]
- Reuter-Lorenz PA, Cappell KA. Neurocognitive aging and the compensation hypothesis. Current Directions in Psychological Science. 2008;17(3):177–182. [Google Scholar]
- Reuter-Lorenz PA, Park DC. Human neuroscience and the aging mind: a new look at old problems. J Gerontol B Psychol Sci Soc Sci. 2010;65(4):405–415. doi: 10.1093/geronb/gbq035. [DOI] [PMC free article] [PubMed] [Google Scholar]
- Rotshtein P, Soto D, Grecucci A, Geng JJ, Humphrey GW. The role of the pulvinar in resolving competition between memory and visual selection: A functional connectivity study. Neuropsychologia. 2011;49(6):1544–1552. doi: 10.1016/j.neuropsychologia.2010.12.002. [DOI] [PubMed] [Google Scholar]
- Rypma B, Berger JS, Genova HM, Rebbechi D, D’Esposito M. Dissociating age-related changes in cognitive strategy and neural efficiency using event-related fMRI. Cortex. 2005;41(4):582–594. doi: 10.1016/s0010-9452(08)70198-9. [DOI] [PubMed] [Google Scholar]
- Rypma B, Berger JS, Prabhakaran V, Bly BM, Kimberg DY, Biswal BB, D’Esposito M. Neural correlates of cognitive efficiency. Neuroimage. 2006;33(3):969–979. doi: 10.1016/j.neuroimage.2006.05.065. [DOI] [PubMed] [Google Scholar]
- Salthouse TA. Aging and measures of processing speed. Biol Psychol. 2000;54(1-3):35–54. doi: 10.1016/s0301-0511(00)00052-1. [DOI] [PubMed] [Google Scholar]
- Smith SM, Jenkinson M, Woolrich MW, Beckmann CF, Behrens TEJ, Johansen-Berg H, Matthews PM, et al. Advances in functional and structural MR image analysis and implementation as FSL. Neuroimage. 2004;23:S208–S219. doi: 10.1016/j.neuroimage.2004.07.051. [DOI] [PubMed] [Google Scholar]
- Spreng RN, Wojtowicz M, Grady CL. Reliable differences in brain activity between young and old adults: A quantitative meta-analysis across multiple cognitive domains. Neurosci Biobehav Rev. 2010;34(8):1178–1194. doi: 10.1016/j.neubiorev.2010.01.009. [DOI] [PubMed] [Google Scholar]
- St Jacques P, Dolcos F, Cabeza R. Effects of aging on functional connectivity of the amygdala during negative evaluation: a network analysis of fMRI data. Neurobiol Aging. 2010;31(2):315–327. doi: 10.1016/j.neurobiolaging.2008.03.012. [DOI] [PMC free article] [PubMed] [Google Scholar]
- Stern Y. Cognitive reserve. Neuropsychologia. 2009;47(10):2015–2028. doi: 10.1016/j.neuropsychologia.2009.03.004. [DOI] [PMC free article] [PubMed] [Google Scholar]
- Stern Y. Cognitive Reserve and Aging. Gerontologist. 2010;50:88–88. [Google Scholar]
- Tanaka J. Object recognition in man, monkey, and machine. Trends Cogn Sci. 1999;3(10):401–401. [Google Scholar]
- Tanaka K. Inferotemporal cortex and object vision. Annual Review of Neuroscience. 1996;19:109–139. doi: 10.1146/annurev.ne.19.030196.000545. [DOI] [PubMed] [Google Scholar]
- Tong F, Rademaker R, Cohen E. Working memory for complex objects revealed by fMRI decoding of human visual cortical activity. Vision. 2012;12(9):1271. [Google Scholar]
- West RL. An application of prefrontal cortex function theory to cognitive aging. Psychological Bulletin. 1996;120(2):272–292. doi: 10.1037/0033-2909.120.2.272. [DOI] [PubMed] [Google Scholar]
- Yoon JH, Curtis CE, D’Esposito M. Differential effects of distraction during working memory on delay-period activity in the prefrontal cortex and the visual association cortex. Neuroimage. 2006;29(4):1117–1126. doi: 10.1016/j.neuroimage.2005.08.024. [DOI] [PubMed] [Google Scholar]
- Zarahn E, Rakitin B, Abela D, Flynn J, Stern Y. Age-related changes in brain activation during a delayed item recognition task. Neurobiol Aging. 2007;28(5):784–798. doi: 10.1016/j.neurobiolaging.2006.03.002. [DOI] [PubMed] [Google Scholar]
- Zhu Z, Johnson NF, Kim C, Gold BT. Reduced Frontal Cortex Efficiency is Associated with Lower White Matter Integrity in Aging. Cereb Cortex. 2013 doi: 10.1093/cercor/bht212. [DOI] [PMC free article] [PubMed] [Google Scholar]