

Abstract
Multiple epidemiologic studies demonstrate associations between chronic beryllium disease (CBD), beryllium sensitization (BeS), and HLA-DPB1 alleles with a glutamic acid residue at position 69 (E69). Results suggest that the less-frequent E69 variants (non-*0201/*0202 alleles) might be associated with greater risk of CBD. In this study, we sought to define specific E69-carrying alleles and their amino acid sequences in the DP peptide binding groove, as well as their relationship to CBD and BeS risk, using the largest case control study to date. We enrolled 502 BeS/CBD subjects and 653 beryllium-exposed controls from three beryllium industries who gave informed consent for participation. Non-Hispanic white cases and controls were frequency-matched by industry. HLA-DPB1 genotypes were determined using sequence-specific primer PCR. The E69 alleles were tested for association with disease individually and grouped by amino acid structure using logistic regression. The results show that CBD cases were more likely than controls to carry a non-*02 E69 allele than an *02 E69, with odds ratios (95% confidence interval) ranging from 3.1 (2.1–4.5) to 3.9 (2.6–5.9) (p < 0.0001). Polymorphic amino acids at positions 84 and 11 were associated with CBD: DD versus GG, 2.8 (1.8–4.6), p < 0.0001; GD versus GG, 2.1 (1.5–2.8), p < 0.0001; LL versus GG, 3.2 (1.8–5.6), p < 0.0001; GL versus GG, 2.8 (2.1–3.8), p < 0.0001. Similar results were found within the BeS group and CBD/BeS combined group. We conclude that the less frequent E69 alleles confer more risk for CBD than does *0201. Recent studies examining how the composition and structure of the binding pockets influence peptide binding in MHC genes, as well of studies showing the topology of the TCR to likely bind DPB1 preferentially, give plausible biological rationale for these findings.
Chronic beryllium disease (CBD) is an immunologic lung disease caused by inhalation of beryllium dust and fume (1). Exposed workers can develop beryllium sensitization (BeS), a beryllium-specific, cell-mediated immune response, which is measured by the beryllium lymphocyte proliferation test (BeLPT) (2–5). Once workers develop BeS, they may subsequently develop CBD, a diffuse lung disease characterized by granulomatous inflammation in the lung. Differentiation between CBD and BeS is determined by performing a clinical evaluation consisting of a lung biopsy and bronchoalveolar lavage. BeS precedes CBD, and it is estimated that between 3 and 9% (6) of those who are sensitized progress to disease each year. Beryllium exposure is necessary for sensitization and disease, but not all who are exposed develop sensitization and not all who are sensitized develop disease. It is currently unknown why some beryllium-exposed workers develop sensitization and why some beryllium-sensitized workers progress to CBD and others do not.
Only ~2–10% of exposed workers develop BeS or CBD, and there has been a lack of a clear linear exposure response relationship noted in most, but not all, studies to date (7–9). This observation has led researchers to investigate genetic factors that might increase the risk of disease and sensitization. Because BeS and CBD are triggered by an immunologic response and because the MHC region on chromosome 6 plays an important role in the immune system, specific regions of chromosome 6 have been targeted for study. One such region on chromosome 6, the HLA-DPB1 gene, and, in particular, alleles that have a glutamic acid residue at position 69 (E69) of the β-chain are highly correlated with CBD and BeS (7, 8, 10, 11). Although E69 is a strong marker of sensitization and disease, questions remain whether certain alleles confer greater risk of disease than others. Some studies have suggested that a greater prevalence of a non-*02 E69 variant is found in CBD and BeS (8, 10–13), whereas others have not (14, 15). Since the time of these first studies of associations between the HLA-DPB1 gene and CBD, many new alleles have been identified owing to improvements in typing methods. Wang et al. (16) explored the specific E69 alleles and their relationship with CBD and found a higher risk of disease with less common E69 alleles (*0601, *0901, *1001, *1301, *1701, and *1901) than with the most common E69 allele, *0201. Their numbers of people studied were small (19 persons with CBD and 34 who were beryllium exposed), so their study was limited in what relationships they could evaluate. More recently, Van Dyke et al. (17, 18) found this same relationship in a larger population-based study even after taking into account the increased risk associated with exposure.
Snyder et al. (19, 20) took a computational chemistry approach to examining the relationship found in Wang et al. (16) to identify common factors among E69 alleles that might group them. These studies investigated not only a possible biological link to the association between CBD and HLA-DPB1 (negative charge), but they also attempted to rank the risk of developing CBD based on the charge of the specific alleles an individual might have. These investigations have further refined our understanding of the relationship between the HLA-DPB1 gene and disease.
Regardless, the E69 variants are functional in BeS and CBD. Specifically, in E69 carrying individuals, Abs to HLA-DP will block beryllium-stimulated proliferation and cytokine production (21). This has led to our understanding that E69 is important in presentation of an unknown antigenic form of beryllium to a beryllium-specific T cell through its surface TCR. More recently, a crystalline structure of the HLA-DP2 molecule with an HLA-DR α-chain peptide in the peptide binding groove has been solved (22). The investigators theorized that the shape of the peptide binding groove offers a possible explanation for how beryllium can access the glutamic acid at this position, resulting in T cell activation. Questions still persist regarding other aspects of the HLA structure that might be equally (or even more) powerful in allowing beryllium access to the peptide binding groove.
With the ongoing investigation into the relative relationships between specific HLA-DPB1 alleles and risk of CBD (7, 8, 10–14), the main objective of this study was to evaluate the associations between specific HLA-DPB1 alleles and the presence or absence of CBD utilizing the largest number of cases and controls to date. We hypothesized that the risk of CBD would be higher in specific lower E69 frequency alleles (non-*02) and that these less frequent alleles (LFAs) would have similar amino acid configurations in the peptide binding groove in this region. We also investigated whether the negative surface charges of the alleles of subjects with CBD would be lower in total than the charges found in the controls. These hypotheses have implications for Ag peptide binding to HLA-DP molecules and subsequent interaction with the TCR.
Materials and Methods
Study population and design
Subjects for this case-control study were enrolled from patients seen at National Jewish Health or workers who were previously recruited by the National Institute for Occupational Safety and Health during plant-wide surveys. Approximately 1.5 controls were frequency matched by industry for each case to ensure that results were not biased by industry. Only those subjects with complete and high-resolution genotyping were included. All study subjects either provided informed consent according to a protocol reviewed by the Human Subjects Institutional Review Board at National Jewish Health, or through the National Institute for Occupational Safety and Health’s Human Studies Review Board, and this study protocol was approved by the Institutional Review Boards at both institutions. The study population was comprised of 275 CBD subjects, 197 BeS subjects, 30 subjects with either CBD or BeS, and 653 beryllium-exposed control subjects. All study subjects were white. Some of the subjects in this study were included in prior smaller studies of CBD and BeS risk related to E69 (8, 10, 17, 18), although some subjects were only included in this study.
Case definition
For the purposes of this study, a subject with CBD was defined as one who had demonstrated two positive BeLPT results plus either of the following: granulomas or other pathological abnormalities consistent with CBD on lung biopsy, or demonstration of granulomatous inflammation based on an abnormal bronchoalveolar lymphocyte proliferation test along with a bronchoalveolar lymphocyte differential >15%. A subject with BeS was defined as having demonstrated two positive BeLPTs, but with none of the other two criteria supporting a CBD diagnosis. Subjects who had positive BeLPTs but had not undergone any further diagnostic tests were categorized for this study as CBD or BeS and were used in analyses that combined CBD and BeS as one case group (n = 30 noted above).
Sequence-specific primer PCR determination of the HLA-DPB1 and allele groupings of the HLA-DPB1 gene
Genomic DNA was prepared from peripheral blood cells. HLA-DPB1 genotyping was performed with blinding to the subject’s disease status using sequence-specific primer PCR methodology developed by Welsh and Bunce (23) for the National Jewish Health subjects and allele-specific sequencing described by Weston et al. (24) for the National Institute for Occupational Safety and Health subjects.
Alleles were grouped as E69 when they had a glutamic acid at position 69 (e.g., *0201, *0202, *0601, *0801, *0901, *1001, *1301, *1601, *1701, *1901) and non-E69 when they did not. We also made the following allele groupings for comparison purposes. Alleles *0201 and *0202 (*02s) were grouped together, as their amino acid sequences were identical except at three positions (Table I). The *0601, *0901, *1001, and *1701 alleles were grouped together because their amino acid structures were more similar to each other, all had charges of −9, and they were the most different from the *0201s (eight to nine amino acids different). The *0801, *1301, *1601, and *1901 alleles were combined with the *02 group for some comparisons as noted in Results, because their amino acid structures were more similar to the *02 group (for the *0801, *1601, and *1901 alleles, which had only four to six amino acids different) or they had the same charge (*1301), and this was done to ensure the integrity of the model. There were other rarer alleles that are not mentioned in this study, but the same procedure was used for grouping.
Table I.
Amino acid structure of HLA-DPB1 alleles at polymorphic sites
| Allele | 8 | 9 | 11 | 33 | 35 | 36 | 55 | 56 | 57 | 65 | 69 | 76 | 84 | 85 | 86 | 87 | Charge |
|---|---|---|---|---|---|---|---|---|---|---|---|---|---|---|---|---|---|
| *0201 | L | F | G | E | F | V | D | E | E | I | E | M | G | G | P | M | −7 |
| *0202 | L | F | G | E | L | V | E | A | E | I | E | M | G | G | P | M | −6 |
| *7101 | L | F | G | E | F | V | A | A | E | I | E | M | G | G | P | M | −5 |
| *0601 | V | Y | L | E | F | V | D | E | D | L | E | M | D | E | A | V | −9 |
| *0901 | V | H | L | E | F | V | D | E | D | I | E | V | D | E | A | V | −9 |
| *1001 | V | H | L | E | F | V | D | E | E | I | E | V | D | E | A | V | −9 |
| *1701 | V | H | L | E | F | V | D | E | D | I | E | M | D | E | A | V | −9 |
| *0801 | L | F | G | E | F | V | D | E | E | I | E | V | D | E | A | V | −9 |
| *1601 | L | F | G | E | F | V | D | E | E | I | E | M | D | E | A | V | −9 |
| *1901 | L | F | G | E | F | V | E | A | E | I | E | I | D | E | A | V | −8 |
| *1301 | V | Y | L | E | Y | A | A | A | E | I | E | I | D | E | A | V | −7 |
| *0101 | V | Y | G | E | Y | A | A | A | E | I | K | V | D | E | A | V | −5 |
| *0301 | V | Y | L | E | F | V | D | E | D | L | K | V | D | E | A | V | −7 |
| *0401 | L | F | G | E | F | A | A | A | E | I | K | M | G | G | P | M | −3 |
Noted are positions for amino acids that are polymorphic for specific alleles and corresponding charges.
Statistical analysis
The HLA-DPB1 gene was evaluated for departures from Hardy–Weinberg equilibrium using the exact test according to Guo and Thompson (25) in the CBD, BeS, case group (CBD and BeS combined), and controls separately. When the departure in the control subjects was considered significant (p < 0.05), no further evaluation was considered.
There were four dichotomous outcome variables in this study: CBD versus control, BeS versus control, case (CBD plus BeS) versus control, and CBD versus BeS. In all of these comparisons except the case versus control, the n = 30 group with either CBD or BeS was excluded. Unconditional logistic regression models were developed to test associations of interest. Comparisons were made between outcome variables and carriage of one and two alleles individually compared with not carrying the allele when the allele frequencies were ≥5%. When the allele carriage was <5%, the comparison was made between the outcome variable and carriage of one or two of the alleles of interest versus no carriage of that allele. A logistic regression model was constructed that compared the allele genotypes to address the question of differential risk. Models also were developed comparing the charge between cases and controls and the polymorphic amino acid sequences in the binding grooves between cases and controls. For the binding groove analysis, we compared all of the polymorphic amino acid sequences in the binding grooves of the HLA-DPB1 gene as described in Dai et al. (22). When two amino acids in the same pocket were in complete linkage disequilibrium, only one of the amino acids was included in the analysis. All comparisons were made with the amino acid or the amino acid sequences associated with the *02 or *0201 allele as the referent group, as this group was noted to have lower risk of CBD compared with other E69 variants in prior studies. These comparisons were made in all subjects and in those with only the E69 genotype to help define differential risk of CBD in those with E69. SAS version 9.2 (SAS Institute, Cary, NC) was used for all statistical tests, all of which were two-sided, and p < 0.05 was considered significant.
Results
Demographics and allele frequencies
Table I contains examples of the amino acid structures of several of the HLA-DPB1 alleles. Table II displays the demographics for our white population by diagnosis. There were a total of 1155 subjects in this study comprising 275 subjects with CBD, 197 with BeS, 30 with CBD or BeS, and 653 controls. The composition of the study populations was similar between groups and predominantly male. Most (70%) of our study population was from the nuclear industry, whereas the remaining 30% worked in manufacturing or machining facilities.
Table II.
Demographic information by diagnosis
| CBD (n = 275) | CBD/BeS (n = 30) | BeS (n = 197) | Control (n = 653) | Total (n = 1155) | |
|---|---|---|---|---|---|
| Gender | |||||
| Male | 231 (84.0) | 24 (80.0) | 163 (82.3) | 578 (88.5) | 996 (86.2) |
| Industry | |||||
| Machining | 20 (34.5) | 1 (1.7) | 3 (5.2) | 34 (58.6) | 58 (5.0) |
| Nuclear | 182 (22.3) | 29 (3.6) | 143 (17.6) | 461 (56.5) | 815 (70.6) |
| Primary beryllium | 73 (25.9) | 0 (0.0) | 51 (18.1) | 158 (56.0) | 282 (24.4) |
Demographic counts (percentages) by case status are shown.
Genotypic frequencies of the alleles conformed to Hardy–Weinberg equilibria in the controls (p = 0.27) but not for the CBD subjects (p ≤ 0.0001), BeS subjects (p = 0.04), or CBD and BeS groups (p ≤ 0.0001). Table III lists the allele frequencies of our study subjects for the DPB1 region of chromosome 6. The most frequently observed allele in all of the groups was a non-E69 allele, *0401, present in 25% of the observed alleles of the CBD subjects, 32% of observed alleles in the BeS subjects, and 45% of the controls’ observed alleles. The second most common allele was *0201, comprising between 23 and 26% of observed alleles in the CBD and BeS subjects. The *0201 allele was only present in ~13% of the controls, however. Other E69-containing alleles that were carried at a frequency of at least 5% in at least one of the comparison groups were *0601, *1001, and *1701 (with non-E69 alleles of *0101, *0301, *0402). By combining those less frequent E69 alleles, a carrier frequency of between 47 and 53% was noted in the CBD, BeS, and the combined CBD/BeS case groups. Only 19.4% of the controls carried these E69 alleles.
Table III.
Frequencies of HLA-DPB1 alleles and their associated charges
| E69 | CBD (2N = 550) | BES (2N = 394) | Casea (2N = 1004) | Control (2N = 1306) | Charge | |
|---|---|---|---|---|---|---|
| One or two copies E69 | 292 (53.1) | 184 (46.7) | 510 (50.7) | 254 (19.4) | ||
| No copies E69 | 258 (46.9) | 211 (53.3) | 496 (49.3) | 1052 (80.6) | ||
| *0101 | N | 15 (2.7) | 13 (3.3) | 28 (2.8) | 75 (5.7) | −5 |
| *0201 | Y | 131 (23.8) | 104 (26.4) | 253 (25.2) | 165 (12.6) | −7 |
| *0202 | Y | 7 (1.3) | 3 (0.8) | 11 (1.1) | 7 (0.5) | −6 |
| *0301 | N | 28 (5.1) | 19 (4.8) | 52 (5.2) | 107 (8.2) | −7 |
| *0401 | N | 137 (24.9) | 128 (32.5) | 282 (28.1) | 594 (45.5) | −3 |
| *0402 | N | 48 (8.7) | 20 (5.1) | 71 (7.0) | 167 (12.8) | −5 |
| *0501 | N | 7 (1.3) | 10 (2.5) | 18 (1.8) | 28 (2.1) | −6 |
| *0601 | Y | 44 (8.0) | 26 (6.6) | 75 (7.5) | 11 (0.8) | −9 |
| *0801 | Y | 3 (0.5) | 1 (0.2) | 4 (0.4) | 0 (0.0) | −9 |
| *0901 | Y | 16 (2.9) | 10 (2.5) | 29 (2.9) | 10 (0.7) | −9 |
| *1001 | Y | 36 (6.5) | 14 (3.6) | 51 (5.1) | 21 (1.6) | −9 |
| *1101 | N | 9 (1.6) | 2 (0.5) | 11 (1.1) | 27 (2.1) | −5 |
| *1301 | Y | 19 (3.5) | 10 (2.5) | 33 (3.3) | 28 (2.1) | −7 |
| *1401 | N | 5 (0.9) | 4 (1.0) | 9 (0.9) | 22 (1.7) | −7 |
| *1501 | N | 3 (0.5) | 5 (1.3) | 9 (0.9) | 8 (0.6) | −3 |
| *1601 | Y | 7 (1.3) | 6 (1.5) | 13 (1.3) | 3 (0.2) | −9 |
| *1701 | Y | 27 (4.9) | 10 (2.5) | 38 (3.8) | 8 (0.6) | −9 |
| *1801 | N | 0 (0.0) | 0 (0.0) | 0 (0.0) | 1 (0.1) | −5 |
| *1901 | Y | 2 (0.4) | 0 (0.0) | 2 (0.2) | 2 (0.2) | −8 |
| *1001 | N | 1 (0.2) | 4 (1.0) | 5 (0.5) | 9 (0.7) | −7 |
| *2301 | N | 0 (0.0) | 3 (0.8) | 3 (0.3) | 4 (0.3) | −3 |
| *2501 | N | 0 (0.0) | 0 (0.0) | 0 (0.0) | 1 (0.1) | −7 |
| *3601 | N | 0 (0.0) | 0 (0.0) | 0 (0.0) | 1 (0.1) | −6 |
| *3901 | N | 2 (0.4) | 0 (0.0) | 2 (0.2) | 0 (0.0) | −3 |
| *4901 | N | 0 (0.0) | 0 (0.0) | 0 (0.0) | 1 (0.1) | −5 |
| *5101 | N | 0 (0.0) | 0 (0.0) | 0 (0.0) | 2 (0.2) | −5 |
| *5901 | N | 0 (0.0) | 0 (0.0) | 0 (0.0) | 2 (0.2) | −5 |
| *7101 | Y | 0 (0.0) | 1 (0.3) | 1 (0.1) | 0 (0.0) | −5 |
| *7201 | N | 1 (0.2) | 0 (0.0) | 1 (0.1) | 1 (0.1) | −3 |
| *7501 | N | 1 (0.2) | 0 (0.0) | 1 (0.1) | 0 (0.0) | −5 |
| *8901 | N | 1 (0.2) | 0 (0.0) | 1 (0.1) | 0 (0.0) | −5 |
| *9101 | N | 0 (0.0) | 1 (0.3) | 1 (0.1) | 0 (0.0) | −7 |
| *9801 | N | 0 (0.0) | 0 (0.0) | 0 (0.0) | 1 (0.1) | −7 |
Frequencies (percentages) are shown.
Cases included CBD (n = 275), BeS (n = 197), and those cases with either BeS or CBD (n = 30).
E69 allele associations with CBD and beryllium sensitization
We evaluated the odds of allele carriage with regard to case status as noted in Table IV. Increasing the number of E69 alleles increases the risk of CBD. Carriage of one copy of an E69 allele was 10-fold more likely in the CBD subjects compared with the control subjects, whereas carriage of two copies of E69 alleles was 30.8-fold more likely in the CBD subjects than the controls, with no overlap found in confidence intervals. Similar findings were seen when all CBD and BeS subjects were combined and compared with controls, as well as when comparing the BeS subjects to the control subjects. When evaluated separately, the non-E69 alleles were associated with lower risk of both CBD and BeS (data not shown), whereas the E69 alleles evaluated individually were found to increase the risk of both CBD and BeS.
Table IV.
E69 allele associations with case status
| Association, Copies | CBD versus Control | p Value | BeS versus Control | p Value | CBD or BeS versus Control | p Value | CBD versus BeS | p Value |
|---|---|---|---|---|---|---|---|---|
| E69, two versus none | 30.8 (16.6–57.2) | <0.0001 | 14.0 (7.1–27.3) | <0.0001 | 22.8 (13.3–39.2) | <0.0001 | 2.2 (1.1–4.2) | 0.017 |
| E69, one versus none | 10.1 (6.8–15.0) | <0.0001 | 6.8 (4.5–9.9) | <0.0001 | 8.4 (6.6–11.3) | <0.0001 | 1.5 (0.91–2.5) | 0.11 |
| DPB1-0201/02, two versus none | 5.2 (2.0–13.6) | 0.0008 | 3.6 (1.1–11.7) | <0.03 | 5.4 (2.2–12.9) | 0.0009 | 1.4 (0.48–4.2) | 0.52 |
| DPB1-0201/02, one versus none | 2.4 (1.8–3.3) | <0.0001 | 3.1 (2.2–4.4) | <0.0001 | 2.7 (2.1–3.4) | <0.0001 | 0.77 (0.53–1.1) | 0.18 |
| DPB1-0601, one or two versus none | 10.8 (5.5–21.3) | <0.0001 | 9.2 (4.5–19.0) | <0.0001 | 10.2 (5.4–19.5) | <0.0001 | 1.2 (0.70–2.0) | 0.55 |
| DPB1-0901, one or two versus none | 4.4 (1.9–10.1) | 0.0004 | 3.8 (1.5–9.5) | 0.0042 | 4.4 (2.1–9.43) | 0.0001 | 1.2 (0.52–2.6) | 0.72 |
| DPB1-1001, one or two versus none | 4.5 (2.6–7.9) | <0.0001 | 2.3 (1.1–4.6) | 0.0196 | 3.4 (2.0–5.7) | <0.0001 | 2.0 (1.04–3.8) | 0.038 |
| Non-02 versus 02 genotypea | 3.1 (2.1–4.5) | <0.0001 | 1.7 (1.1–2.6) | 0.0110 | 2.4 (1.7-3.3) | <0.0001 | 1.7 (1.1–2.5) | 0.01 |
| Non-E69 versus 02 | 0.14 (0.09–0.22) | <0.0001 | 0.17 (0.11–0.26) | <0.0001 | 0.15 (0.11–0.21) | <0.0001 | 0.77 (0.45–1.3) | 0.32 |
| Non-02 versus 02 genotypeb | 3.9 (2.6–5.9) | <0.0001 | 2.3 (1.5–3.7) | 0.0002 | 3.1 (2.2–4.6) | <0.0001 | 1.8 (1.2–2.4) | 0.004 |
| Non-E69 versus 02 | 0.13 (0.09–0.20) | <0.0001 | 0.17 (0.11–0.26) | <0.0001 | 0.15 (0.11–0.20) | <0.0001 | 0.84 (0.49–1.4) | 0.54 |
Odds ratios (95% confidence intervals) by case control comparison are shown.
Lower limit for odds ratio: 02 = (02 and non-E69) or (02 and non-02-E69) or (02 and 02) non-02 = (non-02-E69 and non-02-E69) or (non-02-E69, non-E69) non-02 = 0601, 0901, 1001, 1701.
Upper limit for odds ratio: 02 = (02 and non-E69) or (02 and 02) non-02 = (non-02-E69 and non-02-E69) or (non-02-E69, non-E69) or (02 and non-02-E69) non-02 = 0601, 0901, 1001, 1701.
Because the cases were not in Hardy–Weinberg equilibrium, we compared genotypes based on carriage of the *02 allele versus genotypes with carriage of the non-*02 E69 alleles (LFAs, including *0601, *0801, *0901, *1001, *1301, *1601, *1701, and *1901) to evaluate the differential risk associated with these LFAs. We evaluated two models to compare the *02 and LFA genotypes. One model included the *02/LFA genotypes with the *02/*02 and *02/non-E69 genotype group as a lower bound for the odds ratio. The other model included the *02/LFA in the LFA/LFA group as an upper bound for the odds ratio that compared the odds of carriage of the LFA group to the odds of carriage of the *02 group between CBD and controls. The bound for the odds of carriage of these LFAs compared with the most common E69 alleles (*02) was 2.1 (1.4–3.1)-fold higher in the CBD subjects than in the controls. The upper bound for these odds was 3.0 (2.8–4.4)-fold higher (data not shown). Similar patterns were seen when the BeS and CBD cases were combined. We were particularly interested in a subset of the less frequent E69 alleles (specifically, *0601, *0901, *1001, and *1701) with similar amino acid sequences as outlined in Materials and Methods, so we combined the remainder of the less frequent E69 alleles with the *02s and compared them with the group of interest listed above. When grouped in this way, the odds ratios were 3.1 (2.1–4.5) for the lower bound and 3.9 (2.6–5.9) for the upper bound.
Electrostatic charge and disease associations
Tables V, VI, and VII display associations found between disease and charge. Associations were evaluated before and after E69 adjustment to examine any added information gained from including charge after the association of E69 was taken into account. Subjects whose alleles had one or two −9 or −7 charges were more likely to have CBD or BeS than did the controls, CBD versus controls (7.3 [5.6–13.3], p < 0.0001), or BeS versus controls (4.7 [3.1–7.1], p < 0.0001), whereas there was no relationship found after E69 adjustment. Next, we compared −9 carriers and −7 carriers and found that −9 carriers were 5.6 (3.6–8.8)-fold more likely than the −7 carriers to have CBD than to be a control, and 3.5 (2.1–5.9)-fold more likely to have BeS than to be a control (Table IV). Similar relationships for CBD and BeS were seen after adjusting for E69 (Table VII).
Table V.
Charge associations with disease
| One or Two at −9 and One or Two at −7 versus Othera | p Value | One or Two at −9 and One or Two at −7 versus Other after E69 Adjustment | p Value | |
|---|---|---|---|---|
| CBD versus controls | 7.3 (5.6–13.3) | <0.0001 | 1.3 (0.62–2.5) | 0.52 |
| BeS versus controls | 4.7 (3.1–7.1) | <0.0001 | 0.72 (0.33–1.6) | 0.40 |
| Case versus control | 6.7 (4.9–9.1) | <0.0001 | 1.0 (0.59–1.7) | 0.99 |
| CBD versus BeS | 1.8 (1.1–3.2) | 0.03 | 1.7 (0.61–4.8) | 0.31 |
Odds ratios (95% confidence intervals) for case control comparisons are shown.
Any other combination of charges not including −9 or −7.
Table VI.
Charge associations with disease
| One or Two at −9 and None at −7 versus One or Two at −7 and None at −9 | p | One at −9 and One at −7 versus One or Two at −7 and None at −9 | p | Othera versus −7 | p | |
|---|---|---|---|---|---|---|
| CBD versus controls | 5.6 (3.6–8.8) | <0.0001 | 7.3 (4.0–13.4) | <0.0001 | 0.20 (0.13–0.32) | <0.0001 |
| BeS versus controls | 3.5 (2.1–5.9) | <0.0001 | 4.6 (2.1–5.9) | <0.0001 | 0.30 (0.20–0.47) | <0.0001 |
| Case versus control | 4.6 (3.0–6.9) | <0.0001 | 5.9 (3.3–10.3) | <0.0001 | 0.24 (0.17–0.33) | <0.0001 |
| CBD versus BeS | 1.6 (1.01–2.5) | 0.047 | 1.6 (0.91–2.7) | 0.10 | 0.67 (0.38–1.2) | 0.18 |
Odds ratios (95% confidence intervals) for case control comparisons are shown.
Any other combination of charges not including −9 or −7.
Table VII.
Charge associations with disease after adjustment for E69 status
| One or Two at −9 and None at −7 versus One or Two at −7 and None at −9 | p | One at −9 and One at −7 versus One or Two at −7 and None at −9 | p value | Othera versus −7 | p | |
|---|---|---|---|---|---|---|
| CBD versus controls | 4.1 (2.5–6.5) | <0.0001 | 3.3 (1.7–6.5) | <0.0005 | 0.83 (0.41–1.7) | 0.60 |
| BeS versus controls | 2.4 (1.5–4.1) | 0.0007 | 2.5 (1.2–5.3) | 0.02 | 1.4 (0.65–3.1) | 0.38 |
| Case versus control | 3.3 (2.1–5.0) | <0.0001 | 2.7 (1.4–5.1) | 0.0021 | 1.01 (0.60–1.7) | 0.96 |
| CBD versus BeS | 1.7 (1.04–2.6) | 0.03 | 1.3 (0.67–2.5) | 0.44 | 0.60 (0.21–1.7) | 0.33 |
Odds ratios (95% confidence intervals) for case control comparisons are shown.
Any other combination of charges not including −9 or −7.
Binding groove-related amino acid changes and outcome risk
Finally, we examined the polymorphic amino acid sequences in the binding groove of the HLA-DPB1 gene based on the crystal structure of Dai et al. (22) (Figs. 1, 2, 3, and 4). Associations between cases and controls for polymorphisms within the binding groove are presented in Figs. 1–4 for all study subjects (Figs. 1A–4A) and also limited to those who had one or two E69 alleles (Figs. 1B–4B). For example, in pocket 1, there were four polymorphic positions (84, 85, 86, 87), but all four positions were in 100% linkage disequilibrium, so the results of the associations between polymorphisms at position 84 and case status are equivalent to the associations between the other polymorphisms and case status. CBD subjects were more likely to have two aspartic acids (DD; 2.8 [1.8–4.6]) or a glycine and aspartic acid (GD; 2.1 [1.5–2.8]) compared with two glycines (GG) in pocket 1 (position 84) of the binding groove than in the controls. In pocket 4, subjects were 5.4 (2.4–12.3)- and 2.3 (1.3–4.2)-fold more likely to have CBD than to be a control when they had two glutamic acid and methionine combinations (EM/EM) or glutamic acid/valine and lysine/methionine (EV/KM) instead of glutamic acid/valine and lysine/methionine (EM/KM) at positions 69 and 76. Those with two lysines/methionines (KM/KM) or lysine/valine and lysine/methionine (KV/KM), in contrast, were less likely to have CBD, with odds ratios of 0.10 (0.06–0.17) and 0.12 (0.04–0.34), respectively. At amino acid position 11 in pocket 6 of the binding groove, CBD subjects were more likely than controls to have two leucines (LL; 3.2 [1.8–5.6]) and a glycine/leucine (GL; 2.8 [2.1–3.8]) than two glycines (GG) (Fig. 3). In the binding groove of pocket 9, CBD subjects were less likely to have two sets of two alanines (AA/AA) or two alanines and valine/aspartic acid (AA/VD) compared with two sets of valine/aspartic acid (VD/VD) at amino acid positions 36 and 55 than controls, with odds ratios of 0.13 (0.08–0.21) and 0.51 (0.36–0.71), respectively (Fig. 4). Similar results were seen when comparisons were made between the polymorphic regions in the binding grooves and E69-only cases and controls (Figs. 1–4).
FIGURE 1.

Comparisons of amino acid differences in HLA-DPB1 binding pocket 1. Odds ratios for amino acid differences at position 84 between cases and controls are shown. In these figures, each datum point represents the odds ratio whereas the lines surrounding the points represent 95% confidence intervals. Comparisons were made between CBD versus control, BeS versus control, case versus control, and CBD versus BeS in (A) all subjects and (B) restricted to subjects having one or two E69 alleles. Subjects with two aspartic acids at position 84 are 2.8-fold as likely to have CBD than do controls compared with those subjects who have two glycines. This association was also evident when the analysis was restricted to subjects having one or two E69 alleles.
FIGURE 2.

Comparison of amino acid differences in HLA-DPB1 binding pocket 2. Odds ratios for amino acid differences at positions 69 and 76 between cases and controls are shown. In these figures, each datum point represents the odds ratio whereas the lines surrounding the points represent 95% confidence intervals. Comparisons were made between CBD versus control, BeS versus control, case versus control, and CBD versus BeS in (A) all subjects and (B) restricted to subjects having one or two E69 alleles. Subjects with two glutamic acids at position 69 are 5.4-fold as likely to have CBD than do controls, and 2.9-fold as likely to be BeS than do controls compared with subjects with only one glutamic acid at this position. These associations were also evident in subjects restricted to having one or two E69 alleles. There is also a trend that with two glutamic acids at this same position a subject is more likely to have CBD than be BeS compared with subjects with only one glutamic acid at this position.
FIGURE 3.

Comparison of amino acid differences in HLA-DPB1 binding pocket 3. Odds ratios for amino acid differences at position 11 between cases and controls are shown. In these figures, each datum point represents the odds ratio whereas the lines surrounding the points represent 95% confidence intervals. Comparisons were made between CBD versus control, BeS versus control, case versus control, and CBD versus BeS in (A) all subjects and (B) restricted to subjects having one or two E69 alleles. Subjects with two leucines at position 11 are 3.2-fold more likely to have CBD than do controls compared with subjects with two glysines. Also those subjects with two leucines at position 11 are 2.9-fold more likely to have CBD than be BeS compared with subjects with two glysines at this same position. These associations were also evident when the analysis was restricted to subjects having one or two E69 alleles.
FIGURE 4.
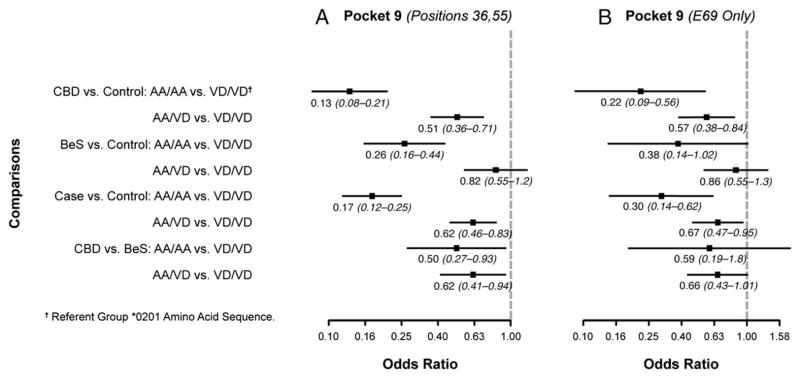
Comparisons of amino acid differences in HLA-DPB1 binding pocket 4. Odds ratios for amino acid differences at positions 36 and 55 between cases and controls. In these figures, each datum point represents the odds ratio whereas the lines surrounding the points represent 95% confidence intervals. Comparisons were made between CBD versus control, BeS versus control, case versus control, and CBD versus BeS in (A) all subjects and (B) restricted to subjects having one or two E69 alleles. Subjects with two alanines at positions 36 and 55 are 13% less likely to have CBD than do controls, and subjects who have one alanine and one valine at position 36 and one alanine and one aspartic acid at position 55 are 51% less likely to have CBD than do controls. These associations were also evident when the analysis was restricted to subjects having one or two E69 alleles.
The same trends were seen in all binding pockets for the BeS subjects and the CBD and BeS combined group compared with controls, although not all comparisons were statistically significant (Figs. 1–4). For the CBD versus BeS comparisons, the amino acids in the binding groove at pocket 4 appear to be best at differentiating between the two groups (Fig. 2). Comparisons between the CBD, BeS, and CBD/BeS combined groups in the E69 carriers were consistent with those of the entire study group.
Discussion
This study examines E69 associations with CBD and BeS in addition to evaluating the interrelationships between alleles, electrostatic charge, and location of amino acids in the peptide binding pockets to better define the risk related to E69 alleles and CBD and BeS. To our knowledge, the present study includes the largest number of CBD and BeS cases evaluated to date. We have confirmed that there is differential risk of CBD and BeS based on the presence of specific HLA-DPB1 E69 alleles, with the more common *02 alleles conferring the lowest risk compared with the lower frequency E69 alleles, as has been suggested but not proven in previous studies. Our results also support previously reported findings of an association between more negative computed electrostatic charge and higher disease risk due to the association between the LFAs and CBD. Lastly, we have evaluated amino acid differences in the pockets within the binding groove of HLA-DPB1, which provides a plausible explanation for the differential risk associated with carriage of the various E69 alleles. This allows an assessment of the potential interactions occurring in the trimolecular complex between the yet-undefined beryllium Ag, the MHC, and the TCR.
E69 in CBD and BeS
Although there have been multiple studies examining the association between the HLA-DPB1 gene (E69 carriage specifically) and CBD, there has been lack of consistency regarding the risk associated with the carriage of various E69 alleles. In their initial paper, Richeldi et al. (14) found HLA-DPB1 *0201 present in 54% of cases and only 18% of controls, whereas in Wang et al. (16) the *0201 allele was only present in 34% of cases. In our study in 2003 (8), we found that 39.4% of cases and 24.3% of controls carried the *0201 alleles. More recently, Rosenman et al. (11) found that the distribution of non-DPB1*0201 within E69-positive subjects was statistically increased in the CBD but not the BeS subjects. As noted by McCanlies et al. (10), the limited sample sizes of these earlier studies likely contributed to these different findings and, subsequently, the limited associations that could be explored. To our knowledge, our study is the first to have a significantly larger number of cases and controls, almost as large as all of the subjects included in the previous studies published to date. We were able to explicitly look at and find significant associations with the LFAs and amino acids in the binding pockets, associations not noted in prior studies. In addition to the limited sample sizes in past studies, it has been difficult to accurately compare *0201/0202 carriage with the less frequent E69 allele group carriage in terms of risk of disease owing to failure of the cases to conform to Hardy–Weinberg equilibrium, and thus the inability to analyze these results using an allele test. In some studies it was unclear whether departures from Hardy–Weinberg equilibrium were assessed or how the comparisons of alleles were performed analytically, limiting the ability to combine the results of these previous studies or to reanalyze these results in combination in a meta-analysis to address these questions. In our study we determined upper and lower bounds for the odds ratios, providing a clear approach for assessing this important comparison. Our study results, in conjunction with the others noted above, clearly show that the less frequent E69 alleles confer greater risk than do the *02 alleles for CBD and BeS. Since the time that these original studies were published, more accurate methods have been developed to identify alleles, along with an increase in the number of known E69 alleles. It is possible that the associations that we found in our study are due to linkage disequilibrium between the LFA and another relevant risk-related gene in the MHC region, and this should be investigated further.
Influence of amino acid changes on Ag binding
Many of the cell-based studies evaluating the immune response to beryllium have focused on the HLA-DPB1 *0201 allele as the most common E69 variant. These studies have highlighted the functional nature of the E69 gene in beryllium-stimulated proliferation and cytokine production and the pivotal interaction between a potential beryllium Ag, the TCR, and the HLA-DPB1 molecule. Specifically, by blocking HLA-DP with mAbs, beryllium-stimulated proliferation and Th1 cytokine production are inhibited. The HLA-DP2 structure provides a model to better understand the amino acids in the HLA complex and their interaction with a putative beryllium Ag (Fig. 5, adapted to LFAs) (22), and our data allow us to further this understanding. There may be three ways that alleles with their amino acids may influence the trimolecular complex. First, amino acid changes may influence how well the MHC molecule binds to the Ag peptide (25). Second, differences in the residues in direct contact with the TCR may change the T cell responses (26). Third, changes in the amino acid residues in the pockets may change the shape and charge of the groove, restricting which peptides and the TCR might bind (27).
FIGURE 5.

Structural features of HLA-DP2 (DPB1*0201) highlighting polymorphic residues of HLA-DP6 (DPB1*0601). (A) Top-down view of HLA-DP2 highlighting polymorphic amino acid residues in the peptide binding groove of HLA-DP6. Crystal structure of HLA-DP2 with self-derived DRα-chain peptide anchor residues (orange) as depicted with PyMol software (PDB ID code 3LQZ) is shown. The α helices and floor of the HLA-DP2 peptide binding groove are highlighted in green. Polymorphic HLA-DP6 amino acid residues are highlighted in red and have been changed (e.g., DP2 to DP6) using the Mutagenesis Wizard in PyMol. The three glutamic acid residues, thought to play a role in beryllium binding, are highlighted in blue and include Glu26, Glu68, and Glu69. (B) Focus on pocket 1 of HLA-DP highlighting the close proximity of polymorphic Asp84 (DP6) with DRα-chain peptide position 1 (Phe). (C) Focus on pockets 4 and 6 of HLA-DP highlighting the close proximity of polymorphic Leu11 (DP6) with DRα-chain peptide position 6 (Phe).
Ag peptide binding
Some of the variation in amino acids noted in the LFAs occurs in the pockets of the Ag binding groove. It has been suggested that residues 84–87 at pocket 1 and residues 11 and 69 at pockets 6 and 4, respectively, may play key roles in HLA-DP function and Ag binding (28). Our findings indicate that the aspartic acid substitution at position 84 in pocket 1 and the leucine substitution at position 11 in pocket 6 increase the risk of disease. Pockets 1 and 6 of both HLA-DP*0201 and HLA-DP*0401 have been found to have a similar structure and the same amino acids present at the polymorphic positions 84 and 11, with a glycine at both of these positions, although the charge associated with these two DPB1 alleles is different owing to E69 in *0201 (29, 30). Both pockets 1 and 6 are largely hydrophobic pockets (22, 31). Thus, the change in amino acids from a relatively neutral glycine without a side chain to an aspartic acid at amino acid position 84 and leucine at amino acid position 11 in the LFAs in these hyprophobic pockets would likely alter the peptide binding in pockets 1 and 6, respectively, both of which are key anchor pockets for peptide binding, as we have modeled in Fig. 5 based on the crystal structure of HLA-DP2. Specifically, the presence of aspartic acid at amino acid position 84 with a charge might repel a peptide or result in a more positive amino acid at pocket 1 in the Ag peptide, whereas the leucine at position 11 would provide stearic bulk. These changes could potentially impact the amino acids in the Ag peptide that would bind in the groove, the peptide binding affinity, or the peptide binding configuration to provide a more optimal Ag presentation and subsequently BeS and/or CBD.
TCR binding to the MHC complex
In addition to impacting peptide binding, amino acid changes in DPB1 can induce major functional changes in T cell recognition of MHC/peptide complexes, as studies suggest that each MHC pocket contributes to T cell recognition of peptides (32, 33). Although some T cells are able to recognize a limited number of MHC complexes, others are less limited in MHC recognition. Studies to date indicate that the T cells in the lung with CBD patients display an oligoclonal TCR Vβ expansion within an individual, with conserved CDRs in these TCR Vβ regions noted between individuals with CBD (34). A recent study from our group suggests that the TCR–peptide/MHC binding demonstrates an abnormal binding footprint that results in the TCR binding primarily to the HLA-DPB chain with little interaction with the α-chain (27). As a result, changes in the amino acid structure at sites other than E69 could impact the TCR–peptide/MHC binding and could explain the differential disease risk based on allele type.
Conformation and charge of the binding groove
The recent crystallization of the HLA-DPB1*0201 structure with a self HLA-DRα peptide revealed the conformation of the binding groove and its pockets (22). The structure of pocket 4 is made up of three glutamic acids, one at 69, along with the invariant positions 26 and 68. It is interesting that the groove between the peptide backbone and the DPB0201 β-chain α helix is larger than others in humans and mice (22). The conformational change also results in a solvent-exposed pocket amino acid in the peptide, and its size is sufficient to allow beryllium to bind in pocket 4, in addition to a peptide. This conformation explains the association that we and others have reported between CBD and E69 carriage. To extend this understanding to other pockets, it is necessary to examine the crystalline structures of other E69, non-*0201 alleles, and ideally with the peptide that binds beryllium, as the HLA-DR α-chain peptide does not stimulate beryllium-responsive TCRs in vitro. Such an investigation will help resolve our hypothesis that amino acid differences from the DPB0201 in the other binding pockets that result in structural changes associated with the lower frequency E69 alleles might allow for beryllium to bind more easily, either through more direct peptide accessibility to the MHC molecule or through a stronger bond with the TCR.
In addition to affecting conformation, changes in amino acids may affect charge in the binding groove, as indicated by a relatively negative charge in P4 for DP2 with the glutamic acids at position 69, 26, and 68. As the structural data are currently limited to the HLA-DP2 molecule, the impact of the amino acid changes at positions 84, 11, and others in the non-0201 DP molecules are unknown. Prior to defining the crystal structure, Snyder et al. (19, 20) defined the electrostatic potential at the molecular surface of each HLA-DP molecule and showed that the LFAs possessed a greater net negative charge than did the *0201 alleles. We used a similar analysis to see whether we could further refine the associations noted between the less frequent E69 alleles and the *0201 alleles. When a direct comparison was made between −9 versus −7 charges, the association was greater for the −9 charge than for the −7 charge for all case-control comparisons made, both before and after E69 adjustment. The −9 charges are associated with LFAs *0601, *0801, *0901, *1001, *1601, and *1701, whereas *0201 and *1301 are associated with the −7 charge. However, overall, they did not give significantly more information than did the allele comparisons that we made. However, the results from our study, as well as those of Dai et al. (22) and Snyder et al. (20), taken together with the calculated high binding affinities for beryllium, suggest that an adverse immune response, leading to CBD, is triggered by chemically specific metal–protein interactions.
Limitations
As with any study, there are limitations to this study. Although we had greater numbers of cases and controls than in previous studies evaluating the HLA-DPB1 region and CBD, if our study size had been larger we would potentially have had the power to evaluate additional comparisons. Additionally, there is a potential problem of possible misclassification of subjects between those who have CBD, those who are BeS, and those who are classified as controls, as ongoing surveillance and clinical evaluation define cases of BeS who develop CBD and workers who develop BeS. We are continually updating our diagnoses as subjects change statuses, and we have thus kept misclassification to a minimum. If anything, disease misclassification should prevent us from finding associations, not overestimating associations, noted in this study.
In conclusion, this study confirmed our hypothesis that the risk of CBD was higher in the LFAs, and that these LFAs have similar amino acid configurations in the peptide binding groove, especially in the p1 and p6 pockets, which serve as the key anchoring pockets of HLA-DP. These changes are similar to those found in other studies, but confirm that of the E69 alleles, the LFAs pose greater risk of BeS and CBD than do the *02 alleles. It is likely that these alterations may impact peptide binding, TCR binding, and or MHC binding groove conformation and charge. As noted above, the next steps are to define the difference in TCR–peptide/MHC binding in these HLA-DPB1 LFAs compared with the *02 molecules. Once putative peptides are defined, it will be helpful to ascertain the difference in the binding affinity of beryllium peptides to the various alleles.
Acknowledgments
This work was supported by National Institute of Environmental Health Sciences Grant PO1 ES11810-A1 and by the Colorado Clinical and Translational Sciences Institute, which is supported in part by National Institutes of Health/National Center for Advancing Translational Sciences Grant UL1 TR000154 to the Colorado Clinical and Translational Science Award program.
Abbreviations used in this article
- BeLPT
beryllium lymphocyte proliferation test
- BeS
beryllium sensitization
- CBD
chronic beryllium disease
- LFA
less frequent allele
Footnotes
Disclosures
The authors have no financial conflicts of interest.
References
- 1.Newman LS, Lloyd J, Daniloff E. The natural history of beryllium sensitization and chronic beryllium disease. Environ Health Perspect. 1996;104(Suppl 5):937–943. doi: 10.1289/ehp.96104s5937. [DOI] [PMC free article] [PubMed] [Google Scholar]
- 2.Kreiss K, Newman LS, Mroz MM, Campbell PA. Screening blood test identifies subclinical beryllium disease. J Occup Med. 1989;31:603–608. doi: 10.1097/00043764-198907000-00011. [DOI] [PubMed] [Google Scholar]
- 3.Stange AW, Furman FJ, Hilmas DE. Rocky Flats beryllium health surveillance. Environ Health Perspect. 1996;104(Suppl 5):981–986. doi: 10.1289/ehp.96104s5981. [DOI] [PMC free article] [PubMed] [Google Scholar]
- 4.Middleton DC, Mayer AS, Lewin MD, Mroz MM, Maier LA. Interpreting borderline BeLPT results. Am J Ind Med. 2011;54:205–209. doi: 10.1002/ajim.20909. [DOI] [PMC free article] [PubMed] [Google Scholar]
- 5.Middleton DC, Fink J, Kowalski PJ, Lewin MD, Sinks T. Optimizing BeLPT criteria for beryllium sensitization. Am J Ind Med. 2008;51:166–172. doi: 10.1002/ajim.20548. [DOI] [PubMed] [Google Scholar]
- 6.Newman LS, Mroz MM, Balkissoon R, Maier LA. Beryllium sensitization progresses to chronic beryllium disease: a longitudinal study of disease risk. Am J Respir Crit Care Med. 2005;171:54–60. doi: 10.1164/rccm.200402-190OC. [DOI] [PubMed] [Google Scholar]
- 7.McCanlies EC, Ensey JS, Schuler CR, Kreiss K, Weston A. The association between HLA-DPB1Glu69 and chronic beryllium disease and beryllium sensitization. Am J Ind Med. 2004;46:95–103. doi: 10.1002/ajim.20045. [DOI] [PubMed] [Google Scholar]
- 8.Maier LA, McGrath DS, Sato H, Lympany P, Welsh K, Du Bois R, Silveira L, Fontenot AP, Sawyer RT, Wilcox E, Newman LS. Influence of MHC class II in susceptibility to beryllium sensitization and chronic beryllium disease. J Immunol. 2003;171:6910–6918. doi: 10.4049/jimmunol.171.12.6910. [DOI] [PubMed] [Google Scholar]
- 9.Schuler CR, Virji MA, Deubner DC, Stanton ML, Stefaniak AB, Day GA, Park JY, Kent MS, Sparks R, Kreiss K. Sensitization and chronic beryllium disease at a primary manufacturing facility, part 3: exposure-response among short-term workers. Scand J Work Environ Health. 2012;38:270–281. doi: 10.5271/sjweh.3192. [DOI] [PubMed] [Google Scholar]
- 10.McCanlies EC, Kreiss K, Andrew M, Weston A. HLA-DPB1 and chronic beryllium disease: a HuGE review. Am J Epidemiol. 2003;157:388–398. doi: 10.1093/aje/kwg001. [DOI] [PubMed] [Google Scholar]
- 11.Rosenman KD, Rossman M, Hertzberg V, Reilly MJ, Rice C, Kanterakis E, Monos D. HLA class II DPB1 and DRB1 polymorphisms associated with genetic susceptibility to beryllium toxicity. Occup Environ Med. 2011;68:487–493. doi: 10.1136/oem.2010.055046. [DOI] [PubMed] [Google Scholar]
- 12.Wang Z, Farris GM, Newman LS, Shou Y, Maier LA, Smith HN, Marrone BL. Beryllium sensitivity is linked to HLA-DP genotype. Toxicology. 2001;165:27–38. doi: 10.1016/s0300-483x(01)00410-3. [DOI] [PubMed] [Google Scholar]
- 13.Rossman MD, Stubbs J, Lee CW, Argyris E, Magira E, Monos D. Human leukocyte antigen class II amino acid epitopes: susceptibility and progression markers for beryllium hypersensitivity. Am J Respir Crit Care Med. 2002;165:788–794. doi: 10.1164/ajrccm.165.6.2104002. [DOI] [PubMed] [Google Scholar]
- 14.Richeldi L, Sorrentino R, Saltini C. HLA-DPB1 glutamate 69: a genetic marker of beryllium disease. Science. 1993;262:242–244. doi: 10.1126/science.8105536. [DOI] [PubMed] [Google Scholar]
- 15.Saltini C, Amicosante M, Franchi A, Lombardi G, Richeldi L. Immunogenetic basis of environmental lung disease: lessons from the berylliosis model. Eur Respir J. 1998;12:1463–1475. doi: 10.1183/09031936.98.12061463. [DOI] [PubMed] [Google Scholar]
- 16.Wang Z, White PS, Petrovic M, Tatum OL, Newman LS, Maier LA, Marrone BL. Differential susceptibilities to chronic beryllium disease contributed by different Glu69 HLA-DPB1 and -DPA1 alleles. J Immunol. 1999;163:1647–1653. [PubMed] [Google Scholar]
- 17.Van Dyke MV, Martyny JW, Mroz MM, Silveira LJ, Strand M, Cragle DL, Tankersley WG, Wells SM, Newman LS, Maier LA. Exposure and genetics increase risk of beryllium sensitisation and chronic beryllium disease in the nuclear weapons industry. Occup Environ Med. 2011;68:842–848. doi: 10.1136/oem.2010.064220. [DOI] [PMC free article] [PubMed] [Google Scholar]
- 18.Van Dyke MV, Martyny JW, Mroz MM, Silveira LJ, Strand M, Fingerlin TE, Sato H, Newman LS, Maier LA. Risk of chronic beryllium disease by HLA-DPB1 E69 genotype and beryllium exposure in nuclear workers. Am J Respir Crit Care Med. 2011;183:1680–1688. doi: 10.1164/rccm.201002-0254OC. [DOI] [PMC free article] [PubMed] [Google Scholar]
- 19.Snyder JA, Weston A, Tinkle SS, Demchuk E. Electrostatic potential on human leukocyte antigen: implications for putative mechanism of chronic beryllium disease. Environ Health Perspect. 2003;111:1827–1834. doi: 10.1289/ehp.6327. [DOI] [PMC free article] [PubMed] [Google Scholar]
- 20.Snyder JA, Demchuk E, McCanlies EC, Schuler CR, Kreiss K, Andrew ME, Frye BL, Ensey JS, Stanton ML, Weston A. Impact of negatively charged patches on the surface of MHC class II antigen-presenting proteins on risk of chronic beryllium disease. J R Soc Interface. 2008;5:749–758. doi: 10.1098/rsif.2007.1223. [DOI] [PMC free article] [PubMed] [Google Scholar]
- 21.Fontenot AP, Torres M, Marshall WH, Newman LS, Kotzin BL. Beryllium presentation to CD4+ T cells underlies disease-susceptibility HLA-DP alleles in chronic beryllium disease. Proc Natl Acad Sci USA. 2000;97:12717–12722. doi: 10.1073/pnas.220430797. [DOI] [PMC free article] [PubMed] [Google Scholar]
- 22.Dai S, Murphy GA, Crawford F, Mack DG, Falta MT, Marrack P, Kappler JW, Fontenot AP. Crystal structure of HLA-DP2 and implications for chronic beryllium disease. Proc Natl Acad Sci USA. 2010;107:7425–7430. doi: 10.1073/pnas.1001772107. [DOI] [PMC free article] [PubMed] [Google Scholar]
- 23.Welsh K, Bunce M. Molecular typing for the MHC with PCR-SSP. Rev Immunogenet. 1999;1:157–176. [PubMed] [Google Scholar]
- 24.Weston A, Ensey JS, Frye BL. DNA-sequence determination of exon 2 of a novel HLA-DPB1 allele, HLA-DPB1*0403. DNA Seq. 2005;16:235–236. doi: 10.1080/10425170500061442. [DOI] [PubMed] [Google Scholar]
- 25.Guo SW, Thompson EA. Performing the exact test of Hardy-Weinberg proportion for multiple alleles. Biometrics. 1992;48:361–372. [PubMed] [Google Scholar]
- 26.Johansen TE, McCullough K, Catipovic B, Su XM, Amzel M, Schneck JP. Peptide binding to MHC class I is determined by individual pockets in the binding groove. Scand J Immunol. 1997;46:137–146. doi: 10.1046/j.1365-3083.1997.d01-102.x. [DOI] [PubMed] [Google Scholar]
- 27.Bowerman NA, Falta MT, Mack DG, Kappler JW, Fontenot AP. Mutagenesis of beryllium-specific TCRs suggests an unusual binding topology for antigen recognition. J Immunol. 2011;187:3694–3703. doi: 10.4049/jimmunol.1101872. [DOI] [PMC free article] [PubMed] [Google Scholar]
- 28.Sethi DK, Schubert DA, Anders AK, Heroux A, Bonsor DA, Thomas CP, Sundberg EJ, Pyrdol J, Wucherpfennig KW. A highly tilted binding mode by a self-reactive T cell receptor results in altered engagement of peptide and MHC. J Exp Med. 2011;208:91–102. doi: 10.1084/jem.20100725. [DOI] [PMC free article] [PubMed] [Google Scholar]
- 29.Diaz G, Amiscosante M, Jaraquemada D, Butler RH, Guillén MV, Sánchez M, Nombela C, Arroyo J. Functional analysis of HLA-DP polymorphism: a crucial role for DPβ residues 9, 11, 35, 55, 56, 69, and 84–87 in T cell allorecognition and peptide binding. Int Immunol. 2003;15:565–576. doi: 10.1093/intimm/dxg057. [DOI] [PubMed] [Google Scholar]
- 30.Castelli FA, Buhot C, Sanson A, Zarour H, Pouvelle-Moratille S, Nonn C, Gahery-Ségard H, Guillet JG, Ménez A, Georges B, Maillère B. HLA-DP4, the most frequent HLA II molecule, defines a new supertype of peptide-binding specificity. J Immunol. 2002;169:6928–6934. doi: 10.4049/jimmunol.169.12.6928. [DOI] [PubMed] [Google Scholar]
- 31.Patronov A, Dimitrov I, Flower DR, Doytchinova I. Peptide binding prediction for the human class II MHC allele HLA-DP2: a molecular docking approach. BMC Struct Biol. 2011;11:32. doi: 10.1186/1472-6807-11-32. [DOI] [PMC free article] [PubMed] [Google Scholar]
- 32.Díaz G, Cañas B, Vazquez J, Nombela C, Arroyo J. Characterization of natural peptide ligands from HLA-DP2: new insights into HLA-DP peptide-binding motifs. Immunogenetics. 2005;56:754–759. doi: 10.1007/s00251-004-0735-5. [DOI] [PubMed] [Google Scholar]
- 33.Lim DG, Slavik JM, Bourcier K, Smith KJ, Hafler DA. Allelic variation of MHC structure alters peptide ligands to induce atypical partial agonistic CD8+ T cell function. J Exp Med. 2003;198:99–109. doi: 10.1084/jem.20021796. [DOI] [PMC free article] [PubMed] [Google Scholar]
- 34.Fontenot AP, Kotzin BL, Comment CE, Newman LS. Expansions of T-cell subsets expressing particular T-cell receptor variable regions in chronic beryllium disease. Am J Respir Cell Mol Biol. 1998;18:581–589. doi: 10.1165/ajrcmb.18.4.2981. [DOI] [PubMed] [Google Scholar]