

A set of unexpected transcription factors affects complex regulatory control of AtALMT1 expression in response to Al stress.
Abstract
In Arabidopsis (Arabidopsis thaliana) the root apex is protected from aluminum (Al) rhizotoxicity by excretion of malate, an Al chelator, by ALUMINUM-ACTIVATED MALATE TRANSPORTER1 (AtALMT1). AtALMT1 expression is fundamentally regulated by the SENSITIVE TO PROTON RHIZOTOXICITY1 (STOP1) zinc finger protein, but other transcription factors have roles that enable Al-inducible expression with a broad dynamic range. In this study, we characterized multiple cis-elements in the AtALMT1 promoter that interact with transcription factors. In planta complementation assays of AtALMT1 driven by 5′ truncated promoters of different lengths showed that the promoter region between –540 and 0 (the first ATG) restored the Al-sensitive phenotype of atalm1 and thus contains cis-elements essential for AtALMT1 expression for Al tolerance. Computation of overrepresented octamers showed that eight regions in this promoter region contained potential cis-elements involved in Al induction and STOP1 regulation. Mutation in a position around –297 from the first ATG completely inactivated AtALMT1 expression and Al response. In vitro binding assays showed that this region contained the STOP1 binding site, which accounted for the recognition by four zinc finger domains of the protein. Other positions were characterized as cis-elements that regulated expression by repressors and activators and a transcription factor that determines root tip expression of AtALMT1. From the consensus of known cis-elements, we identified CALMODULIN-BINDING TRANSCRIPTION ACTIVATOR2 to be an activator of AtALMT1 expression. Al-inducible expression of AtALMT1 changed transcription starting sites, which increased the abundance of transcripts with a shortened 5′ untranslated region. The present analyses identified multiple mechanisms that regulate AtALMT1 expression.
Organic acid (OA) excretion from the roots plays beneficial roles in stress adaptation processes of plants (Baetz and Martinoia, 2014). The root-exuded OAs detoxify rhizotoxic ions, such as aluminum (Al) and copper (Kochian et al., 2004) and improve availability of phosphorus (Neumann et al., 1999) and iron (Kobayashi and Nishizawa, 2012). These roles are associated with the chemical properties of OAs, which can form chelate compounds with a variety of metals. For example, Arabidopsis (Arabidopsis thaliana) protects the root tip from Al toxicity by excreting malate and citrate through different OA transporters, namely ALUMINUM-ACTIVATED MALATE TRANSPORTER1 (ALMT1; Hoekenga et al., 2006) and a citrate-transporting multidrug and toxic compound extrusion (Liu et al., 2009). In addition, OAs can recruit beneficial rhizobacteria to the root surface by chemotaxis (Rudrappa et al., 2008). Certain bacteria form a biofilm on the root surface, which triggers systemically induced resistance (Lakshmanan et al., 2012). Excretion of OAs from the roots functions as a master switch through their pleiotropic roles in both biotic and abiotic stress tolerance. A recent molecular physiological study shows transcriptional regulation of genes for OA transporters play critical roles in optimization of OA excretion in stress response (Liu et al., 2014).
The ALMT1 protein was first identified in wheat (Triticum aestivum; TaALMT1), which regulated a major Al tolerance mechanism in wheat through Al exclusion by Al-activated malate excretion (Sasaki et al., 2004). Functional orthologs regulating Al tolerance have been identified in Arabidopsis (AtALMT1; Hoekenga et al., 2006), Glycine max (GmALMT1; Liang et al., 2013), and other plant species. The complex transcriptional regulation of these orthologs is consistent with the pleiotropic roles of the root-excreted malate. Transcription of the Arabidopsis ortholog AtALMT1 is activated by Al (Kobayashi et al., 2007) and by other signal inducers, including a type of microbe-associated molecular pattern peptide, flagellin22 (Kobayashi et al., 2013a). GmALMT1 expression is induced by multiple stressors, namely Al, phosphorus deficiency, and low pH (Liang et al., 2013). Transcriptional regulation also plays roles to optimize malate excretion in terms of carbon economy during malate excretion. For example, Al induces AtALMT1 expression in the root tips (Kobayashi et al., 2007), which are the most sensitive target of Al rhizotoxicity. Conversely, the expression level in epidermal cells of mature root tissue is greatly reduced, which may avoid unnecessary carbon loss in Al detoxification. Understanding such complex regulatory mechanisms at the molecular level will clarify the true nature of OA excretion in plant stress tolerance.
AtALMT1 is among the most highly up-regulated genes in the roots of Arabidopsis under Al-stressed conditions (Sawaki et al., 2009). Up-regulation of AtALMT1 is initiated at an early stage (after 1 h of Al exposure) and increases continuously over a longer period (up to 12 h; Kobayashi et al., 2007). A study that combined electrostatic modeling and molecular physiology showed that Al activation of AtALMT1 expression is sufficiently sensitive to alleviate Al toxicity (Kobayashi et al., 2013b). In addition, histochemical assays using transgenic plants carrying the GUS reporter gene showed that AtALMT1 expression was highly induced by Al in the whole root apex but was limited to central cells in the Al-tolerant mature root tissue (Kobayashi et al., 2007). This is likely to optimize protection of sensitive tissue from Al toxicity and minimize carbon loss by malate excretion. These complex but harmonized regulatory mechanisms are achieved by the combined action of multiple transcription factors that regulate expression levels and tissue specificity (Birnbaum et al., 2003). Although the mechanism of transcriptional regulation has not been completely elucidated, previous studies show that Al activation of AtALMT1 expression is completely suppressed in the dysfunctional mutant of SENSITIVE TO PROTON RHIZOTOXICITY1 (AtSTOP1; Iuchi et al., 2007). The stop1 mutant carries a missense mutation in which His is substituted with Tyr at the essential Cys-2-His-2 motif in one of the four zinc finger domains, which indicates that STOP1 may directly bind to the AtALMT1 promoter and activate transcription. In addition, a recent study has shown that a type of Al-suppressed repressor protein is involved in AtALMT1 activation by Al (Ding et al., 2013). Coordinated regulation by additional transcription factor(s) is reported in the Al-inducible expression of Al tolerance genes in rice (Oryza sativa) that are regulated by the AtSTOP1 ortholog ALUMINUM RESISTANCE TRANSCRIPTION FACTOR1 (ART1; Yamaji et al., 2009). Expression of SENSITIVE TO ALUMINUM RHIZOTOXICITY1 (STAR1), which encodes a half-type ABC transporter (Huang et al., 2009), requires coordination of the ABSCISIC ACID, STRESS, AND RIPENING5 (ASR5) transcription factor (Arenhart et al., 2014). A similar complex mechanism is likely to be involved in Al-inducible expression of AtALMT1.
Identification of cis-elements is a useful approach to analyze complex regulation of gene expression. In planta assays using transgenic plants that carry a deleted promoter:reporter gene construct are often used to map the cis-regulatory elements in the promoter region. In planta complementation assays, involving transformation of the functional gene driven by the deleted promoters into the mutant background, are also useful to evaluate essential promoter function (Kobayashi et al., 2013a). In addition, several bioinformatic procedures have been developed to predict cis-elements (Tompa et al., 2005; Zou et al., 2011). For example, we previously developed a procedure for cis-element prediction using a microarray dataset that computed the relative appearance ratio (RAR) of the octamers (i.e. the frequency of a particular octamer in the grouped genes relative to that in the genome-wide genes) as a predictive index (Yamamoto et al., 2011b). Using this approach to identify overrepresented octamers in the promoter of salt-inducible genes, which were identified from microarray analysis, we successfully predicted the promoter regions containing experimentally validated cis-elements in the promoter of RESPONSIVE TO DESSICATION 29A (RD29A). RD29A is among the best characterized promoters of salt-inducible genes in Arabidopsis (Narusaka et al., 2003). Combination of in planta reporter assays and this bioinformatic approach is useful to identify the important regions of the AtALMT1 promoter that regulate efficient response to Al exposure.
In this study, we analyzed the Al-responsive region of the AtALMT1 promoter by integrating bioinformatics and molecular biological approaches. Overrepresented octamers in gene groups induced or suppressed by Al in the stop1 mutant enabled identification of several candidate regions in the AtALMT1 promoter. Further analyses of these regions using GUS reporter assays clarified the complex regulation of AtALMT1, which involves the STOP1-binding site and interaction with repressors and activators.
RESULTS
Activity of the AtALMT1 Promoter in Al Tolerance and AtALMT1 Expression
Activity of the AtALMT1 promoter in Al tolerance was examined by means of an in planta complementation growth assay of transgenic AtALMT1-knockout (KO; atalmt1) lines carrying AtALMT1 driven by a 5′-deleted promoter series (from –1,900 to –200; Fig. 1, A and B). Growth of the transgenic line carrying AtALMT1 driven by the –1,900 promoter was comparable to that of the wild-type ecotype Columbia (Col-0), but more extensive deletion of the 5′ end of the promoter altered the degree of growth recovery. Deletion to –1,220 slightly improved growth (but not significantly; Fig. 1B) compared with that of the –1,900 promoter, which accounted for previous identified position of the localization of the cis-element binding with the WAKY46 repressor (Ding et al., 2013). Growth of the deletion line driven by the –540 promoter slightly decreased compared with that of the –1,900 promoter and was comparable to that of the wild type. The shorter promoters (–317, –292, and –200) than the –540 promoter could not recover Al tolerance in AtALMT1-KO. These results indicated that the promoter region from 0 (ATG) to –540 included critical factors that recover Al tolerance of AtALMT1-KO.
Figure 1.

In planta complementation assay of AtALMT1 driven by 5′-deleted promoters of different lengths. AtALMT1 carrying different lengths of the promoter were transformed into AtALMT1-KO (atalmt1). The position of the 5′ end of the promoter from the open reading frame (ORF) is shown in A. Root length of transgenic AtALMT1-KO carrying AtALMT1 driven by 5′-deleted promoters, wild-type (WT) Col-0, and AtALMT1-KO were measured for 5-d plants grown in Al-toxic solution (4 µm Al, pH 5.0) or control solution (no Al, pH 5.0; B, n = 5, means ± sd). Transcript levels of AtALMT1 were analyzed by real-time quantitative PCR and were normalized with the UBIQUTIN1 (UBQ1) expression level. Seedlings were precultured in control solution for 10 d, and then the roots were placed in 10 μm AlCl3 (pH 5.0) for 24 h. Fold induction of AtALMT1 (Al treatment/control) was calculated for three lines (carrying the promoter of length –540, −317, or –292 bp), ALMT1-KO, and the wild type. The mean ± sd fold induction of three replications for each line is shown in C. Asterisks in B and C represent a significant difference (P < 0.05) compared with the wild type.
Expression levels of AtALMT1 in the transgenic complemented lines were quantified by real-time quantitative PCR after Al treatment for 24 h using primer pairs that did not amplify any amplicons in the AtALMT1-KO lines (Fig. 1C). The AtALMT1 expression level with the –540 promoter was comparable to that of the wild type and was decreased in the transgenic plants carrying the –317 promoter. Expression was negligible in the transgenic lines carrying AtALMT1 driven by the –292 promoter. Taken together, these findings suggested that the promoter region between –540 and 0 contained critical cis-element(s) that determine Al tolerance through AtALMT1 expression.
Identification of Potential Promoter Regions Involved in Al-Activated and STOP1-Regulated Expression of AtALMT1
The RAR of octamers was plotted for the 0 (ATG) to –540 region of the AtALMT1 promoter. A high RAR value indicated that the octamer sequence at the plotted position of the AtALMT1 promoter was overrepresented in the promoter of Al-responsive gene groups identified by microarray experiments relative to the genome-wide promoters (Yamamoto et al., 2011b).
Given that AtALMT1 expression was highly up-regulated in response to Al treatment and was strictly regulated by the STOP1 zinc finger transcription factor, this analysis was carried out using groups of genes up-regulated by Al (after 6- and 24-h treatment) and suppressed in the stop1 mutant compared with the wild type (Fig. 2, A and B). In total, eight peaks (A–H; RAR > 3) were identified from the promoter scanning analysis. Except for peak G, all other peaks contained octamers that were detected under at least one condition and with statistical significance (P < 0.05, Fisher’s exact test; Supplemental Table S1). These peaks consisted of eight (peak G) to 15 bases (peak F). Some of the peaks (B, E, and F) contained previously identified octamers, which were predicted to be octamers related to potential cis-regulatory elements (regulatory element groups [REGs]; Yamamoto et al., 2007) based on analysis of the local distribution of octamers for the genome-wide promoters (Fig. 2A, blue line). Some of the peaks contained known motifs that were previously identified as cis-elements, of which some are targeted by particular transcription factors (Fig. 2B). Putative cis-elements in the core promoter were not detected by our method, whereas TATA boxes and a Y-patch (Y for pyrimidine) motif have been identified by other methods (Fig. 2A, blue and green lines). Three transcription start sites (TSSs) were identified by 5′ RACE (Supplemental Fig. S1), which were localized at –84, –138, and –185 bp from ATG (Fig. 2A, orange line). Two of the TSSs were associated with putative TATA boxes. Identification of these multiple factors was consistent with the wide dynamic range of AtALMT1 expression.
Figure 2.

RAR scanning plot for the AtALMT1 promoter based on the relative appearance ratio calculated from microarray datasets. A, The RAR of each octamer was plotted to its 3′-end position in the AtALMT1 promoter. The Al-inducible genes (fold change [Al/control] > 3) at different time points (treatment for 6 or 24 h with 10 μm Al, pH 5) and the genes suppressed in the stop1 mutant (stop1 mt) after 24 h of Al treatment (fold change [wild type/stop1] < 2.5) were grouped from the microarray data set. The RAR was calculated from the frequency of the octamer in the promoter of the grouped genes relative to that of the 24,956 genome-wide genes. The black lines represent the RAR plots, and yellow-shaded regions represent significantly overrepresented octamers (P < 0.05, Fisher’s exact test). Promoter regions detected by significantly overrepresented octamers (RAR > 3, P < 0.05) are highlighted with vertical bars (designated A–G). Closely associated REGs (predicted from the ppdb), octamers of the A to H regions, and the TSS predicted from the ppdb are shown below the plots. Positions of TATA boxes and a Y-patch motif predicted by the ppdb and by Gibbs sampling using suppressed genes in the stop1 mutant are shown. B, The position within the promoter of each peak detected in A. Octamers used for mutation analysis in Figure 3 (underlined), the corresponding REG (obtained from the ppdb), and the putative motif of cis-acting elements are shown.
Characterization of the Predicted Promoter Regions for AtALMT1 Expression
Eight RAR peak regions in the AtALMT1 promoter (Fig. 2A) were characterized using transgenic plants carrying the GUS reporter gene driven by the mutated promoters. To inactivate these detected regions, the represented octamer (highlighted in bold in Fig. 2B) was mutated in the –1,110 AtALMT1 promoter (designated native promoter [NP]).
Activities of the mutated promoters were evaluated by monitoring GUS expression by real-time quantitative PCR in the transgenic plants after Al treatment for 24 h (Fig. 3A). Mutation caused different expression patterns compared with the NP other than peak G position. This suggested that most of predicted positions contained functional cis-elements that regulate AtALMT1 expression. Transcript levels of the mutated cis-B were significantly higher than that of the NP in the control treatment (no Al), whereas its transcript levels in the Al treatment showed no significant difference. This result suggested that the region may be a repressor binding site. The GUS transcript levels of the mutated cis-A, cis-C, and cis-H were decreased in the Al treatment, whereas they maintained similar levels of transcription in the control. This finding suggested that these regions contained cis-element(s) required for Al activation of the promoter. Mutation of cis-D, cis-E, and cis-F caused reduction of GUS transcript levels in both the control and Al treatment. This result suggested that these regions contained cis-binding sites that are essential for maintaining basal transcription in the control treatment and Al-activated transcription, although the degree of suppression differed. Among the cis-D, cis-E, and cis-F regions, the cis-D region was indicated to contain the most critical factor for both transcription in the control and under Al exposure, and the mutation of this site reduced transcription of the NP less than 10–3. Thus, the results indicated that the cis-D region is essential for transcription of AtALMT1.
Figure 3.

Changes in activity of AtALMT1 promoters carrying mutations of nucleotides at the position of overrepresented octamers. Representative octamers in the A to H regions were mutated (Fig. 2B), and the promoter activity was evaluated using transgenic plants carrying the GUS reporter gene driven by the mutated promoter. The GUS reporter expression was quantified in the control (–1,110 from ATG), and the mutated promoter lines by real-time quantitative PCR. Relative expression levels (GUS/UBQ1) in the control (no Al) solution (white bars) and in 10 μm Al solution (black bars) are shown after treatment for 24 h (A) and 6 h (B). The mean ± sd values of three replications are shown. Asterisks indicate a significant difference from the relative expression level of the control transgenic lines (Student’s t test; * or +, P < 0.05; and ** or ++, P < 0.01).
Positions within the promoter associated with Al activation (i.e. corresponding to the cis-A, cis-C, cis-D, cis-E, cis-F, and cis-H regions) were further characterized by determining the relative expression level of GUS after 6 h of Al treatment (Fig. 3B). Mutation of the cis-A and cis-C regions did not cause a significant difference in GUS transcript levels with the NP, whereas the mutated cis-H and other lines showed significantly lower GUS transcript levels than the NP under Al treatment. These results suggested that the cis-A and cis-C regions may be associated with a transcription factor inducible by Al after 6 h of exposure.
Profiling of AtALMT1 Expression by GUS Staining
To further characterize the peak regions other than peak G to the AtALMT1 expression, root apices were subjected to histochemical staining for GUS activity (Fig. 4, A and B). After exposure of the root tip to Al for 24 h, almost all of the transgenic lines carrying GUS driven by the mutated AtALMT1 promoters (mutation in the cis-A, cis-B, cis-C, cis-E, and cis-H regions) showed a similar staining profile to that of NP transgenic plants. Thus, these mutations did not notably alter the cellular specificity of GUS expression in the root tip. Mutation in cis-F caused inactivation of expression in the root tip, which indicated that the cis-element in the F region regulated cellular-specific expression in the root tip. Mutation in the cis-D region completely inactivated expression in all root cells and thus induced severe suppression of expression (Fig. 4A). Mutation in the cis-B region caused positive GUS staining in the control (Fig. 4B), whereas the NP did not generate a positive signal. These results further supported the hypothesis that the cis-B regions contain cis-elements that interact with a repressor.
Figure 4.
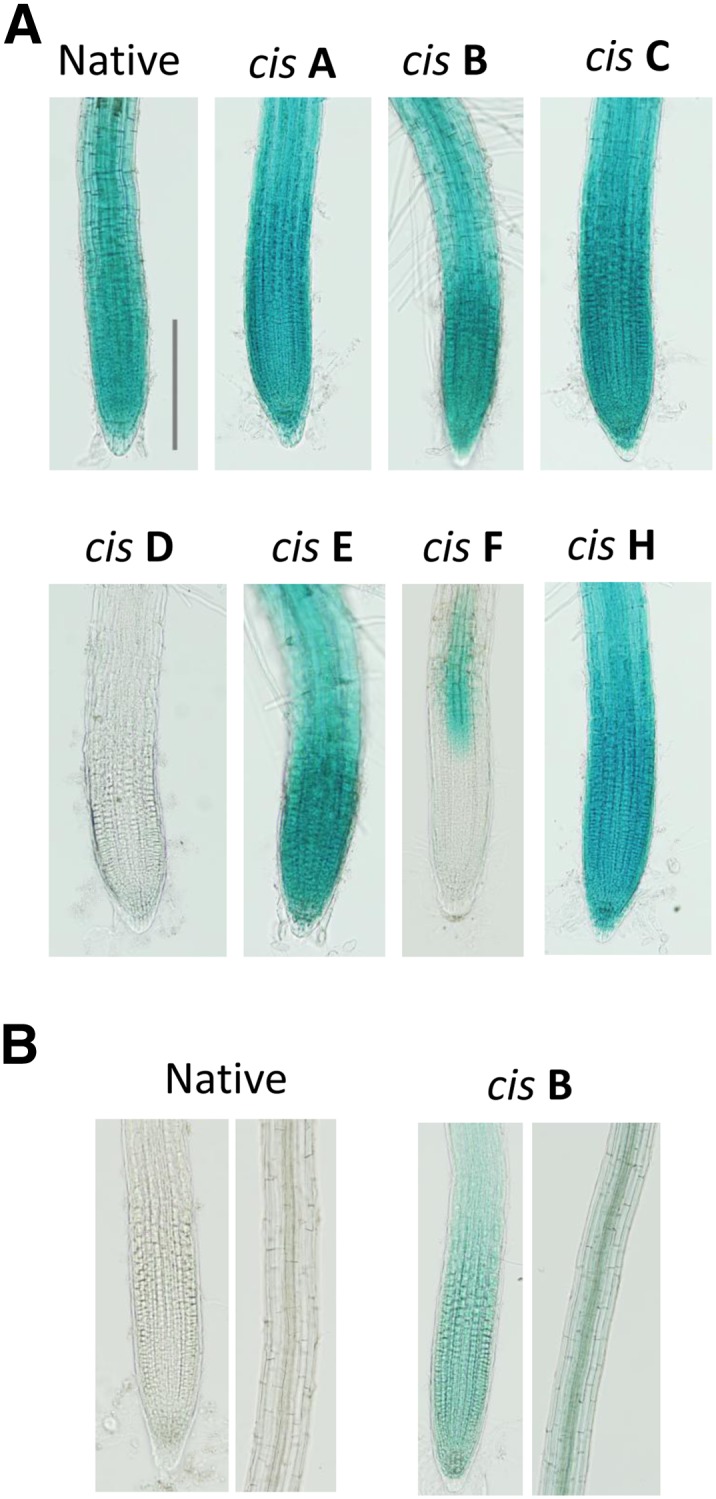
Histochemical analysis of GUS expression in the transgenic plants carrying AtALMT1 promoter:GUS. GUS staining was carried out 30 to 60 min after incubation in 10 μm Al solution (pH 5.6) for 24 h (A) or control solution (no Al, pH 5.6; B). Native and cis-A to cis-H (mutated in the regions cis-A to cis-H) were identical to the transgenic lines used in Figure 3. Identical results were confirmed in at least three independent experiments. Bar = 20 μm.
In Vitro Binding of STOP1 Protein to the Peak cis-D Region
The mutation of the cis-D region almost completely inactivated transcription in the control and Al treatments, which was very similar to expression levels of ALMT1 in the stop1 mutant (Iuchi et al., 2007). In addition, this region contains a target sequence of the rice STOP1 ortholog ART1 (Tsutsui et al., 2011). This suggests that cis-D may contain STOP1 binding site(s) that are critical for AtALMT1 expression. To test this possibility, we analyzed the capacity of STOP1 to bind to the cis-D region using an AlphaScreen system. Four overlapping double-stranded DNA (dsDNA) probes (30 bp; probes 2–5; Fig. 5A) were designed that covered the cis-C, cis-D, cis-E, and cis-F regions, –252 to −331 from ATG, while the probe 1 was designed for the cis-A as the negative control. When these probes were reacted with in vitro-translated STOP1 protein, the highest signal was detected with probe 3 (Fig. 5C). The signal of probe 3 was competitively suppressed by the nonbiotin-labeled probe 3, but not by the nonreactive negative control probe (Supplemental Fig. S2). These results indicated that our assay condition could detect specific binding of STOP1 to the probe 3 region.
Figure 5.

In vitro binding assay of dsDNA and the STOP1 protein using an AlphaScreen system. A, In vitro-translated STOP1 protein labeled with the accepter beads of the AlphaScreen system was incubated with the 30-bp dsDNA. B, Relative AlphaScreen signals were calculated as the ratio of AlphaScreen signals of the reactive probe (biotin labeled) to those of the nonreactive probe (nonbiotin labeled) in the presence of the labeled STOP1 protein and streptavidin-coated donor beads. Values are the mean ± sd (n = 3). Different letters above the bars indicate a significant difference (P < 0.05, Tukey’s test). C, Competitive assays of the probe 3 region with the single nucleotide mutagenized probes. The reactive probe 3 (see B) was incubated with the labeled STOP1 protein in the presence of nonlabeled probe 3 or the probe that carried a single-nucleotide mutation. Relative values ± sd (n > 3) were calculated as the ratio of the value obtained in the absence of the competitor (AC). Asterisks indicate a significant difference larger than the relative AlphaScreen signals of nonreactive probe 3 (Student’s t test; *P < 0.05, **P < 0.01).
In a competition assay using 5-bp-mutated probe 3, the STOP1 protein could bind to cis-D (Supplemental Fig. S3). To localize the STOP1 binding position, the unique region of probe 3 (7–26 bp from the 5′ end) was analyzed using individual point-mutated probes (designated M7–M26). Twenty probes were designed that included 12 probes (M8–M19) corresponding to the detected octamers at peak D (Supplemental Table S2). The mutagenized probes (nonlabeled) were mixed with the biotinylated native probe 3 in a 9:1 ratio, and then the AlphaScreen signals were compared (Fig. 5C). A point mutation at 11 positions significantly increased signal intensity for native probe 3 (black bars in Fig. 5C), including six nucleotides in the detected peak D region (underlined; TAAGGGGAGGGC of the predicted peak D; Fig. 2B). These results indicated that the STOP1 protein could bind to the cis-D region, which is essential for transcription. These results indicated that the STOP1 protein can bind to a wider range of the promoter region than the cis-D region.
Characterization of Zinc Finger Domains of STOP1
STOP1 carries four Cys-2-His-2 zinc finger domains. The His-to-Tyr point mutation at the second His residue of the first domain is the probable cause of the stop1 mutant, which shows complete suppression of AtALMT1 expression (Iuchi et al., 2007). To evaluate the impact of this mutation on the binding capacity of STOP1, we performed an AlphaScreen assay using mutagenized proteins. The second His residues were mutated to Tyr in each zinc finger domain; the mutated protein was designated MT_ZF1-4 and used for binding assays with probe 3 (Fig. 6A). As we inferred, MT_ZF1 (i.e. originally identified mutated position of stop1 mutant) almost completely suppressed the binding capacity of STOP1 (less than 0.1 of native STOP1; Fig. 6B). MT_ZF2 and MT_ZF4 showed similar levels of suppression of the STOP1 binding capacity, suggesting that these domains are critical for binding to the AtALMT1 promoter. Mutation in ZF3 did not comparably suppress binding, which indicated that this domain may contribute less than other domains to the binding of STOP1 to the AtALMT1 promoter.
Figure 6.

Characterization of the capacity of zinc finger domains of STOP1 to bind to the AtALMT1 promoter. A, His (H)-to-Tyr (Y) mutations were introduced to four Cys-2-His-2 zinc finger domains. The capacity to bind to probe 3 (Fig. 5) was analyzed with an AlphaScreen system. aa., Amino acid. B, Relative luminescence intensity of the labeled probe 3 and STOP1 proteins (native STOP1 and mutated proteins, MT_ZF1–MT_ZF4). Values are the mean ± sd (n = 3) relative to native STOP1 protein. Different letters above the bars indicate a significant difference (P < 0.05, Tukey’s test).
Involvement of CAMTA in Activation of the cis-C Region
The cis-C region contained the ACGCGT sequence, which is a consensus of cis-acting elements (CGCG box; [A/C]CGCG[C/G/T]) for the CALMODULIN-BINDING TRANSCRIPTION ACTIVATOR (CAMTA) transcription factor that regulates expression of stress-responsive genes carrying the CGCG box (Yang and Poovaiah, 2002). Using a previously reported microarray dataset (10 μm Al treatment for 24 h; Sawaki et al., 2009), we showed that among major stress-responsive CAMTA genes, CAMTA1 to CAMTA3 were likely responsive to Al (Supplemental Table S3). The CAMTA genes comprise six homologous genes in Arabidopsis (Finkler et al., 2007). Time course analysis showed that CAMTA1 and CAMTA2 were continuously inducible by Al during treatment for 24 h (Fig. 7A). A transfer DNA (T-DNA) insertion mutant of CAMTA2 significantly suppressed Al tolerance in terms of root growth (Fig. 7B). In addition, the expression level of AtALMT1 decreased by about 15% in the camta2 mutant (Fig. 7C). We also observed binding activity of CAMTA2 to the CGCG box in the cis-C region in an AlphaScreen assay (probe 2; Fig. 7, D and E). Taken together, these results indicated that up-regulation of CAMTA2 is involved in the activation of AtALMT1 expression, in particular, after 6 h of Al treatment.
Figure 7.

Characteristics of Al-responsive CAMTAs in AtALMT1 expression and Al tolerance of Arabidopsis. A, Expression of Al-responsive CAMTA genes (CAMTA1, CAMTA2, and CAMTA3) were quantified by reverse transcription real-time quantitative PCR after exposure to 10 μm Al solution (pH 5.0). Values are the mean ± sd expression level relative to the control (no Al, pH 5.0). B and C, Relative root growth (Al/control) in 5-d-old seedlings (with or without 5 μm Al, pH 5.0, n = 10; B) and expression of AtALMT1 quantified after incubation in 10 μm Al (pH 5.0) for 24 h (n = 3; C). Values are the mean ± se (B) and sd (C), and asterisks indicate a significant difference relative to Col-0 (Student’s t test, P < 0.05). D and E, AlphaScreen signals in the binding assay for probe 2 (containing CGCG box) and probe 3 (Fig. 5) with the CAMTA2 protein (D) and those in the competitive assay using the mutagenized probe 2 (E). Different letters above the bars indicate a significant difference (P < 0.05, Tukey’s test).
Changes in AtALMT1 Transcription of TSSs
The AtALMT1 promoter possesses two putative TATA boxes. Although mechanisms remain to be clarified, the average number of TATA boxes is significantly higher in strongly stress-responsive genes (e.g. fold change > 10; Yamamoto et al., 2011a). To explore this issue in relation to AtALMT1 transcription, we determined the TSS by 5′ RACE and quantified each transcript. The 5′ RACE identified three TSSs in the AtALMT1 promoter. TSS1 and TSS2 were located in the 3′ region of the putative TATA1 and TATA2 with intervals of about 20 bp (Supplemental Fig. S1). To quantify each transcript transcribed from the different TSSs (TSS1–TSS3), three primer pairs and a TaqMan probe were designed (Fig. 8A). Transcripts of TSS1 were the most abundant among the transcripts of the three TSSs, which comprised 65% of transcripts in the control and 70% to 75% after 6 and 24 h of Al treatment (Fig. 8B). The proportion of TSS2 transcripts was increased by Al treatment to about 20% after 24 h Al treatment compared with 5% in the control. By contrast, the proportion of transcripts of TSS3, which is not associated with a TATA consensus, decreased in response to Al treatment. These results suggested that the increase in shorter transcripts, which are associated with the TATA box, was associated with regulation of AtALMT1 transcription under Al treatment.
Figure 8.

Relative amounts of AtALMT1 transcripts that carried different lengths of the 5′ untranslated region. A, Transcripts of AtALMT1 were quantified by quantitative reverse transcription PCR using different primer pairs and the TaqMan probe to quantify TSS1-3 (TSS1 primer pair), TSS2 and TSS3 (TSS2 primer pair), and TSS3 (TSS3 primer pair). CDS, Coding DNA sequence. B, Relative proportions of TSS1, TSS2, and TSS3 transcripts at different time points during treatment with 10 μm Al (pH 5.0) for 24 h.
DISCUSSION
Previous studies revealed that transcriptional regulation of AtALMT1 plays critical roles in the protection of the sensitive root tips of Arabidopsis from Al toxicity (Hoekenga et al., 2006). This process is likely optimized to minimize carbon loss by regulation of expression levels and tissue-specific expression (Kobayashi et al., 2007, 2013a). In this study, we identified several important regions of the AtALMT1 promoter that control expression levels based on a promoter scanning analysis. The promoter scanning analysis showed that several octamers were overrepresented in the promoter region of AtALMT1 (Fig. 2). Inactivation of seven of the eight octamers altered AtALMT1 expression under the control condition and Al treatment (Fig. 3, A and B). This variety of regulatory mechanisms in the promoter structure is consistent with the complex regulation of AtALMT1 expression under Al stress. In addition, these elements likely coordinately regulate Al tolerance judged by the growth recovery by the transgenic AtALMT1-KO lines carrying AtALMT1 driven by 5′-deleted promoters (Fig. 1).
Expression of AtALMT1 is strongly triggered by Al exposure and increases continuously during 12- to 24-h exposure to over 30 times the expression level of the control (Fig. 1C). The broad dynamic range of AtALMT1 expression may be explained partly by the region (cis-B) that is likely associated with repressor (Fig. 3). Inactivation of the region induced expression under control conditions, which indicated that the region maintains a low expression level under the control condition. Several other regions are indicated to regulate Al activation of AtALMT1 transcription (i.e. increase expression under Al treatment). In addition, AtALMT1 carried another character of highly inducible genes in possessing multiple TATA boxes, which was identified by genome-wide analysis of the promoter structure in the stress-responsive genes (Yamamoto et al., 2011a). The combination of these factors would account for the broad dynamic range of up-regulation of AtALMT1.
Some of these regions may regulate AtALMT1 transcription in a time-dependent manner, suggesting that repression of the repressor proteins or induction of activator proteins occurred during Al treatment. WRKY46 was recently identified as a repressor of AtALMT1, whereas WRKY46 itself is repressive to Al. Thus, negatively regulated activation plays a role in Al-inducible AtALMT1 expression (Ding et al., 2013). Conversely, in this study, we found that some cis-acting elements interact with transcription factors inducible/activated by Al (Fig. 3). These elements coordinately regulate the Al-responsive expression of AtALMT1 and Al tolerance. We observed that deletion of the 5′ end containing cis-A (i.e. the –317 AtALMT1 promoter:GUS transgenic plant) resulted in decreased AtALMT1 expression after 24 h exposure to Al (Fig. 1C). However, at 6 h, no change in the GUS expression level was observed in the transgenic line carrying the –1,110 AtALMT1 promoter:GUS construct (Fig. 4; Kobayashi et al., 2013a). Conversely, some of the cis-acting elements showed no difference in Al response at both 6 and 24 h (e.g. cis-D, cis-F, and cis-H; Fig. 3, A and B). These factors may be activated rapidly by protein phosphorylation/dephosphorylation, which has previously been shown to be a regulatory mechanism of AtALMT1 expression (Kobayashi et al., 2007). Combination of these mechanisms may minimize expression in the control and enhance expression in a continuously wide range.
One of the cis-acting elements cis-C contained a CGCG box, which is a binding site for the stress-inducible transcription activator CAMTA (Yang and Poovaiah, 2002). Previous studies of CAMTAs indicate that stress-inducible expression of specific CAMTAs regulates expression of stress tolerance genes, such as response to pathogen attack (Galon et al., 2008), cold stress (Kim et al., 2013), and drought (Pandey et al., 2013). Combination of in planta promoter:reporter assays and an in vitro protein-DNA binding assay suggested that the Al-inducible CAMTA2 activates AtALMT1 expression by binding to the cis-C region (Fig. 7, D and E). The expression pattern of CAMTA2 under Al treatment was consistent with the AtALMT1 expression response. Expression of CAMTA2 was induced by Al within 6 h (Fig. 7A), while inactivation of cis-C (binding site of CAMTA) decreased expression after 24 h, but not 6 h (Fig. 3, A and B). Further research on Al-inducible and Al-repressive transcription factors may identify other Al-responsive transcription factors that regulate AtALMT1 expression.
Among the predicted cis-elements, mutation of the cis-D, cis-E, and cis-F suppressed AtALMT1 expression to control levels in the promoter:GUS transgenic plants (Fig. 3, A and B). In particular, inactivation of cis-D decreased the expression level to less than 10–3, which was similar to the AtALMT1 expression level in the stop1 mutant under the control condition. An in vitro binding assay indicated that STOP1 binds to cis-D and surrounding regions of the AtALMT1 promoter (Fig. 5). The cis-D sequence contained a previously identified minimum consensus of ART1 in rice (GGNVS; Tsutsui et al., 2011). However, our in vitro analysis with the AtALMT1 promoter indicated that a wider region of the promoter interacted with STOP1, as 11 nucleotides affected the binding capacity of STOP1. Cys-2-His-2 zinc finger domains often recognize two to four nucleotides for binding (Pavletich and Pabo, 1991; Segal et al., 1999), whereas STOP1 contains four zinc finger domains (Iuchi et al., 2007). The binding assay with mutated STOP1 showed that all four zinc finger domains, including ZF1, which carries the His-to-Tyr substitution of the stop1 mutant, were functional for binding with the dsDNA of the cis-D region (Fig. 6). Although ZF3 showed less functionality for binding, these results strongly suggested that a broader region is required for STOP1 binding. Inactivation of the cis-acting elements severely repressed expression of AtALMT1, suggesting that STOP1 binding is critical for AtALMT1 expression. In addition, the fold change (Al/control) was decreased to 5.0 from 22.3, which indicated that STOP1 binding is one factor that regulates AtALMT1 expression in response to Al exposure.
Inactivation of cis-F altered the tissue-specific expression profile of AtALMT1 (Fig. 4A). GUS staining assays showed that inactivation of cis-F completely repressed expression of AtALMT1 in the root tips and outer tissues (cortex and epidermis) of the mature root. This finding suggested that transcription factor(s) binding to cis-F play critical roles in tissue-specific expression of AtALMT1. In the tissues altered by mutation in cis-F tissues, an unknown factor is required for STOP1-dependent expression of AtALMT1. It is reported that ART1-regulating Al-responsive expression of STAR1 in rice requires the ASR5 transcription factor, which is associated with tissue-specific expression in the root tips for binding to the GCCCA sequence in the STAR1 promoter (Arenhart et al., 2014).
Although the Arabidopsis genome does not contain an ASR homolog (Carrari et al., 2004), the same sequence was identified in the cis-F region (GCCCA; Fig. 2B). Interestingly, the GCCCA sequence is known to be the target cis-acting element of members of the TEOSINTE BRANCHED1, CYCLOIDEA, AND PROLIFERATING CELL FACTOR (TCP) transcription factor family, which coregulates expression of various genes in meristematic tissues together with other transcription factors (Trémousaygue et al., 2003). Although ASR5 and TCP transcription factors do not show overall similarity, a TCP-type transcription factor may play a role in tissue-specific AtALMT1 expression in Arabidopsis. Interestingly, promoter scanning analysis using an Arabidopsis dataset (i.e. overrepresented octamers in the promoter of suppressed genes in the stop1 mutant) showed that the TaALMT1 promoter of wheat contained a set of STOP1-binding motifs and cis-acting elements for CAMTAs and was associated with cis-acting elements for TCP domain transcription factor(s)/ASR5 (Fig. 9). An Al-tolerant wheat near-isogenic line (ET8) contained three sets of STOP1/CAMTA binding sites and expressed greater levels of TaALMT1, whereas an Al-sensitive near-isogenic line (ES8) carried a single set (Sasaki et al., 2006). This suggested that a similar regulatory mechanism, namely combination of STOP1-like protein/root-specific transcription factors, may be conserved in various plant species. Similar events, namely an increase in the number of STOP1/ART1 binding sites, was observed in Holcus lanatus, which is naturally adapted to acidic soils (Chen et al., 2013).
Figure 9.

Promoter scanning analysis of the ALMT1 promoter of wheat (TaALMT1) near-isogenic lines that carried different levels of ALMT1 expression (Al tolerant ET8 and Al sensitive ES8). RAR values calculated from the Arabidopsis data (suppressed genes in the stop1 mutant in response to Al treatment) were plotted for the promoters of ET8 and ES8. Putative STOP1-binding (green), peak cis-C-like (CGCG box, orange), and peak cis-F-like (GCCCA, gray) sequences are indicated.
In this study, we efficiently identified a series of cis-elements of AtALMT1 using RAR-based prediction of cis-elements. In planta assay of GUS expression validated the accuracy of prediction and indicated that regulation consisted of suppression and activation and that STOP1 binding regulates both the expression level and Al response (Fig. 10). In addition, we identified one of the activating transcription factors, CAMTA2, by integration of reverse genetics using T-DNA insertion lines and in vitro protein-DNA binding assays. Further molecular-level research is required to identify other transcription factors that regulate AtALMT1 expression by the interaction with the remaining predicted cis-elements.
Figure 10.

Schematic representation of Al-inducible expression of AtALMT1. Black rectangles indicate cis-acting elements predicted by promoter scanning in Figure 2 and confirmed by mutated promoter-reporter assays (Fig. 3). Putative functions of transcription factors (e.g. suppressor or activator) are indicated for the experimentally validated transcription factors (STOP1 and CAMTA2, this study; WRKY46, Ding et al., 2013).
MATERIALS AND METHODS
Plant Materials
Arabidopsis (Arabidopsis thaliana) accession Col-0 (JA58) was obtained from the RIKEN BioResource Center (http://en.brc.riken.jp/index.shtml). The T-DNA insertion mutant of AtALMT1, designated AtALMT1-KO (SALK_009629), was obtained from the Arabidopsis Biological Resource Center (https://abrc.osu.edu). T-DNA insertion lines of CAMTA1 (SALK_008187), CAMTA2 (SALK_007027), and CAMTA3 (SALK_001152) were also obtained from the Arabidopsis Biological Resource Center (Supplemental Fig. S4). Transgenic Arabidopsis lines carrying AtALMT1 in the AtALMT1-KO background used in the in planta complementation assay, and those carrying GUS in the Col-0 background for the promoter GUS-reporter assay, were generated using the Agrobacterium tumefaciens-mediated floral dip method (Clough and Bent, 1998). AtALMT1 driven by the AtALMT1 promoter of different lengths (–1,900, –1,200, –540, –317, –292, and –200 bp from ATG) were transformed into AtALMT1-KO, and GUS regulated by the mutated promoter of AtALMT1 (Fig. 2A) was transformed into Col-0. All vectors were constructed by insertion of the DNA fragments obtained by overlap extension PCR (Horton et al., 1989) into the T-DNA of pBE2113. The fragments consisted of the AtALMT1 promoter (deleted or mutated), the coding DNA sequence of the GUS or AtALMT1 open reading frame, and 980 bp at the 3′ end of AtALMT1. The sequences of the primers used are shown in Supplemental Table S4. The overlapping extension PCR was carried out using PrimeSTAR Max high-fidelity Taq polymerase (Takara Bio). A hypervirulent strain of A. tumefaciens (GV3101) was used for transformation. The T2 generation of each line was used for the assays.
Growth Conditions for in Planta Complementation and Reporter Expression Assays
Arabidopsis seedlings were grown hydroponically in accordance with the method described by Kobayashi et al. (2007) in modified MGRL nutrient solution (Fujiwara et al., 1992) supplemented with 200 μm CaCl2 and one-fiftieth strength of other nutrients except inorganic phosphorus (excluded) in the presence or absence of 5 μm AlCl3 at an initial pH of 5.0 adjusted with HCl. For the in planta complementation assay of Al tolerance, about 20 seedlings were grown in the control (0 Al) and Al-toxic (5 μm Al) solutions. The solutions were refreshed every 2 d. Root length was measured on day 5, and the 10 highest values (to exclude uncontrollable late-germinated seedlings) were used for evaluation of Al tolerance. For GUS reporter expression analyses with Al treatment, seedlings were pregrown in the control solution for 10 d, and then the roots were placed in Al-toxic solution containing 10 μm AlCl3 (pH 5.0) for 6 or 24 h. The seedlings were incubated at 22°C ± 2°C under a 12-h-light/12-h-dark photoperiod, with light supplied at a photosynthetic photon flux density of 37 μmol m–2 s–1. Staining of GUS was carried out with hydroponically grown seedlings as described previously (Kobayashi et al., 2013a). Briefly, 5-d-old seedlings were treated with or without Al in MGRL solution (pH 5.0) for 24 h and then stained with staining solution (1.0 mm X-glucuronide, 0.1 m sodium phosphate buffer [pH 7.0], 10 mm EDTA [pH 8.0], 0.5 mm potassium ferricyanide [pH 7.0], 0.5 mm potassium ferrocyanide [pH 7.0], 0.3% [v/v] Triton X-100, and 20% [v/v] methanol) for 30 min (Al; Fig. 3A) or 60 min (no Al; Fig. 3B) at 37°C.
Prediction of cis-Acting Elements in the AtALMT1 Promoter
The RAR of the octamer unit of the AtALMT1 promoter was calculated using the method described by Yamamoto et al. (2011b). Briefly, Al-inducible and -suppressible genes in the stop1 mutant were identified from microarray datasets. Each of the 222 and 266 genes, respectively, were grouped as Al-inducible genes on the basis of the fold change (+Al/no Al, >3) of microarray data obtained after treatment with 10 μm Al for 6 or 24 h. Two hundred forty-nine genes were grouped as suppressed genes in the stop1 mutant on the basis of the fold change of microarray data (Col-0/stop1) after 10 μm Al treatment for 24 h. All microarray experiments were carried out using the Agilent Arabidopsis oligoDNA chip (Agilent Technologies) as described previously (Sawaki et al., 2009). The RAR was calculated as the ratio of the frequency of each octamer unit in the promoter of the grouped genes to that in the promoters of genome-wide genes. The promoter was defined as –1,000 bp from the TSS reported in the Plant Promoter Database (ppdb; http://ppdb.agr.gifu-u.ac.jp; Hieno et al., 2014). The RAR value of each octamer unit was plotted on the 0- to –540-bp region of the AtALMT1 promoter and statistical significance (P < 0.05) was assessed with Fisher’s exact test.
The significantly overrepresented octamer units (RAR > 3, P < 0.05) were defined as cis-A to cis-H with collocated (>5-bp interval) octamer units with RAR greater than 3. The position of the REGs, TSS, and core promoter elements in ALMT1 were determined from the ppdb. A consensus sequence for the same gene groups was independently computed with the Melina II tool using the Gibbs sampler method (Okumura et al., 2007). These data are shown in Figure 2A.
RNA Extraction, Real-Time Quantitative Reverse Transcription-PCR, and 5′ RACE
Total RNA was isolated using Sepasol-RNA I Super G (Nacalai Tesque) in accordance with the manufacturer’s instructions. Total RNA was reverse transcribed with ReverTra Ace (Toyobo, Osaka). Real-time reverse transcription-PCR (except the experiment shown in Fig. 8) was performed with SYBR Premix Ex Taq II (Takara Bio) and the Thermal Cycler Dice Real Time System II (Takara Bio) following the manufacturer’s instructions using gene-specific primer pairs (Supplemental Table S4). The transcript levels were quantified with the standard curve method using a complementary DNA dilution series as described by Bustin et al. (2009). Quantification of AtALMT1 transcripts with a different TSS (Fig. 8) was carried out by the standard curve method using Taqman probe with Premix Ex Taq (Probe qPCR; Takara Bio). The standard curve was developed with accurately quantified plasmid DNA (subcloned promoter in the pMD20 vector). The copy number of transcripts of each TSS was calculated arithmetically. In all experiments, transcript levels of AtALMT1 and GUS were normalized against UBQ1 (At3g52590). Contamination of genomic DNA in the sample was checked by performing the same reactions without reverse transcription, and the amplification efficiency of primers was checked for all primers. The 5′ RACE of AtALMT1 was carried out as previously described by Kihara et al. (2003). Reverse transcription was carried out with SuperScript III Reverse Transcriptase (Life Technologies) using gene-specific primers (Supplemental Table S4). Amplicons derived from 5′ RACE were subcloned into pMD20 (Takara Bio) and then sequenced using the BigDye Terminator v3.1 Cycle Sequencing Kit with an ABI PRISM 3100 Genetic Analyzer (Applied Biosystems) in accordance with the manufacturer’s recommended protocols.
In Vitro Protein-dsDNA Interaction Assay
The amplified luminescence proximity homogeneous assay was used to determine the interaction of AtSTOP1 and dsDNAs designed from the AtALMT1 promoter. The FLAG (DYKDDDDK)-tagged AtSTOP1 proteins were synthesized using an in vitro transcription/translation system (BioSieg). The protein quality (i.e. efficient synthesis with the expected molecular mass) was confirmed by a western-blotting analysis using anti-FLAG (Wako Pure Chemical Industries) in accordance with the manufacturer’s recommended protocols. Both biotinylated and control (nonbiotinylated) DNA oligos were obtained from supplier and used to synthesize dsDNAs. The donor and acceptor beads for the AlphaScreen detection were coated with the anti-FLAG antibody and with streptavidin, respectively. The beads were labeled with the STOP1 FLAG-tagged proteins or the biotinylated dsDNA-oligo(s) using the AlphaScreen FLAG (M2) Detection Kit (PerkinElmer) in accordance with the recommended protocols. The labeled beads were mixed in reaction buffer comprising 25 mm HEPES-KOH (pH 7.6), 40 mm KCl, 0.01% (w/v) Tween 20, and 0.1% (w/v) bovine serum albumin and incubated for 3 h at 22°C. Competitive assays to characterize the STOP1 binding sites were performed by adding mutated dsDNA-oligos to the reaction buffer containing the biotinylated dsDNA-oligo-labeled acceptor beads. The AlphaScreen signals (chemiluminescence between the donor and the acceptor beads conjugated by the binding of labeled STOP1 and dsDNA-oligo) were determined with the Enspire Multimode plate reader (PerkinElmer). The AlphaScreen signals for the control (nonbiotinylated) dsDNA-oligos in the labeling step were used for estimation of the background luminescence. Relative AlphaScreen signals were defined as the ratio of luminescence of the biotinylated dsDNA-oligos to the background.
Sequence data from this article can be found in the Arabidopsis Genome Initiative database under accession numbers At1g08430 (AtALMT1), At1g34370 (STOP1), At5g09410 (CAMTA1), At5g64220 (CAMTA2), and At2g22300 (CAMTA3). Microarray data are available through the ArrayExpress database with accession code E-MEXP-1908 and the Gene Expression Omnibus database with accession number GSE62238.
Supplemental Data
The following supplemental materials are available.
Supplemental Figure S1. The 5′ end of AtALMT1 transcripts determined by 5′ RACE. 5′ RACE analyses were performed RNA samples isolated from Al-treated roots.
Supplemental Figure S2. In vitro binding assay of STOP1 protein to the dsDNA probe 3 containing putative STOP1 binding sites of AtALMT1 promoter.
Supplemental Figure S3. In vitro binding assay of STOP1 protein to the mutated dsDNA probe 3 (see Fig. 5).
Supplemental Figure S4. Position of T-DNA insertion in the knockout lines of CAMTAs and expression levels of CAMTAs in the mutants.
Supplemental Table S1. List of overrepresented octamer units in the AtALMT1 promoter based on the relative appearance rate calculated from microarray datasets.
Supplemental Table S2. Sequence of mutated probes used for in vitro binding assay of STOP1 protein to the AtALMT1 promoter region.
Supplemental Table S3. Fold change (10 µm Al/control; pH 5, 24 h) of CAMTA families in Al-treated roots.
Supplemental Table S4. Sequence information of PCR primers.
Supplementary Material
Glossary
- OA
organic acid
- RAR
relative appearance ratio
- Col-0
ecotype Columbia
- REG
regulatory element group
- TSS
transcription start site
- NP
native promoter
- T-DNA
transfer DNA
- ppdb
Plant Promoter Database
Footnotes
This work was supported by the Japan Society for the Promotion of Science (to M.T., Y.K., and H.K.).
Articles can be viewed without a subscription.
References
- Arenhart RA, Bai Y, de Oliveira LF, Neto LB, Schunemann M, Maraschin FS, Mariath J, Silverio A, Sachetto-Martins G, Margis R, et al. (2014) New insights into aluminum tolerance in rice: the ASR5 protein binds the STAR1 promoter and other aluminum-responsive genes. Mol Plant 7: 709–721 [DOI] [PMC free article] [PubMed] [Google Scholar]
- Baetz U, Martinoia E (2014) Root exudates: the hidden part of plant defense. Trends Plant Sci 19: 90–98 [DOI] [PubMed] [Google Scholar]
- Birnbaum K, Shasha DE, Wang JY, Jung JW, Lambert GM, Galbraith DW, Benfey PN (2003) A gene expression map of the Arabidopsis root. Science 302: 1956–1960 [DOI] [PubMed] [Google Scholar]
- Bustin SA, Benes V, Garson JA, Hellemans J, Huggett J, Kubista M, Mueller R, Nolan T, Pfaffl MW, Shipley GL, et al. (2009) The MIQE guidelines: minimum information for publication of quantitative real-time PCR experiments. Clin Chem 55: 611–622 [DOI] [PubMed] [Google Scholar]
- Carrari F, Fernie AR, Iusem ND (2004) Heard it through the grapevine? ABA and sugar cross-talk: the ASR story. Trends Plant Sci 9: 57–59 [DOI] [PubMed] [Google Scholar]
- Chen ZC, Yokosho K, Kashino M, Zhao FJ, Yamaji N, Ma JF (2013) Adaptation to acidic soil is achieved by increased numbers of cis-acting elements regulating ALMT1 expression in Holcus lanatus. Plant J 76: 10–23 [DOI] [PubMed] [Google Scholar]
- Clough SJ, Bent AF (1998) Floral dip: a simplified method for Agrobacterium-mediated transformation of Arabidopsis thaliana. Plant J 16: 735–743 [DOI] [PubMed] [Google Scholar]
- Ding ZJ, Yan JY, Xu XY, Li GX, Zheng SJ (2013) WRKY46 functions as a transcriptional repressor of ALMT1, regulating aluminum-induced malate secretion in Arabidopsis. Plant J 76: 825–835 [DOI] [PubMed] [Google Scholar]
- Finkler A, Ashery-Padan R, Fromm H (2007) CAMTAs: calmodulin-binding transcription activators from plants to human. FEBS Lett 581: 3893–3898 [DOI] [PubMed] [Google Scholar]
- Fujiwara T, Hirai MY, Chino M, Komeda Y, Naito S (1992) Effects of sulfur nutrition on expression of the soybean seed storage protein genes in transgenic petunia. Plant Physiol 99: 263–268 [DOI] [PMC free article] [PubMed] [Google Scholar]
- Galon Y, Nave R, Boyce JM, Nachmias D, Knight MR, Fromm H (2008) Calmodulin-binding transcription activator (CAMTA) 3 mediates biotic defense responses in Arabidopsis. FEBS Lett 582: 943–948 [DOI] [PubMed] [Google Scholar]
- Hieno A, Naznin HA, Hyakumachi M, Sakurai T, Tokizawa M, Koyama H, Sato N, Nishiyama T, Hasebe M, Zimmer AD, et al. (2014) ppdb: plant promoter database version 3.0. Nucleic Acids Res 42: D1188–D1192 [DOI] [PMC free article] [PubMed] [Google Scholar]
- Hoekenga OA, Maron LG, Piñeros MA, Cançado GM, Shaff J, Kobayashi Y, Ryan PR, Dong B, Delhaize E, Sasaki T, et al. (2006) AtALMT1, which encodes a malate transporter, is identified as one of several genes critical for aluminum tolerance in Arabidopsis. Proc Natl Acad Sci USA 103: 9738–9743 [DOI] [PMC free article] [PubMed] [Google Scholar]
- Horton RM, Hunt HD, Ho SN, Pullen JK, Pease LR (1989) Engineering hybrid genes without the use of restriction enzymes: gene splicing by overlap extension. Gene 77: 61–68 [DOI] [PubMed] [Google Scholar]
- Huang CF, Yamaji N, Mitani N, Yano M, Nagamura Y, Ma JF (2009) A bacterial-type ABC transporter is involved in aluminum tolerance in rice. Plant Cell 21: 655–667 [DOI] [PMC free article] [PubMed] [Google Scholar]
- Iuchi S, Koyama H, Iuchi A, Kobayashi Y, Kitabayashi S, Kobayashi Y, Ikka T, Hirayama T, Shinozaki K, Kobayashi M (2007) Zinc finger protein STOP1 is critical for proton tolerance in Arabidopsis and coregulates a key gene in aluminum tolerance. Proc Natl Acad Sci USA 104: 9900–9905 [DOI] [PMC free article] [PubMed] [Google Scholar]
- Kihara T, Wada T, Suzuki Y, Hara T, Koyama H (2003) Alteration of citrate metabolismin cluster roots of white lupin. Plant Cell Physiol 44: 901–908 [DOI] [PubMed] [Google Scholar]
- Kim Y, Park S, Gilmour SJ, Thomashow MF (2013) Roles of CAMTA transcription factors and salicylic acid in configuring the low-temperature transcriptome and freezing tolerance of Arabidopsis. Plant J 75: 364–376 [DOI] [PubMed] [Google Scholar]
- Kobayashi T, Nishizawa NK (2012) Iron uptake, translocation, and regulation in higher plants. Annu Rev Plant Biol 63: 131–152 [DOI] [PubMed] [Google Scholar]
- Kobayashi Y, Hoekenga OA, Itoh H, Nakashima M, Saito S, Shaff JE, Maron LG, Piñeros MA, Kochian LV, Koyama H (2007) Characterization of AtALMT1 expression in aluminum-inducible malate release and its role for rhizotoxic stress tolerance in Arabidopsis. Plant Physiol 145: 843–852 [DOI] [PMC free article] [PubMed] [Google Scholar]
- Kobayashi Y, Kobayashi Y, Sugimoto M, Lakshmanan V, Iuchi S, Kobayashi M, Bais HP, Koyama H (2013a) Characterization of the complex regulation of AtALMT1 expression in response to phytohormones and other inducers. Plant Physiol 162: 732–740 [DOI] [PMC free article] [PubMed] [Google Scholar]
- Kobayashi Y, Kobayashi Y, Watanabe T, Shaff JE, Ohta H, Kochian LV, Wagatsuma T, Kinraide TB, Koyama H (2013b) Molecular and physiological analysis of Al3+ and H+ rhizotoxicities at moderately acidic conditions. Plant Physiol 163: 180–192 [DOI] [PMC free article] [PubMed] [Google Scholar]
- Kochian LV, Hoekenga OA, Piñeros MA (2004) How do crop plants tolerate acid soils? Mechanisms of aluminum tolerance and phosphorous efficiency. Annu Rev Plant Biol 55: 459–493 [DOI] [PubMed] [Google Scholar]
- Lakshmanan V, Kitto SL, Caplan JL, Hsueh YH, Kearns DB, Wu YS, Bais HP (2012) Microbe-associated molecular patterns-triggered root responses mediate beneficial rhizobacterial recruitment in Arabidopsis. Plant Physiol 160: 1642–1661 [DOI] [PMC free article] [PubMed] [Google Scholar]
- Liang C, Piñeros MA, Tian J, Yao Z, Sun L, Liu J, Shaff J, Coluccio A, Kochian LV, Liao H (2013) Low pH, aluminum, and phosphorus coordinately regulate malate exudation through GmALMT1 to improve soybean adaptation to acid soils. Plant Physiol 161: 1347–1361 [DOI] [PMC free article] [PubMed] [Google Scholar]
- Liu J, Magalhaes JV, Shaff J, Kochian LV (2009) Aluminum-activated citrate and malate transporters from the MATE and ALMT families function independently to confer Arabidopsis aluminum tolerance. Plant J 57: 389–399 [DOI] [PubMed] [Google Scholar]
- Liu J, Piñeros MA, Kochian LV (2014) The role of aluminum sensing and signaling in plant aluminum resistance. J Integr Plant Biol 56: 221–230 [DOI] [PubMed] [Google Scholar]
- Narusaka Y, Nakashima K, Shinwari ZK, Sakuma Y, Furihata T, Abe H, Narusaka M, Shinozaki K, Yamaguchi-Shinozaki K (2003) Interaction between two cis-acting elements, ABRE and DRE, in ABA-dependent expression of Arabidopsis rd29A gene in response to dehydration and high-salinity stresses. Plant J 34: 137–148 [DOI] [PubMed] [Google Scholar]
- Neumann G, Massonneau A, Martinoia E, Römheld V (1999) Physiological adaptations to phosphorus deficiency during proteoid root development in white lupin. Planta 208: 373–382 [Google Scholar]
- Okumura T, Makiguchi H, Makita Y, Yamashita R, Nakai K (2007) Melina II: a web tool for comparisons among several predictive algorithms to find potential motifs from promoter regions. Nucleic Acids Res 35: W227-W231. [DOI] [PMC free article] [PubMed] [Google Scholar]
- Pandey N, Ranjan A, Pant P, Tripathi RK, Ateek F, Pandey HP, Patre UV, Sawant SV (2013) CAMTA 1 regulates drought responses in Arabidopsis thaliana. BMC Genomics 14: 216. [DOI] [PMC free article] [PubMed] [Google Scholar]
- Pavletich NP, Pabo CO (1991) Zinc finger-DNA recognition: crystal structure of a Zif268-DNA complex at 2.1 A. Science 252: 809–817 [DOI] [PubMed] [Google Scholar]
- Rudrappa T, Czymmek KJ, Paré PW, Bais HP (2008) Root-secreted malic acid recruits beneficial soil bacteria. Plant Physiol 148: 1547–1556 [DOI] [PMC free article] [PubMed] [Google Scholar]
- Sasaki T, Ryan PR, Delhaize E, Hebb DM, Ogihara Y, Kawaura K, Noda K, Kojima T, Toyoda A, Matsumoto H, et al. (2006) Sequence upstream of the wheat (Triticum aestivum L.) ALMT1 gene and its relationship to aluminum resistance. Plant Cell Physiol 47: 1343–1354 [DOI] [PubMed] [Google Scholar]
- Sasaki T, Yamamoto Y, Ezaki B, Katsuhara M, Ahn SJ, Ryan PR, Delhaize E, Matsumoto H (2004) A wheat gene encoding an aluminum-activated malate transporter. Plant J 37: 645–653 [DOI] [PubMed] [Google Scholar]
- Sawaki Y, Iuchi S, Kobayashi Y, Kobayashi Y, Ikka T, Sakurai N, Fujita M, Shinozaki K, Shibata D, Kobayashi M, et al. (2009) STOP1 regulates multiple genes that protect Arabidopsis from proton and aluminum toxicities. Plant Physiol 150: 281–294 [DOI] [PMC free article] [PubMed] [Google Scholar]
- Segal DJ, Dreier B, Beerli RR, Barbas CF III (1999) Toward controlling gene expression at will: selection and design of zinc finger domains recognizing each of the 5′-GNN-3′ DNA target sequences. Proc Natl Acad Sci USA 96: 2758–2763 [DOI] [PMC free article] [PubMed] [Google Scholar]
- Tompa M, Li N, Bailey TL, Church GM, De Moor B, Eskin E, Favorov AV, Frith MC, Fu Y, Kent WJ, et al. (2005) Assessing computational tools for the discovery of transcription factor binding sites. Nat Biotechnol 23: 137–144 [DOI] [PubMed] [Google Scholar]
- Trémousaygue D, Garnier L, Bardet C, Dabos P, Hervé C, Lescure B (2003) Internal telomeric repeats and ‘TCP domain’ protein-binding sites co-operate to regulate gene expression in Arabidopsis thaliana cycling cells. Plant J 33: 957–966 [DOI] [PubMed] [Google Scholar]
- Tsutsui T, Yamaji N, Feng Ma J (2011) Identification of a cis-acting element of ART1, a C2H2-type zinc-finger transcription factor for aluminum tolerance in rice. Plant Physiol 156: 925–931 [DOI] [PMC free article] [PubMed] [Google Scholar]
- Yamaji N, Huang CF, Nagao S, Yano M, Sato Y, Nagamura Y, Ma JF (2009) A zinc finger transcription factor ART1 regulates multiple genes implicated in aluminum tolerance in rice. Plant Cell 21: 3339–3349 [DOI] [PMC free article] [PubMed] [Google Scholar]
- Yamamoto YY, Ichida H, Matsui M, Obokata J, Sakurai T, Satou M, Seki M, Shinozaki K, Abe T (2007) Identification of plant promoter constituents by analysis of local distribution of short sequences. BMC Genomics 8: 67. [DOI] [PMC free article] [PubMed] [Google Scholar]
- Yamamoto YY, Yoshioka Y, Hyakumachi M, Maruyama K, Yamaguchi-Shinozaki K, Tokizawa M, Koyama H (2011b) Prediction of transcriptional regulatory elements for plant hormone responses based on microarray data. BMC Plant Biol 11: 39. [DOI] [PMC free article] [PubMed] [Google Scholar]
- Yamamoto YY, Yoshioka Y, Hyakumachi M, Obokata J (2011a) Characteristics of core promoter types with respect to gene structure and expression in Arabidopsis thaliana. DNA Res 18: 333–342 [DOI] [PMC free article] [PubMed] [Google Scholar]
- Yang T, Poovaiah BW (2002) A calmodulin-binding/CGCG box DNA-binding protein family involved in multiple signaling pathways in plants. J Biol Chem 277: 45049–45058 [DOI] [PubMed] [Google Scholar]
- Zou C, Sun K, Mackaluso JD, Seddon AE, Jin R, Thomashow MF, Shiu SH (2011) Cis-regulatory code of stress-responsive transcription in Arabidopsis thaliana. Proc Natl Acad Sci USA 108: 14992–14997 [DOI] [PMC free article] [PubMed] [Google Scholar]
Associated Data
This section collects any data citations, data availability statements, or supplementary materials included in this article.