

Abstract
Heterotrimers composed of B cell CLL/lymphoma 10 (BCL10), mucosa-associated lymphoid tissue lymphoma translocation protein 1 (MALT1), and caspase recruitment domain–containing (CARD) family adaptors play a role in NF-κB activation and have been shown to be involved in both the innate and the adaptive arms of immunity in murine models. Moreover, individuals with inherited defects of MALT1, CARD9, and CARD11 present with immunological and clinical phenotypes. Here, we characterized a case of autosomal-recessive, complete BCL10 deficiency in a child with a broad immunodeficiency, including defects of both hematopoietic and nonhematopoietic immunity. The patient died at 3 years of age and was homozygous for a loss-of-expression, loss-of-function BCL10 mutation. The effect of BCL10 deficiency was dependent on the signaling pathway, and, for some pathways, the cell type affected. Despite the noted similarities to BCL10 deficiency in mice, including a deficient adaptive immune response, human BCL10 deficiency in this patient resulted in a number of specific features within cell populations. Treatment of the patient’s myeloid cells with a variety of pathogen-associated molecular pattern molecules (PAMPs) elicited a normal response; however, NF-κB–mediated fibroblast functions were dramatically impaired. The results of this study indicate that inherited BCL10 deficiency should be considered in patients with combined immunodeficiency with B cell, T cell, and fibroblast defects.
Introduction
Combined immunodeficiency (CID) is a group of phenotypically heterogeneous genetic disorders characterized by severe recurrent infections, with normal numbers or an absence of T and B lymphocytes and impaired cellular and humoral immunity. Up to 40 mutations in different genes have been found to cause these conditions (1–3), and 2 subgroups of CID have been defined: severe combined immunodeficiency (SCID) (4) and CID, which is generally less profound than SCID (5). SCID is characterized by a lack of autologous T cells, whereas CID patients have T cells. Patients with CID generally have disease of too low a clinical severity to qualify as SCID. Unfortunately, it is not always easy to distinguish between these conditions, and it can therefore be difficult to assess prognosis. Inborn defects of the CBM complex — consisting of caspase recruitment domain–containing (CARD) family adaptors, B cell CLL/lymphoma 10 (BCL10), and mucosa-associated lymphoid tissue lymphoma translocation protein 1 (MALT1) — have recently been shown to underlie SCID, CID, and other immunological phenotypes (6–10). The CBM complex is involved in NF-κB activation after stimulation of various receptors on lymphoid, myeloid, and epithelial cells (11–13). Deficiencies in MALT1 and CARD11 (also known as CARMA1) are associated with CID and SCID, respectively, and CARD9 deficiency has been shown to compromise innate immunity to a small number of fungi in a selective manner (6–10). Here, our investigations of a child with CID revealed inherited BCL10 deficiency. The broad phenotype of innate, adaptive, and nonhematopoietic immunodeficiency found in this patient highlights the nonredundant role of human BCL10.
Results
Homozygous BCL10 mutation in a patient with CID.
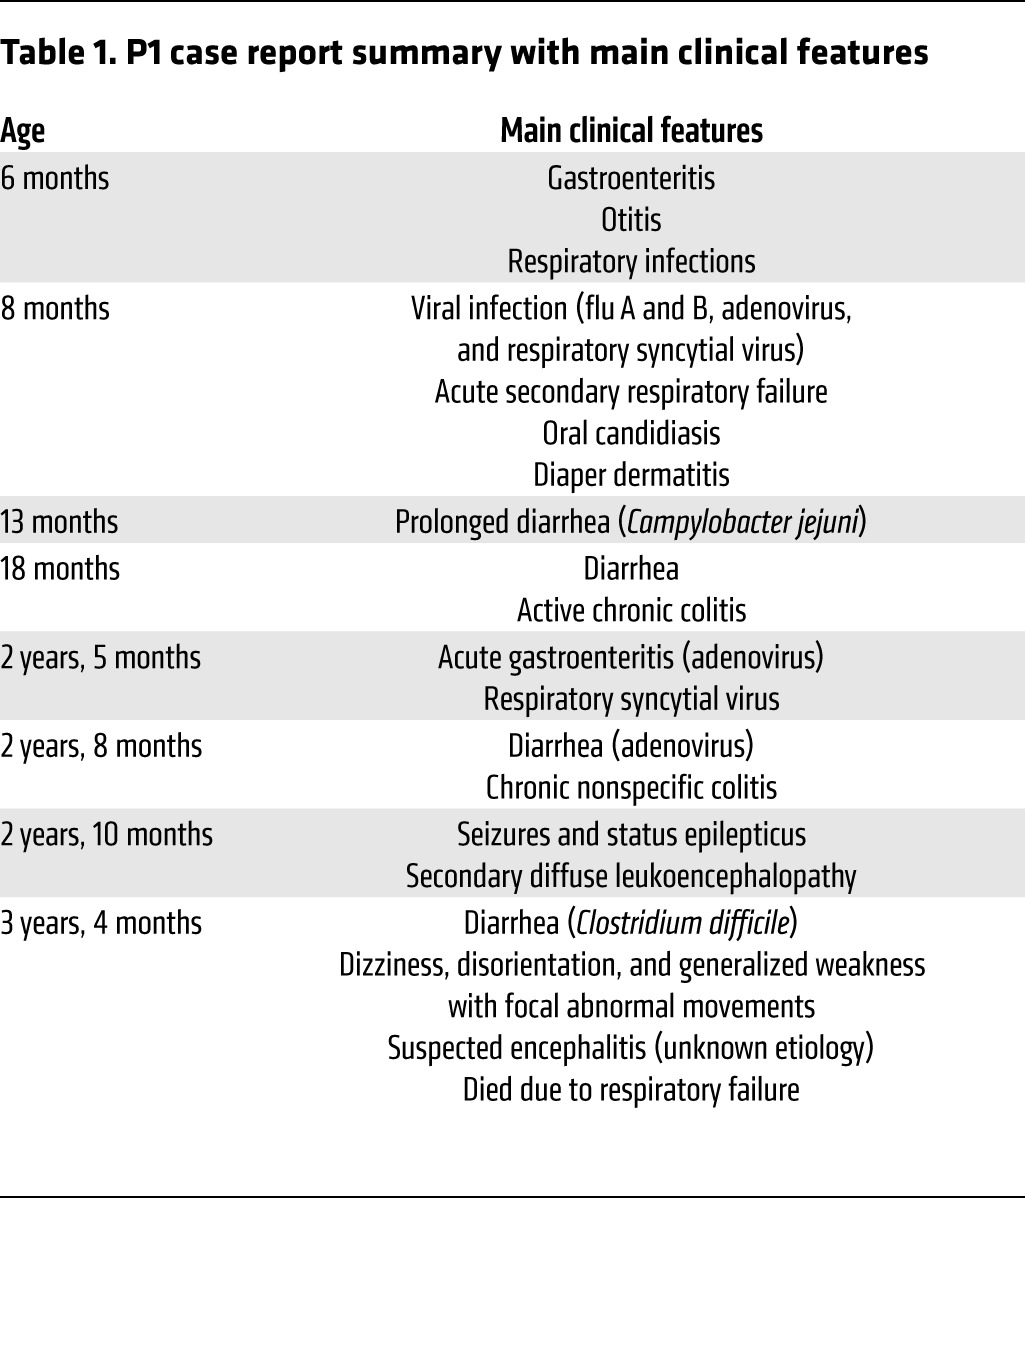
We investigated an Amerindian boy from Ecuador (patient 1; P1) born to consanguineous parents (Figure 1A). This child was initially thought to have a potential defect in class switch recombination, but known genetic etiologies of hyper-IgM syndrome were excluded. P1 was subsequently diagnosed with probable genetically undefined CID (Table 1 and Supplemental Note 1; supplemental material available online with this article; doi:10.1172/JCI77493DS1). Whole-exome sequencing (WES) was performed on genomic DNA extracted from whole blood from P1 and both parents by the New York Genome Center, using an Illumina HiSeq 2500 machine and an Agilent 71Mb SureSelect exome kit. The reads were aligned with the human reference genome using a BWA aligner (14), then recalibrated and annotated with GATK (15), PICARD (http://picard.sourceforge.net/), and ANNOVAR (16). The variants were then filtered and investigated with our in-house online server. Given the consanguinity of the family, we suspected a defect with autosomal-recessive inheritance. The first filter, therefore, selected mutations present in a heterozygous state in the parents and a homozygous state in P1, identifying an initial group of 1,171 variants. We then focused on the variants with >5 reads, high-quality mapping and sequencing, and <1% frequency in the 1000 Genomes and NHLBI exome variant server (EVS) and excluded the synonymous variations. This resulted in a final set of 33 variants of 28 different genes. BCL10, HLA-DQA1, and HLA-DQB1 were the only genes from this set known to be related to the immune system. We focused on the mutation of BCL10, on chromosome 1, because this mutation altered an essential splicing sequence, and a defect of this gene was entirely consistent with the clinical phenotype of P1. In addition, the other 2 genes are known to be highly polymorphic, and the mutations of these genes were predicted to be benign by Polyphen-2 (http://genetics.bwh.harvard.edu/pph2/), which predicts the effect of an amino acid substitution on the structure and function of human proteins. BCL10 ranked very highly in the human gene connectomes of MALT1, CARD11, and CARD9 (17). A homozygous splice site mutation (G/A) was found, affecting the first G residue of intron 1 of BCL10, in genomic DNA extracted from leukocytes. This mutation occurred at nucleotide position 85741978 (g.85741978C>T), the invariant first nucleotide of intron 1, involved in the donor site for splicing. The parents were heterozygous for this mutation (Supplemental Figure 1A). This variant was validated by Sanger sequencing of genomic DNA from peripheral leukocytes and human T lymphotropic virus-1–transformed T cells (referred to herein as HTLV-1 T cells) (Figure 1B). No other mutations were found in the coding region of BCL10. These data suggested that a homozygous germline splice site mutation (g.85741978C>T; IVS1+1G>A) of BCL10 may be responsible for the novel autosomal-recessive form of CID in P1.
Figure 1. Homozygous BCL10 mutation in P1.

(A) Family pedigree, with allele segregation. P1 (black) was homozygous for the mutation. (B) Sequence of the PCR products of genomic DNA from the leukocytes of a control (C) and the father (F) and mother (M) of P1. The mutation g.85741978C>T, homozygous in P1 and heterozygous in the father and mother, is outlined in red.
Table 1.
P1 case report summary with main clinical features
Lack of BCL10 in cells from P1.
We then assessed mRNA and protein levels of BCL10 in cells from P1. RT-PCR detected no full-length BCL10 mRNA in T cell blasts obtained by phytohemagglutinin (PHA) treatment or in HTLV-1 T cells of P1 (Figure 2A). In both cell types, a weak signal was obtained for 2 mRNA products of higher MW (Figure 2A and Supplemental Figure 1B). These 2 products were cloned and sequenced (Supplemental Figure 1, B and C). They corresponded to alternative splicing products generated through the use of 2 alternative donor sites (Supplemental Figure 1C). Neither of these products could encode a protein with the correct WT sequence. Instead, both the alternatively spliced forms theoretically encoded a small protein with a different amino acid sequence (Supplemental Figure 1D). No BCL10 protein was detected on Western blots of PHA-treated T cell blasts, peripheral blood mononuclear cells (PBMCs), monocyte-derived DCs (MDDCs), HTLV-1 T cells, and primary fibroblasts from P1 (Figure 2B, Supplemental Figure 2, and see below). Thus, the BCL10 mutation of P1 resulted in an absence of WT BCL10 protein and mRNA in the various cell types analyzed. Therefore, P1 has autosomal-recessive complete BCL10 deficiency.
Figure 2. BCL10 levels in P1.

(A) BCL10 mRNA levels in T cell blasts and HTLV-1 T cells from P1 and a control. GAPDH was used as the internal control. The panels illustrate results from a single experiment, representative of 3. (B) Immunoblot analysis of BCL10 protein in T cell blasts, PBMCs, and MDDCs from P1, a control, and the father and mother of P1. GAPDH was used as a loading control. The GAPDH immunoblot for the T cell blasts panel was performed with parallel samples run on a separate gel. The MDCC control shown is representative of the 3 controls analyzed. Shown are results from a single representative experiment of 3 performed.
Effect of human BCL10 deficiency on myeloid cells.
BCL10 has been implicated in various immune pathways involving both the innate and the adaptive immune systems. BCL10 forms heterotrimers with different CARD proteins in different cell types. In myeloid cells, the CARD9-BCL10-MALT1 complex is involved in NF-κB signaling (12). We first analyzed the role of BCL10 in myeloid cells. BCL10 has been implicated in the response to bacterial and fungal infections. Previous studies have shown that the TLR4, TLR2/6, and Dectin-1 pathways are BCL10 dependent in mouse myeloid cells (18–21). We investigated these pathways in cells from P1 by analyzing cytokine production after stimulation of TLR1/2, TLR4, TLR2/6, and Dectin-1 with Pam3CSK4, LPS, zymosan, and curdlan, respectively, in monocyte-derived macrophages (MDMs) and MDDCs. Because cytokine production varies between subjects, we therefore analyzed the raw data and carried out statistical analysis for up to 10 healthy donors. Analysis of the raw data indicated that P1 produced amounts of inflammatory cytokines similar to those of controls in response to stimulation, with cytokine production levels within the range observed for the controls (Figure 3, A, D, G, J, and Supplemental Figure 3). Box-plot transformation showed that the distribution of cytokine levels for P1 was not different from that for healthy donors (Figure 3, B, E, H, and K). Moreover, using a generalized estimating equation (GEE) model, we estimated mean cytokine production levels and confidence intervals for each stimulus (Figure 3, C, F, I, and L). The confidence interval obtained was larger for stimuli inducing production of large amounts of cytokines. MDMs produced larger amounts of cytokines after stimulation than in the absence of stimulation (medium), whereas MDDCs displayed a smaller difference in cytokine production between stimulation and nonstimulation conditions. Thus, we found no significant differences between healthy donors and P1, and absolute levels of cytokine production (particularly for MDMs) showed that the response of P1 to the stimuli tested was normal. We concluded that human myeloid cells lacking BCL10 display no impairment of cytokine production in response to TLR1/2, TLR4, TLR2/6, and Dectin-1 stimulation. Moreover, BCL10 did not seem to be required for myeloid responses to bacterial and fungal components, possibly due to other molecules compensating for its absence.
Figure 3. Production of cytokines by myeloid cells.

Production of IL-6 (A–C and G–I) and IL-8 (D–F and J–L) in response to stimulation with Pam3CSK4, LPS, zymosan, and curdlan, as assessed by CBA, in (A–F) MDMs and (G–L) MDDCs. (A, D, G, and J) Raw data from 3 independent experiments. (B, E, H, and K) Box plots for each subject, displaying median, mean, and variability of transformed cytokine production, without taking stimulation into account. ICC was calculated for the transformed data with λ = 0.25 (B; ICC 0.0494, i.e., 4.94% of total variability due to differences between subjects), λ = 0.5 (E; ICC 0.2170), λ = 0.25 (H; ICC 0.3068), and λ = 0 (K; ICC 0.4229). (C, F, I, and L) Estimated cytokine production in response to stimulation; data represent mean and 95% confidence interval. 2-tailed tests were used, and P values less than 0.05 were considered statistically significant. C1–C10 are positive controls.
Effect of human BCL10 deficiency on fibroblasts.
In fibroblasts, a heterotrimer consisting of CARD10 (also known as CARMA3), BCL10, and MALT1 forms. Many studies have on epithelial cells (such as human colonic epithelial cells) in which BCL10 was silenced, and in intestinal cells from Bcl10–/– mice, have demonstrated that the TLR4 response is BCL10 dependent (22–26). We therefore analyzed the effect of BCL10 deficiency in primary fibroblasts from P1, which we compared with cells from healthy donors, by measuring the production of IL-6 and IL-8 in response to TLR4, TLR2/6, Dectin-1, and TLR3 stimulation (Figure 4A). As expected, TLR3 signaling was BCL10 independent, but the TLR4, TLR2/6, and Dectin-1 signaling pathways were abolished in P1 cells. Similar abolition of these pathways was observed with both LPS and synthetic monophosphoryl lipid A (MPLA), a TLR4-specific agonist (Supplemental Figure 4). We investigated the involvement of NF-κB signaling in this process by measuring accumulation of the NF-κB p65 subunit in the nucleus in response to treatment with LPS, zymosan, and polyinosinepolycytidylic acid [poly(I:C)]. The response to these stimuli was impaired in cells from P1 (Figure 4B). TLR3 stimulation led to the production of IL-6 and IL-8 cytokines, but this process was NF-κB independent in P1 cells, because the NF-κB p65 subunit was not detected in the nucleus after TLR3 stimulation. Transfection of primary fibroblasts from P1 with a WT BCL10 construct rescued BCL10 expression, whereas no expression was detected after transfection with the empty vector (Figure 4C). Transfection with various amounts of the WT BCL10 construct activated the constitutive production of IL-6 and IL-8 and led to accumulation of the NF-κB p65 subunit in the nucleus (Figure 4D and Supplemental Figure 5). Our results are consistent with prior observations for MALT lymphomas, in which a chromosomal translocation generates BCL10 overproduction and constitutive NF-κB activation (27–29). Thus, TLR4, TLR2/6, and Dectin-1 responses were found to depend on BCL10 in human fibroblasts.
Figure 4. Effect of human BCL10 deficiency on fibroblast immunity.

Complementation studies in fibroblasts. (A) Production of IL-6 and IL-8, as assessed by CBA, in primary fibroblasts after stimulation with LPS, zymosan, curdlan, and poly(I:C). C1–C3 are positive controls. The values shown (mean ± SEM) were calculated from 3 independent experiments. (B) NF-κB ELISA of nuclear extracts from fibroblasts from C1, C2, and P1 after stimulation with LPS, zymosan, and poly(I:C) for 60 minutes. The values shown (mean ± SEM) were calculated from 3 independent experiments. (C) Immunoblot analysis of BCL10 in primary fibroblasts from a control, primary fibroblasts from P1, cells from P1 transfected with mock vector (P1-Mock), and cells from P1 transfected with the WT BCL10 plasmid (P1-WT). GAPDH was used as a loading control. The control shown is representative of the 3 controls analyzed. Shown are results from a single representative experiment of 3 performed. (D) Production of IL-6 (note logarithmic scale) and IL-8, as assessed by CBA, in primary fibroblasts after stimulation with LPS, zymosan, curdlan, and poly(I:C). P1 denotes cells from the patient subjected to the same transfection treatment, but without the plasmid, acting as a control for the state of the cells. The values shown (mean ± SEM) were calculated from 3 independent experiments.
Effect of BCL10 deficiency on the adaptive immune response.
BCL10 also plays a role in adaptive immune cells, in which it forms the CARD11-BCL10-MALT1 heterotrimer. Mouse BCL10 has been implicated in NF-κB activation in response to BCR and TCR stimulation (11, 30–34). Thus, we next analyzed adaptive immune responses in P1. A detailed flow cytometry study of different T and B cell subpopulations revealed a profound deficit of memory T and B cells (Table 2 and Supplemental Figure 6). The number of CD4+ central memory T cells and CD4+ regulatory T cells was much less in P1 than in age-matched healthy controls (Table 2). Overall, 97.1% of the B cells present were naive (Table 2), consistent with the profound hypogammaglobulinemia observed in P1 (Supplemental Figure 7). We next activated PBMCs and assessed T cell proliferation by CFSE incorporation. The T cells of P1 responded to PHA, concanavalin A (ConA), and lectin from Phytolacca americana (pokeweed) (PWM), but not to anti-CD3/CD28 antibody (Figure 5 and Supplemental Figure 8). The T cell response was normal in the patient’s heterozygous parents. Finally, we analyzed the upregulation of CD40L, CD69, inducible T cell costimulator (ICOS), and CD25 in CD4+ T cells after CD3/CD28 stimulation (Supplemental Figure 9). Compared with healthy controls, P1 CD40L percentages were within the normal range, CD69 and CD25 percentages were slightly lower than normal, and ICOS levels were lower. These findings indicate that BCL10 deficiency affects the final maturation of T and B cells into memory cells, but not the development of naive T and B cells. T cell proliferation was also found to be blocked after TCR stimulation in vitro. These results were consistent with those of studies performed in Bcl10–/– mice.
Table 2.
Distribution of lymphocyte subpopulations in the peripheral blood
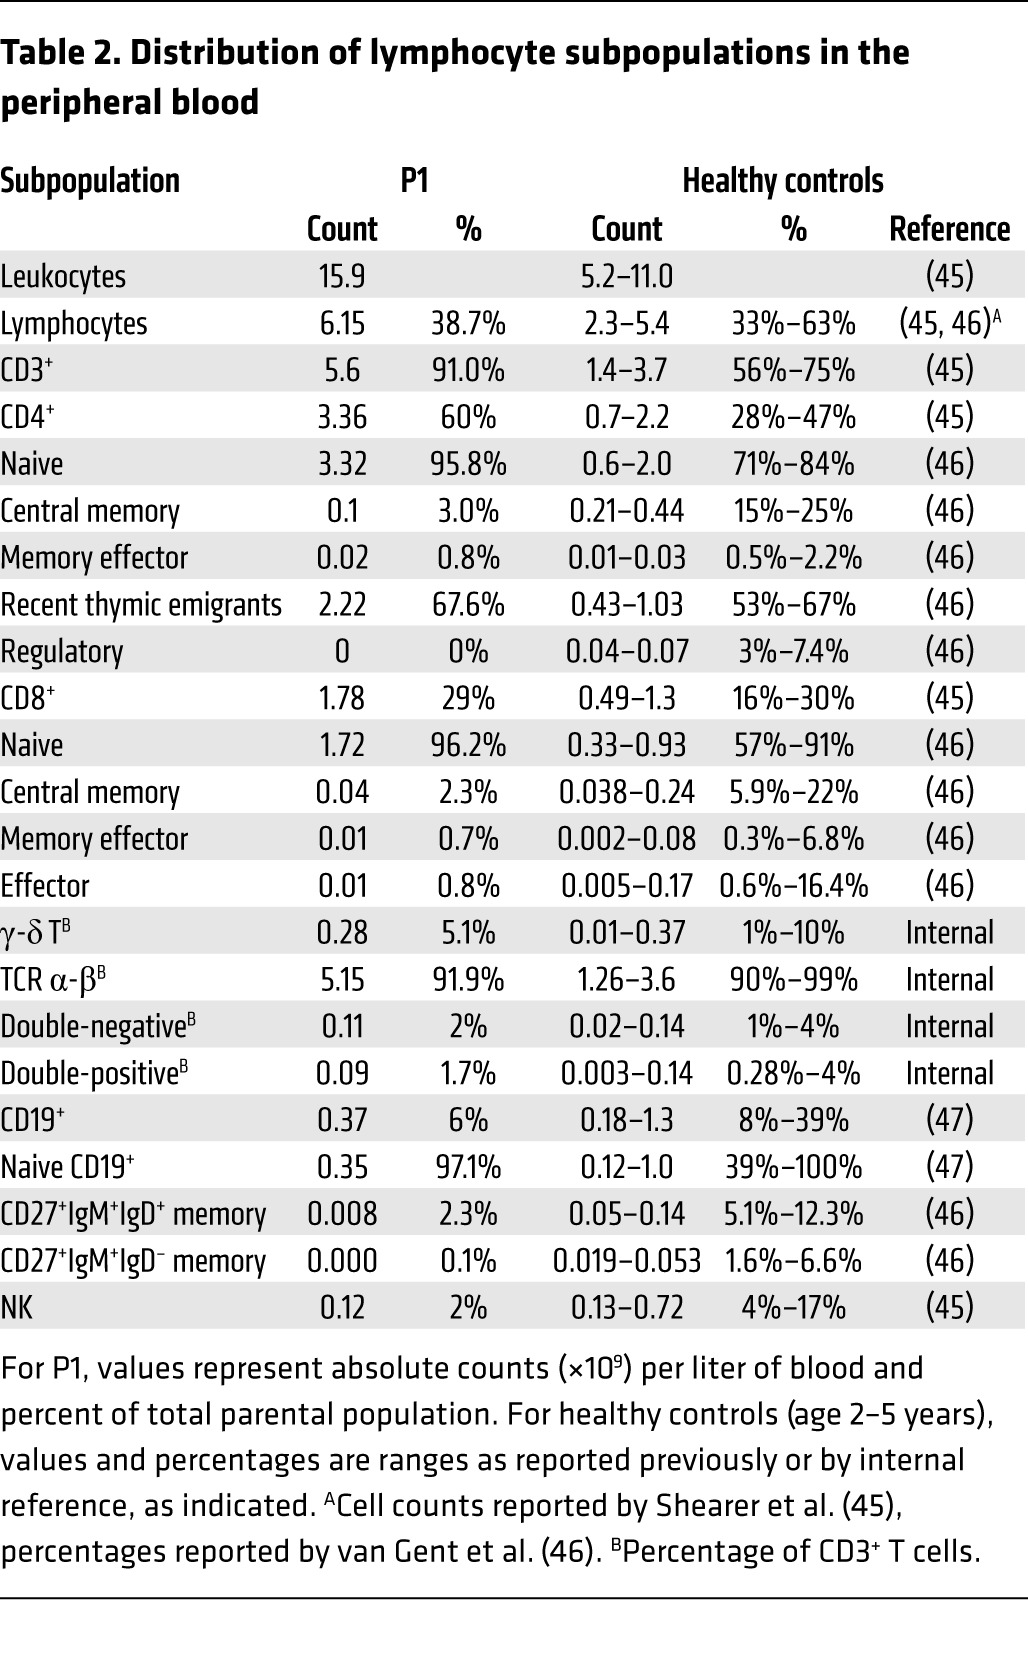
Figure 5. Lymphocyte subpopulations and the proliferative response of T cells.

(A) PBMCs (250,000 cells) were labeled with CFSE and cultured in the presence of PHA or human T activator CD3/CD28 (CD3-CD28) for 6 days. They were then harvested, stained, and analyzed by FACSCanto. Red line, T cell proliferation obtained in the different conditions (determined by CFSE fluorescence dilution); black line, CFSE fluorescence in unstimulated PBMCs. Histograms show populations gated by FCS vs. SSC, singlets, and the CD3+ population. Shown are representative results of 2 independent experiments. (B and C) Percentage of cells that had divided (B) and proliferation index (calculated as the total number of divisions divided by the number of cells that went into division) (C) in the CFSE proliferation assay for the indicated T cell populations (CD3+, CD3+CD4+, and CD3+CD8+), gated after selection by FCS vs. SSC, and singlets. NS, nonstimulation condition. The values shown (mean ± SEM) were calculated from 2 independent experiments.
Discussion
We have identified a patient with autosomal-recessive, complete BCL10 deficiency, which can be considered to be a CID. The patient’s sister, who died from infection at the age of 6 months, probably suffered from the same defect. This present study illustrates the interest of genetic studies in single patients (35). In previous studies on myeloid cells comparing human and mouse BCL10 defects through the silencing of BCL10 (Table 3), human DCs were found to require BCL10 for the production of IL-1β and IL-6 in response to Dectin-1 stimulation, and mouse macrophages were found to be dependent on BCL10 for TLR4 responses (19, 20). Furthermore, mouse Bcl10–/– DCs respond poorly to zymosan in terms of TNF-α and IL-10 production (18). Other studies on mouse macrophages have shown that the Dectin-1 pathway activates NF-κB via SYK-CARD9-BCL10 (21). At odds with these findings, we found here that human myeloid cells were not affected by BCL10 deficiency in terms of TLR1/2, TLR4, TLR2/6, and Dectin-1 signaling (Table 3 and Figure 6). These observed differences between mice and humans could be due to the inbred mouse strains used, and human variability could reflect individual genetic and epigenetic factors. Moreover, this result was consistent with the clinical phenotype of P1, who displayed no impairment of defenses against fungal infection (Supplemental Note 1 and Table 1), unlike patients with inherited CARD9 deficiency (7, 9). IL-8 production has been analyzed in epithelial cells. In both human colonic epithelial cells with a silenced BCL10 gene and the intestinal tissue of Bcl10–/– mice, it has been shown that the TLR4 response is BCL10 dependent. However, other studies have shown that TLR4 signaling may follow both BCL10-dependent and -independent pathways (22–26). Although we did not test epithelial cells from P1, the results we obtained for fibroblasts were consistent with those of previous studies on epithelial cells (36), which indicates that the TLR4 response is BCL10 dependent and IKKB dependent in human fibroblasts. We showed here that the TLR4, TLR2/6, and Dectin-1 signaling pathways were BCL10 dependent in this cell type (Table 3 and Figure 6). Prior studies of adaptive immunity in Bcl10–/– mice have shown that the early development of B cells in the bone marrow is normal in these mice, but that they have reduced levels of mature B cells in the peripheral blood (34). Our findings for human BCL10 deficiency showed that 97.1% of the B cell population consisted of naive cells. In Bcl10–/– mice, double-positive thymocytes differentiate to give normal total numbers of total CD4+ and CD8+ cells, expressing TCR α-β/CD3 complexes in normal amounts (33). This was consistent with our findings for human BCL10 deficiency, as P1 had a normal total number of T cells despite the absence of memory T cells. In line with the findings for Bcl10–/– mice (11, 30–32), we also observed an impairment of T cell proliferation after TCR stimulation (Table 3 and Figure 6). Finally, regulatory T cells have been reported to be important for the maintenance of intestinal self tolerance, and these cells have been implicated in chronic inflammatory diseases, such as inflammatory bowel disease (37). The absence of regulatory T cells may have contributed to the inflammatory chronic colitis observed in P1.
Table 3.
Comparison of human and mouse BCL10 deficiencies
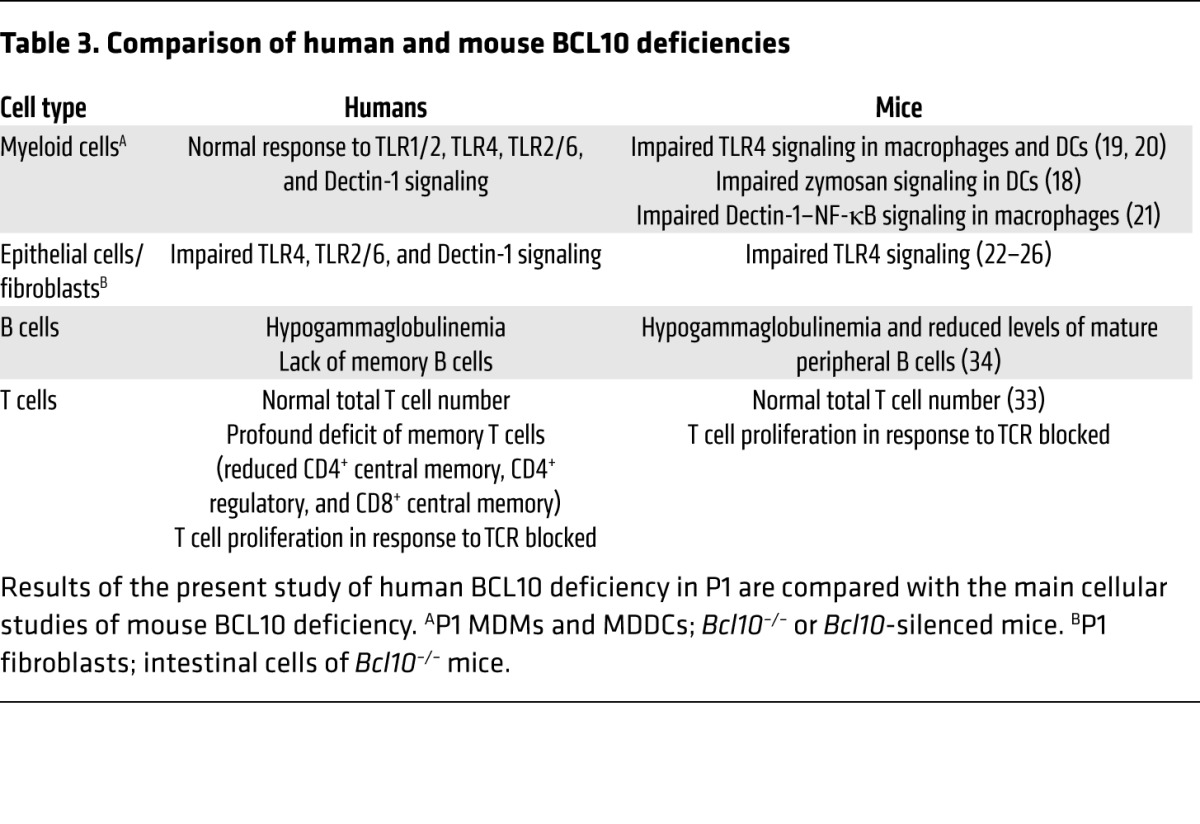
Figure 6. Summary of BCL10-dependent and -independent NF-κB–mediated signaling pathways in the various cell types from P1.

See Discussion for details.
Mutations of human genes encoding partner proteins of BCL10, such as MALT1 (6), CARD11 (8, 10), and CARD9 (7, 9), have also recently been described. Interestingly, the clinical and immunological phenotypes of patients with these mutations differ from those of P1 with BCL10 deficiency. Human MALT1 deficiency has been described in 2 patients with CID. These patients had impaired T cell proliferation and NF-κB signaling, yet surprisingly, unlike P1, they had normal numbers of CD4+ memory T cells for their age (6). CARD11 deficiency has been described in 2 patients with SCID. Like P1, the affected patients had T and B cells predominantly of the naive phenotype, and there was a profound defect of T cell function, with an impairment of ICOS expression and agammaglobulinemia (8, 10). CARD9 deficiency differs from the condition presented by P1, because it compromises host defense against a few fungi, but with no detectable T or B cell phenotype (7, 9). Finally, BCL10 overproduction has been implicated in MALT lymphoma (28, 38, 39), and several studies investigating possible treatments have attempted to inhibit expression of the CBM complex (40). We found that lymphocytes and fibroblasts were dependent on BCL10, whereas myeloid cells were not. This finding is highly pertinent and must be taken into account when considering treatment options for MALT lymphoma, because BCL10 inhibition may have consequences for lymphocytes and nonhematopoietic cells.
Methods
Human molecular genetics and WES.
Genomic DNA was extracted from whole blood and HTLV-1 T cells with a kit (Qiagen GmbH) according to the manufacturer’s instructions.
Exome sequencing was performed by the New York Genome Center on genomic DNA from whole blood using an Illumina HiSeq 2500 machine and an Agilent 71Mb SureSelect exome kit. The reads were aligned with the human reference genome using a BWA aligner (14), then recalibrated and annotated with GATK (15), PICARD (http://picard.sourceforge.net/), and ANNOVAR (16). The variants were then filtered and investigated using our in-house online server (41, 42). Data were deposited in ArrayExpress (accession no. E-MTAB-2962).
The results of exome sequencing were validated by PCR/sequencing analysis on genomic DNA from whole blood and HTLV-1 T cells. PCR was carried out with PCR Master Mix (Promega) and the GeneAmp 9700 PCR System (Applied Biosystems). The primer sequences used for the genomic coding region of BCL10 were as follows: forward 1, TCCTCTCCTTCTTCCCCATT; forward 2, GCCTGAGCCTCCTGACTTTA; forward 3, GATTTGAAATAGATTATGACGGAAA; reverse 1, AGCTCTGCGTTTAGCGATGT; reverse 2, GGCTGGTCTCAAAACTCCTG; reverse 3, AAACAAATGATTACAGCCATTTTA. The PCR products were purified with the QIAquick gel extraction kit (Qiagen) and sequenced with the BigDye Terminator Cycle Sequencing Kit (Applied Biosystems). Sequencing products were purified by precipitation in 70% ethanol, and sequences were analyzed with an ABI Prism 3700 apparatus (Applied Biosystems).
Cell purification and culture.
Human PBMCs were isolated by Ficoll-Hypaque density gradient centrifugation (Amersham-Pharmacia-Biotech) from whole-blood samples obtained from P1, his relatives, or healthy volunteers.
T cell blasts were obtained by culturing PBMCs for 8 days at a density of 1 × 10⁶ cells/ml in RPMI 1640 (Invitrogen) supplemented with 10% fetal calf serum (FCS) (Invitrogen), 0.4% v/v phytohemagglutinin (PHA) (Invitrogen), and 100 U/ml recombinant IL-2 (Adesleukine, Novartis).
Primary human fibroblasts were obtained from biopsy specimens from P1 or healthy controls and were cultured in DMEM (Invitrogen) supplemented with 10% FCS. For cytokine production experiments, primary fibroblasts were activated in 24-well plates at a density of 2 × 10⁵ cells/ml for 24 hours. For fluorescence experiments, primary fibroblasts were activated at a density of 75,000 cells/ml in glass tissue culture slides (BD Falcon).
HTLV-1 T cell lines were obtained from patients and normal donors as previously described (43). HTLV-1 T cells were cultured in RPMI medium supplemented with 10% FCS and 100 U/ml recombinant IL-2.
For differentiation and culture of MDDCs, PBMCs freshly isolated by Ficoll-Hypaque density gradient centrifugation from healthy controls and patients were incubated in RPMI 1640 supplemented with 10% FCS in cell culture flasks for 1 hour at 37°C under an atmosphere containing 5% CO2. The adherent cells (monocytes) were cultured for 8 days in RPMI 1640 supplemented with 10% FCS in the presence of GM-CSF (50 ng/ml; R&D Systems) and IL-4 (10 ng/ml; R&D Systems). The differentiation and purity of these cells were confirmed by staining with PE-conjugated anti-CD1a (BD Biosciences), FITC-conjugated anti-CD14 (BD), or PE- or FITC-conjugated anti-mouse IgG1 isotype control (BD) antibodies. Stained cells were analyzed by flow cytometry (FACSCanto; BD). For stimulation, cells were plated at a density of 0.25 × 10⁵ cells/ml in 48-well tissue culture plates and cultured in the presence of GM-CSF and IL-4; MDDCs were stimulated for 24 hours.
For differentiation and culture of MDMs, PBMCs freshly isolated by Ficoll-Hypaque density gradient centrifugation from healthy controls and patients were incubated in RPMI 1640 supplemented with 10% FCS in cell culture flasks for 1 hour at 37°C under an atmosphere containing 5% CO2. The adherent cells (monocytes) were cultured for 10 days in RPMI 1640 supplemented with 10% FCS, in the presence of Rh-M-CSF (10 mg/ml; R&D Systems). For stimulation, cells were plated at a density of 0.25 × 10⁵ cells/ml in 96-well tissue culture plates and stimulated for 24 hours.
All cells were grown at 37°C in an atmosphere containing 5% CO2.
Flow cytometry study of lymphocyte subpopulations.
T and B cell subpopulations were evaluated with whole-blood samples collected into EDTA, by staining of cell surface markers and standard flow cytometry methods. Briefly, for T cell subpopulations, samples were incubated with FITC-conjugated anti-CD3 (BD), V450-conjugated anti-CD4 (BD), PerCP-conjugated anti-CD8 (BD), PE-conjugated anti-CD31 (BD), APC-conjugated anti-CD27 (BD), and PE-Cy7–conjugated anti-CD45Ro (BD) antibodies for 20 minutes. Cells were then lysed in FACS Lysing solution and washed with FACS Flow buffer according to the manufacturer’s instructions. For B cells, samples were stained and subjected to the flow cytometry–based assay described in the EUROclass trial (44), using a mixture of the following antibodies at optimal concentrations: FITC-conjugated anti-CD27 (BD), FITC-conjugated anti-CD38 (BD), PE-conjugated anti-CD21 (BD), PerCP5.5-conjugated anti-CD19 (BD), PE-conjugated anti-IgD (Southern Biotech), PerCP5.5-conjugated anti-IgM (Southern Biotech). Data analysis was performed with Infinicyt (version 1.7; Cytognos). Initial gating involved the use of a forward scatter area (FSC-A) versus height (FSC-H) plot to remove doublets. Events were then gated on a lymphocyte gate with FSC-A versus side scatter (SSC-A). Events were further gated on CD3+, CD4+, and CD8+ T cells and CD19+. The CD4+ and CD8+ cells identified were separated into naive (CD27+CD45RO–), central memory (CD27+CD45RO+), memory effector (CD27–CD45RO+), and effector (CD27–CD45RO–) T cells. Naive T cells were identified on the basis of CD31 expression, which is associated with recent thymic emigrants. The B cell compartment was identified on the basis of surface Ig and CD27 expression and was separated into naive B cells (IgD+IgM+CD27–), non-class-switched memory B cells (IgD+IgM+CD27+), and class-switched memory B cells (IgD–IgM–CD27+).
Cloning of WT and mutant BCL10.
The full-length WT BCL10 cDNA and its 2 splice variants were amplified from cDNA generated from PHA T cell blasts from a healthy individual or P1. Regular PCR was performed with the following primers: forward, ATGGAGCCCACCGCACCGTCCCTCACCG; reverse, CATTGTCGTGAAACAGTACGTGATCTTAAGGG. The products were TA-cloned into a pcDNA3.1/V5-His plasmid (Invitrogen) according to the manufacturer’s protocol.
Determination of mRNA levels by RT-PCR.
RNA was extracted from HTLV-1 T cells and T cell blasts with a Simply RNA kit (Promega). RNA was reverse transcribed directly using Oligo-dT (Invitrogen). PCR was carried out with PCR Master Mix (Promega) and the GeneAmp 9700 PCR System (Applied Biosystems). The primer sequences used for the cDNA coding region of BCL10 were as follows: forward, ATGGAGCCCACCGCACCGTCCCTCACCG; reverse, CATTGTCGTGAAACAGTACGTGATCTTAAGGG. The PCR products were subjected to electrophoresis in an agarose gel, with GAPDH used as the internal control.
Immunoblots.
Total cell extracts were prepared from PBMCs, HTLV-1 T cells, PHA T cell blasts, MDDCs, and primary fibroblasts, either left untransfected or transfected by nucleofection with pcDNA3.1/V5-His TOPO-BCL10 or pcDNA3.1/V5-His TOPO. Equal amounts of protein from each sample were separated by SDS-PAGE and blotted onto iBlot Gel Transfer Stacks (Invitrogen). These nitrocellulose membranes were then probed with anti-BCL10 rabbit mAb (ab108328; Abcam), followed by a HRP-conjugated secondary anti-rabbit IgG antibody (Cell Signaling). Membranes were stripped and reprobed with anti-GAPDH antibody (Abcam) to control for protein loading. Antibody binding was detected by ECL (Amersham-Pharmacia-Biotech).
Stimulations.
We assessed cytokine production following stimulation with Pam3CSK4 (TLR1/2 agonist; 1 μg/ml; Invivogen), poly(I:C) (TLR3 agonist; 25 μg/ml; Invivogen), E. coli K12 LPS (TLR4 agonist; 10 ng/ml; Invivogen), zymosan (TLR2/6 and Dectin-1 agonist; 10 μg/ml; Sigma-Aldrich), curdlan (Dectin-1 agonist; 100 μg/ml; Invivogen), or MPLA Synthetic (10 ng/ml; Invivogen). Cell supernatants were recovered, and their cytokine concentrations were determined by cytometric bead array (CBA).
We measured the proliferative response of T cells by CFSE after stimulation with PHA (0.4% v/v; Invitrogen), human T activator CD3/CD28 (0.4 × 10⁶ beads/ml; Dynal, Invitrogen), ConA (0.4% v/v; GE Healthcare), or lectin from PWM (2 μg/ml; Sigma-Aldrich).
For measurement of NF-κB activation, fibroblasts were stimulated for 1 hour with the aforementioned concentrations of LPS, zymosan, and poly(I:C) at a concentration of 0.2 × 10⁶ cells/ml in DMEM containing 2% FCS.
Cytokine determinations and signal transduction studies.
Production of IL-6, IL-8, IL-10, IL-1β, and TNF-α was assessed with the CBA-human inflammatory cytokine kit (BD) according to the manufacturer’s instructions. Analysis was performed with FCAP Array software (BD).
Cell nuclear extracts were prepared from primary fibroblasts with or without stimulation for 1 hour. NF-κB ELISA (Active Motif) was carried out according to the manufacturer’s instructions.
Transient transfections.
Primary fibroblasts were transfected with a nucleofection device (Lonza) and an Amaxa cell line nucleofector kit V (Lonza), according to the manufacturer’s instructions. The U-023 program was used for fibroblast transfection (106 cells per 2.5 μg [mock vector] or 5 μg [WT BCL10] plasmid).
CFSE proliferation assay for T cells.
PBMCs (106 cells/ml) were incubated for 5 minutes with CFSE at a concentration of 2 μM, then washed twice with RPMI. Cells were cultured for 6 days at a density of 106 cells/ml in 10% FCS in RPMI, in 96-well tissue culture plates at 37°C under an atmosphere containing 5% CO2. Cells were left unstimulated or were stimulated with the aforementioned concentrations of PHA, human T activator CD3/CD28, ConA, or PWM. Cells were harvested after 6 days and labeled with APC-conjugated anti-CD3 (BD), PE-conjugated anti-CD4 (BD), PerCP-conjugated anti-CD8 (BD), and irrelevant APC-, PE-, or PerCP-conjugated anti-IgG (BD) antibodies, or without fluorochromes, for measurement of cell autofluorescence. After incubation for 15 minutes, cells were washed with PBS and resuspended in 0.5% paraformaldehyde in PBS for acquisition in a FACSCanto machine. For cells stimulated with human T activator CD3/CD28, a magnet was used to remove the beads before acquisition. On day 0, the CFSE signal was measured by flow cytometry for setting adjustment. Data were analyzed with FlowJo (Tree Star Inc.).
Surface markers of CD4+ T cells after human T activator CD3/CD28 stimulation.
PBMCs from P1 and healthy donors were isolated by Ficoll gradient centrifugation. Monocytes were isolated on the basis of their adhesion to culture plates. The nonadherent cells were removed and washed, and 1 × 10⁶ cells/ml were stimulated by incubation with human T activator CD3/CD28 for 20 hours at 37°C. The activated T cells were then washed and stained for flow cytometry with the following antibodies: PE-conjugated anti-CD40L (BD Biosciences), PE-conjugated anti-CD69 (BD Biosciences), PE-conjugated anti-ICOS (BD Biosciences), and APC-conjugated anti-CD25 (BD Biosciences). Analysis was carried out with gating for CD4+ T cells, and the percentage of T cells stimulated relative to the unstimulated control was calculated.
Statistics.
All statistical analysis were 2-tailed, and P values less than 0.05 were considered significant. Data were analyzed with SAS 9.3 (SAS Institute Inc.) and R (http://www.R-project.org) software.
A Box-Cox transformation was performed to correct the bias in the error distribution for cytokine production. This transformation was achieved by applying a uniform random noise in cases of nonproduction using the jitter function of the R base package.
The variation of the transformed production between and within subjects was analyzed with an unconditional mix model. We also calculated the intraclass correlation coefficient (ICC) to obtain the percentage of the total variability explained by the variation between samples for each cytokine.
Due to the nature of the data and the use of repetitive measures, we estimated mean production in response to stimulation for each cytokine by the least squares method, using a GEE model, with the definition, in each case, of the working correlation matrix, with the Link function “log” and a negative binomial marginal distribution (“GENMOD” procedure of SAS). We calculated mean production for comparisons between stimuli by the least squares method, and Bonferroni adjustment was applied for multiple comparisons.
Study approval.
The experimental protocol was approved by the ethics committee of La Paz University Hospital, and written informed consent was obtained from the family for participation in this study.
Supplementary Material
Acknowledgments
We thank the members of the Immunology Unit at La Paz University Hospital, particularly Alberto López-Lera and Margarita López-Trascasa; the members of the Laboratory of Human Genetics of Infectious Diseases; Fe Garcia (Area de Citogenética, INGEMM-IdiPaz); and Susana Alemany for helpful advice. We thank the patient and his family for their participation in this study, which was supported by the St. Giles Foundation, the Rockefeller University, and grant no. 8 UL1 TR000043 from the National Center for Research Resources and the National Center for Advancing Sciences (NCATS), NIH. R. Martinez-Barricarte is supported by an EMBO long-term fellowship. Y. Itan was supported by the AXA Research Fund. M.S. Mazariegos was supported by Lair Foundation grant ref. 2012/0070, and A. Jiménez-Reinoso was supported by MINECO grant ref. SAF2011-24235. R. Pérez de Diego is supported by the “Ramon y Cajal” program (MINECO, Spain) and EMBO short-term fellowship ASTF no. 119-2013.
Footnotes
Conflict of interest: The authors have declared that no conflict of interest exists.
Reference information:J Clin Invest. 2014;124(12):5239–5248. doi:10.1172/JCI77493.
References
- 1.Al-Herz W, et al. Primary immunodeficiency diseases: an update on the classification from the International Union of Immunological Societies Expert Committee for Primary Immunodeficiency. Front Immunol. 2014;5:162. doi: 10.3389/fimmu.2014.00162. [DOI] [PMC free article] [PubMed] [Google Scholar]
- 2.Casanova JL, Abel L. Primary immunodeficiencies: a field in its infancy. Science. 2007;317(5838):617–619. doi: 10.1126/science.1142963. [DOI] [PubMed] [Google Scholar]
- 3.Casanova JL, Abel L. The genetic theory of infectious diseases: a brief history and selected illustrations. Annu Rev Genomics Hum Genet. 2013;14:215–243. doi: 10.1146/annurev-genom-091212-153448. [DOI] [PMC free article] [PubMed] [Google Scholar]
- 4.Buckley RH. Molecular defects in human severe combined immunodeficiency and approaches to immune reconstitution. Annu Rev Immunol. 2004;22:625–655. doi: 10.1146/annurev.immunol.22.012703.104614. [DOI] [PubMed] [Google Scholar]
- 5.Notarangelo LD. Functional T cell immunodeficiencies (with T cells present). Annu Rev Immunol. 2013;31:195–225. doi: 10.1146/annurev-immunol-032712-095927. [DOI] [PubMed] [Google Scholar]
- 6.Jabara HH, et al. A homozygous mucosa-associated lymphoid tissue 1 (MALT1) mutation in a family with combined immunodeficiency. J Allergy Clin Immunol. 2013;132(1):151–158. doi: 10.1016/j.jaci.2013.04.047. [DOI] [PMC free article] [PubMed] [Google Scholar]
- 7.Drewniak A, et al. Invasive fungal infection and impaired neutrophil killing in human CARD9 deficiency. Blood. 2013;121(13):2385–2392. doi: 10.1182/blood-2012-08-450551. [DOI] [PubMed] [Google Scholar]
- 8.Greil J, et al. Whole-exome sequencing links caspase recruitment domain 11 (CARD11) inactivation to severe combined immunodeficiency. J Allergy Clin Immunol. 2013;131(5):1376–1383. doi: 10.1016/j.jaci.2013.02.012. [DOI] [PubMed] [Google Scholar]
- 9.Lanternier F, et al. Deep dermatophytosis and inherited CARD9 deficiency. N Engl J Med. 2013;369(18):1704–1714. doi: 10.1056/NEJMoa1208487. [DOI] [PMC free article] [PubMed] [Google Scholar]
- 10.Stepensky P, et al. Deficiency of caspase recruitment domain family, member 11 (CARD11), causes profound combined immunodeficiency in human subjects. J Allergy Clin Immunol. 2013;131(2):477–485. doi: 10.1016/j.jaci.2012.11.050. [DOI] [PubMed] [Google Scholar]
- 11.Schulze-Luehrmann J, Ghosh S. Antigen-receptor signaling to nuclear factor kappa B. Immunity. 2006;25(5):701–715. doi: 10.1016/j.immuni.2006.10.010. [DOI] [PubMed] [Google Scholar]
- 12.Hara H, Saito T. CARD9 versus CARMA1 in innate and adaptive immunity. Trends Immunol. 2009;30(5):234–242. doi: 10.1016/j.it.2009.03.002. [DOI] [PubMed] [Google Scholar]
- 13.Thome M. Multifunctional roles for MALT1 in T-cell activation. Nat Rev Immunol. 2008;8(7):495–500. doi: 10.1038/nri2338. [DOI] [PubMed] [Google Scholar]
- 14.Li H, Durbin R. Fast and accurate short read alignment with Burrows-Wheeler transform. Bioinformatics. 2009;25(14):1754–1760. doi: 10.1093/bioinformatics/btp324. [DOI] [PMC free article] [PubMed] [Google Scholar]
- 15.McKenna A, et al. The Genome Analysis Toolkit: a MapReduce framework for analyzing next-generation DNA sequencing data. Genome Res. 2010;20(9):1297–1303. doi: 10.1101/gr.107524.110. [DOI] [PMC free article] [PubMed] [Google Scholar]
- 16.Wang K, Li M, Hakonarson H. ANNOVAR: functional annotation of genetic variants from high-throughput sequencing data. Nucleic Acids Res. 2010;38(16):e164. doi: 10.1093/nar/gkq603. [DOI] [PMC free article] [PubMed] [Google Scholar]
- 17.Itan Y, et al. The human gene connectome as a map of short cuts for morbid allele discovery. Proc Natl Acad Sci U S A. 2013;110(14):5558–5563. doi: 10.1073/pnas.1218167110. [DOI] [PMC free article] [PubMed] [Google Scholar]
- 18.Gross O, et al. Card9 controls a non-TLR signalling pathway for innate anti-fungal immunity. Nature. 2006;442(7103):651–656. doi: 10.1038/nature04926. [DOI] [PubMed] [Google Scholar]
- 19.Gringhuis SI, et al. Selective C-Rel activation via Malt1 controls anti-fungal T(H)-17 immunity by dectin-1 and dectin-2. PLoS Pathog. 2011;7(1):e1001259. doi: 10.1371/journal.ppat.1001259. [DOI] [PMC free article] [PubMed] [Google Scholar]
- 20.Liu Y, et al. BCL10 mediates lipopolysaccharide/toll-like receptor-4 signaling through interaction with Pellino2. J Biol Chem. 2004;279(36):37436–37444. doi: 10.1074/jbc.M400241200. [DOI] [PubMed] [Google Scholar]
- 21.Tada R, et al. Barley-derived beta-D-glucan induces immunostimulation via a dectin-1-mediated pathway. Immunol Lett. 2009;123(2):144–148. doi: 10.1016/j.imlet.2009.03.005. [DOI] [PubMed] [Google Scholar]
- 22.Bhattacharyya S, Borthakur A, Pant N, Dudeja PK, Tobacman JK. Bcl10 mediates LPS-induced activation of NF-kappaB and IL-8 in human intestinal epithelial cells. Am J Physiol Gastrointest Liver Physiol. 2007;293(2):G429–G437. doi: 10.1152/ajpgi.00149.2007. [DOI] [PubMed] [Google Scholar]
- 23.Bhattacharyya S, Dudeja PK, Tobacman JK. Lipopolysaccharide activates NF-κB by TLR4-Bcl10-dependent and independent pathways in colonic epithelial cells. Am J Physiol Gastrointest Liver Physiol. 2008;295(4):G784–G790. doi: 10.1152/ajpgi.90434.2008. [DOI] [PubMed] [Google Scholar]
- 24.Bhattacharyya S, et al. Toll-like receptor 4 mediates induction of the Bcl10-NFκB-interleukin-8 inflammatory pathway by carrageenan in human intestinal epithelial cells. J Biol Chem. 2008;283(16):10550–10558. doi: 10.1074/jbc.M708833200. [DOI] [PMC free article] [PubMed] [Google Scholar]
- 25.Bhattacharyya S, Xue L, Devkota S, Chang E, Morris S, Tobacman JK. Carrageenan-induced colonic inflammation is reduced in Bcl10 null mice and increased in IL-10-deficient mice. Mediators Inflamm. 2013;2013:397642. doi: 10.1155/2013/397642. [DOI] [PMC free article] [PubMed] [Google Scholar]
- 26.Borthakur A, Bhattacharyya S, Dudeja PK, Tobacman JK. Carrageenan induces interleukin-8 production through distinct Bcl10 pathway in normal human colonic epithelial cells. Am J Physiol Gastrointest Liver Physiol. 2007;292(3):G829–G838. doi: 10.1152/ajpgi.00380.2006. [DOI] [PubMed] [Google Scholar]
- 27.Rosebeck S, Rehman AO, Lucas PC, McAllister-Lucas LM. From MALT lymphoma to the CBM signalosome: three decades of discovery. Cell Cycle. 2011;10(15):2485–2496. doi: 10.4161/cc.10.15.16923. [DOI] [PMC free article] [PubMed] [Google Scholar]
- 28.Zhang Q, et al. Inactivating mutations and overexpression of BCL10, a caspase recruitment domain-containing gene, in MALT lymphoma with t(1;14)(p22;q32). Nat Genet. 1999;22(1):63–68. doi: 10.1038/8767. [DOI] [PubMed] [Google Scholar]
- 29.Lucas PC, et al. Bcl10 and MALT1, independent targets of chromosomal translocation in malt lymphoma, cooperate in a novel NF-kappa B signaling pathway. J Biol Chem. 2001;276(22):19012–19019. doi: 10.1074/jbc.M009984200. [DOI] [PubMed] [Google Scholar]
- 30.Thome M. CARMA1, BCL-10 and MALT1 in lymphocyte development and activation. Nat Rev Immunol. 2004;4(5):348–359. doi: 10.1038/nri1352. [DOI] [PubMed] [Google Scholar]
- 31.Blonska M, Lin X. NF-kappaB signaling pathways regulated by CARMA family of scaffold proteins. Cell Res. 2011;21(1):55–70. doi: 10.1038/cr.2010.182. [DOI] [PMC free article] [PubMed] [Google Scholar]
- 32.Thome M, Charton JE, Pelzer C, Hailfinger S. Antigen receptor signaling to NF-kappaB via CARMA1, BCL10, and MALT1. Cold Spring Harb Perspect Biol. 2010;2(9):a003004. doi: 10.1101/cshperspect.a003004. [DOI] [PMC free article] [PubMed] [Google Scholar]
- 33.Ruland J, et al. Bcl10 is a positive regulator of antigen receptor-induced activation of NF-kappaB and neural tube closure. Cell. 2001;104(1):33–42. doi: 10.1016/S0092-8674(01)00189-1. [DOI] [PubMed] [Google Scholar]
- 34.Xue L, et al. Defective development and function of Bcl10-deficient follicular, marginal zone and B1 B cells. Nat Immunol. 2003;4(9):857–865. doi: 10.1038/ni963. [DOI] [PubMed] [Google Scholar]
- 35.Casanova JL, Conley ME, Seligman SJ, Abel L, Notarangelo LD. Guidelines for genetic studies in single patients: lessons from primary immunodeficiencies. J Exp Med. 2014 doi: 10.1084/jem.20140520. in press. [DOI] [PMC free article] [PubMed] [Google Scholar]
- 36.Pannicke U, et al. Deficiency of innate and acquired immunity caused by an IKBKB mutation. N Engl J Med. 2013;369(26):2504–2514. doi: 10.1056/NEJMoa1309199. [DOI] [PubMed] [Google Scholar]
- 37.Boden EK, Snapper SB. Regulatory T cells in inflammatory bowel disease. Curr Opin Gastroenterol. 2008;24(6):733–741. doi: 10.1097/MOG.0b013e328311f26e. [DOI] [PubMed] [Google Scholar]
- 38.Willis TG, et al. Bcl10 is involved in t(1;14)(p22;q32) of MALT B cell lymphoma and mutated in multiple tumor types. Cell. 1999;96(1):35–45. doi: 10.1016/s0092-8674(00)80957-5. [DOI] [PubMed] [Google Scholar]
- 39.Spencer J. Aggressive mucosa associated lymphoid tissue lymphomas are associated with mutations in Bcl10. Gut. 1999;44(6):778–779. doi: 10.1136/gut.44.6.778. [DOI] [PMC free article] [PubMed] [Google Scholar]
- 40.Ferch U, et al. Inhibition of MALT1 protease activity is selectively toxic for activated B cell-like diffuse large B cell lymphoma cells. J Exp Med. 2009;206(11):2313–2320. doi: 10.1084/jem.20091167. [DOI] [PMC free article] [PubMed] [Google Scholar]
- 41.Bolze A, et al. Whole-exome-sequencing-based discovery of human FADD deficiency. Am J Hum Genet. 2010;87(6):873–881. doi: 10.1016/j.ajhg.2010.10.028. [DOI] [PMC free article] [PubMed] [Google Scholar]
- 42.Byun M, et al. Whole-exome sequencing-based discovery of STIM1 deficiency in a child with fatal classic Kaposi sarcoma. J Exp Med. 2010;207(11):2307–2312. doi: 10.1084/jem.20101597. [DOI] [PMC free article] [PubMed] [Google Scholar]
- 43.Torres PS, et al. TCR dynamics in human mature T lymphocytes lacking CD3γ. J Immunol. 2003;170(12):5947–5955. doi: 10.4049/jimmunol.170.12.5947. [DOI] [PubMed] [Google Scholar]
- 44.Wehr C, et al. The EUROclass trial: defining subgroups in common variable immunodeficiency. Blood. 2008;111(1):77–85. doi: 10.1182/blood-2007-06-091744. [DOI] [PubMed] [Google Scholar]
- 45.Shearer WT, et al. Lymphocyte subsets in healthy children from birth through 18 years of age: the Pediatric AIDS Clinical Trials Group P1009 study. J Allergy Clin Immunol. 2003;112(5):973–980. doi: 10.1016/j.jaci.2003.07.003. [DOI] [PubMed] [Google Scholar]
- 46.van Gent R, et al. Refined characterization and reference values of the pediatric T- and B-cell compartments. Clin Immunol. 2009;133(1):95–107. doi: 10.1016/j.clim.2009.05.020. [DOI] [PubMed] [Google Scholar]
- 47.Schatorje EJ, Gemen EF, Driessen GJ, Leuvenink J, van Hout RW, de Vries E. Paediatric reference values for the peripheral T cell compartment. Scand J Immunol. 2012;75(4):436–444. doi: 10.1111/j.1365-3083.2012.02671.x. [DOI] [PubMed] [Google Scholar]
Associated Data
This section collects any data citations, data availability statements, or supplementary materials included in this article.