Abstract
Intracellular Mg2+ levels are strictly regulated; however, the biological importance of intracellular Mg2+ levels and the pathways that regulate them remain poorly understood. Here, we determined that intracellular Mg2+ is important in regulating both energy metabolism and tumor progression. We determined that CNNM4, a membrane protein that stimulates Mg2+ efflux, binds phosphatase of regenerating liver (PRL), which is frequently overexpressed in malignant human cancers. Biochemical analyses of cultured cells revealed that PRL prevents CNNM4-dependent Mg2+ efflux and that regulation of intracellular Mg2+ levels by PRL and CNNM4 is linked to energy metabolism and AMPK/mTOR signaling. Indeed, treatment with the clinically available mTOR inhibitor rapamycin suppressed the growth of cancer cells in which PRL was overexpressed. In ApcΔ14/+ mice, which spontaneously form benign polyps in the intestine, deletion of Cnnm4 promoted malignant progression of intestinal polyps to adenocarcinomas. IHC analyses of tissues from patients with colon cancer demonstrated an inverse relationship between CNNM4 expression and colon cancer malignancy. Together, these results indicate that CNNM4-dependent Mg2+ efflux suppresses tumor progression by regulating energy metabolism.
Introduction
Most human cancers originate from epithelial cells. They then progress through a series of genetic alterations and expand their territory. In the case of colorectal cancers, one of the most common cancers worldwide, the first mutation predominantly occurs in the APC gene, which leads to the development of benign adenomas (1). Several additional genetic alterations are required for the malignant progression into adenocarcinomas, and accumulating evidence has implicated the overexpression of the phosphatase of regenerating liver (PRL) family in this process. The PRL family is composed of 3 related proteins (PRL1, 2, and 3), each containing a tyrosine phosphatase domain (2). A gene expression profiling study of human colorectal cancers revealed that PRL3 was the only gene that was consistently overexpressed in all the metastatic cancers examined (3). Many histological studies on clinical samples have confirmed the association of PRL overexpression with malignancy and poor prognosis for multiple types of cancers (2). In addition, artificial overexpression of PRL1 or PRL3 in cultured cancer cells promoted tumor formation in mice (4), suggesting a causative role in promoting cancer malignancy. A recent study on PRL3-KO mice demonstrated the significance of PRL3 in the early stages of malignancy in an experimental model of chemically induced colon cancers (5). These observational analyses in human cancer patients and experimental analyses in mice have collectively established the oncogenic role of PRL. The phosphatase activity of PRL is considered to be functionally significant, because a phosphatase-inactive mutant is unable to promote tumor formation (6). However, the molecular role of PRL in signaling pathways implicated in oncogenesis remains unknown. To date, biochemical analyses using cultured cells have suggested that PRL can affect several signaling pathways involved in the regulation of cell proliferation, including mammalian/mechanistic target of rapamycin (mTOR) (7, 8).
mTOR integrates various signals that sense changes in the intra- and extracellular environments, such as growth factors, amino acids, and energy levels, and governs cell growth by regulating the rate of protein synthesis (9). A number of studies have revealed a link between cancer development and mTOR signaling. It has been established that phosphatidylinositol 3-kinase/AKT, a major oncogenic signaling pathway triggered by growth factor stimulation, activates mTOR, and pharmacological inhibition of mTOR can effectively suppress the growth of many types of tumors (9, 10). Furthermore, recent studies have also shown the connection between cancer development and another upstream signaling pathway that affects mTOR. AMP-activated protein kinase (AMPK), a key energy sensor molecule, is activated under low-energy conditions and inhibits mTOR by phosphorylating tuberous sclerosis complex 2 (TSC2) and regulatory-associated protein of mTOR (raptor) (11–13). This AMPK is phosphorylated by liver kinase B1 (LKB1), for which the gene is mutated in an inherited cancer susceptibility disorder called Peutz-Jeghers syndrome (14, 15) as a prerequisite for its activation, and mediates some of the tumor-suppressor functions of this molecule (16). Thus, the mechanisms for sensing and maintaining the energy status of a cell are intimately connected to cancer development. Indeed, a study using breast cancer cells in 3D culture has revealed that detachment of cells from the extracellular matrix results in cell death because of ATP deficiency, which, however, can be overcome by the overexpression of ERBB2 oncoprotein (17).
In this study, we searched for novel in vivo protein targets of PRL and discovered an interaction between PRL and ancient conserved domain protein 4/cyclin M4 (CNNM4), which we recently identified as a protein involved in Mg2+ efflux (18). A series of analyses of PRL-CNNM4, performed at the molecular, cellular, and organismal levels, led us to clarify an unexpected role of Mg2+ efflux: the suppression of cancer progression by regulating energy metabolism.
Results
Identification of CNNM4 as a PRL-interacting protein.
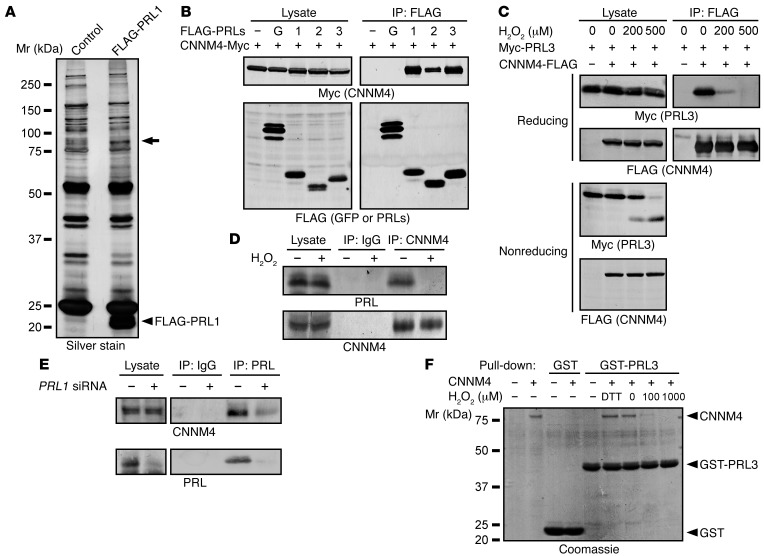
We performed a search for PRL-interacting proteins using SW480-derived cell lines stably expressing FLAG-tagged PRL1 (Figure 1A). The lysates were subjected to IP with an anti-FLAG antibody, and the precipitated proteins were separated by SDS-PAGE and visualized by silver staining. We observed a positive signal around the 75- to 100-kDa region (shown with an arrow). The corresponding band was excised from the gel, and mass spectrometry identified the presence of CNNM4, Hsp90, and CNNM3 with Mascot search scores of 578, 418, and 240, respectively. Since CNNM4 showed the highest score and heat shock proteins are frequently coprecipitated with beads in a nonspecific manner (19), we focused on CNNM4, an integral membrane protein involved in Mg2+ efflux (18), for further analyses. To confirm the interaction between CNNM4 and PRL, we subjected lysates of COS7 cells coexpressing Myc-tagged CNNM4 and FLAG-tagged PRL isoforms or control GFP to IP. We observed CNNM4 coprecipitation with all PRL family proteins (Figure 1B), indicating that CNNM4 interacts with all PRLs. Similar experiments involving the coexpression of Myc-PRL3 and FLAG-tagged CNNM isoforms (CNNM1–4) confirmed that PRL3 interacts with all CNNM isoforms (Supplemental Figure 1A; supplemental material available online with this article; doi:10.1172/JCI76614DS1). Analyses with a series of deletion constructs of CNNM4 revealed that the interaction requires the evolutionarily conserved DUF21 and CBS domains (Supplemental Figure 1B). PRL has been reported to be susceptible to oxidation and shows intramolecular disulfide bond formation between Cys104 (in the catalytic center) and Cys49 (20). We tested the effect of hydrogen peroxide (H2O2) treatment on the PRL-CNNM4 interaction. As shown in Figure 1C, H2O2 treatment for 10 minutes clearly disrupted the interaction. We also analyzed the lysates by performing nonreducing SDS-PAGE and observed the appearance of a faster migrating band of PRL3 following H2O2 treatment (Figure 1C), which reflects the formation of the intramolecular disulfide bond.
Figure 1. Identification of CNNM4 as a PRL-interacting protein.
(A) Lysates of SW480 cells stably expressing FLAG-PRL1 or GFP (control) were subjected to IP with anti-FLAG antibody. The precipitated proteins were separated by SDS-PAGE and visualized by silver staining. The band indicated by an arrow was excised, and the trypsin-digested peptides were subjected to mass spectrometry. (B) Lysates of COS7 cells transfected with CNNM4-Myc and either FLAG-GFP (G) or FLAG-PRL1/2/3 were subjected to IP and immunoblot analyses with the indicated antibodies. (C) COS7 cells transfected with the indicated constructs were treated with H2O2 (10 minutes), and their lysates were subjected to IP and immunoblot analyses under both reducing and nonreducing conditions. (D) HEK293 cells were treated with H2O2 (200 μM, 10 minutes), and the lysates were subjected to IP and immunoblot analyses. (E) HEK293 cells were transfected with control or PRL1 siRNA (#1), and the lysates were subjected to IP and immunoblot analyses. (F) Recombinant GST or GST-PRL3 proteins immobilized on beads were mixed with purified recombinant CNNM4 proteins under reduced (with 5 mM DTT) or oxidized (with 100 or 1,000 μM H2O2) conditions. The proteins were separated by SDS-PAGE and visualized by Coomassie staining. Representative immunoblots/gels from 3 independent experiments are shown in each panel. Mr, relative molecular mass.
We analyzed the formation of a complex between endogenous PRL and CNNM4 by reciprocal IP experiments. We used the anti-CNNM4 antibody that can recognize endogenous CNNM4 in HEK293 cell lysates (18). We also generated an anti-PRL antibody that recognizes the 3 PRL isoforms (Supplemental Figure 2). Immunoblotting of HEK293 cell lysates yielded a major positive signal around the 20-kDa region, which disappeared by knockdown using an siRNA against PRL1, and thus the positive signal was considered to mainly represent endogenous PRL1. Using these antibodies, we confirmed redox-sensitive coprecipitation of PRL in the anti-CNNM4 precipitates (Figure 1D). Coprecipitation of CNNM4 in the anti-PRL IPs was also observed and was lost following PRL1 knockdown (Figure 1E). To investigate whether the interaction between PRL and CNNM4 is direct, we performed in vitro–binding assays using purified recombinant CNNM4 and GST-PRL3 proteins. This experiment demonstrated that the interaction was a direct one (Figure 1F).
PRL inhibits Mg2+ efflux by CNNM4.
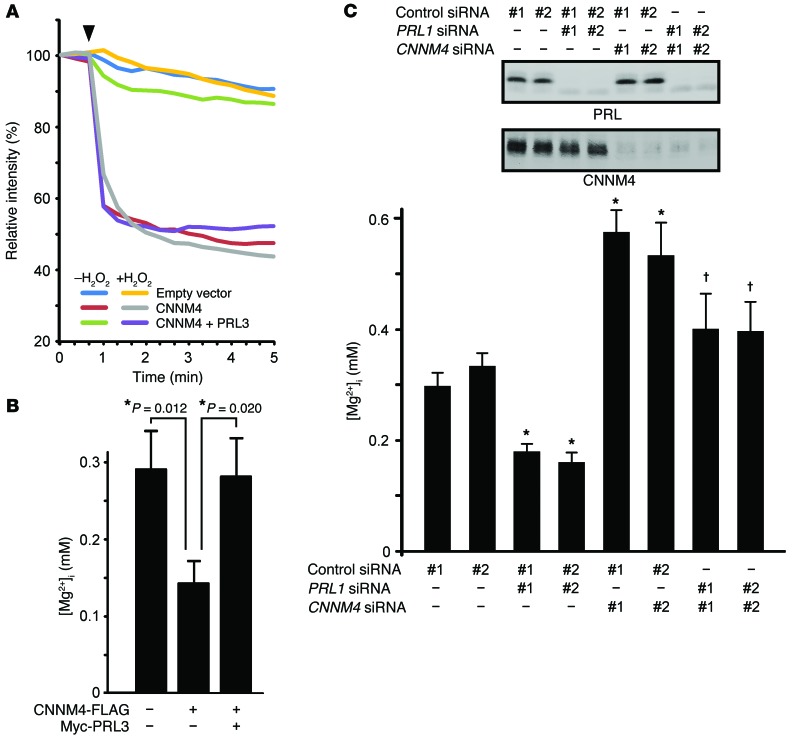
Our previous study revealed that CNNM4 functions as a Na+/Mg2+ exchanger and stimulates Mg2+ efflux (18). Therefore, we investigated the possible effect of PRL on this Mg2+ efflux function of CNNM4 by performing Mg2+ imaging analyses with Magnesium Green, a fluorescent indicator for Mg2+. HEK293 cells transfected with CNNM4-FLAG were loaded with Mg2+, followed by exposure to an Mg2+-free solution in order to artificially stimulate Mg2+ efflux. The results confirmed the occurrence of Mg2+ efflux in cells expressing CNNM4 (Figure 2A). We subsequently examined the effect of PRL expression on the Mg2+ efflux function of CNNM4 and observed that the coexpression of PRL3 clearly suppressed Mg2+ efflux. In addition, H2O2 treatment, which can abolish the interaction between PRL3 and CNNM4 (Figure 1), abrogates the PRL3-induced inhibition. Overall, these experiments indicated that PRL overexpression inhibits the Mg2+ efflux function of CNNM4.
Figure 2. PRL inhibits Mg2+ efflux by CNNM4.
(A) HEK293 cells transfected with the indicated constructs were loaded with Magnesium Green and then subjected to Mg2+ depletion at the indicated time point (arrowhead). The means of relative fluorescence intensities of 10 cells are indicated. If required, cells were treated with 200 μM H2O2 prior to Mg2+ depletion. (B) HEK293 cells transfected with the indicated constructs were loaded with Mag-fura-2, and [Mg2+]i was subsequently determined (mean ± SEM; from left to right, n = 32, 24, and 26). *P < 0.05 by 2-tailed Student’s t test. (C) Top panel: Representative immunoblots for PRL and CNNM4 from 3 independent experiments. Bottom panel: HEK293 cells transfected with the indicated siRNAs were loaded with Mag-fura-2, and [Mg2+]i was subsequently determined (mean ± SEM; from left to right, n = 83, 66, 72, 45, 67, 65, 50, and 50). P values were determined by ANOVA, followed by 2-tailed multiple Student’s t test with Holm-Bonferroni’s correction. *P < 0.05 versus control siRNA–transfected cells (#1 and #2); †P < 0.05 versus PRL1 siRNA–transfected cells (#1 and #2).
To measure the intracellular concentration of free Mg2+ ([Mg2+]i) under normal culture conditions, we used another Mg2+ indicator, Mag-fura-2, which is less sensitive than Magnesium Green, but ratiometric. Compared with the control cells, the cells expressing CNNM4 demonstrated decreased [Mg2+]i, which was, however, restored upon coexpression of PRL3 (Figure 2B). Next, we performed siRNA-mediated knockdown experiments. Since, of the 3 PRL isoforms, HEK293 cells predominantly express PRL1 (Supplemental Figure 2), we transfected cells with 2 specific siRNAs against PRL1 and subjected them to [Mg2+]i quantitation. Our results indicate that both siRNAs similarly induced a moderate decrease in [Mg2+]i (Figure 2C). Moreover, the additional knockdown of endogenous CNNM4, which is the predominantly expressed CNNM isoform in HEK293 cells (Supplemental Figure 3A), restored [Mg2+]i to normal levels. Collectively, these results implicate endogenous PRL in the regulation of intracellular Mg2+ levels in culture cells via CNNM4 inhibition of Mg2+ efflux.
PRL-CNNM4 affects energy metabolism and AMPK/mTOR signaling.
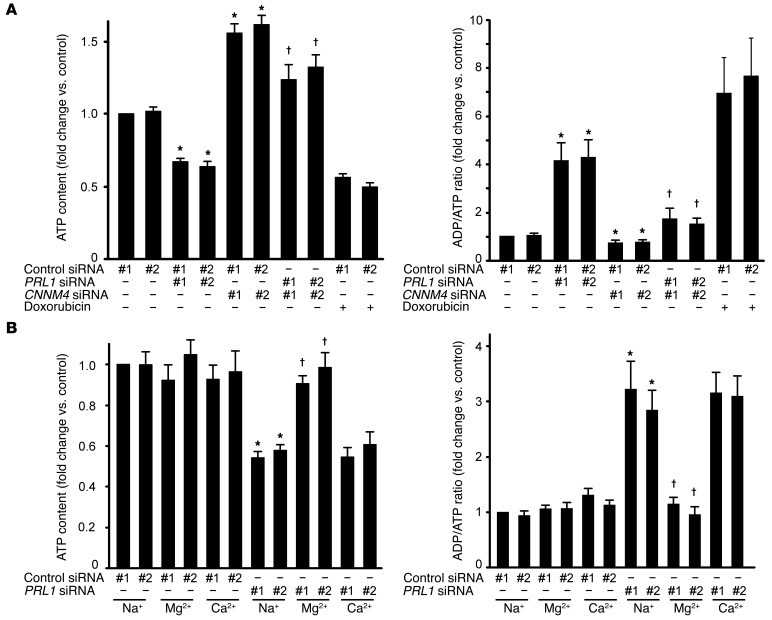
Most of the intracellular Mg2+ forms complexes with a variety of molecules, among which ATP is regarded as the most significant (21, 22). Mg2+ binding to ATP is considered to be essential for numerous enzymatic reactions that use ATP as an energy source, and, basically, intracellular ATP exists in a complex with Mg2+. Moreover, Mg2+ is also required for the novel synthesis of ATP (23). These observations led us to hypothesize that cellular Mg2+ content limits the amount of ATP that cells can hold, and thus the ATP level may be affected upon the abolition of PRL-CNNM4 expression. Indeed, CNNM4 knockdown, which increased intracellular Mg2+ levels (Figure 2C), significantly increased ATP levels in HEK293 cells (Figure 3A). In contrast, PRL1 knockdown significantly decreased ATP levels (Figure 3A). This decrease was cancelled by the additional knockdown of CNNM4. Moreover, PRL1 knockdown also resulted in an approximately 4-fold increase in the ADP/ATP ratio, which was restored by the additional knockdown of CNNM4. To investigate the role of Mg2+ in this phenomenon, we bathed cells in a medium supplemented with excess Mg2+. Supplementation of the medium with 40 mM Mg2+ restored both ATP levels and the ADP/ATP ratio (Figure 3B). Supplementation of the medium with other metal ions did not produce similar results.
Figure 3. PRL affects energy metabolism.
(A) ATP levels (left) and ADP/ATP ratios (right) of HEK293 cells transfected with the indicated siRNAs were determined. As a positive control, doxorubicin-treated cells (1 μg/ml, 24 hours) were also subjected to analyses. Data are shown as the mean ± SEM (n = 6 for doxorubicin-treated cells and n = 9 for other cells). P values were determined by ANOVA, followed by 2-tailed multiple Student’s t test with Holm-Bonferroni’s correction. *P < 0.05 versus control siRNA-transfected cells (#1 and #2); †P < 0.05 versus PRL1 siRNA–transfected cells (#1 and #2). (B) HEK293 cells transfected with PRL1 siRNA were cultured in medium supplemented with NaCl (60 mM), MgCl2 (40 mM), or CaCl2 (40 mM) for 20 hours, and ATP levels (left) and ADP/ATP ratios (right) of these cells were determined (mean ± SEM, n = 6). P values were determined by ANOVA, followed by 2-tailed multiple Student’s t test with Holm-Bonferroni’s correction. *P < 0.05 against NaCl-supplemented control siRNA-transfected cells (#1 and #2); †P < 0.05 versus NaCl-supplemented PRL1 siRNA–transfected cells (#1 and #2).
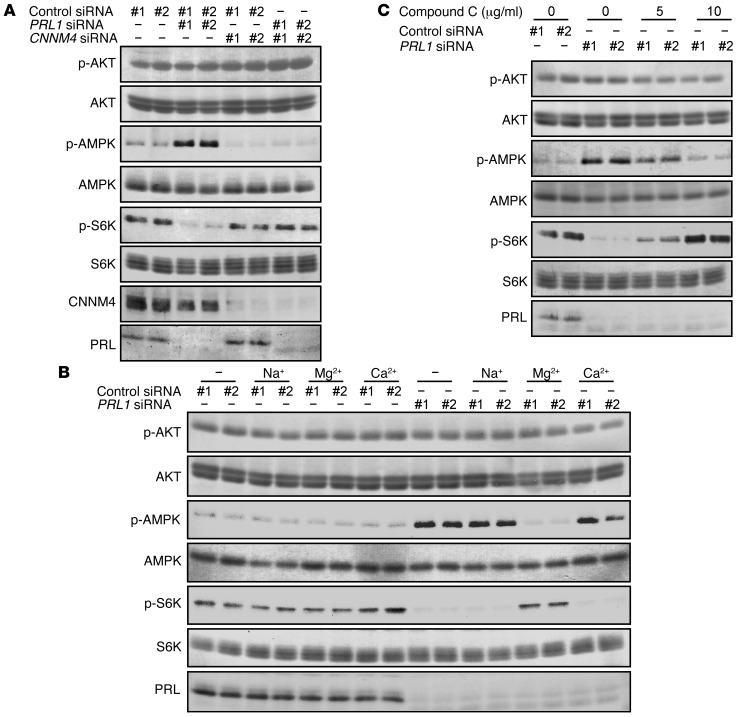
We also investigated the activation status of AMPK, which is phosphorylated and activated under energy-deficient conditions (11–13). As expected, PRL1 knockdown augmented AMPK phosphorylation, and this effect was abrogated by the additional knockdown of CNNM4 (Figure 4A). Similar to restoration of the ATP levels and ADP/ATP ratio (Figure 3B), the PRL1 knockdown–mediated AMPK hyperphosphorylation was selectively abrogated by Mg2+ supplementation (Figure 4B). mTOR is known to be a major downstream target of AMPK signaling (11) and has significant roles in cancer development (9); therefore, we analyzed the activation status of the mTOR pathway. PRL1 knockdown reduced the phosphorylation level of S6K, which is a well-known substrate of mTOR and is frequently used as a marker to monitor mTOR pathway activity (ref. 24 and Figure 4A). Additional knockdown of CNNM4 or Mg2+ supplementation again restored S6K phosphorylation (Figure 4, A and B). Furthermore, the treatment of PRL1-knockdown cells with compound C, an AMPK inhibitor, also restored S6K phosphorylation (Figure 4C). Collectively, PRL suppresses the activation of AMPK and maintains the activity of the downstream mTOR pathway through the regulation of intracellular Mg2+ and ATP levels.
Figure 4. PRL affects AMPK/mTOR signaling.
(A) HEK293 cells were transfected with the indicated siRNAs, and the cell lysates were subjected to immunoblot analyses. (B) HEK293 cells transfected with PRL1 siRNA were cultured in medium supplemented with NaCl (60 mM), MgCl2 (40 mM), or CaCl2 (40 mM) for 20 hours, and the cell lysates were subjected to immunoblot analyses. (C) HEK293 cells transfected with PRL1 siRNA were treated with the indicated concentrations of compound C (2 hours). The cell lysates were subjected to immunoblot analyses. Representative immunoblots from 3 independent experiments are shown in each panel.
PRL-expressing cells are resistant to glucose starvation.
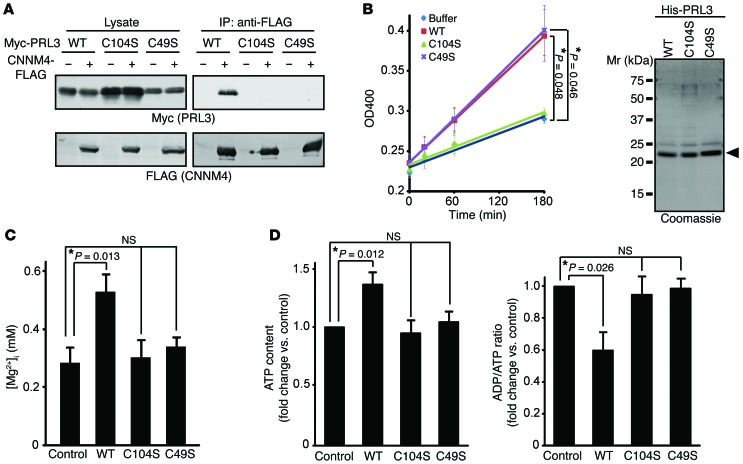
To address the biological importance of the interaction between PRL and CNNM4, we constructed the catalytically inactive mutant PRL3-C104S, which lacks the ability to promote experimental tumor formation (6). Co-IP analyses using COS7 cells indicated that PRL3-C104S did not interact with CNNM4 (Figure 5A). We also found that another amino acid substitution mutant of PRL3, PRL3-C49S, similarly lacks CNNM4-binding ability. Consistent with a previous study (20), in vitro phosphatase assays with purified His-tagged proteins showed that PRL3-WT and PRL3-C49S possessed weak yet significant phosphatase activity, whereas PRL3-C104S did not (Figure 5B).
Figure 5. Characterization of PRL3 Cys mutants.
(A) Lysates of COS7 cells transfected with the indicated constructs were subjected to IP and immunoblot analyses. (B) Purified His-tagged PRL3 proteins were subjected to phosphatase assays (mean ± SEM, n = 3). *P < 0.05 by paired 2-tailed Student’s t test. The purity of the proteins is also shown (right). (C) B16 cells stably expressing Myc-PRL3 were loaded with Mag-fura-2, and [Mg2+]i was determined (mean ± SEM; from left to right, n = 33, 32, 16, and 26). *P < 0.05 by ANOVA followed by 2-tailed multiple Student’s t test with Bonferroni’s correction. (D) ATP levels (left) and ADP/ATP ratios (right) of B16 cells stably expressing Myc-PRL3 (WT, C104S, or C49S) were determined (mean ± SEM, n = 8). *P < 0.05 by ANOVA, followed by 2-tailed multiple Student’s t test with Bonferroni’s correction. In A and B, representative immunoblots/gels from 3 independent experiments are shown.
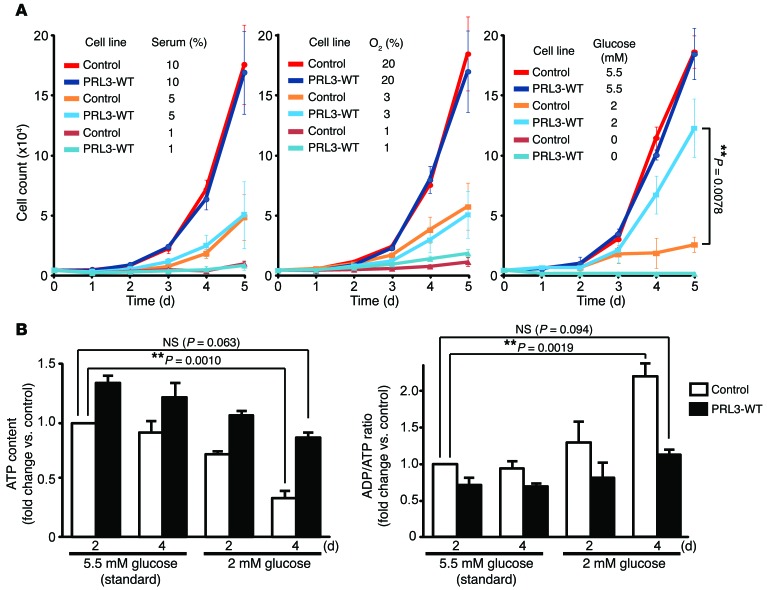
We next attempted to examine the biological activities of these PRL3 mutants. Various models of experimental tumorigenesis have been used to demonstrate the importance of PRL3. Among them, the lung tumor–formation model by tail vein–injected cells has been most frequently used. In this model, ectopic expression of PRL3 in various cell lines, including B16 mouse melanoma cells, Chinese hamster ovary (CHO) cells, and LoVo human colon cancer cells has been shown to promote lung tumorigenesis (4, 25–27). Since multiple groups have used the B16-derived cells to demonstrate the importance of PRL3 in experimental tumor formation (25, 26, 28), we also generated B16-derived cell lines stably expressing PRL3-WT, -C104S, and -C49S, and control cells expressing GFP. Cells expressing PRL3-WT expectedly showed higher intracellular Mg2+ and ATP levels compared with those observed in control cells (Figure 5, C and D). PRL3-WT overexpression has been reported to augment tumor-formation ability (25, 26, 28), but we noticed no significant differences in the rate of proliferation speed or motility under normal in vitro cell culture conditions. We hypothesized that PRL3-WT expression confers a growth advantage under certain conditions that cancer cells may encounter in stressful environments. Therefore, we next subjected cells to various stress conditions, including serum starvation, glucose starvation, and hypoxia. We found that expression of PRL3-WT did not confer any growth advantage to cells exposed to conditions of serum starvation and hypoxia (Figure 6A, left and middle). When the glucose level was reduced from the standard 5.5 mM to 2 mM, the proliferation of control cells was severely impaired. However, PRL3-WT–expressing cells still retained their ability to proliferate efficiently (Figure 6A, right). Culturing cells under such conditions of glucose starvation resulted in a decrease in ATP levels, and after 4 days, the ATP levels in the control cells were reduced to approximately 34% of those seen in cells cultured under standard conditions, i.e., with 5.5 mM glucose (Figure 6B). In contrast, ATP levels in cells expressing PRL3-WT were higher than those in control cells, and although their ATP levels were also significantly reduced after 4 days of culture under glucose-limiting conditions, these cells maintained respectable ATP levels (~86% of those in the control cells grown under standard conditions). Collectively, PRL3-WT overexpression augments the Mg2+ and ATP levels and allows B16 cells to grow even under glucose-limiting conditions.
Figure 6. PRL-expressing cells are resistant to glucose starvation.
(A) B16 cells stably expressing Myc-PRL3 were plated on day 0 and cultured with the indicated concentrations of serum (left), oxygen (middle), and glucose (right). Cell numbers were counted each day (mean ± SEM, n = 5 [left], 3 [middle], and 3 [right]). **P < 0.01 by 2-tailed Student’s t test. (B) B16 cells stably expressing Myc-PRL3 were cultured in medium containing 2 or 5.5 mM glucose for the indicated number of days, and ATP levels (left) and ADP/ATP ratios (right) were determined (mean ± SEM, n = 6). **P < 0.01 by paired 2-tailed Student’s t test.
Suppression of CNNM4 promotes cancer malignancy in mice.
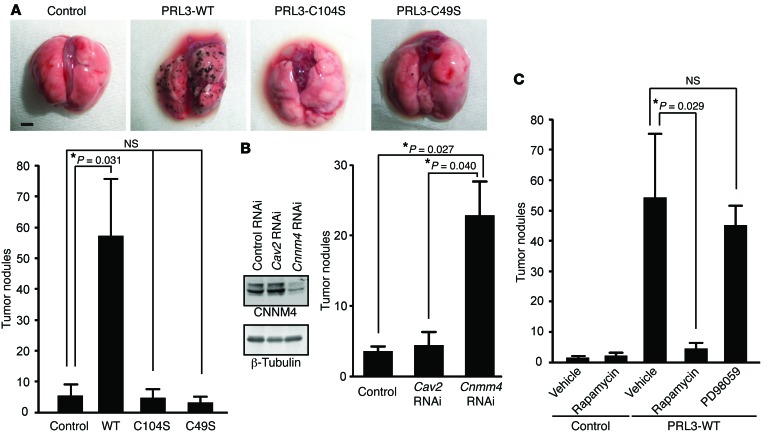
Next, the above B16-derived cells were injected into C57BL6/J mice via the tail vein. Three weeks later, we observed numerous black tumor nodules on the lungs of mice injected with cells stably expressing PRL3-WT. Consistent with a previous report (26), PRL3-WT expression significantly augmented the number of tumor nodules, whereas the lungs of mice injected with cells expressing PRL3-C104S bore only a few nodules, similar to those removed from control cell–injected mice (Figure 7A). Significantly, expression of the PRL3-C49S mutant, which retained phosphatase activity but lacked the ability to bind CNNM4 (Figure 5, A and B), was also unable to promote tumor nodule formation. As mentioned, CHO cells as well as B16 cells were also used to show the ability of PRL3 to promote tumor formation (4). Thus, we also generated CHO-derived cell lines stably expressing PRL3 and performed experimental tumorigenesis analyses. As shown in Supplemental Figure 4A, we obtained results very similar to those obtained with B16-derived cells; only cells expressing PRL3-WT, but not PRL3-C104S or PRL3-C49S, showed a significant increase in tumor nodules compared with control cells. These results demonstrate a clear correlation between the ability to bind CNNM4 and the promotion of tumor formation. To directly assess the importance of CNNM4, we next performed similar analyses with CNNM4-knockdown cells. We achieved stable knockdown of endogenous CNNM4 in B16 cells, which mainly express CNNM4 among the 4 CNNM family molecules (Supplemental Figure 3B), by retroviral infection of pSUPER-retro vectors that express shRNA against CNNM4 (Figure 7B). As a negative control, we also generated caveolin-2–knockdown B16 cells (Supplemental Figure 5), because a previous study showed that caveolin-2 knockdown in B16 cells did not promote tumorigenesis (29). Tumorigenesis analyses using these cells showed that knockdown of CNNM4, but not caveolin-2, significantly augmented the number of tumor nodules on the lungs (Figure 7B). We also achieved stable knockdown of CNNM4 in CHO cells using 2 different target sequences and expectedly obtained very similar results (Supplemental Figure 4B). Collectively, these results confirm the tumor-suppressing role of endogenous CNNM4.
Figure 7. PRL promotes tumor growth via CNNM4.
(A) B16 cells stably expressing Myc-PRL3 were subjected to tumor-formation experiments. The number of tumor nodules on the lungs is shown as the mean ± SEM (n = 15; 3 independent cell clones for each construct). *P < 0.05 by ANOVA, followed by 2-tailed multiple Student’s t test with Bonferroni’s correction. Scale bar: 2 mm. (B) Cnnm4 RNAi B16 cells were subjected to tumor-formation experiments. Results represent the mean ± SEM. n = 6 (control or Cav2 RNAi) or n = 12 (Cnnm4 RNAi), with 3 independently obtained cells for each construct. *P < 0.05 by ANOVA, followed by 2-tailed multiple Student’s t test with Bonferroni’s correction. Representative immunoblot results for endogenous CNNM4 (from 3 independent experiments) are also shown. (C) B16 cells stably expressing PRL3-WT were subjected to tumor-formation experiments, with rapamycin (7.5 mg/kg/day) or PD98059 (3.0 mg/kg/day) treatment started from the day following cell inoculation (mean ± SEM, n = 6). *P < 0.05 by paired 2-tailed Student’s t test.
Biochemical analyses indicated a link between PRL and mTOR signaling via CNNM4 (Figure 4). Therefore, we examined the importance of mTOR in PRL-induced tumor growth. We treated mice harboring B16 PRL3-WT cells or control B16 cells expressing GFP with rapamycin, a well-characterized and clinically available inhibitor of mTOR, with a daily regimen. In parallel, we also treated a cohort of mice with the MEK inhibitor PD98059, which has been shown to inhibit the experimental tumor growth of ACC-M cells, in which MAPK signaling is strongly activated, in mice (30). As shown in Figure 7C, treatment with rapamycin, but not PD98059, drastically decreased the number of tumor nodules in mice introduced with B16 PRL3-WT cells, suggesting the importance of mTOR signaling in this process. Unlike ACC-M cells, B16 cells stably expressing PRL3-WT did not show significant augmentation of MAPK signaling (data not shown). Therefore, the differential effect of PD98059 between ACC-M cells and B16 PRL3-WT cells is probably due to the difference in the activation status of the MAPK pathway.
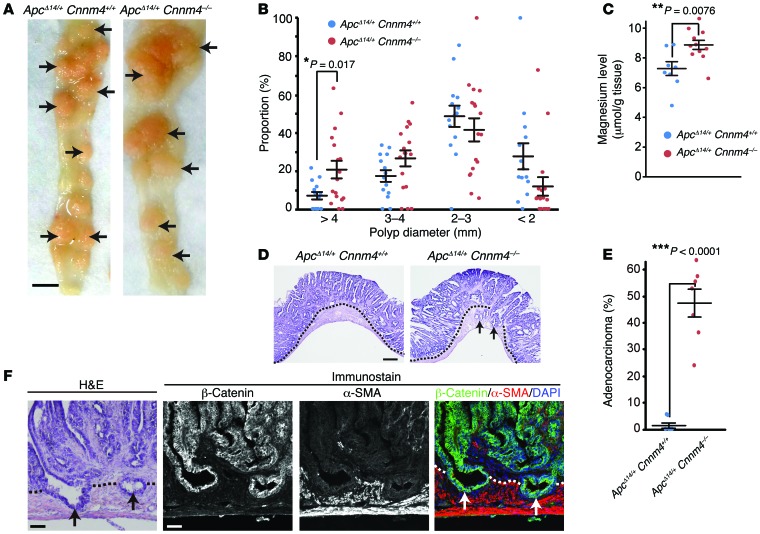
To corroborate the importance of CNNM4 in cancer malignancy, we performed genetic analyses using Cnnm4–/– mice, which had been generated in our previous study (18) and showed no gross abnormalities at 1 year of age. Since CNNM4 is strongly expressed in the intestinal epithelia (18), we crossed Cnnm4–/– mice with ApcΔ14/+ mice, which bear a heterozygous deletion of exon 14 of the Apc gene and are predisposed to the development of many intestinal polyps (31). At 7 months of age, we observed numerous polyps in the intestines of both ApcΔ14/+ Cnnm4+/+ mice and ApcΔ14/+ Cnnm4–/– mice (Figure 8A). We observed no obvious difference in tumor numbers (20.3 ± 4.8 tumors in ApcΔ14/+ Cnnm4+/+ mice, n = 18; 21.9 ± 3.6 tumors in ApcΔ14/+ Cnnm4–/– mice, n = 21). In contrast, the average tumor per mouse was significantly larger in ApcΔ14/+ Cnnm4–/– mice (2.59 ± 0.12 mm in ApcΔ14/+ Cnnm4+/+ mice, n = 14; 3.25 ± 0.14 mm in ApcΔ14/+ Cnnm4–/– mice, n = 17; P = 0.0017 by 2-tailed Student’s t test). Typically, the proportion of large tumors (>4 mm) was approximately 3-fold higher in ApcΔ14/+ Cnnm4–/– mice (Figure 8B). We also measured the magnesium levels in the dissected polyps and found that they were higher in the polyps from ApcΔ14/+ Cnnm4–/– mice (Figure 8C), which agrees with the results obtained from the cell culture studies indicating that CNNM4 knockdown augments intracellular Mg2+ levels (Figure 2). To characterize the polyps in more detail, the polyps were sectioned and subjected to H&E staining. As previously reported (31), most polyps in ApcΔ14/+ Cnnm4+/+ mice were adenomas restricted to the epithelial layer (Figure 8, D and E). In striking contrast, approximately 48% of the polyps in ApcΔ14/+ Cnnm4–/– mice extended into the underlying smooth muscle layer and were therefore classified as adenocarcinomas (32). Double-immunofluorescence staining with the antibodies against β-catenin (epithelial marker) and α-SMA (smooth muscle marker) clearly confirmed the presence of epithelial cell–derived tumor cells in the smooth muscle layer (Figure 8F). Moreover, the average size of the polyps classified as adenocarcinomas (per mouse) was significantly larger than that of ademonas classified as benign (3.25 ± 0.27 mm vs. 2.90 ± 0.27 mm, n = 7; P = 0.048 by 2-tailed Student’s t test). These results indicate that Cnnm4 deficiency promotes the tumor growth and development of malignant adenocarcinomas.
Figure 8. Genetic ablation of CNNM4 promotes cancer malignancy.
(A) Macroscopic views of the resected intestines of ApcΔ14/+ Cnnm4+/+ and ApcΔ14/+ Cnnm4–/– mice at 7 months of age. Polyps are indicated by arrows. Scale bar: 5 mm. (B) The size of each polyp was measured, and the size distributions of each mouse are shown (14 ApcΔ14/+ Cnnm4+/+ mice and 17 ApcΔ14/+ Cnnm4–/– mice). Black bars indicate the mean ± SEM. *P < 0.05 by 2-tailed Student’s t test. (C) Magnesium levels in the polyps were measured (≥3 per mouse), and the average levels for each mouse are shown (8 ApcΔ14/+ Cnnm4+/+ mice and 12 ApcΔ14/+ Cnnm4–/– mice). Black bars indicate the mean ± SEM. **P < 0.01 by 2-tailed Student’s t test. (D and E) Sections of the intestinal polyps were subjected to H&E staining, and the representative results are shown in D. Dotted lines indicate the boundaries between the epithelial layer and the smooth muscle layer, and arrows indicate adenocarcinomas that extended into the smooth muscle layer. Scale bar: 300 μm. The proportion of adenocarcinomas to total polyps was quantified for each mouse and is shown in E (7 mice for each genotype). Black bars indicate the mean ± SEM. ***P < 0.001 by 2-tailed Student’s t test. (F) Serial sections of the intestinal polyps from ApcΔ14/+ Cnnm4–/– mice were subjected to H&E (left) or immunofluorescence staining with anti–β-catenin (green), anti–α-SMA (red), and DAPI (blue) (right). Scale bars: 50 μm.
Inverse relationship between CNNM4 expression and cancer malignancy.
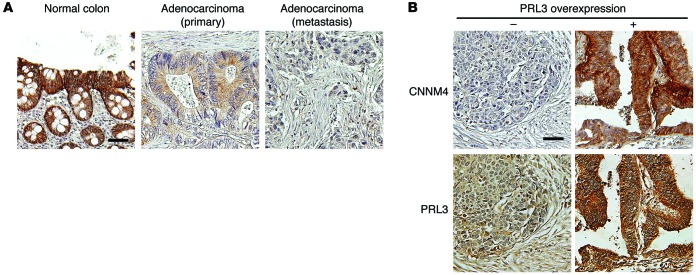
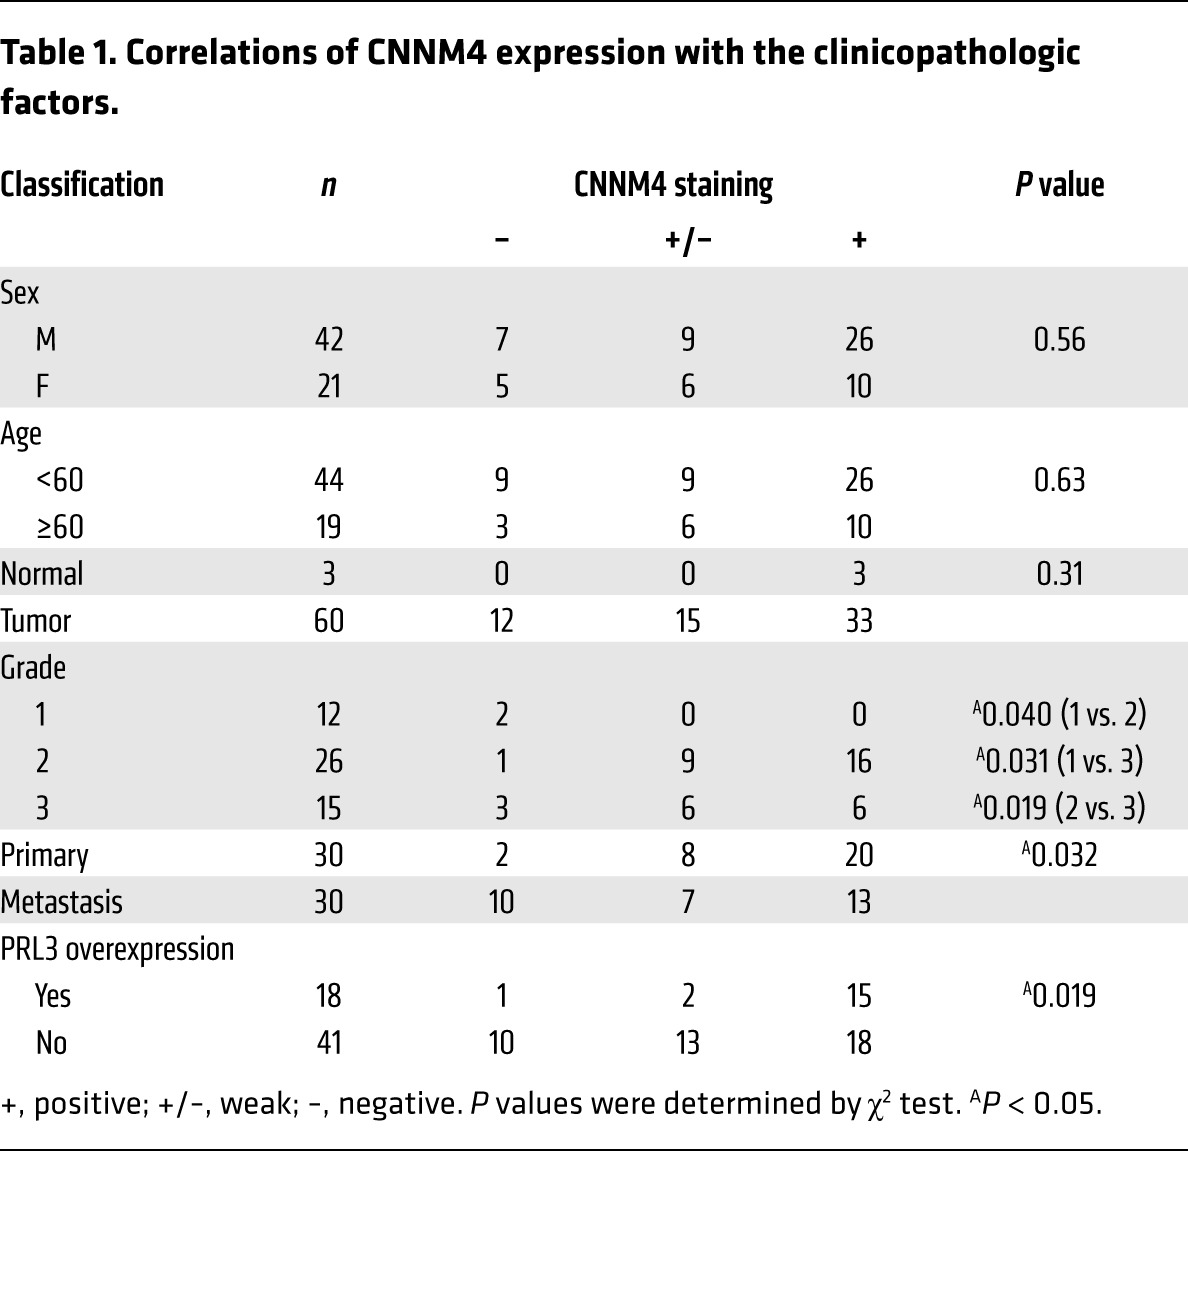
To validate these findings in human cancers, we investigated the expression of endogenous CNNM4 proteins in histological specimens obtained from colon cancer patients. IHC staining with the anti-CNNM4 antibody showed positive staining in normal colon tissue epithelia (Figure 9A, left). In contrast, the staining was completely absent in several cancer specimens (Figure 9A, right). Also, in cancer specimens with any CNNM4 staining, some specimens showed strong staining similar to that seen in normal colon tissues, but many other specimens showed apparently different, very weak staining (Figure 9A, middle). To reflect these observations, we classified the specimens into 3 categories (positive, weak, and negative) for further evaluation. With this classification, there was a tendency toward reduced signal intensity in the higher-grade, less-differentiated cancerous tissues (Table 1). Furthermore, we observed a significant decrease in CNNM4 expression in colon cancer–derived metastases to the liver and lymph nodes as compared with the expression levels seen in primary cancers (Table 1). These results imply that expression levels of CNNM4 inversely correlate with cancer malignancy, thereby supporting the notion that CNNM4 suppresses the progression of cancer malignancy in humans. We also performed IHC staining with the anti-PRL3 antibody that has been used to stain human colon cancer tissues (33, 34). We confirmed the occurrence of PRL3 overexpression in some cancer specimens, which was never observed in the normal colon tissue. We then examined the relationship between PRL3 expression and CNNM4 expression in these samples and found that there was a positive correlation between the two (Figure 9B and Table 1), suggesting the possibility that either PRL3 overexpression or CNNM4 downregulation promotes cancer malignancy. These results are consistent with our findings obtained from studies using cell cultures, which indicated that PRL negatively regulates CNNM4 function.
Figure 9. Inverse relationship between CNNM4 expression and cancer malignancy.
(A) Representative images of IHC staining for CNNM4 in normal colorectal epithelia (left, positive staining), primary cancer tissues (middle, weak staining), and metastases (right, negative staining). (B) Representative images of IHC staining for CNNM4 in cancer tissues without PRL3 overexpression (left) and with PRL3 overexpression (right). Scale bars: 50 μm.
Table 1.
Correlations of CNNM4 expression with the clinicopathologic factors.
Discussion
The importance of Mg2+ in the control of cell proliferation has long been proposed (35, 36). Studies of the Mg2+-permeable channel TRPM7 revealed the importance of Mg2+ influx for maintaining cell proliferation (37, 38), providing a strong line of evidence at the molecular level. Our study has also demonstrated the significance of CNNM4-mediated regulation of Mg2+ efflux. However, the mechanism by which Mg2+ affects cell proliferation has not been addressed in previous studies. In contrast to Ca2+, which is mainly stored in the endoplasmic reticulum in the free form and released to the cytoplasm upon stimulation, Mg2+ stores are seen throughout the cell, and mostly this cation binds to intracellular molecules, such as phospholipids, proteins, and nucleic acids. Of all the biomolecules that bind Mg2+, ATP is the most significant (21, 22), which led us to hypothesize that Mg2+ affects the dynamics of its most intimate partner, i.e., ATP. Indeed, the results shown in Figure 3 clearly demonstrate that ATP levels can be perturbed by manipulating Mg2+ levels through PRL-CNNM4 knockdown and by the addition of excess amounts of Mg2+ to the culture medium. These findings assign a novel role to Mg2+ in determining the energy status of cells, the deregulation of which ultimately leads to abnormal cell proliferation.
Glucose deficiency results in energy-related stress and activates the sensor kinase AMPK. This halts energy-consuming metabolic processes and arrests cell proliferation (11). However, we observed that B16 cells stably expressing PRL3 retained their ability to proliferate even under conditions of glucose limitation (2 mM), which could not support the efficient proliferation of control cells (Figure 6). PRL overexpression augmented intracellular Mg2+ levels by inhibiting Mg2+ efflux and caused a concomitant increase in ATP levels, thereby increasing the resistance of cells to energy stress. This resistance would impart a selective advantage to cancer cells, enhancing their ability to maintain mTOR activity and grow under nutrient-limited stress conditions, as observed in a large mass of tumors that occasionally lacked sufficient blood supply. It should be noted, however, that PRL overexpression did not endow cells with resistance against hypoxia, even though this resulted in energy stress similar to that caused by glucose shortage. These findings could be attributed to the fact that hypoxia can also stimulate the expression of REDD1, which suppresses mTOR signaling in an AMPK-independent manner (39).
It is widely accepted that mTOR signaling is sensitively affected by stresses, and sustained mTOR activity, even under stressed conditions, is a hallmark of malignant cancer cells and promotes tumor growth (10, 40). Indeed, our results show that tumor formation of PRL-expressing cells was clearly suppressed by treating mice with the mTOR inhibitor rapamycin (Figure 7C). Also, it should be noted that both oncogenic mutation of the KRAS gene and inactivation of the PTEN gene (by either point mutation, promoter hypermethylation, or chromosomal deletion) are known to activate the mTOR pathway and are frequently found in human colorectal cancers (41, 42). In Apc-mutant mice, expression of the oncogenic Kras mutant or genetic ablation of Pten in intestinal epithelia resulted in accelerated tumor growth and development of malignant adenocarcinomas (43, 44). These phenotypes are similar to those of ApcΔ14/+ Cnnm4–/– mice (Figure 8), which agrees with our biochemical characterization of PRL-CNNM4 as a modulator of mTOR signaling (Figure 4).
Histological evaluations of human cancers have implicated PRL overexpression in cancer malignancy (2). Our study suggests that cancer cells take advantage of the downregulation of CNNM4 expression as an alternative path to suppress Mg2+ efflux function. Indeed, our histological analyses of human colon cancers have demonstrated an inverse relationship between CNNM4 expression and cancer malignancy, and we more frequently observed CNNM4 downregulation in cancer specimens without PRL3 overexpression (Figure 9). Furthermore, upon searching the Oncomine database (https://www.oncomine.org), we found that CNNM4 mRNA levels in colon cancer were significantly reduced. This reduction was more evident in metastatic colon cancers as compared with the nonmetastatic ones, thereby implicating CNNM4 downregulation in human colon cancer development. Importantly, these observations are consistent with the experimental results obtained from our knockout mouse study, which indicated that ablation of Cnnm4 in ApcΔ14/+ intestinal polyposis mice accelerates malignant progression of polyps to adenocarcinomas (Figure 8).
Our study suggests that tumor progression may be prevented by artificially restricting magnesium supply to tumor tissues, but previous reports imply the difficulty of decreasing intracellular magnesium levels by such a method. In humans, serum magnesium levels below 0.5 mM, which are roughly equivalent to 0.25 to 0.35 mM of free Mg2+ (45), cause multiple nervous system and cardiovascular disorders (46). However, cell culture studies have shown that intracellular magnesium levels did not decrease significantly by reducing extracellular [Mg2+]i to 0.2 to 0.3 mM (47, 48). Therefore, further efforts to clarify and manipulate the molecular mechanisms regulating intracellular magnesium levels would be needed to link these discoveries to novel therapeutics for cancers.
Methods
Further information can be found in the Supplemental Methods.
Animals.
Cnnm4–/– mice (ICR × C57BL/6J background) were generated in the previous study (18), and ApcFlox14/+ mice (RBRC01872, 129/Ola × C57BL/6J background) possessing a heterozygous mutant Apc allele, of which exon 14 is flanked with LoxP sites, were originally generated in previous studies by M. Giovannini and colleagues (Fondation Jean Dausset-CEPH, Paris, France) (31, 49) and provided by RIKEN BRC through the National BioResource Project of the Japanese Ministry of Education, Culture, Sports, Science and Technology (MEXT). ApcFlox14/+ mice were crossed with CAG-Cre mice (gift of M. Okabe, Osaka University, Osaka, Japan) on a C57BL/6J background to generate ApcΔ14/+ mice. To minimize the background fluctuations, we only used ApcΔ14/+ Cnnm4+/+ and ApcΔ14/+ Cnnm4–/– mice derived from a single colony of inbred ApcΔ14/+ Cnnm4+/– mice for experiments.
Constructs.
cDNAs for murine PRL1, PRL3, and human PRL2 (which shares 100% amino acid identity with murine PRL2) and CNNM3 were obtained by PCR and verified by DNA sequencing. cDNAs for human CNNM4 and mouse CNNM2 were generated in the previous study (18), and cDNA for human CNNM1 was purchased from Invitrogen (IMAGE: 40006972). As positive controls for reverse transcriptase-PCR (RT-PCR) expression analyses, cDNA fragments for human CNNM1–4 (bp 1686–1928, 692–911, 26–200, and 1212–1376, respectively) and mouse CNNM1–4 (bp 1,015–1,192, 1,456–1,842, 1,004–1,220, and 1,319–1,653, respectively) were obtained by PCR and verified by DNA sequencing. Amino acid–substituted mutants of PRL3 (C104S and C49S) were generated using the QuickChange Site-Directed Mutagenesis Kit (Agilent Technologies).
Antibodies and chemicals.
The anti-CNNM4 rabbit polyclonal antibody was generated in the previous study (18). The anti-PRL rabbit polyclonal antibody was generated by immunizing rabbits with the bacterially expressed His-tagged PRL1 (full-length) proteins and purified using the corresponding GST-tagged recombinant proteins. We also used the following commercially available antibodies: rabbit anti-S6K (9202S), anti–phosphorylated S6K (anti–p-S6K) (Thr389, 9205S), anti-AKT (9272S), anti–p-AKT (Ser473, 9271S), anti-AMPK (2532S), and anti–p-AMPK (Thr172, 2535S) from Cell Signaling Technology; mouse anti-FLAG (F1804, clone M2), anti–β-tubulin (T4026, clone TUB 2.1), anti–α-SMA (Cy3-conjugated, C6198, clone 1A4), and rabbit anti-FLAG (F7425) from Sigma-Aldrich; mouse anti–β-catenin (610154, clone 14) from BD Biosciences; and mouse anti-Myc (sc-40, clone 9E10), anti-PRL3 (sc-130355, clone 318), and rabbit anti-Myc (sc-789) from Santa Cruz Biotechnology Inc. For anti-PRL3 antibodies, we also used the antibody from the same clone, which was originally raised and gifted by Q. Zeng (Agency for Science, Technology, and Research, Singapore) (33) for preliminary experiments. Doxorubicin, rapamycin, and PD98059 were purchased from Wako, Toronto Research Chemicals, and Invitrogen, respectively.
Experimental tumor formation.
Tumor-formation experiments were performed as described previously (50), with several modifications. Briefly, 1 × 10⁶ B16 cells stably expressing Myc-PRL3 or shRNA against CNNM4 were injected i.v. into the tail veins of female C57BL/6J mice (Charles River Laboratories). If required, mice were treated with rapamycin (7.5 mg/kg/day) or PD98059 (3 mg/kg/day) by i.p. administration from the day following cell injection. Mice were euthanized 3 weeks after injection, the lungs were excised, and the black spherical B16 colonies on their surface (larger than 0.1 mm in diameter) were counted. For CHO-derived cells, 5 × 10⁵ cells were injected i.v. into the tail veins of female nude mice (CLEA Japan Inc.). Mice were killed 25 days after injection for the examination of tumor nodules.
Measurement of ATP and determination of the ADP/ATP ratio.
The ApoSENSOR ADP/ATP Ratio Assay Kit (BioVision) was used to measure the ATP level and to subsequently determine the ADP/ATP ratio.
Histopathological analyses.
Intestines of the 7-month-old mice were dissected, opened longitudinally, and fixed with 4% paraformaldehyde in PBS for 30 minutes at room temperature. The number and size of the polyps were determined under a stereo microscope (SZX16; Olympus). Whole intestines were then embedded in OCT compound in a “Swiss role” configuration, frozen in liquid nitrogen, and cut into 20-μm-thick sections with a cryostat (Leica). H&E-stained sections were analyzed under a microscope (BX41 equipped with a DP73 camera; Olympus), and tumors that clearly reached the inside of the smooth muscle layer were determined to be adenocarcinomas (32). The number and average size of the polyps and the incidence of adenocarcinoma for each mouse (7 or more mice for each genotype) were used for statistical evaluation.
Immunofluorescence microscopy of mouse polyps.
Sections (10-μm thick) of dissected polyps were mounted on glass slides and fixed with 4% paraformaldehyde in PBS for 30 minutes at room temperature. The slides were then subjected to heat-induced antigen retrieval at 110°C for 30 seconds with 10 mM sodium citrate buffer (pH 6.0) in a steamer (Decloaking Chamber NxGen; Biocare Medical). After blocking with PBS containing 5% normal goat serum (Dako) and 0.5% Triton X-100 for 1 hour at room temperature, specimens were incubated overnight at 4°C with anti–β-catenin antibody, followed by incubation with Alexa 488–conjugated anti-mouse IgG (Invitrogen) for 1 hour at room temperature. Then, the slides were further incubated with Cy3-conjugated anti–α-SMA antibody. Cover glasses were mounted on a glass slide and observed with a confocal scanning laser microscope (FluoView FV1000; Olympus).
Quantitation of magnesium content in polyps.
Dissected polyps (at least 3 per mouse) were homogenized in 1N nitric acid and then incubated overnight. After centrifugation, the magnesium concentration of the supernatant was determined using colorimetric reagent Xylidyl Blue-I (Wako), as described previously (18).
IHC of human tissue microarray.
To analyze the expression of CNNM4 or PRL3 in human colon cancers, a commercially available colon cancer tissue microarray (CO702; US Biomax) was used. Slides with 5-μm-thick, paraffin-embedded sections were deparaffinized, rehydrated, and placed in a 3% hydrogen peroxide solution to inhibit endogenous peroxidase activity. For staining CNNM4, the specimens were then subjected to heat-induced antigen retrieval at 110°C for 10 minutes with 10 mM sodium citrate buffer (pH 6.0) in a steamer (Decloaking Chamber NxGen), followed by the immunostaining procedure described previously (18). Specimens were observed under a microscope (BX41 equipped with a DP73 camera) and scored according to the staining intensity: positive (+), weak (+/–), and negative (–). For staining PRL3, the specimens were subjected to antigen retrieval and the immunostaining procedure reported by Li et al. (33). The specimens were observed under the same microscope and classified as PRL3-nonoverexpressed and -overexpressed samples.
Statistics.
All statistical data are presented as the mean ± SEM. P values were obtained by 2-tailed Student’s t test (to compare between the 2 specific groups; Figure 2B, Figure 5B, Figure 6, A and B, Figure 7C, and Figure 8, B, C, and E); ANOVA, followed by 2-tailed multiple Student’s t test with Bonferroni’s correction (to perform multiple comparisons of 3 or 4 groups; Figure 5, C and D, Figure 7, A and B, Supplemental Figure 4A, and Supplemental Figure 4B); ANOVA, followed by 2-tailed multiple Student’s t test with Holm-Bonferroni’s correction (to perform multiple comparisons between 5 or more groups, since standard Bonferroni’s correction is known to be too conservative in these cases; ref. 51, Figure 2C, and Figure 3, A and B); or by χ2 test (to analyze discontinuous values; Table 1). A P value of less than 0.05 was considered statistically significant.
Study approval.
All experiments involving mice were conducted in accordance with the guidelines for the proper conduct of animal experiments (issued by the Science Council of Japan) after receipt of approval from Osaka University.
Supplementary Material
Acknowledgments
We thank M. Okada and K. Saito for mass spectrometry; M. Giovannini for the ApcFlox14/+ mice; M. Okabe for the CAG-Cre mice; Q. Zeng for the PRL3 antibodies; T. Sawasaki, Y. Endo, H. Kidoya, N. Takakura, S. Kurisu, A. Inanobe, K. Furutani, Y. Kurachi, S. Higashiyama, M. Yamada, and K. Sekiguchi for technical advice; and T. Ogasawara, T. Terabayashi, M. Matsuda, A. Kawasaki, and H. Yamamoto for technical support. This study was supported by the Funding Program for Next-Generation World-Leading Researchers from the Japan Society for the Promotion of Science (JSPS) (LS083, to H. Miki); Exciting Leading-Edge Research Projects from Osaka University (to H. Miki); and Grants-in-Aid for Scientific Research from the JSPS and MEXT (26111007 and 26291042, to H. Miki; 22770195 and 23117710, to Y. Funato).
Footnotes
Conflict of interest: The authors have declared that no conflict of interest exists.
Reference information:J Clin Invest. 2014;124(12):5398–5410. doi:10.1172/JCI76614.
References
- 1.Fearon ER, Vogelstein B. A genetic model for colorectal tumorigenesis. Cell. 1990;61(5):759–767. doi: 10.1016/0092-8674(90)90186-I. [DOI] [PubMed] [Google Scholar]
- 2.Bessette DC, Qiu D, Pallen CJ. PRL PTPs: mediators and markers of cancer progression. Cancer Metastasis Rev. 2008;27(2):231–252. doi: 10.1007/s10555-008-9121-3. [DOI] [PubMed] [Google Scholar]
- 3.Saha S, et al. A phosphatase associated with metastasis of colorectal cancer. Science. 2001;294(5545):1343–1346. doi: 10.1126/science.1065817. [DOI] [PubMed] [Google Scholar]
- 4.Zeng Q, et al. PRL-3 and PRL-1 promote cell migration, invasion, and metastasis. Cancer Res. 2003;63(11):2716–2222. [PubMed] [Google Scholar]
- 5.Zimmerman MW, Homanics GE, Lazo JS. Targeted deletion of the metastasis-associated phosphatase Ptp4a3 (PRL-3) suppresses murine colon cancer. PLoS One. 2013;8(3):e58300. doi: 10.1371/journal.pone.0058300. [DOI] [PMC free article] [PubMed] [Google Scholar]
- 6.Guo K, Li J, Tang JP, Koh V, Gan BQ, Zeng Q. Catalytic domain of PRL-3 plays an essential role in tumor metastasis: formation of PRL-3 tumors inside the blood vessels. Cancer Biol Ther. 2004;3(10):945–951. doi: 10.4161/cbt.3.10.1111. [DOI] [PubMed] [Google Scholar]
- 7.Al-Aidaroos AQ, Zeng Q. PRL-3 phosphatase and cancer metastasis. J Cell Biochem. 2010;111(5):1087–1098. doi: 10.1002/jcb.22913. [DOI] [PubMed] [Google Scholar]
- 8.Rios P, Li X, Köhn M. Molecular mechanisms of the PRL phosphatases. FEBS J. 2013;280(2):505–524. doi: 10.1111/j.1742-4658.2012.08565.x. [DOI] [PubMed] [Google Scholar]
- 9.Laplante M, Sabatini DM. mTOR signaling in growth control and disease. Cell. 2012;149(2):274–293. doi: 10.1016/j.cell.2012.03.017. [DOI] [PMC free article] [PubMed] [Google Scholar]
- 10.Zoncu R, Efeyan A, Sabatini DM. mTOR: from growth signal integration to cancer, diabetes and ageing. Nat Rev Mol Cell Biol. 2011;12(1):21–35. doi: 10.1038/nrm3025. [DOI] [PMC free article] [PubMed] [Google Scholar]
- 11.Yuan HX, Xiong Y, Guan KL. Nutrient sensing, metabolism, and cell growth control. Mol Cell. 2013;49(3):379–387. doi: 10.1016/j.molcel.2013.01.019. [DOI] [PMC free article] [PubMed] [Google Scholar]
- 12.Hardie DG, Ross FA, Hawley SA. AMPK: a nutrient and energy sensor that maintains energy homeostasis. Nat Rev Mol Cell Biol. 2012;13(4):251–262. doi: 10.1038/nrm3311. [DOI] [PMC free article] [PubMed] [Google Scholar]
- 13.Mihaylova MM, Shaw RJ. The AMPK signalling pathway coordinates cell growth, autophagy and metabolism. Nat Cell Biol. 2011;13(9):1016–1023. doi: 10.1038/ncb2329. [DOI] [PMC free article] [PubMed] [Google Scholar]
- 14.Hemminki A, et al. A serine/threonine kinase gene defective in Peutz-Jeghers syndrome. Nature. 1998;391(6663):184–187. doi: 10.1038/34432. [DOI] [PubMed] [Google Scholar]
- 15.Jenne DE, et al. Peutz-Jeghers syndrome is caused by mutations in a novel serine threonine kinase. Nat Genet. 1998;18(1):38–43. doi: 10.1038/ng0198-38. [DOI] [PubMed] [Google Scholar]
- 16.Shackelford DB, Shaw RJ. The LKB1-AMPK pathway: metabolism and growth control in tumour suppression. Nat Rev Cancer. 2009;9(8):563–575. doi: 10.1038/nrc2676. [DOI] [PMC free article] [PubMed] [Google Scholar]
- 17.Schafer ZT, et al. Antioxidant and oncogene rescue of metabolic defects caused by loss of matrix attachment. Nature. 2009;461(7260):109–113. doi: 10.1038/nature08268. [DOI] [PMC free article] [PubMed] [Google Scholar]
- 18.Yamazaki D, et al. Basolateral Mg2+ extrusion via CNNM4 mediates transcellular Mg2+ transport across epithelia: a mouse model. PLoS Genet. 2013;9(12):e1003983. doi: 10.1371/journal.pgen.1003983. [DOI] [PMC free article] [PubMed] [Google Scholar]
- 19.Trinkle-Mulcahy L, et al. Identifying specific protein interaction partners using quantitative mass spectrometry and bead proteomes. J Cell Biol. 2008;183(2):223–239. doi: 10.1083/jcb.200805092. [DOI] [PMC free article] [PubMed] [Google Scholar]
- 20.Kozlov G, Cheng J, Ziomek E, Banville D, Gehring K, Ekiel I. Structural insights into molecular function of the metastasis-associated phosphatase PRL-3. J Biol Chem. 2004;279(12):11882–11889. doi: 10.1074/jbc.M312905200. [DOI] [PubMed] [Google Scholar]
- 21.Romani AM. Cellular magnesium homeostasis. Arch Biochem Biophys. 2011;512(1):1–23. doi: 10.1016/j.abb.2011.05.010. [DOI] [PMC free article] [PubMed] [Google Scholar]
- 22.Günther T. Concentration, compartmentation and metabolic function of intracellular free Mg2+. Magnes Res. 2006;19(4):225–236. [PubMed] [Google Scholar]
- 23.Vinogradov AD. Steady-state and pre-steady-state kinetics of the mitochondrial F(1)F(o) ATPase: is ATP synthase a reversible molecular machine? J Exp Biol. 2000;203(pt 1):41–49. doi: 10.1242/jeb.203.1.41. [DOI] [PubMed] [Google Scholar]
- 24.Chung J, Kuo CJ, Crabtree GR, Blenis J. Rapamycin-FKBP specifically blocks growth-dependent activation of and signaling by the 70 kd S6 protein kinases. Cell. 1992;69(7):1227–1236. doi: 10.1016/0092-8674(92)90643-Q. [DOI] [PubMed] [Google Scholar]
- 25.Kim SH, et al. Comparative proteomic analysis of mouse melanoma cell line B16, a metastatic descendant B16F10, and B16 overexpressing the metastasis-associated tyrosine phosphatase PRL-3. Oncol Res. 2009;17(11–12):601–612. doi: 10.3727/096504009789745494. [DOI] [PubMed] [Google Scholar]
- 26.Wu X, et al. Phosphatase of regenerating liver-3 promotes motility and metastasis of mouse melanoma cells. Am J Pathol. 2004;164(6):2039–2054. doi: 10.1016/S0002-9440(10)63763-7. [DOI] [PMC free article] [PubMed] [Google Scholar]
- 27.Peng L, et al. PRL-3 promotes the motility, invasion, and metastasis of LoVo colon cancer cells through PRL-3-integrin β1-ERK1/2 and-MMP2 signaling. Mol Cancer. 2009;8:110. doi: 10.1186/1476-4598-8-110. [DOI] [PMC free article] [PubMed] [Google Scholar]
- 28.Qian F, et al. PRL-3 siRNA inhibits the metastasis of B16-BL6 mouse melanoma cells in vitro and in vivo. Mol Med. 2007;13(3–4):151–159. doi: 10.2119/2006-00076.Qian. [DOI] [PMC free article] [PubMed] [Google Scholar]
- 29.Gobeil S, Zhu X, Doillon CJ, Green MR. A genome-wide shRNA screen identifies GAS1 as a novel melanoma metastasis suppressor gene. Genes Dev. 2008;22(21):2932–2940. doi: 10.1101/gad.1714608. [DOI] [PMC free article] [PubMed] [Google Scholar]
- 30.Hu JA, Li Y, Fang J. Effect of ERK inhibitor on pulmonary metastasis of inoculated human adenoid cystic carcinoma cells in nude mice. Oral Surg Oral Med Oral Pathol Oral Radiol Endod. 2010;109(1):117–123. doi: 10.1016/j.tripleo.2009.07.052. [DOI] [PubMed] [Google Scholar]
- 31.Colnot S, et al. Colorectal cancers in a new mouse model of familial adenomatous polyposis: influence of genetic and environmental modifiers. Lab Invest. 2004;84(12):1619–1630. doi: 10.1038/labinvest.3700180. [DOI] [PubMed] [Google Scholar]
- 32.Boivin GP, et al. Pathology of mouse models of intestinal cancer: consensus report and recommendations. Gastroenterology. 2003;124(3):762–777. doi: 10.1053/gast.2003.50094. [DOI] [PubMed] [Google Scholar]
- 33.Li J, et al. Generation of PRL-3- and PRL-1-specific monoclonal antibodies as potential diagnostic markers for cancer metastases. Clin Cancer Res. 2005;11(6):2195–2204. doi: 10.1158/1078-0432.CCR-04-1984. [DOI] [PubMed] [Google Scholar]
- 34.Wang H, et al. PCBP1 suppresses the translation of metastasis-associated PRL-3 phosphatase. Cancer Cell. 2010;18(1):52–62. doi: 10.1016/j.ccr.2010.04.028. [DOI] [PubMed] [Google Scholar]
- 35.Rubin H. Central role for magnesium in coordinate control of metabolism and growth in animal cells. Proc Natl Acad Sci U S A. 1975;72(9):3551–3555. doi: 10.1073/pnas.72.9.3551. [DOI] [PMC free article] [PubMed] [Google Scholar]
- 36.Rubin H. The logic of the Membrane, Magnesium, Mitosis (MMM) model for the regulation of animal cell proliferation. Arch Biochem Biophys. 2007;458(1):16–23. doi: 10.1016/j.abb.2006.03.026. [DOI] [PubMed] [Google Scholar]
- 37.Sahni J, Scharenberg AM. TRPM7 ion channels are required for sustained phosphoinositide 3-kinase signaling in lymphocytes. Cell Metab. 2008;8(1):84–93. doi: 10.1016/j.cmet.2008.06.002. [DOI] [PMC free article] [PubMed] [Google Scholar]
- 38.Schmitz C, et al. Regulation of vertebrate cellular Mg2+ homeostasis by TRPM7. Cell. 2003;114(2):191–200. doi: 10.1016/S0092-8674(03)00556-7. [DOI] [PubMed] [Google Scholar]
- 39.Wouters BG, Koritzinsky M. Hypoxia signalling through mTOR and the unfolded protein response in cancer. Nat Rev Cancer. 2008;8(11):851–864. doi: 10.1038/nrc2501. [DOI] [PubMed] [Google Scholar]
- 40.Sengupta S, Peterson TR, Sabatini DM. Regulation of the mTOR complex 1 pathway nutrients, growth factors, and stress. Mol Cell. 2010;40(2):310–322. doi: 10.1016/j.molcel.2010.09.026. [DOI] [PMC free article] [PubMed] [Google Scholar]
- 41.Fearon ER. Molecular genetics of colorectal cancer. Annu Rev Pathol. 2011;6:479–507. doi: 10.1146/annurev-pathol-011110-130235. [DOI] [PubMed] [Google Scholar]
- 42.Molinari F, Frattini M. Functions and regulation of the PTEN gene in colorectal cancer. Front Oncol. 2014;3:326. doi: 10.3389/fonc.2013.00326. [DOI] [PMC free article] [PubMed] [Google Scholar]
- 43.Marsh V, et al. Epithelial Pten is dispensable for intestinal homeostasis but suppresses adenoma development and progression after Apc mutation. Nat Genet. 2008;40(12):1436–1444. doi: 10.1038/ng.256. [DOI] [PubMed] [Google Scholar]
- 44.Sansom OJ, et al. Loss of Apc allows phenotypic manifestation of the transforming properties of an endogenous K-ras oncogene in vivo. Proc Natl Acad Sci U S A. 2006;103(38):14122–14127. doi: 10.1073/pnas.0604130103. [DOI] [PMC free article] [PubMed] [Google Scholar]
- 45.Jahnen-Dechent W, Ketteler M. Magnesium basics. Clin Kidney J. 2012;5(suppl 1):i3–i14. doi: 10.1093/ndtplus/sfr163. [DOI] [PMC free article] [PubMed] [Google Scholar]
- 46.Pham PC, Pham PA, Pham SV, Pham PT, Pham PM, Pham PT. Hypomagnesemia: a clinical perspective. Int J Nephrol Renovasc Dis. 2014;7:219–230. doi: 10.2147/IJNRD.S42054. [DOI] [PMC free article] [PubMed] [Google Scholar]
- 47.Zhang A, Fan SH, Cheng TP, Altura BT, Wong RK, Altura BM. Extracellular Mg2+ modulates intracellular Ca2+ in acutely isolated hippocampal CA1 pyramidal cells of the guinea-pig. Brain Res. 1996;728(2):204–208. doi: 10.1016/0006-8993(96)00401-5. [DOI] [PubMed] [Google Scholar]
- 48.Tashiro M, Inoue H, Konishi M. Magnesium homeostasis in cardiac myocytes of Mg-deficient rats. PLoS One. 2013;8(9):e73171. doi: 10.1371/journal.pone.0073171. [DOI] [PMC free article] [PubMed] [Google Scholar]
- 49.Colnot S, et al. Liver-targeted disruption of Apc in mice activates beta-catenin signaling and leads to hepatocellular carcinomas. Proc Natl Acad Sci U S A. 2004;101(49):17216–17221. doi: 10.1073/pnas.0404761101. [DOI] [PMC free article] [PubMed] [Google Scholar]
- 50.Kurisu S, Suetsugu S, Yamazaki D, Yamaguchi H, Takenawa T. Rac-WAVE2 signaling is involved in the invasive and metastatic phenotypes of murine melanoma cells. Oncogene. 2005;24(8):1309–1319. doi: 10.1038/sj.onc.1208177. [DOI] [PubMed] [Google Scholar]
- 51. Cleophas TJ, Zwinderman AH, Cleophas TF, Cleophas EP, eds. Statistics Applied to Clinical Trials. Heidelberg, Germany: Springer Science & Business Media; 2009. [Google Scholar]
Associated Data
This section collects any data citations, data availability statements, or supplementary materials included in this article.


