Abstract
Silver nanoparticles (Ag NPs) can be found in myriad consumer products, medical equipment/supplies, and public spaces. However, questions remain regarding the risks associated with Ag NP exposure. As part of a consortium-based effort to better understand these nanomaterials, this study examined how Ag NPs with varying sizes and coatings affect pulmonary responses at different time-points. Four types of Ag NPs were tested: 20 nm (C20) and 110 nm (C110) citrate-stabilized NPs, and 20 nm (P20) and 110 nm (P110) PVP-stabilized NPs. Male, Sprague Dawley rats were intratracheally instilled with Ag NPs (0, 0.1, 0.5, or 1.0 mg/kg bodyweight [BW]), and bronchoalveolar lavage fluid (BALF) and lung tissues were obtained at 1, 7, and 21 days post-exposure for analysis of BAL cells and histopathology. All Ag NP types produced significantly elevated polymorphonuclear cells (PMNs) in BALF on Days 1, 7, and/or 21 at the 0.5 and/or 1.0 mg/kg BW dose(s). Histology of animals exposed to 1.0 mg/kg BW Ag NPs showed patchy, focal, centriacinar inflammation for all time-points; though neutrophils, macrophages, and/or monocytes were also found in the airway submucosa and perivascular regions at Days 1 and 7. Confocal microscopy of ethidium homodimer-stained lungs at Day 1 showed dead/dying cells at branch points along the main airway. By Day 21, only animals exposed to the high dose of C110 or P110 exhibited significant BALF neutrophilia and marked cellular debris in alveolar airspaces. Findings suggest that 110 nm Ag NPs may produce lasting effects past Day 21 post instillation.
Nano silver (Ag) is the largest and fastest-growing class of nanoparticles (NPs) in consumer product applications (Quang Huy et al., 2013). However, questions remain as to the health and environmental effects of Ag NPs.
One of the most comprehensive papers thus far (Wang et al., 2013) examined (1) dissolution of the Ag NPs tested here in media; (2) effects of the Ag NPs and their ions in vitro; and (3) BALF and tissue responses at 40 h and 21 days post-exposure. Four types of Ag NPs were tested in vitro: 20 nm (C20) and 110 nm (C110) citrate-stabilized NPs, and 20 nm (P20) and 110 nm (P110) PVP-stabilized NPs. Two types, C20 and C110, were tested in vivo. Findings in vitro showed faster dissolution of 20 nm Ag NPs and a higher ability to produce cellular toxicity and/or oxidative stress than 110 nm particles irrespective of coating. Results also suggested that P110 may be complexing with released Ag+ thereby producing less cytotoxic effects in contrast to C110. The in vivo comparison of C20 and C110 citrate-coated Ag NPs indicated that C20 was more likely to produce acute neutrophilic influx into the lungs post oropharyngeal aspiration (OPA). On the other hand, C110 induced mild fibrotic responses in mice, at Day 21, due to slow and steady Ag+ release.
Work by Gliga et al. (2014) supported previous in vitro findings that small Ag NPs have faster rates of Ag dissolution, and higher cytotoxic potential than large ones at subacute time-points. Upon Ag NP exposure, human lung epithelial (BEAS-2B) cells exposed to Ag NPs (10, 40, or 75 nm) with citrate or PVP coatings had significant DNA damage 24 h after exposure, but only those exposed to 10 nm Ag NPs exhibited significantly decreased cell viability. Ag+ released into cell culture media did not produce cytotoxic responses, but intracellular Ag+ did. Different coatings (citrate vs PVP) on 10 nm Ag NPs produced no differences in Ag NP uptake or intracellular localization. Their research suggests that small (10 nm) Ag NPs are cytotoxic, independent of their surface coating, because of a higher intracellular Ag+ release rate.
Haberl et al. (2013) demonstrated that despite previous findings (Wang et al., 2013) indicating a lesser response than citrate-coated Ag NPs in vitro, PVP-coated Ag NPs are not entirely benign. Results showed that rats instilled with 250 µg of 70 nm PVP-coated Ag NPs exhibited significantly increased levels of lactate dehydrogenase (LDH), protein, neutrophils, and inflammatory cytokines in bronchoalveolar lavage fluid (BALF) 24 h post-exposure.
As above, much of the in vivo work in mammals has been limited to studying only one particle type (one coating type and/or size), at a limited dose range and/or post-exposure time frame. The unique contribution of the present study is that like Wang et al. (2013), we evaluate biological responses after Ag NP exposure by considering multiple factors (Ag NP dose, size, and coating as well as time post-exposure) shown separately in previous publications to affect Ag NP toxic responses in vivo and/or in vitro. Male Sprague Dawley (SD) rats were administered C20, C110, P20, or P110 Ag NPs (0, 0.1, 0.5, or 1.0 ml/kg bodyweight [BW]) through intratracheal instillation (IT). BALF and lung tissues were obtained for analysis at 1, 7, and 21 days post-exposure. Additionally, through the use of ethidium homodimer staining and confocal microscopy, we identified in situ the regions of the lungs most susceptible to Ag NP cytotoxicity at Day 1 post-exposure.
Findings in this study are also considered in relation to a companion paper (Anderson et al., 2014) reporting the Ag NP retention patterns for the same animals herein. Those results suggested differences due to coating and size with rapid clearance of PVP-versus citrate-coated Ag NPs in tissues, and large (110 nm) versus small (20 nm) particles in macrophages. Based on previous studies concerning acute Ag NP-related inflammation (Haberl et al., 2013), cytotoxicity (Gliga et al., 2014), and dissolution (Wang et al., 2013), we hypothesized that 20 nm Ag NPs would produce strong inflammatory and cytotoxic responses in contrast to 110 nm ones at Day(s) 1 and/or 7 post IT. Given in vivo studies showing Ag retention (Anderson et al., 2014) and/or histopathology (Wang et al., 2013), at later time-points, we also believed that 110 nm particles would produce changes indicative of lung inflammation and/or remodeling, and that citrate-coated Ag NPs would stimulate greater responses in contrast to PVP-coated ones at Day 21.
MATERIALS AND METHODS
Physicochemical characterization of stock Ag NPs
Four distinct Ag NP types were tested including 20 nm (C20) and 110 nm (C110) citrate-stabilized NPs (lot numbers MGM1659 and MGM1662, respectively), and 20 nm (P20) and 110 nm (P110) PVP-stabilized NPs (lot numbers MGM1665 and MGM1668, respectively). The PVP polymers were different for P20 and P110. P20 and P110 Ag NPs were coated with a 10 kDa PVP (ISP Technologies, Inc, Texas City, Texas), or a 40 kDa PVP (Calbiochem, San Diego, California) polymer, respectively. All four NP formulations were purchased from nanoComposix, Inc (San Diego, California), where each was synthesized as a custom-order, single batch from the BioPure line of materials, and supplied by the National Institute of Environmental Health Sciences Centers for Nanotechnology Health Implications Research (NCNHIR) consortium. Physicochemical particle characterization of Ag NPs received from nanoComposix was completed by the National Characterization Laboratory (Frederick, Maryland), and published in part (Wang et al., 2013).
Briefly, transmission electron microscope (TEM) images of all four particle types were taken to confirm the primary particle size and morphology. Dynamic light scattering (DLS) and zeta potential measurements were also completed to characterize the hydrodynamic size and electrostatic potential of the nanomaterials in aqueous media. Because silver ions have been shown to cause adverse health effects (Wang et al., 2013), both elemental Ag and free Ag+ concentrations were monitored for a period of 8 months before use. Inductively coupled plasma mass spectrometry (ICP-MS) was used to determine the elemental composition of the particles, and endotoxin content of the NP stock suspensions was also measured using the Kinetic Turbidity and Gel-clot limulus amebocyte lysate (LAL) assays. Additional characterization (TEM and DLS) of Ag NPs was performed as described by Anderson et al. (2014) to confirm particle size and dispersion prior to IT. Physicochemical characterization of the Ag NPs used herein is summarized in Table 1.
TABLE 1.
Physicochemical Characteristics of Ag NPs
| Property | Technique | C20 | C110 | P20 | P110 |
|---|---|---|---|---|---|
| Core diameter (nm) | TEM | 20 | 110 | 20 | 110 |
| Hydrodynamic diameter, Z-Avg (nm) | DLS | 24.0 | 104.2 | 26.0 | 112.3 |
| [Silver] (mg/g) | ICP-MS | 1.1 | 1.0 | 1.1 | 1.1 |
| [free Ag] (µg/g NP), % of total Ag | ICP-MS | 3.086 ± 0.118, 0.31 | 0.070 ± 0.003, 0.007 | 7.326 ± 0.278, 0.73 | 1.793 ± 0.18, 0.18 |
| [PVP] (µg/mg total Ag) | ICP-MS | · | · | 33.3 ± 0.3 | 62.4 ± 1.7 |
| Absorption (λmax nm) | UV–Vis | 402 | 412 | 402 | 507 |
| Zeta potential in H20 (mV) | Zetasizer | −43.1 ± 1.7 to −55.5 ± 1.0 | −38.0 ± 2.7 to −46.5 ± 1.2 | −32.5 ± 1.9 to −40.6 ± 1.6 | −23.3 ± 1.5 to −26.5 ± 0.8 |
| [Endotoxin] (EU/ml) | LAL | <0.5 | <0.5 | <2.1 | <0.5 |
Animal protocol
Male SD rats (Harlan Laboratories, Inc, Hayward, California), 12 weeks of age, were used for all experiments and maintained as previously described (Silva et al., 2013) in accordance with UC Davis Institutional Animal Care and Use Committee. Prior to exposure, animals were randomly assigned to treatment groups. Animal weights were recorded throughout the study to monitor overt signs of distress. Sentinel rats were maintained in the same room and tested to ensure experimental animals remained free of pathogens and/or parasites.
Preparation of Ag NP suspensions for IT
Ag NP stock suspensions were maintained in the dark at 4°C. Prior to instillations, stock suspensions were bath sonicated (Branson Ultrasonics 8510 bath sonicator, Danbury, Connecticut) for 5 min to resuspend settled Ag NPs and disperse agglomerates. Endotoxin-free water (Fisher Scientific, Pittsburgh, Pennsylvania) was used to dilute trisodium citrate dihydrate powder (Sigma, St Louis, Missouri), 10 kDa PVP buffer (ISP Technologies Inc), and 40 kDa PVP buffer (Calbiochem) to make 3 different sham control instillates, which also served as diluents for stock Ag NP suspensions. The citrate buffer (2 mM, pH 7.5) was used to dilute the citrate-stabilized Ag NP stock suspensions, whereas 10 kDa (33 µg/ml) and 40 kDa PVP buffers (62 µg/ml) were used to dilute the 20 and 110 nm PVP-stabilized materials, respectively. The buffers were then used for direct dilutions of the 1 mg/ml stock suspensions to make lower dose (0.5 and 0.1 mg/ml) suspensions.
Work was completed in a biosafety cabinet to ensure aseptic conditions. All dilutions were sonicated using the aforementioned protocols. All suspensions were prepared and loaded into 1 ml Monoject syringes fitted with 1.5 in., 22 gauge, blunt-tipped Monoject needles directly before IT. Sonication, syringe loading, and IT were coordinated to ensure the highest degree of particle dispersion.
Intratracheal instillation
Food was removed from the animal cages 2 h prior to IT. Animals were instilled with Ag NP suspensions at 0, 0.1, 0.5, or 1.0 ml/kg BW using procedures previously described (Anderson et al., 2014; Silva et al., 2013). Animals weighed more than 0.30 kg, so the doses tested (0, 0.1, 0.5, and 1.0 mg/kg) corresponded to more than 0, 30, 150, and 300 µg of Ag NPs per rat, respectively. This manner of dosing ensured all animals were given an equivalent volume of liquid (0, 0.1, 0.5, and 1.0 ml/kg) and mass of particles normalized to BW.
For each Ag NP type, a sample size of 72 rats was used for these initial IT studies. There were 6 animals per dose (including controls) and 24 rats per time-point (1, 7, and 21 days post-exposure). Subsequent studies were completed with 16 additional animals exposed to either 1.0 mg/kg BW Ag NPs (C20, C110, P20, or P110 [n = 3]) or sham control (citrate, 10 kDa PVP, or 40 kDa PVP buffers [n = 2]) as above, and sacrificed 1 day post instillation for analysis of airway cytotoxicity using ethidium homodimer.
Currently, the recommended threshold limit values set by the American Conference of Governmental Industrial Hygienists (ACGIH) for soluble and insoluble silver are 0.01 mg/m3 and 0.1 mg/m3, respectively. Personal consumer product (Quadros and Marr, 2011), and occupational exposures (Lee et al., 2011, 2012) to Ag NPs have been estimated and/or measured at well below the ACGIH limits (75 ng, 2.43 µg/m3, and 1.02 µg/m3, respectively). However, aerosolized nano silver has also been measured in an Ag manufacturing plant at a peak area concentration of more than 290 µg/m3 and shown to increase while the Ag NP production reactor was running during working hours (Lee et al., 2012). Although workers were not exposed to this high concentration in the study reported by Lee et al. (2012), the 290 µg/m3 concentration was used to correlate the instilled doses herein to potentially high exposures which may occur in countries where occupational safeguards are less stringent and/or non-existent.
Humans have a deposition fraction of more than 10%–40% when breathing particles ranging from 0.015 to 0.71 µm mass median aerodynamic diameter (MMAD) (Bair, 1995; Geiser and Kreyling, 2010). Given a ventilation rate of 20 l/min (Galer et al., 1992), and an alveolar epithelium surface area of more than 102 m2 (Stone et al., 1992), exposure to 290 μg/m3 Ag NPs would produce more than 11, 55, and 218 μg Ag NPs/m2 alveolar epithelium after 1 day, 1 week, and 1 month, respectively. The alveolar epithelium of a SD rat has a surface area of more than 0.4 m2 (Stone et al., 1992), so the 0.1, 0.5, and 1.0 mg/kg BW Ag NP doses used in this study would result in 87.5, 437.5, and 875 μg Ag NPs/m2 alveolar epithelium, respectively, for an average 350 g rat. These doses approximate human occupational exposures to Ag NPs after 2 weeks, 2 months, and 4 months in a light work environment. However, considering (1) the ACGIH limits, (2) personal occupational exposures measured at 1.02 µg/m3 (Lee et al., 2011) and 2.43 µg/m3 (Lee et al., 2012), and (3) an estimated dose of 75 ng Ag NPs from consumer products (Quadros and Marr, 2011), the doses tested herein would approximate a worst-case scenario.
Collection and analysis of BALF and lung tissue samples
At 1, 7, or 21 days post Ag NP exposure, animals were weighed and euthanized with an intraperitoneal injection of Beuthanasia-D, and BALF and lung tissue samples were collected and processed as previously described (Anderson et al., 2014) for all animals not included in ethidium homodimer studies. BALF supernatant was separated from BALF cells and saved for same-day protein (Bio-Rad Modified Bradford, Hercules, California) and LDH (Thermo Scientific, Rockford, Illinois) analyses. BALF cells were resuspended in more than 2 ml 0.9% sterile saline for determination of total cell numbers and cell viability with a hemocytometer and Trypan Blue exclusion dye, respectively. Cell differentials were determined using brightfield microscopy by counting a minimum of 500 cells from a 100 ml cytospin slide stained with Diff Qwik (Dade Behring Inc, Newark, Delaware). All analyses on BALF supernatant and cells were blinded.
Separate NUNC cryovials were used to freeze the lavaged right lung lobes (cranial, middle, and accessory), apex of the heart, spleen, kidney, and liver at −80°C for ICP-MS analysis as described by Anderson et al. (2014). The left lung was fixed hydrostatically (30 cm) using 4% paraformaldehyde (PF) for 1 h then stored in the same fixative. After 24 and 48 h, respectively, left lungs were transferred to ethanol, then micro-dissected, dehydrated, sectioned, and placed on slides for staining as previously described (Silva et al., 2013). Tissue sections were stained for analysis of cellular infiltrates and epithelial abnormalities using Hematoxylin and Eosin stains (H&E) (Harris Hematoxylin and Eosin Y Stain). Alcian Blue/Periodic Acid Schiff (AB/PAS) stain was used to detect changes in the number of mucus-secreting goblet cells in the airways and the types of mucosubstances being secreted. Both stains were obtained from American MasterTech, Inc, Lodi, California. Blind, semi-quantitative histological assessment of H&E slides was then performed using an ordinal scoring system (Table 2) designed to distinguish the degree of lung inflammation in the H&E-stained tissue sections. Severity scores ranging from 0 to 4 were used, and severity was assessed by noting the most advanced grade present within the specific sample irrespective of its horizontal extent. Extent was defined as the horizontal distribution of the pathology, where a score of 0, 1, 2, or 3 meant none of the lung was involved, less than or equal to 1/3 involvement, 1/2 involvement, or more than or equal to 2/3 involvement, respectively. Inflammatory extent was also characterized by descriptors “patchy” versus “continuous” and “focal” versus “diffuse.” However, the overall score was defined as a combined assessment of severity and extent (overall score = severity × extent).
TABLE 2.
Semi-quantitative Histopathology Scoring Rubric
| Score | Description |
|---|---|
| 0 | Normal. Thin alveolar walls, with very few free macrophages in the lumen. No inflammatory cells. Respiratory epithelium 1 cell-layer thick. Normal smooth muscle and submucosal layers. Vascular endothelium clear of influxing monocytes and inflammatory cells. No visible particle agglomerates. Little/no cells at the pleura. |
| 1 | Influx of PMNs (neutrophils and/or eosinophils) into perivascular cuff and airway submucosa. |
| 2 | PMNs present in perivascular cuff, airway submucosa, and alveolar airspace. Influx of monocytes and macrophages into alveolar airspace and monocytes in perivascular cuff. |
| 3 | Presence of PMNs, macrophages, and monocytes in alveolar airspaces along with cellular debris (exudate). Influxing cells in the perivascular cuff and/or airway submucosa. Thickened alveolar walls with or without accompanying granuloma(s). |
| 4 | Presence of PMNs and/or foamy and/or irregular macrophages (eg, multi-nucleated, or exhibiting loss of membrane integrity) and cellular exudate in the airspaces. Thickened alveolar walls with or without accompanying granuloma(s). |
For ethidium homodimer experiments specifically (Sutherland et al., 2012), the trachea was cannulated, and lungs were inflated in chest to capacity with 37°C ethidium homodimer in Ham’s F-12 nutrient mixture for 15 min. This process labeled the nuclei of any membrane-permeable cells fluorescent red. Next, each whole lung was lavaged 3× with a 9 ml aliquot of 37°C F-12 nutrient mixture to remove unincorporated ethidium. Each lung was fixed via IT in chest with 330 mOsmol Karnovsky’s fixative (Karn) for 1 h, and stored in a Qorpak jar in the dark until use. Prior to visualization with confocal microscopy (Leica TCS LSI), fixed whole lungs were bisected along the long axis to expose the main airway. Lungs were secured to coverslips using Nexaband tissue adhesive, placed in petri dishes, and kept moist with phosphate-buffered saline during viewing.
Statistical analysis
Data are presented as mean ± standard error of the mean. JMP 10.0.0 statistical software (Cary, North Carolina) was used to perform analysis of variance (ANOVA) and post hoc Tukey’s range tests with a significance level of P ≤ 0.05. These analyses considered the main effects of and interactions between the variable factors of dose, time, and Ag NP coating and size. Outliers were identified via box plots and Grubb’s outlier tests. Log transformations were performed to correct skewness and/or kurtosis. Although histopathology scores were categorical, these data were treated as continuous after confirming ANOVA assumptions were met. ANOVA was chosen over categorical analyses to (1) enable tests of interactions between independent variables; and (2) control for Type I and II errors, which can be incurred by multiple separate non-parametric analyses.
RESULTS
BALF Bioassays
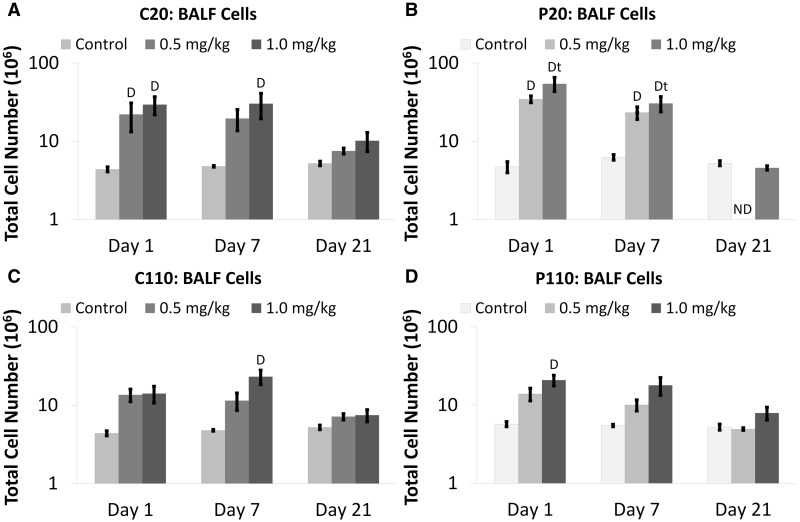
Preliminary analyses showed that animals instilled with Ag NPs at 0.1 mg/kg BW exhibited no significant differences from sham controls irrespective of the measured BALF endpoint (data not shown), and were excluded from further analysis and discussion. Total cell numbers in BALF were significantly elevated at Days 1 and/or 7, in animals exposed to the highest dose (1.0 mg/kg BW) of Ag NPs (Fig. 1) versus sham controls. Instillation of 0.5 mg/kg BW of C20 or P20 also produced significantly increased cell numbers at Day 1 (Figs. 1A and 1B, respectively). The inflammation noted for P20 exposure (1.0 mg/kg BW dose) was significantly higher at Days 1 and 7 than Day 21 (Fig. 1B). There were no significant differences between Ag NPs with different coatings (citrate vs PVP) or sizes (20 vs 110 nm). However, total cell numbers due to C110 exposure peaked at Day 7, whereas P110 exposure produced a peak at Day 1 (Figs. 1C and 1D, respectively). By Day 21, total cell numbers were equivalent to sham controls in all Ag NP-exposed animals.
FIG. 1.
Citrate- and PVP-coated Ag NPs increase total BALF cells. Panels show absolute numbers of total cells Days 1–21 post IT of C20 (A), P20 (B), C110 (C), or P110 (D). Results are from ANOVA considering the interaction between dose, time, and Ag NP coating and size. Analyses were run at P ≤ 0.05 with log-transformed values and presented (above) on log scales. “D”—difference from the sham control group (same panel, same day). “t”—difference from Day 21 only (same panel, same dose). “ND”—no data.
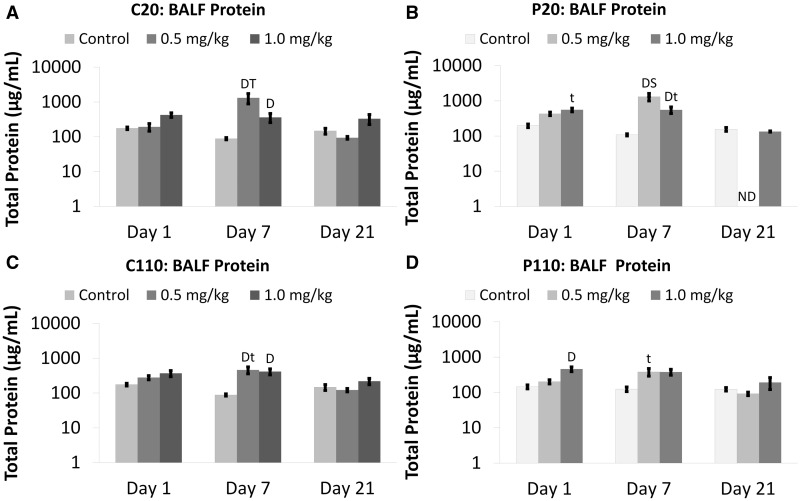
Significant BALF protein concentrations were found primarily at Day 7 for Ag NP-exposed animals (0.5 and 1.0 mg/kg doses) in contrast to sham controls (Fig. 2). Only P110 produced a significant amount of protein at Day 1 (Fig. 2D). However, all Ag NPs (0.5 or 1.0 mg/kg BW dose) produced protein concentrations that were significantly higher at Day 7 than Day 21 (Fig. 2). Although no significant differences were observed for Ag NPs with different coatings, IT of 0.5 mg/kg P20 produced significantly higher protein concentrations than P110 at post-exposure Day 7 (Fig. 2B). A similar (insignificant) trend was noted for C20 vs C110 Ag NPs. (Fig. 2A).
FIG. 2.
Citrate- and PVP-coated Ag NPs increase total BALF protein. Panels show total protein Days 1–21 post IT of C20 (A), P20 (B), C110 (C), or P110 (D). Results are from ANOVA considering the interaction between dose, time, and Ag NP coating and size. Analyses were run at P ≤ 0.05 with log-transformed values and presented (above) on log scales. “D”—difference from the sham control group (same panel, same day). “T”—differences from multiple groups (same panel, same dose, different days). “t”—difference from Day 21 only (same panel, same dose). “S”—difference from a group given Ag NPs of a different size (different panel, same day). “ND”—no data.
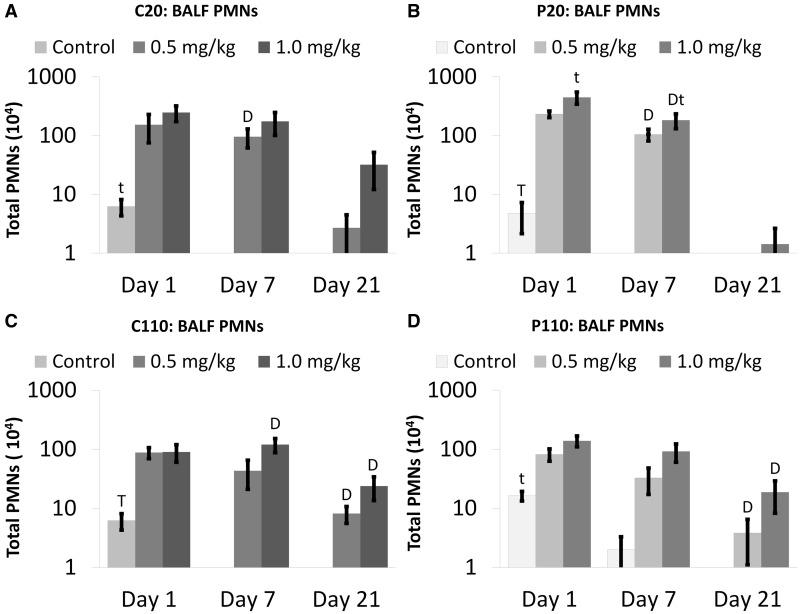
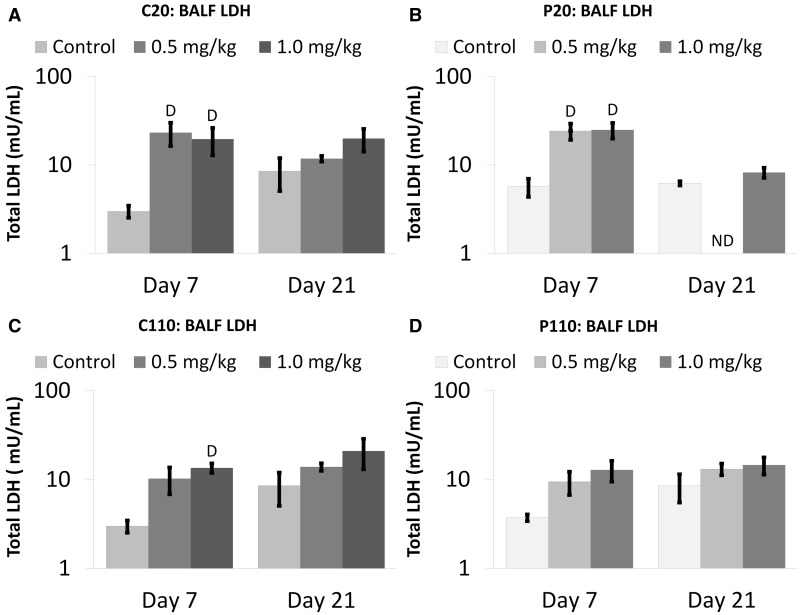
No significant differences were observed due to Ag NP type (size and/or coating) when analyzing BALF polymorphonuclear (PMN) cells (neutrophils and eosinophils) and LDH concentrations (Figs. 3 and 4, respectively). Significant numbers of inflammatory PMNs noted at Day 7 post IT of C20 or P20, at the 0.5 and/or 1.0 mg/kg BW doses versus sham control, resolved by Day 21 (Figs. 3A and 3B, respectively). At these same doses, C110 or P110 exposure produced significant PMN influxes at Days 7 and/or 21 (Figs. 3C and 3D, respectively). Despite that significant PMNs were only noted at Day 21 post C110 or P110 (and not C20 or P20) instillation, there were no significant differences in PMN numbers at this day that could be attributable to Ag NP size. Neutrophilia was significantly higher at Day 1 versus 21 in all sham control animals (Fig. 3). Those exposed to P20 (1.0 mg/kg BW) also exhibited acutely stronger inflammatory responses (Fig. 3B).
FIG. 3.
Citrate- and PVP-coated Ag NPs produce influx of PMNs in BALF. Panels show absolute numbers of total PMN cells (neutrophils and eosinophils) Days 1–21 post IT of C20 (A), P20 (B), C110 (C), or P110 (D). Results are from ANOVA considering the interaction between Ag NP dose and time. Analyses were run at P ≤ 0.05 with log-transformed values, and presented (above) on log scales. “D”—difference from the sham control group (same panel, same day). “T”—differences from multiple groups (same panel, same dose, different days). “t”—difference from Day 21 only (same panel, same dose).
FIG. 4.
Citrate- and PVP-coated Ag NPs produce increased extracellular LDH in BALF. Panels show total concentrations of lactate dehydrogenase (LDH) Days 1–21 post IT of C20 (A), P20 (B), C110 (C), or P110 (D). Results are from ANOVA considering the interaction between dose, time, and Ag NP coating and size. Analyses were run at P ≤ 0.05 with log-transformed values, and presented (above) on log scales. “D”—difference from the sham control group (same panel, same day). “T”—differences from multiple groups (same panel, same dose, different days). “t”—difference from Day 21 only (same panel, same dose).
All Ag NPs (except P110) produced significant increases in BALF LDH in contrast to control, at Day 7 (but not Day 21) when instilled at a dose of 1.0 mg/kg BW (Fig. 4). C20 and P20 (but not C110) also produced significantly higher LDH concentrations than sham controls at the 0.5 mg/kg BW dose (Figs. 4A and 4B, respectively).
Changes in the Lung Parenchyma
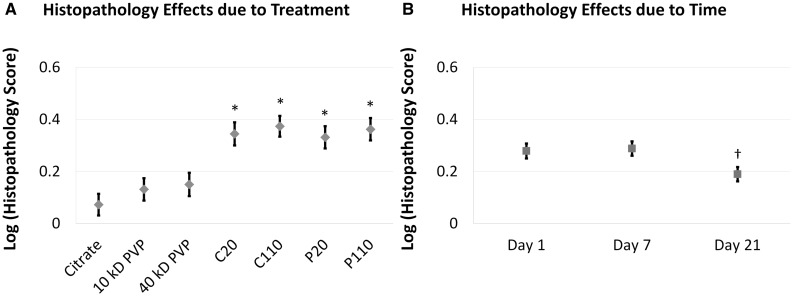
Semi-quantitative histopathology scoring of H&E-stained slides showed significant main effects due to treatment and time post-exposure (Fig. 5). Systematically higher responses were noted upon Ag NP instillation versus sham controls (Fig. 5A), and upon post-exposure Day 7 versus 21 (Fig. 5B). (Responses at Day 1 were intermediate with no detectable differences vs Days 7 or 21.) No significant effects were noted due to the interaction of treatment and time suggesting that the magnitude of the treatment effect was essentially the same at each time-point, and no differences were noted between animals given Ag NPs with different sizes and/or coatings.
FIG. 5.
Semi-quantitative scoring reveals significant main effects due to treatment and time. Results are from an ANOVA model considering the main effects and interactions (not shown) between treatment (A) and time post instillation (B). The analysis was run at P ≤ 0.05 with log-transformed values to satisfy the normality requirement for ANOVA. “*”—Difference from corresponding sham control group (C20/C110 vs Citrate, P20 vs 10 kDa PVP, or P110 vs 40 kDa PVP). “†”—Different from Day 7.
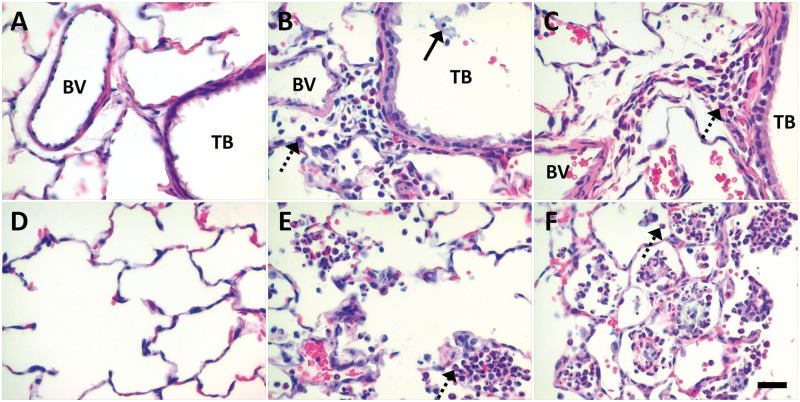
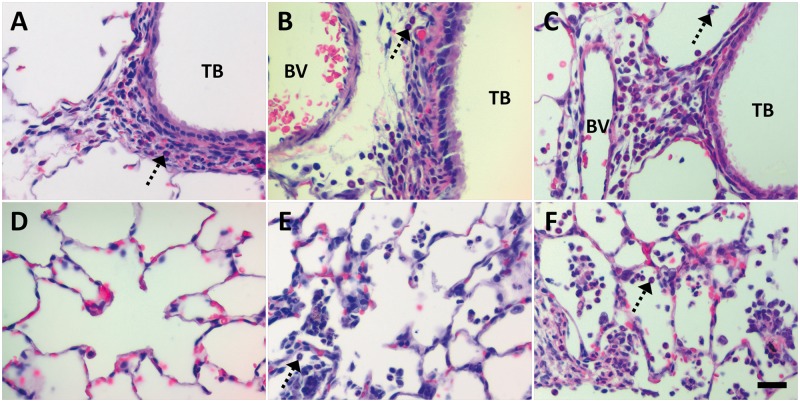
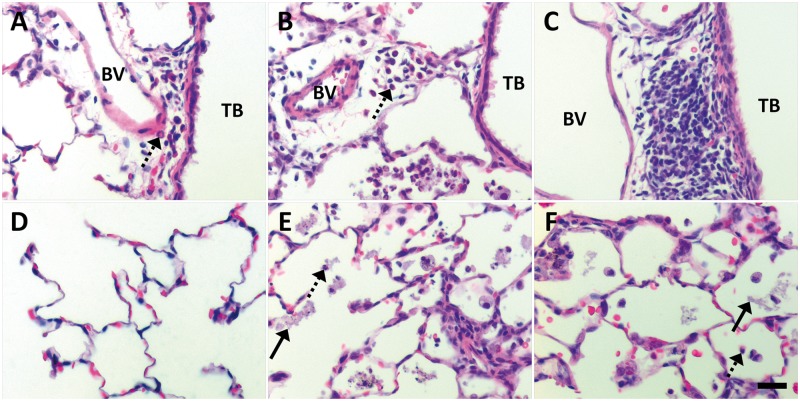
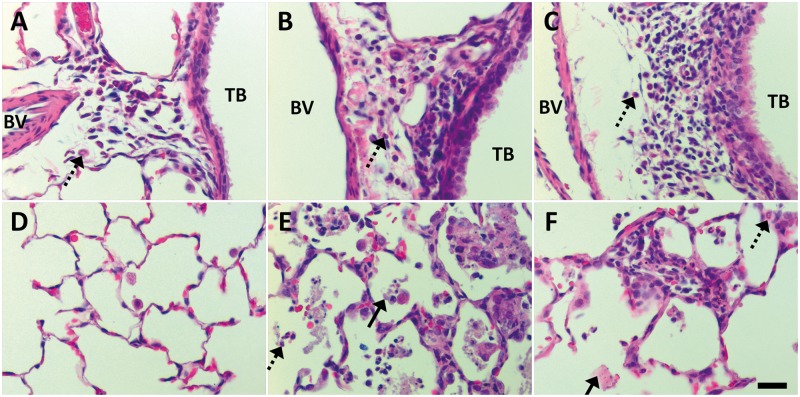
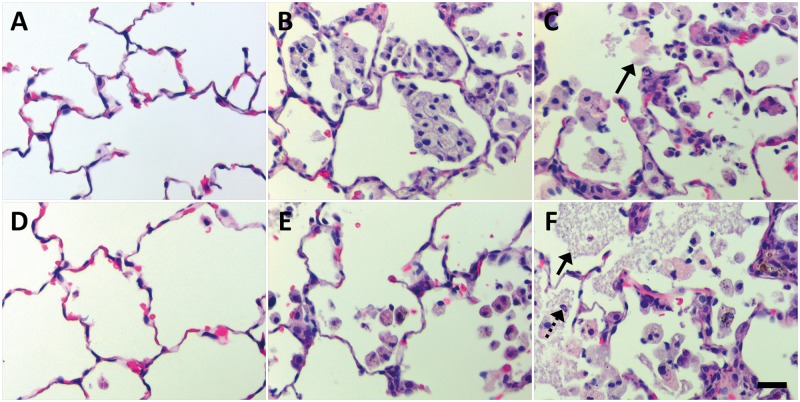
Qualitative differences were also noted. At post-exposure Day 1, animals instilled with citrate buffer (Figs. 6A and 6D) showed little/no inflammatory reactions in the lungs. These results contrasted findings in animals administered PVP buffer (Fig. 7A) or citrate-coated Ag NPs (Figs. 6B, 6C, 6E and 6F). Animals exposed to 10 or 40 kDa PVP buffer demonstrated influx of PMNs into the perivascular region and airway submucosa (Fig. 7A). This inflammation was generally patchy, and similar to Ag NP-exposed animals (Figs. 6B and 6C, and 7B and 7C) in that it usually occurred in discontinuous focal spots involving less than one-third of the total lung section. However, only instillation of Ag NPs produced centriacinar inflammation with increased neutrophils, monocytes, and macrophages in the alveolar airspaces at Day 1 post-exposure (Figs. 6E and 6F, and 7E and 7F). This pattern of inflammation continued to Day 7, with animals exhibiting a decrease in the presence of neutrophils, an increase in monocytes and macrophages, and/or an accumulation of cellular exudate/debris in the alveolar airspaces after Ag NP IT (Figs. 8 and 9). Findings of centriacinar inflammation, cellular debris, and increased macrophages/monocytes on Days 1 and 7 in the present study correlate with autometallography findings by Anderson et al. (2014) of silver present in the terminal bronchiole–alveolar duct junction, and silver uptake by clara cells and macrophages in the region. By Day 21 (Fig. 10), foamy macrophages dominated clearly in centriacinar regions. Although lung tissues suggested an overall decrease in inflammatory PMNs, the continued presence of cellular exudate along with irregular and/or multi-nucleated macrophages suggested that Ag NPs (especially C110 and P110) were still producing cytotoxic effects at this later time-point. Indeed, with large, foamy, and/or particle-laden macrophages (Fig. 10) clumping in the alveolar airspaces, these findings suggest that at 21 days post-exposure, clearance is still ongoing. Indications of cytotoxicity and thickening of the alveolar walls (Figs. 10C and 10F) suggest that remodeling is also occurring.
FIG. 6.
At Day 1 post IT, citrate-coated Ag NPs produced marked perivascular and alveolar inflammation in contrast to sham control. Panels are brightfield microscopy images contrasting the most severe responses in H&E-stained tissue sections, from rats instilled with a single dose of 1.0 ml/kg citrate buffer (sham control [A, D]), C20 (B, E), or C110 (C, F). Broken arrows indicate PMNs influxing from blood vessels (BVs) to sub-epithelial regions of the terminal bronchioles ([TBs], A–C), or collecting in alveolar airspaces (D–F). Solid arrow shows epithelial sloughing. Scale bar is 25 µm.
FIG. 7.
Influx of PMNs at Day 1 post IT of PVP or PVP-coated Ag NPs. Panels are brightfield microscopy images contrasting the most severe responses in H&E-stained tissue sections, from rats instilled with a single dose of 1.0 ml/kg 10 kDa PVP buffer (sham control [A, D]), P20 (B, E), or P110 (C, F). Response to 40 kDa PVP buffer is not shown but similar to that in Panels A and D. Broken arrows indicate PMNs influxing from BVs to sub-epithelial regions of the TBs (A–C), or collecting in alveolar airspaces (D–F). Scale bar is 25 µm.
FIG. 8.
Extravasation and destruction of phagocytic macrophages and PMNs at Day 7 post IT of citrate or citrate-coated Ag NPs. Panels are brightfield microscopy images contrasting the most severe responses in H&E-stained tissue sections, from rats instilled with a single dose of 1.0 ml/kg citrate buffer (sham control [A, D]), C20 (B, E), or C110 (C, F). Broken arrows indicate PMNs influxing from BVs to sub-epithelial regions of the TBs (A–C), or collecting in alveolar airspaces (D–F). Solid arrows show cellular exudate resulting from Ag NP exposure. Scale bar is 25 µm.
FIG. 9.
At Day 7 post IT, PVP and PVP-coated Ag NPs produce marked perivascular and/or alveolar inflammation. Panels are brightfield microscopy images contrasting the most severe responses in H&E-stained tissue sections, from rats instilled with a single dose of 1.0 ml/kg 40 kDa PVP buffer (sham control [A, D]), P20 (B, E), or P110 (C, F). Response to 10 kDa PVP buffer is not shown but similar to that in Panels A and D. Broken arrows indicate PMNs influxing from BVs to sub-epithelial regions of the TBs (A–C), or collecting in alveolar airspaces (D–F). Solid arrows show cellular exudate resulting from Ag NP exposure. Scale bar is 25 µm.
FIG. 10.
At Day 21 post IT of Ag NPs, foamy and irregular macrophages dominate the alveolar airspaces. Panels are brightfield microscopy images contrasting the most severe responses in H&E-stained tissue sections, from rats instilled with a single dose of 1.0 ml/kg citrate buffer (sham control [A]), C20 (B), C110 (C), 40 kDa PVP buffer (sham control [D]), P20 (E), or P110 (F). Response to 10 kDa PVP buffer is not shown but similar to that in Panel D. Broken arrows indicate remaining PMNs. Solid arrows show cellular exudate resulting from Ag NP exposure. Scale bar is 25 µm.
Analysis of AB/PAS-stained slides suggested that there may be differences due to Ag NP exposure versus sham control. However, tissues were sectioned specifically for examination of the main airway, and most of the changes in mucin were observed in daughter branches. Because daughter branches were not visible in all sections, quantification of the volume of mucin-positive cells/surface area of basal lamina was not possible.
Subacute Cytotoxic Responses in the Main Airway
Confocal microscopy of ethidium homodimer-stained lungs at Day 1 post instillation of suspended Ag NPs or sham control buffers (1.0 ml/kg BW) showed dead/dying cells at various points along the main airway and/or lung parenchyma (summarized in Table 3). All animals exposed C20 and C110, a few animals exposed to P20 (1/3) or P110 (2/3), and no animals exposed to sham controls were observed with black deposits underlying (C20 only), adjacent, and/or separate from ethidium-positive cells. Additionally, when observed using brightfield microscopy, the same lungs showed luminous, punctate, accumulations in the main airways, terminal bronchioles and immediate parenchyma (Supplementary Fig. 1). These findings suggest that the deposits may be Ag NPs. Results correlate with histopathological findings of centriacinar inflammation, and a previous report (Anderson et al., 2014) of silver localized in the terminal bronchiole–alveolar duct junctions at post-exposure Day 1.
TABLE 3.
Frequency of Positive In Situ Ethidium Homodimer Staining in the Main Airway
| Locations and of Features of Staining | Citrate Buffer | C20 | C110 | 10 kDa PVP Buffer | P20 | 40 kDa PVP Buffer | P110 |
|---|---|---|---|---|---|---|---|
| Proximala points or branches along main airway | 0/2 | 3/3 | 1/3 | 1/2 | 1/3 | 1/2 | 2/3 |
| Medialb points of branches along the main airway | 2/2 | 3/3 | 3/3 | 2/2 | 3/3 | 2/2 | 3/3 |
| Distalc points or branches along main airway | 2/2 | 3/3 | 3/3 | 0/2 | 2/3 | 0/2 | 3/3 |
| Parenchyma | 0/2 | 3/3 | 2/3 | 0/2 | 1/3 | 0/2 | 2/3 |
| Patchy distribution | 2/2 | 2/3 | 2/3 | 0/2 | 3/3 | 0/2 | 3/3 |
| Areas with ≤5 positive cells | 2/2 | 3/3 | 3/3 | 1/2 | 3/3 | 1/2 | 3/3 |
| Areas with ≥6 positive cells | 0/2 | 3/3 | 1/3 | 1/2 | 0/3 | 1/2 | 0/3 |
TFN“a,b, and c” indicate reference points with respect to the head.
DISCUSSION
Effects Due to Dose
This study evaluated biological responses after Ag NP instillation considering Ag NP dose, size, coating, and recovery time post-exposure. Significant inflammation resulted following instillation of Ag NPs (vs sham controls), at the 0.5 and/or 1.0 mg/kg BW doses throughout the time course (Figs. 1–10). Findings concur with other bolus IT, oral, or OPA exposure studies (Haberl et al., 2013; Park et al., 2010; Wang et al., 2013) with Ag NPs administered at high dose rates. However, at least one (low dose rate) inhalation study (Stebounova et al., 2011) found that mice exposed to uncoated Ag NPs (5 ± 2 nm) at 3 mg/m3, 4 h/day, for 10 days showed minimal inflammatory or cytotoxic responses. Previous research further suggests that in order to achieve significant effects upon inhalation of Ag NPs, animals must be exposed repeatedly (6 h/day, 5 days/week, for 13 weeks in a whole body exposure chamber) to aerosolized Ag NP concentrations much greater than ACGIH limit of 0.1 mg/m3 (Sung et al., 2009). Collectively, these findings suggest that inflammatory and cytotoxic responses observed post Ag NP exposure in this study may be the result of the IT dose rate, which can differ from inhalation by several orders of magnitude. Instillation, rather than inhalation, was the chosen route of exposure in this study to control dosimetry for determination of dose responses. However, inflammation is relatively less robust upon exposure to NPs at a low/steady rate versus a large bolus (Baisch et al., 2014; Silva et al., 2014). To better approximate and understand risks associated with human (occupational) exposures to Ag NPs, complementary inhalation experiments should also be performed.
Effects Due to Size
Hamilton et al. (2014) showed that upon C20 or P20 exposure (vs sham control), various human/murine lung macrophage cell lines exhibited increased IL-1β, a measure of NLRP3-inflammasome activation, which influences inflammation and apoptosis. At 24 h post-exposure, this was correlated with increased extracellular LDH, and concomitant decrements in cell viability. In contrast, C110 and P110 exposure produced no significant effects compared with sham control.
In the current study, aside from higher BALF protein concentrations in P20 versus P110-instilled animals at Day 7 (Fig. 2B), no other significant differences were noted due to Ag NP size when using a particle mass dose metric. However, because the dose range used (0, 0.1, 0.5, and 1.0 mg/kg BW) corresponded to approximately 0, 682, 3,410, 6,821 (109) C20 or P20 Ag NPs in contrast to 0, 4, 20, and 41 (109) C110 or P110 particles, and resulted in particle number doses that differed by at least one order of magnitude, findings suggest that larger Ag NPs are relatively more potent when using the latter dose metric. Because Ag ions may be cytotoxic and/or inflammatory (Gliga et al., 2014; Hamilton et al., 2014; Wang et al., 2013), and previous reports using the same Ag NPs (Hamilton et al., 2014; Wang et al., 2013) suggest small Ag NPs shed Ag+ faster than large ones, it is possible that herein, significant inflammatory PMN responses (Fig. 3) to the latter at Day 21 are due to lagging dissolution rates. In this case, no significant differences were detected between 20 nm- and 110 nm-Ag NP-exposed animals.
Effects Due to Coating
Significant differences were not noted between citrate and PVP-coated Ag NPs irrespective of the biological endpoint examined. Results contrast findings in previous studies suggesting that citrate-coated Ag NPs produce greater and/or longer-lasting effects due to a greater ability of PVP-coated Ag NPs to complex released Ag+ (Wang et al., 2013), or faster clearance of PVP-coated Ag NPs (Anderson et al., 2014).
To illustrate that P110 Ag NPs may be complexing released Ag+ thereby producing minimal cytotoxic responses in contrast to C110, Wang et al. used in vitro models. To test whether P110 was less cytotoxic than C110 due to Ag+ complexation, a mitochondrial targeting sequence (MTS) colorimetric assay was performed on BEAS-2B cells exposed to PVP or citrate buffers, or AgNO3, a source of Ag+. Results showed that unlike the PVP buffers, citrate was unable to reduce the Ag+ bioavailability, and resultant adverse effect on cell viability, through complexation. Several researchers have shown that in vitro studies cannot duplicate the complexity and variability of the biological milieu in vivo. Stebounova et al. (2011) showed that Ag NPs (avg. 10 nm) incubated for 24 h, at 38°C, in Gambles solution or artificial lysosomal fluid, which mimic interstitial lung fluid and macrophage phagosomal fluid, respectively, exhibited no dissolution. Scanlan et al. (2013) noted that dissolution studies with Ag nanowires in abiotic media could not account for the toxicity observed in their Daphnia magna (water flea) model, in which morphological changes consistent with coating loss were noted. Therefore, given that the Ag+ release rate is variable depending upon multiple factors (eg, Ag NP size and surface area, as well as ambient conditions [Gliga et al., 2014; Hamilton et al., 2014; Kim and Shin, 2014; Wang et al., 2013]), it is plausible that when introduced in vivo, Ag NPs, released Ag+, and/or NP coating interactions with the biological environ will produce different responses (in severity, extent, and/or mechanism) than predicted in vitro.
It is important to note that lack of significant findings in this study does not statistically negate the possibility that Ag NP coatings actually do produce different post-exposure responses. If citrate- versus PVP-coated Ag NPs are more inflammatory, and/or abundant at later time-points as suggested, it is possible that they are activating cells to a higher degree, causing them to stick more firmly to the airway epithelium instead of being collected in BALF. Moreover, in this study, left lung lobes were used for histological examination; and right lung lobes were used to quantify silver retention post IT (Anderson et al., 2014). Instillation of particles produces heterogeneous inter- and/or intra-lobular deposition patterns in contrast to inhalation (Driscoll et al., 2000). Certainly, considering that 5 µm sections were examined for histology herein, and whole lung lobes were tested via ICP-MS (Anderson et al., 2014), findings in the latter are broader in scope by orders of magnitude. These factors may contribute to the lack of significantly different responses in the current study, post-exposure to citrate- versus PVP-coated Ag NPs.
Effects Due to Recovery Time
In accordance with research suggesting that at subacute time-points, small Ag NPs are more inflammatory and/or cytotoxic (Gliga et al., 2014; Hamilton et al., 2014; Wang et al., 2013), and more prevalent in proximal airways (Anderson et al., 2014), early inflammation noted in BALF upon C20 or P20 instillation appeared to resolve by Day 21 (Figs. 3A and 4A), when C110 and P110 Ag NPs produced significant numbers of PMNs in contrast to control (Figs. 3C and 4C). Again, it is possible that this response pattern is due to the slow, steady Ag+ release rate from the C110 and P110 Ag NPs in contrast to C20 and P20, respectively.
CONCLUSIONS
This study aimed to expand the understanding regarding Ag NP exposure by evaluating biological responses and considering multiple factors (recover time, Ag NP dose, size, and coating). No other health effect studies to date have looked at the range of Ag NPs discussed in the current manuscript in vivo. Thus, the data presented are critical for defining dose responses to nanomaterials as they relate to particle characteristics; for informing future studies aimed at refining LOAELs/NOAELs for specific biological endpoints associated with Ag NP exposure; and for future promulgation of laws, statutes, and regulations, creation of recommended exposure limits, and calculation of risks associated with Ag NP exposure. It is unclear whether and how these particles and/or their coatings adversely affect health and/or well-being. This study shows that all tested Ag NP types except C20 produced significantly elevated PMNs in BALF on Days 1, 7, and/or 21 at the highest dose with only C110 or P110 instillation producing significant effects at Day 21 (Figs. 3 and 4). At the high dose, histopathology was primarily patchy, focal, and centriacinar for all time-points and all Ag NP types (Figs. 6–10), but results confirmed inflammation noted in BALF. Airway cytotoxicity was confirmed by visualization of positive ethidium homodimer-stained cells using confocal microscopy (Table 3) in agreement with in vitro (Gliga et al., 2014; Haberl et al., 2013) and/or in vivo (Wang et al., 2013) studies showing cytotoxic responses at subacute post-exposure time-points. At Day 1, Ag NP- and sham control-exposed animals had dead/dying cell foci at branch points along the main airway and/or in parenchymal regions adjacent to terminal bronchioles (Table 3), where Ag NPs were observed. These latter findings mirror those by Anderson et al. (2014), and may correlate with subsequent mucin production in small airways. Results confirmed the hypotheses that 20 nm Ag NPs would produce strong inflammatory and cytotoxic responses at Day 1 and/or Day 7 post IT, and that 110 nm particles would produce changes in the lungs indicative of inflammation and/or remodeling at Day 21; however, there was no evidence to suggest a difference between C110 and P110 toxicity at this latter time-point.
SUPPLEMENTARY DATA
Supplementary data are available online at http://toxsci.oxfordjournals.org/.
FUNDING
Grant support [U01 ES020127] and silver nanomaterials used in this study are procured, characterized, and provided by the National Institute of Environmental Health Sciences Centers for Nanotechnology Health Implications Research (NCNHIR) Consortium. The confocal microscope was funded by National Institutes of Health (NIH) (grant number S10RR-026422). All authors have read the final manuscript.
Supplementary Material
ACKNOWLEDGMENTS
The authors wish to thank A. Castañeda, J. Claude, I. Espiritu, K. Johnson, E. Patchin, A. Pham, and D. Uyeminami for their assistance during the course of this study. Special thanks to Drs N. Willits at the UC Davis Statistical Laboratory and S. Smiley-Jewell at the Center for Health and the Environment, and the UC Davis Cellular and Molecular Imagine (CAMI) Core.
REFERENCES
- Anderson D. S., Silva R. M., Lee D., Edwards P. C., Sharmah A., Guo T., Pinkerton K. E., Van Winkle L. S. (2014). Persistence of silver nanoparticles in the rat lung: influence of dose, size and chemical composition. Nanotoxicology, 1–12 doi: 10.3109/17435390.2014.958116. [DOI] [PMC free article] [PubMed] [Google Scholar]
- Bair W. J. (1995). The ICRP human respiratory-tract model for radiological protection. Radiat. Prot. Dosim. 60, 307–310. [Google Scholar]
- Baisch B. L., Corson N. M., Wade-Mercer P., Gelein R., Kennell A. J., Oberdorster G., Elder A. (2014). Equivalent titanium dioxide nanoparticle deposition by intratracheal instillation and whole body inhalation: the effect of dose rate on acute respiratory tract inflammation. Part. Fibre. Toxicol. 11, 5. [DOI] [PMC free article] [PubMed] [Google Scholar]
- Driscoll K. E., Costa D. L., Hatch G., Henderson R., Oberdorster G., Salem H., Schlesinger R. B. (2000). Intratracheal instillation as an exposure technique for the evaluation of respiratory tract toxicity: uses and limitations. Toxicol. Sci. 55, 24–35. [DOI] [PubMed] [Google Scholar]
- Galer D. M., Leung H. W., Sussman R. G., Trzos R. J. (1992). Scientific and practical considerations for the development of occupational exposure limits (OELs) for chemical substances. Regul. Toxicol. Pharmacol. 15, 291–306. [DOI] [PubMed] [Google Scholar]
- Geiser M., Kreyling W. (2010). Deposition and biokinetics of inhaled nanoparticles. Part. Fibre Toxicol. 7, 2. [DOI] [PMC free article] [PubMed] [Google Scholar]
- Gliga A. R., Skoglund S., Odnevall Wallinder I., Fadeel B., Karlsson H. L. (2014). Size-dependent cytotoxicity of silver nanoparticles in human lung cells: the role of cellular uptake, agglomeration and ag release. Part. Fibre Toxicol. 11, 11. [DOI] [PMC free article] [PubMed] [Google Scholar]
- Haberl N., Hirn S., Wenk A., Diendorf J., Epple M., Johnston B. D., Krombach F., Kreyling W. G., Schleh C. (2013). Cytotoxic and proinflammatory effects of PVP-coated silver nanoparticles after intratracheal instillation in rats. Beilstein J. Nanotechnol. 4, 933–940. [DOI] [PMC free article] [PubMed] [Google Scholar]
- Hamilton R. F., Buckingham S., Holian A. (2014). The effect of size on ag nanosphere toxicity in macrophage cell models and lung epithelial cell lines is dependent on particle dissolution. Int. J. Mol. Sci. 15, 6815–6830. [DOI] [PMC free article] [PubMed] [Google Scholar]
- Kim M. J., Shin S. (2014). Toxic effects of silver nanoparticles and nanowires on erythrocyte rheology. Food Chem. Toxicol. 67, 80. [DOI] [PubMed] [Google Scholar]
- Lee J. H., Ahn K., Kim S. M., Jeon K. S., Lee J. S., Yu I. J. (2012). Continuous 3-day exposure assessment of workplace manufacturing silver nanoparticles. J. Nanopart. Res. 14, 1134. [Google Scholar]
- Lee J. H., Kwon M., Ji J. H., Kang C. S., Ahn K. H., Han J. H., Yu I. J. (2011). Exposure assessment of workplaces manufacturing nanosized tio2 and silver. Inhal. Toxicol. 23, 226–236. [DOI] [PubMed] [Google Scholar]
- Park E. J., Bae E., Yi J., Kim Y., Choi K., Lee S. H., Yoon J., Lee B. C., Park K. (2010). Repeated-dose toxicity and inflammatory responses in mice by oral administration of silver nanoparticles. Environ. Toxicol. Pharmacol. 30, 162–168. [DOI] [PubMed] [Google Scholar]
- Quadros M. E., Marr L. C. (2011). Silver nanoparticles and total aerosols emitted by nanotechnology-related consumer spray products. Environ. Sci. Technol. 45, 10713–10719. [DOI] [PubMed] [Google Scholar]
- Quang Huy T., Van Quy N., Anh-Tuan L. (2013). Silver nanoparticles: synthesis, properties, toxicology, applications and perspectives. Adv. Nat. Sci. Nanosci. Nanotechnol. 4, 033001. [Google Scholar]
- Scanlan L. D., Reed R. B., Loguinov A. V., Antczak P., Tagmount A., Aloni S., Nowinski D. T., Luong P., Tran C., Karunaratne N., et al. (2013). Silver nanowire exposure results in internalization and toxicity to daphnia magna. ACS Nano. 7, 10681–10694. [DOI] [PMC free article] [PubMed] [Google Scholar]
- Silva R. M., Doudrick K., Franzi L. M., TeeSy C., Anderson D. S., Wu Z., Mitra S., Vu V., Dutrow G., Evans J. E., et al. (2014). Instillation versus inhalation of multiwalled carbon nanotubes: exposure-related health effects, clearance, and the role of particle characteristics. ACS Nano. 8, 8911. [DOI] [PMC free article] [PubMed] [Google Scholar]
- Silva R. M., Teesy C., Franzi L., Weir A., Westerhoff P., Evans J. E., Pinkerton K. E. (2013). Biological response to nano-scale titanium dioxide (Tio2): role of particle dose, shape, and retention. J. Toxicol. Environ. Health Part A 76, 953–972. [DOI] [PMC free article] [PubMed] [Google Scholar]
- Stebounova L. V., Adamcakova-Dodd A., Kim J. S., Park H., O'Shaughnessy P. T., Grassian V. H., Thorne P. S. (2011). Nanosilver induces minimal lung toxicity or inflammation in a subacute murine inhalation model. Part. Fibre Toxicol. 8, 5. [DOI] [PMC free article] [PubMed] [Google Scholar]
- Stone K. C., Mercer R. R., Gehr P., Stockstill B., Crapo J. D. (1992). Allometric relationships of cell numbers and size in the mammalian lung. Am. J. Respir. Cell Mol. Biol. 6, 235–243. [DOI] [PubMed] [Google Scholar]
- Sung J. H., Ji J. H., Park J. D., Yoon J. U., Kim D. S., Jeon K. S., Song M. Y., Jeong J., Han B. S., Han J. H., et al. (2009). Subchronic inhalation toxicity of silver nanoparticles. Toxicol. Sci. 108, 452–461. [DOI] [PubMed] [Google Scholar]
- Sutherland K. M., Edwards P. C., Combs T. J., Van Winkle L. S. (2012). Sex differences in the development of airway epithelial tolerance to naphthalene. Am. J. Physiol. Lung Cell. Mol. Physiol. 302, L68–L81. [DOI] [PMC free article] [PubMed] [Google Scholar]
- Wang X., Ji Z., Chang C. H., Zhang H., Wang M., Liao Y.-P., Lin S., Meng H., Li R., Sun B., et al. (2013). Use of coated silver nanoparticles to understand the relationship of particle dissolution and bioavailability to cell and lung toxicological potential. Small (Weinheim an der Bergstrasse, Germany) 10, 385–398. [DOI] [PMC free article] [PubMed] [Google Scholar]
Associated Data
This section collects any data citations, data availability statements, or supplementary materials included in this article.


