

Abstract
Epithelial cells lining the urinary tract secrete urinary exosomes (40–100 nm) that can be targeted to specific cells modulating their functionality. One potential targeting mechanism is adhesion between vesicle surface glycoproteins and target cells. This makes the glycopeptide analysis of exosomes important. Exosomes reflect the physiological state of the parent cells; therefore, they are a good source of biomarkers for urological and other diseases. Moreover, the urine collection is easy and noninvasive and urinary exosomes give information about renal and systemic organ systems. Accordingly, multiple studies on proteomic characterization of urinary exosomes in health and disease have been published. However, no systematic analysis of their glycoproteomic profile has been carried out to date, whereas a conserved glycan signature has been found for exosomes from urine and other sources including T cell lines and human milk.
Here, we have enriched and identified the N-glycopeptides from these vesicles. These enriched N-glycopeptides were solved for their peptide sequence, glycan composition, structure, and glycosylation site using collision-induced dissociation MS/MS (CID-tandem MS) data interpreted by a publicly available software GlycopeptideId. Released glycans from the same sample was also analyzed with MALDI-MS.
We have identified the N-glycoproteome of urinary exosomes. In total 126 N-glycopeptides from 51 N-glycosylation sites belonging to 37 glycoproteins were found in our results. The peptide sequences of these N-glycopeptides were identified unambiguously and their glycan composition (for 125 N-glycopeptides) and structures (for 87 N-glycopeptides) were proposed. A corresponding glycomic analysis with released N-glycans was also performed. We identified 66 unique nonmodified N-glycan compositions and in addition 13 sulfated/phosphorylated glycans were also found. This is the first systematic analysis of N-glycoproteome of urinary exosomes.
Urine is a combination of plasma filtrate and the secretion profile of cells lining the urino-genital tract. This secretion profile, in addition to proteins and metabolites, also contains exosomes and larger microvesicles that have glycoproteins on their surface. In healthy individuals, ∼70% of the urinary proteome originates from kidneys and the rest represents plasma filtered by glomeruli (1). Proteins present in urine are a collection of proteins secreted by a number of tissues, which changes in disease states (2). Therefore, the urinary proteome may serve as a rich source of biomarkers for urogenital and systemic diseases, which have been reviewed previously (3). Moreover, urine collection is a noninvasive procedure, which makes it an ideal candidate for discovery of novel biomarkers. Only a few large scale studies on urinary proteome and glycoproteome have been published (4, 5). However, most of them have not focused on the glycopeptide characterization.
Microvesicles, including exosomes are secreted by many cell types and involved in functions including antigen-presentation, cell-to-cell communication, and immunomodulation (6). These are specialized compartments of cells and they mirror the physiological state of cells secreting them while also providing information about the environment into which they are secreted. For instance, the immunosuppressive and pro-angiogenic environment of cancer may be mediated partially by exosomes (6). Exosomes and other types of microvesicles are abundantly found in urine and thought to be mainly secreted by epithelial cells lining the urinary system (7). These vesicles contain DNA, RNA, and proteins.
Glycosylation is an important post-translational modification of proteins and lipids and appears to play many roles, e.g. in cell adhesion, cell-to-cell communication, and immune response (8). Glycosylation is also very important for targeting of proteins to various compartments of the cells. Accordingly, glycans of glycoproteins have important roles in protein sorting to membrane microdomains and furthermore in influencing their intracellular trafficking (9). Microvesicles have a glycan signature that is distinct from the parent cell, suggesting that they originate from specialized membrane microdomains implying a role of glycosylation in microvesicle protein sorting (10, 11). Changes in N-glycans of exosomes from expressed prostatic secretions correlate with disease severity (12). HIV-1 particles were found to have a glycome (the comprehensive glycan profile of a protein, cell, or tissue) largely shared with microvesicles, which is taken to imply that the virus hijacks the glycomachinery of infected cells and uses it systematically to infect additional cells or to deceive the normal immunodefence (13). Thus, the specific glycoproteins of exosomes may be of major impact in targeting exosomes to distinct cells and tissues.
Exosome uptake in various cell types has been shown to occur through the mechanisms of clathrin-mediated endocytosis, phagocytosis, and micropinocytosis (14, 15). The uptake of exosomes by dendritic cells and macrophages has been shown to be inhibited by mannose, N-acetylglucosamine, and lactose residues, respectively. This uptake is mediated by a C-type lectin in dendritic cells and galectin-5 in macrophages (14, 15). All this points toward a system in which the exosome glycosylation pattern is kept specific by the cells secreting them to suit the target cell makeup and uptake pathways, and further downstream functions. Taken together, these findings suggest that better understanding of surface glycosylation patterns as well as the glycomics and glycoproteomics of exosomes might help in establishing the specificity of exosome uptake by target cells and activated downstream pathways. This information about exosome uptake might be utilized in therapeutics involving exosomes. Glycome and glycoproteome of urinary microvesicles will provide information not only about the functional state of constituent proteins, but it will also highlight the similarities and differences among proteins that are specifically targeted to exosomes.
An N-glycopeptide analysis using collision induced dissociation (CID)-Tandem MS has been reported previously for different sample types (16, 17). This approach provides information about the composition of glycan, partial structure, glycosylation site, and peptide sequence from the same molecule compared with approaches where released glycans or peptides of N-glycopeptides are analyzed separately.
We have published an algorithm for an automated analysis of N-glycopeptides (18, 19). A public, web-based software with some changes to the original was developed and named as GlycopeptideId (www.appliednumerics.com, GlycopeptideID version 28–02-28 0.91 beta). The major change was to analyze glycan structures against a database and not with an iterative de novo glycan structure analysis. The proposed structures were further manually validated by the presence of diagnostic ions, when they were available for the given structure.
This software was utilized in this study and a comprehensive glycopeptide characterization of urinary exosomal glycoproteins was carried out. We report here the glycan structure determination of urinary exosomal glycoproteins. We have characterized 126 N-glycopeptides representing 51 N-glycosylation sites that belong to 37 glycoproteins. Additionally, glycomic analysis of released N-glycans was also performed and 66 unique modified and 13 sulfated and/or phosphorylated glycans were found. A third of total glycan compositions were common to both the analysis, whereas approximately a third were unique to both the analysis.
EXPERIMENTAL PROCEDURES
Urine Collection
The first morning urine was collected from three healthy volunteers (one male and two females, age 25 to 45 years) in clean 1 L plastic bottles. The samples were not named and randomized. The urine was tested anonymously with Combur 10 Test®D dipstick (Roche Diagnostics; Mannheim, Germany), and pooled together. Combur test values are given in the supplemental materials(supplemental Table S1). Only the subjects with normal Combur test values were included; however, no abnormal values were found for anyone; therefore, no one was excluded from the study. No protease inhibitors were added. The study was ethically approved by Coordinating Ethics Committee, Hospital District of Helsinki and Uusimaa, Finland. The reference number of the ethical approval is 77/13/03/00/14.
Preparation of Exosomal and Other Fractions of Urine
A schematic representation of the methodology used to isolate vesicles is shown in Fig. 1. The isolation was performed as previously described (20, 21). In summary, pooled urine samples (800 ml) were initially centrifuged at a Relative Centrifugal Force (RCF) of 2000 × g for 20 min. Next, 800 ml of SN1 was concentrated by Amicon filter cutoff 100kDa (Millipore, Bedford, MA). The concentrated SN1 was centrifuged by Eppendorf 5810R centrifuge (Eppendorf, Hamburg, Germany) at 15,000 rounds per minute (rpm)1 (∼18,000 × g) for 30 min at room temperature (RT) in a fixed angle rotor (F34–6-38, Eppendorf). The SN 18,000 × g (SN18) fraction was subjected to an ultracentrifugation step by OptimaTM l-90 K preparative ultracentrifuge (Beckman Coulter, Miami, FL) at 44,000 rpm (200,000 × g) for 2 h at RT in a fixed-angle rotor (Beckman 70.1Ti, Beckman Coulter).
Fig. 1.
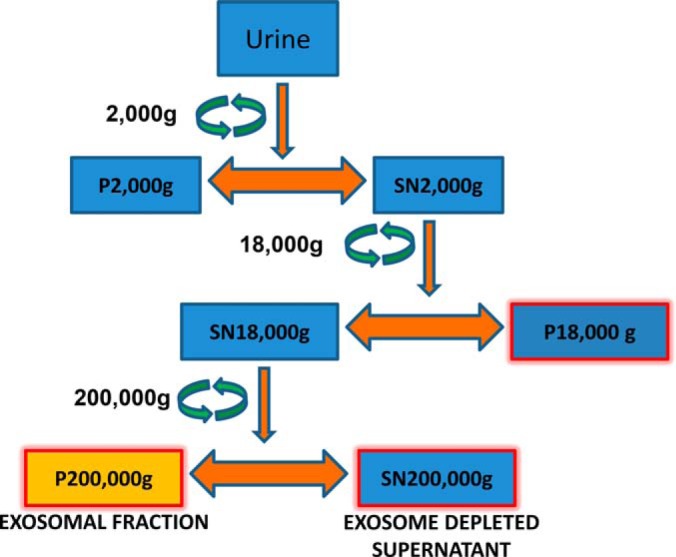
Schematic representation of vesicle fractionation from urine. Box highlighted in yellow (P 200,000 × g) was used for Lectin affinity and size exclusion chromatography. P depicts pellet here and SN depicts supernatant.
Additional methods for SDS-PAGE, Western blotting and negative transmission electron microscopy are given in Supplemental File S1.
Glycoproteomics
For glycopeptide analysis, the whole workflow is described in Fig. 2. Briefly, exosomes were lysed, reduced, alkylated, and trypsin digested. The tryptic digests were used for SNA affinity chromatography or size exclusion chromatography (SEC). Enriched N-glycopeptides were analyzed by CID-tandem MS. All the MS2 spectra were deconvoluted and combined in the format of .pkl files, which were analyzed by GlycopeptideId in database dependent manner, spectra were annotated and a list of peptide sequences, glycan compositions, glycan structures, and glycosylation sites were returned.
Fig. 2.

The general workflow diagram of the technique used in generating proposed structures of urinary exosomal glycoproteins.
Trypsin Digestion and Glycopeptide Enrichment
Trypsin Digestion
Total proteins coming from lysed exosomes were digested as described (22). Briefly, 100 μl of proteins solution (1 mg total protein) were maintained in Tris buffer, pH 8.0, and 6 m urea. Total proteins were reduced by adding 10 mm DTT (final concentration) for 1 h at RT. Iodoacetamide was added to a final concentration of 40 mm and the proteins were alkylated at RT for 1 h. Iodoacetamide was quenched by adding the same amount of DTT and leaving the reaction mixture to stand for 1 additional hour at RT. The protein mixture was diluted 10 times to reduce the concentration of urea to 0.6 m, and 20 μg of bovine trypsin was added. The digestion was carried out at + 37 °C overnight. Next day, the reaction was stopped by adding concentrated acetic acid to bring the pH below the value of five.
SNA adsorbent slurry (150 μl) was pipetted into spin columns and equilibrated with 2 × 600 μl of 10 mm HEPES, pH 8.0, and 0.15 m NaCl (binding buffer). Tryptic digest of two hundred μg of total exosomal proteins was loaded to the column in binding buffer and incubated at +4 °C overnight. Nonbound peptides were removed by washing with 3 × 600 μl of binding buffer. Bound N-glycopeptides were eluted with 200 μl of 200 mm lactose in PBS followed by 200 μl of 200 mm lactose in 200 mm acetic acid and collected in the same tube.
SEC was performed as described (23). The tryptic peptide fraction was then subjected to SEC using SuperdexPeptide 10/300 GL column (GE Healthcare, Amersham Biosciences), eluted isocratically at a flow rate of 0.5 ml/min with an aqueous solution that contained 0.1% formic acid. Fractions were collected from this column each minute. Using this procedure, the N-glycopeptides were separated from most of the nonglycosylated peptides. Fractions that contained N-glycopeptides were pooled into microcentrifuge tubes and dried under reduced pressure using a SpeedVac system (Savant, ThermoElectron Corporation, ThermoFisher Scientific, MA).
For LC-MS/MS2 analysis, salt and lactose were removed from the glycopeptide samples using Pierce C18 spin columns according to the Manufacturer's protocol. The eluted N-glycopeptides were dried in SpeedVac (Savant, ThermoElectron Corporation, ThermoFisher Scientific, Waltham, MA) and dissolved in 20 μl of 0.1% formic acid. The samples were stored at −20 °C until analysis.
LC-MS/MS
UPLC-MS
A Waters (Milford, MA) SYNAPT G2 High Definition MS connected to a Waters nanoACQUITY UPLC was used for the analysis. Positive mode with nanoflow and a 0.5 s scan time was used for the MS. Sodium formate was used for calibration. The trapping column was a nanoACQUITY UPLC Trap, 180 μm × 20 mm (5 μm), Symmetry® C18, and the analytical column was a nanoACQUITY UPLC, 75 μm × 100 mm (1.8 μm), HSS T3. Four μl of each sample was injected. The LC-MS/MS was operated in sensitivity mode with mass range 800–2400 m/z for precursors and 50–2500 m/z for fragments. The CID collision energy ramp was 20–60 V.
The UPLC was operated under the following conditions: Solvent A: H2O + 0.1% formic acid, Solvent B: ACN + 0.1% formic acid. Flow rate 300 nL/min. Gradient: 0–1 min 1% B, 1–2 min 8% B, 2–30 min 30% B, 30–31 min 50% B, 31–32 min 85% B, 32–36 min 85% B, and 36–37 min 1% B. The total run-time was 45 min.
GlycopeptideId Based Search of CID Spectra
N-Glycopeptide Identification
The MS2 spectra were deconvoluted in Waters MassLynx 4.1 software using the MaxEnt3 module and saved as peak lists (file format .pkl). The glycopeptide MS2 data were analyzed with the GlycopeptideIDsoftware. The GlycopeptideID is an open access web service aimed to ease the data analysis of intact N-glycopeptide CID LC-MS2 data. The service is developed by Applied Numerics Ltd (Helsinki, Finland) in collaboration with the University of Helsinki. The computational methods used follow closely the ones presented by Joenväärä et al. (18). The main difference is that the glycan structures are identified against a glycan database and no de novo glycan structures are built. At this context, a brief overview of the service is given. A detailed description is given at the service website and will also be published later.
The N-glycopeptide analysis algorithm has three main steps: (1) scoring possible peptide backbones by matching the MS2 spectra against a peptide database, (2) when the mass of the potential peptide is deduced from the mass of the glycopeptide, the mass of the glycan is obtained and glycan composition is calculated from monosaccharide masses in which N-glycan core is always included, and (3) scoring the MS2 spectra against the glycan structures from GlycomeDB corresponding to calculated glycan compositions from the previous step.
For the scoring of the glycan there are two possibilities: (1) glycan structure comes from GlycomeDB when a calculated composition is also found in GlycomeDB. The glycan structure gives limitations to the possible theoretical fragments and so the different structures with the same glycan composition will yield different scores, and (2) in the case where the glycan composition is not found in GlycomeDB, it is built as de novo, as the best fitting monosaccharide combination by mass error (N-Core is always included). In this case, there is no other structure, but N-Core to limit the possible theoretical fragments, but still the spectra are scored as previously.
The outcome is a list of the best matching N-glycopeptides for each precursor. The results are ordered by the total score, which is related to the (binomial) probability that a similar match could be achieved by random sampling. The theoretical glycan MS2 spectra is composed by fragments generated by glycosidic cleavages and no cross ring fragments are evaluated.
The identified glycan can be a glycan composition or a glycan structure from GlycomeDB. False discovery rate (FDR) analysis can be applied to the peptide part. The analysis is based on applying an identical workflow against the target and decoy (reversed) peptide databases and for the FDR above, a given score limit is estimated by the relative number of decoy matches.
In this study, the glycans were searched against GlycomeDB (http://www.glycome-db.org/) human glycan structures (GlycomeDB database downloaded on December 5, 2013) with the N-glycan core and also against computer generated (de novo) compositions with the given range of monosaccharaides. Peptides were searched against the peptide database generated from the reviewed UniProt (http://www.uniprot.org/) human proteins (database: UniProt release 2013_04). The peptide database contained peptide sequences (191,896 sequences) with a potential N-glycosylation site (NX[S/T/C], X! = P; X can be any amino acid but not Proline), with a max length of 30 amino acids and with max two missed trypsin cleavage sites. Carbamidomethylation of cysteine was searched as fixed modification. The mass accuracy is given by absolute Δm/z and ppm and whichever is lower is used. The precursor and fragment tolerance was kept at dm/z 0.05 Da and 20 ppm.
In the resulting data, glycan compositions are given as one-letter abbreviations H: Hexose, N: Hexosamine, S: Sialic acid, and F: Fucose, and the number following indicates the amount of the monosaccharides. For example, S2H6N5 stands for a glycan containing two sialic acids, six hexoses, and five hexosamines. Proteins are given as the UniProt Id, e.g. LG3BP_HUMAN stands for human galectin-3-binding protein.
The glycan structure format used in the GlycopeptideID is a simplified version of the consortium for functional genomics Modified IUPAC condensed format (www.functionalglycomics.org/static/consortium/Nomenclature.shtml). The stereoisomer (α, β) and the regioisomer (e.g. 1–4) notations are omitted and the long monosaccharide names are replaced by single letter codes (H:Hex, N:HexNAc, F:Fuc, and S:NeuAc). The resulting format consists of linear glycan sequences with branching shown by parenthesis and written from nonreducing to reducing end. As an example a core fucosylated, complex N-glycan with two branches shown in consortium for functional genomics format as
NeuAcα 2–6Gal β 1–4GlcNAc β 1–2Man α 1–6(NeuAcα 2–6Gal β 1–4GlcNAc β 1–2Man α 1–3)Manβ 1–4GlcNAc β 1–4(Fucα 1–6)GlcNAc-Asn is written as SHNH(SHNH)HN(F)N. The aim of the format is to have a compact notation and to show only the amount of information that can be identified with the current experimental setup. In supplemental Table S2, structure matched to the spectrum is shown in such a format.
Glycomics
N-glycan analysis was performed to 250 μl of samples 1–5. Asparagine-linked glycans were detached from the proteins by Elizabethkingia meningoseptica N-glycosidase F digestion (Prozyme, Hayward, CA). The released N-glycans were purified by solid-phase extraction with Hypersep C18 and Hypersep Hypercarb (Thermo Scientific). The samples were further purified with miniaturized solid-phase extractions. Total N-glycome as well as neutral and acidic fractions, were analyzed with matrix assisted laser desorption-ionization time of flight (MALDI-TOF) MS Ultraflex III TOF/TOF (Bruker Daltonics Inc, Bremen, Germany). Neutral N-glycans and total N-glycome were analyzed in positive ion reflector mode as [M+Na]+ ions and acidic N-glycans in negative ion reflector mode as [M-H]− ions.
Relative intensities were determined by flexAnalysis 3.4 software (Bruker Daltonics). The glycan profiles were produced from the resulting signal lists and all interfering signals not arising from the glycan components of the sample were eliminated (overlapping isotopic patterns, multiple alkali metal adduct signals, products of elimination of water from oligosaccharides). The resulting glycan signal intensities were normalized to be 100%. Signal was accepted if the signal to noise ratio was >2. Maximum mass difference between calculated and measured mass that was accepted was 0.1 Da.
RESULTS
Exosome Purification
The exosomes were purified as described in Fig. 1. The previously published protocols were used for isolating urinary exosomes (7, 20, 21). The exosomes were analyzed with transmission electron microscopy (TEM) using a methodology previously published (20). Two representative TEM pictures are shown in supplemental Fig. S1 (supplementary File S1). As can be seen, most of the vesicles are in the range of 30–100 nm and appear cup shaped or round in morphology, which is typical of exosomes. This also shows that the purification procedure is gentle enough to preserve the integrity of the vesicles. The Western blot showing the presence of TSG101 in various urine fractions is given in supplemental Fig. S2 (supplementary File S1). In the 200,000 × g pellet,(P200,000 × g) the presence of TSG101 at its molecular weight is indicative of exosomes.
N-glycopeptides
The results obtained from the above workflow (Fig. 2), after combining the N-glycopeptides enriched by either SNA affinity chromatography or SEC, are presented in Table I.
Table I. The total number of proteins for which the glycan composition and structures were proposed. Protein name, UniProt Id, N-glycosylation sites, the number of N-glycopeptides observed, composition elucidated and the structure proposed are given in the table. N sites are the sites which have been found in our analysis. These proteins may contain multiple other N-sites. Same site may contain multiple different types of glycans in various percentages of occupancy, therefore, the number of N-glycopeptides vary with respect to the number of N-sites. Similarly, different sites may contain same composition of glycans; therefore, sometimes the compositions are less than the number of sites. Structures matched to the spectrum of N-glycopeptides are reported here. The highest scoring structure is reported for every N-site.
| Protein Name | Uniprot Id | N sites | N-glycopeptides | Composition | Structure |
|---|---|---|---|---|---|
| Alpha-1-acid glycoprotein 1 | A1AG1_HUMAN | 1 | 1 | 1 | 0 |
| Protein AMN1 homolog | AMN1_HUMAN | 1 | 1 | 1 | 0 |
| Aminopeptidase N | AMPN_HUMAN | 3 | 3 | 3 | 1 |
| Apolipoprotein D | APOD_HUMAN | 2 | 4 | 4 | 3 |
| Acid ceramidase | ASAH1_HUMAN | 1 | 4 | 4 | 4 |
| Attractin | ATRN_HUMAN | 1 | 4 | 4 | 4 |
| Beta-galatosidase | BGAL_HUMAN | 1 | 1 | 1 | 0 |
| Beta-glucuronidase | BGLR_HUMAN | 1 | 1 | 1 | 1 |
| Ceruloplasmin | CERU_HUMAN | 2 | 2 | 1 | 1 |
| Clusterin | CLUS_HUMAN | 1 | 2 | 2 | 2 |
| Complement C4-A | CO4A_HUMAN | 1 | 1 | 1 | 1 |
| Cubilin | CUBN_HUMAN | 5 | 21 | 21 | 16 |
| Dipeptidase 1 | DPEP1_HUMAN | 1 | 1 | 1 | 1 |
| Fetuin A | FETUA_HUMAN | 1 | 1 | 1 | 1 |
| Fibroblast growth factor receptor 3 | FGFR3_HUMAN | 1 | 2 | 2 | 0 |
| Gamma-glutamyltransferase light chain 1 | GGTL1_HUMAN | 1 | 1 | 1 | 0 |
| Hemopexin | HEMO_HUMAN | 1 | 1 | 1 | 1 |
| Immunoglobulin alpha-1 chain C region | IGHA1_HUMAN | 1 | 1 | 1 | 1 |
| Immunoglobulin alpha-2 chain C region | IGHA2_HUMAN | 1 | 4 | 4 | 4 |
| Immunoglobulin gamma-2 chain C region | IGHG2_HUMAN | 1 | 2 | 2 | 2 |
| Immunoglobulin J chain | IGJ_HUMAN | 1 | 4 | 5 | 4 |
| Plasma serine protease inhibitor | IPSP_HUMAN | 1 | 1 | 1 | 1 |
| Lysosome-associated membrane glycoprotein 2 | LAMP2_HUMAN | 1 | 2 | 2 | 2 |
| Galectin-3-binding protein | LG3BP_HUMAN | 3 | 31 | 30 | 22 |
| Low-density lipoprotein receptor-related protein 2 | LRP2_HUMAN | 3 | 6 | 6 | 4 |
| Lysosomal alpha-glucosidase | LYAG_HUMAN | 1 | 2 | 2 | 1 |
| Maltase-glucoamylase, intestinal | MGA_HUMAN | 2 | 7 | 7 | 2 |
| Neprilysin | NEP_HUMAN | 1 | 3 | 3 | 1 |
| Polymeric immunoglobulin receptor | PIGR_HUMAN | 1 | 1 | 1 | 1 |
| Neuropathy target esterase | PLPL6_HUMAN | 1 | 1 | 1 | 0 |
| Regulator of G-protein signaling 16 | RGS16_HUMAN | 1 | 1 | 1 | 1 |
| Synaptophysin-like protein 1 | SYPL1_HUMAN | 1 | 1 | 1 | 1 |
| Thyroxine-binding globulin | THBG_HUMAN | 1 | 1 | 1 | 1 |
| Prothrombin | THRB_HUMAN | 1 | 1 | 1 | 1 |
| Uromodulin | UROM_HUMAN | 2 | 4 | 4 | 1 |
| Vasorin | VASN_HUMAN | 1 | 1 | 1 | 1 |
| Zinc finger protein 518A | Z518A_HUMAN | 1 | 1 | 1 | 0 |
| Total | 37 | 51 | 126 | 125 | 87 |
A total of 126 N-glycopeptides from 51 N-glycosylation sites belonging to 37 glycoproteins were identified in our study with false positive rate of 2.56%. Out of these 126 N-glycopeptides, one glycopeptide was the result of a miscleavage and as a result, galectin-3-binding protein had two peptides, YKGLNLTEDTYKPR and GLNLTEDTYKPR, which were both found with the same composition of the glycans. These two N-glycopeptides were counted as one composition; and therefore, 125 compositions were elucidated and 87 potential structures were proposed out of these 125 compositions (supplemental Table S2). From one (multiple proteins) up to 31 N-glycopeptides (galectin-3-binding protein) were found for different proteins.
Peptide Sequences/N-Glycosylation Sites
In total, 51 N-glycosylation sites were found in our analysis belonging to 37 proteins. Different numbers of glycosylation sites from one up to five N-glycosylated sites were found from different proteins. The average number of sites found for each protein was typically one, whereas some proteins yielded three sites (aminopeptidase N and megalin) and still others five sites (cubilin).
Out of the total 51 sites, 65% (33 sites) were known to be experimentally validated as glycosylated mainly by hydrazide chemistry methods (Source: UniProt). An additional 21% of N-glycosylation sites (11 sites) are listed in UniProtKb as potential. These sites are predicted based on the consensus N-glycosylation site motif (NXS/T). Our study confirms the presence of N-glycans in these sites. Another 14% of the total sites found (seven sites), are new and not present in any database to the best of our knowledge. All these sites contain the consensus N-glycosylation motif.
The glycoproteins containing new sites are AMN1 homolog, aminopeptidase N, gamma glutamyltransferase light chain 1, neuropathy target esterase, regulator of G-protein signaling, zinc finger protein 518A, and uromodulin (supplementary Table S2). Annotated spectra of all the N-glycopeptides is given in the supplementary File S1. Detailed annotation of the fragment ions spectra (Glycan assignment) is given in supplemental Table S3. In the table, spectra annotation can be differentiated by m/z values that are given as names of the Excel sheets.
Glycan Compositions from N-glycopeptides
For different proteins, one (multiple proteins) up to 30 compositions (galectin-3-binding protein), were proposed. For some proteins, N-glycopeptides yielded only the composition, such as for beta-galactosidase and zinc finger protein 518A. In other proteins, the analysis yielded from one (hemopexin) up to 22 structures (galectin-3-binding protein). For acid ceramidase and attractin, four N-glycopeptides each, attached to one site each, were found and all eight of them yielded eight different compositions and structures for both of them combined.
Some of the compositions from our study are previously known (12 out of 125) and are presented here. Fetuin A glycopeptide, having N site 156, was shown to have a S2H5N4 composition (S:sialic acid, H:hexose, and N:HexNAc) in our study. The core fucosylated variant of this composition has been identified in another study in bovine fetuin (24). This study by Nilsson et al. used desialylated structures of the glycans for analysis, therefore, the degree of sialylation information was lost in their study. Hence, only H5N4 was identified. S2H5N4 implies that this glycan is biantennary as two sialic acids are present to cap the antennae unless poly-sialic acid is present. Similarly, Apolipoprotein D H5N4F1 was identified in their study from cerebrospinal fluid (24), whereas the sialylated version S2H5N4F1 was identified in our study elucidating the degree of sialylation. Similarly, ceruloplasmin was identified to have, at Asn138 and 397, H5N4 in their study, whereas S2H5N4 was identified in our study. H5N4 was identified at Asn187 in Hemopexin by Nilsson et al., whereas S2H5N4 was identified in our study. The same was true of Asn144 of IGHA1 where they identified H5N4, whereas we have identified S1H5N4. Asn36 of the thyroxine binding globulin was found to have H5N4 in their study, whereas we found S2H5N4. In another study by the same group, Halim et al., (17), found some structures common with our study. They had again used sialic acid oxidation and the capture method to enrich N-glycopeptides, which results in loss of sialic acid before analysis. Vasorin, at Asn117, was found to have H5N4 in their study and we found S2H5N4. Prothrombin at Asn121 was found to contain H5N4, whereas we have found S2H5N4. Apolipoprotein D at Asn65 was found to have H6N5 in their study, whereas we have found S3H6N5. Two glycans found at Asn176 of IgG heavy chain are already known from various studies (25, 26). These 12 glycans identified at various sites of different proteins in different studies from varied sources, such as plasma, cerebrospinal fluid, and urine, serve as validation of our results. Other than these 12 glycan compositions, 113 other glycan compositions proposed in our study are novel as are the 85 structures barring two IgG N-glycopeptides.
Glycan Structures from N-glycopeptides
For 87 N-glycopeptides a structure was proposed, whereas for another 38 N-glycopeptides, de novo glycan composition was given and no structure was applied to these compositions.
Proposed Structures
In this section, we only talk about 87 N-glycopeptides where a structure was proposed. Out of the total 87 GlycomeDB derived and scored structures from 126 N-glycopeptides in our study, 82% were complex type structures, 14% high mannose, and 3% hybrid. These classes of glycans can also be inferred from the composition of glycan with help from the knowledge of N-glycans.
Of the total complex type N-glycopeptides (71) found in our study, 38% were bisecting GlcNAc complex glycans. Verification of the bisecting type structures was done by checking the presence of peptide anchored ion of H1N3, which is possible only if there is a bisecting GlcNAc present. Fifty-eight percent of the 87 N-glycopeptides had terminal hexose residues, whereas 13% had terminal HexNAc. Eighty-eight percent of the complex type structures likely had a lactosamine motif and 8% had the LacdiNAc motif. However, the units of lactosamine, when more than one, could not be assigned to its correct location meaning antennae information was not present; therefore, bi-, tri-, and tetra antennary structures cannot be claimed.
Fifty percent of the structures were sialylated. Considering that polysialic acid is rare, if it is not present, the least number of branches can be claimed unambiguously. With mono sialylated structures, we can say that at least one antennae is present and two antennae in the case of bi-sialylated structures. Out of the total complex structures, 65% were fucosylated. Of the fucosylated structures, 92% were core fucosylated, whereas 8% were only fucosylated on the antennae. An overlapping 16% were both, core as well as fucosylated on the antennae. Six percent of the complex structures had the potential Lewis X motif, whereas 9% had potential blood group H antigen (This is according to the glycopeptide precursor spectra matching to the database entries and experimental validation for this has not been performed); however, all these structures could include any of the three: Lewis X/H antigen/LewisA. This is because it is not possible to differentiate between these structures with the currently available MS data analysis. Of the hybrid structures, all were sialylated and also had the lactosamine motif. This description is only for the N-glycopeptides where a structure was proposed.
De novo Glycan Composition
Of all the N-glycopeptides where a de novo composition was proposed, 27 were found to be of complex type glycans, whereas three were hybrid. These classes are being claimed with the help of drawing the glycan compositions (with knowledge of N-glycans) and searching them on JCGGDB (http://jcggdb.jp/idb/jsp/GlycanCompositionSearch.jsp). Sixteen of the compositions had evidence for bisecting GlcNAc in the form of a peptide anchored ion of H1N3. Twenty-four compositions were found to contain fucose. For seven of these, unambiguous assignment of core and/or antennae fucosylation was possible from the spectra annotation. Nine of the compositions were sialylated with a varying number (1 to 3) of sialic acids present.
Gene Ontology Enrichment
Thirty-seven glycoproteins found in our analysis were classified according to their subcellular distribution using GO Ontology analysis by program GoRetriever from AgBase (27). This analysis is shown in Fig. 3.
Fig. 3.

GoOntology analysis of subcellular distribution of 37 glycoproteins. The GoRetriever tool from AgBase was used for generating Go Ontology information and MS Excel was used for generating the pie chart. Each category is shown as the number of proteins mapped to a given category when the total proteins are 37.
Some of the biggest categories were the extracellular region (21, 57% of total) followed by cytoplasmic and intracellular proteins (18, 49% of total). Organelle proteins (16, 43%) and intracellular proteins were other big categories followed by lysosomal proteins (30%), membrane bound vesicles (24%), endoplasmic reticulum proteins (19%), and Golgi apparatus proteins (11%). In comparison, plasma membrane, extracellular region proteins, and cytoplasm were the three biggest categories in a large scale proteomic study published on urinary exosomes (7).
Cubilin as a Case Example
As a representative example of our study, Cubilin is described here in more detail. We were able to find 21 N-glycopeptides belonging to five different N-glycosylation sites in cubilin, of which, 16 structures were proposed.
Cubilin N-glycopeptides
Glycan structures found at various glycosylation sites of cubilin are presented in Fig. 4. We have used color symbols in the figures, for example, for mannose and galactose but MS does not give this information. It can only tell us that it is a hexose but the GlycopeptideId software searches the data against a database (Glycome DB), which gives this kind of information. With the help of knowledge about N-glycans, mannose, and galactose can be safely differentiated. It is well known that the N-glycan core has three mannoses and two GlcNAc and no galactose or GalNAc. Similarly, terminal hexose has to be a galactose and it cannot be a mannose if the structure is a complex type. Here, the description is given of only the N-glycopeptides for which a glycan structure was proposed. All the N-glycopeptides identified in this study belonging to Cubilin contained glycans (Fig. 4) that are the complex type glycans. Thirteen of the 16 glycan structures matched were bisecting complex type structures. Nine structures were core fucosylated and three were core as well as antennae fucosylated glycans, whereas an additional three structures were only fucosylated on the antennae (Fig. 4). Fucosylated and nonfucosylated variants of the same structures were found on multiple sites. For confirmation of the fucosylation position, we were able to find evidence of a peptide anchored N1F1 peak in the spectra in all but three cases (m/z value of 1067.45, 1105.7, and 916.3). In these cases, peptide anchored fucosylated N-glycan core or a part thereof was observed. In the case of antennae fucosylation, glycan fragments bearing antennal fucoses were observed in the spectra without ambiguity.
Fig. 4.
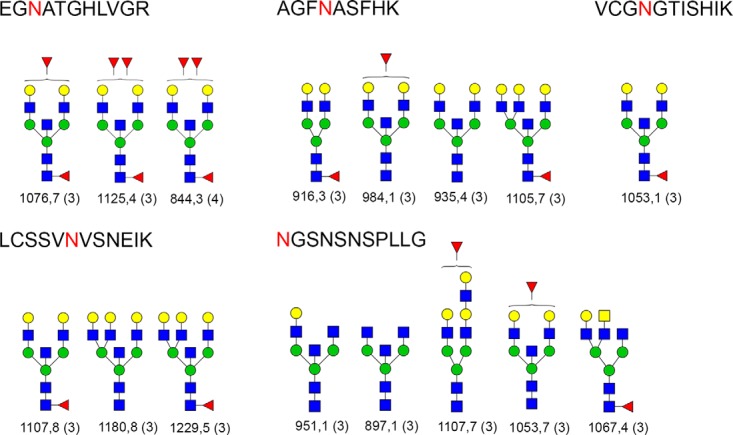
Proposed structures for Cubilin belonging to five different N-glycosylation sites. Blue squares are HexNAc, green circles are mannoses, and yellow circles are galactose, whereas the red triangle is fucose. The peptide sequence is shown at the top of each box. Five different peptide sequences are shown. N-glycosylation site is marked with a red letter. The m/z value of each precursor is given at the bottom of the glycan structure and the charge is given in parenthesis. When the antennalfucose position is ambiguous such as attached to either HexNAc or Hexose, then the fucose is drawn outside of the parenthesis. It is to be noted that LacNAc units cannot be assigned to a given branch from the spectrum; and therefore, the number of antennae remains ambiguous. Here, the structures from GlycomeDB that matched to various spectrums are shown. When the glycan composition is determined, if there are several identical compositions in GlycomeDB with different structures the potential structures are theoretically fragmented and compared with the empirical spectrum and scored. The different structures yield different fragments and the highest scoring structure is reported.
Glycomics
Released N-glycans were analyzed with MALDI-TOF and neutral and total N-glycan compositions are shown in Table II and III. There are 66 unique compositions (also including the acidic fraction compositions but excluding the sulfated/phosphorylated glycan) found in glycomic analysis (containing N core and nonmodified N-glycans) compared with 67 unique compositions (from 126 N-glycopeptides) we found in the glycopeptides analysis. Altogether, 101 unique compositions were found combining glycomic and glycoproteomic analysis (Fig. 5). Out of these, 34 were unique to the glycomic analysis, whereas 35 were unique to glycoproteomic analysis and 32 compositions were common to both the groups.
Table II. Glycan compositions and masses of neutral N-glycans (as [M+Na]+ ions). Hexose (H), N-acetylhexosamine (N), deoxyhexose (F), sialic acid (S). For comparison of glycomic data with glycopeptide data, only the glycans containing full N-core were used, however here the complete list is provided.
| Composition | Calculated mass | Calibrated mass | Δm | Signal/Noise |
|---|---|---|---|---|
| H2N1 | 568,19 | 568,19 | 0,00 | 9,68 |
| H1N2 | 609,21 | 609,27 | 0,06 | 4,52 |
| H2N1F1 | 714,24 | 714,24 | 0,00 | 4,43 |
| H3N1 | 730,24 | 730,24 | 0,00 | 8,66 |
| H2N2 | 771,26 | 771,27 | 0,01 | 37,71 |
| H2N1F2 | 860,30 | 860,31 | 0,01 | 6,92 |
| H4N1 | 892,29 | 892,30 | 0,01 | 7,74 |
| H2N2F1 | 917,32 | 917,32 | 0,00 | 30,47 |
| H3N2 | 933,31 | 933,32 | 0,01 | 131,24 |
| H3N1F2 | 1022,35 | 1022,35 | 0,00 | 11,03 |
| H5N1 | 1054,34 | 1054,35 | 0,01 | 4,26 |
| H3N2F1 | 1079,38 | 1079,38 | 0,00 | 65,54 |
| H4N2 | 1095,37 | 1095,37 | 0,00 | 29,48 |
| H2N3F1 | 1120,40 | 1120,45 | 0,05 | 5,17 |
| H3N3 | 1136,40 | 1136,40 | 0,00 | 12,39 |
| H2N4 | 1177,42 | 1177,43 | 0,01 | 15,96 |
| H3N2F2 | 1225,43 | 1225,51 | 0,08 | 9,37 |
| H4N2F1 | 1241,43 | 1241,49 | 0,06 | 4,26 |
| H5N2 | 1257,42 | 1257,42 | 0,00 | 270,00 |
| H3N3F1 | 1282,45 | 1282,45 | 0,00 | 12,65 |
| H4N3 | 1298,45 | 1298,45 | 0,00 | 13,79 |
| H3N4 | 1339,48 | 1339,47 | −0,01 | 18,28 |
| H6N2 | 1419,48 | 1419,48 | 0,00 | 541,34 |
| H4N3F1 | 1444,51 | 1444,51 | 0,00 | 11,43 |
| H5N3 | 1460,50 | 1460,49 | −0,01 | 7,98 |
| H3N4F1 | 1485,53 | 1485,53 | 0,00 | 65,46 |
| H4N4 | 1501,53 | 1501,52 | 0,01 | 21,66 |
| H3N5 | 1542,56 | 1542,55 | −0,01 | 22,17 |
| H7N2 | 1581,53 | 1581,53 | 0,00 | 128,52 |
| H6N3 | 1622,56 | 1622,55 | −0,01 | 5,21 |
| H4N4F1 | 1647,59 | 1647,59 | 0,00 | 68,96 |
| H5N4 | 1663,58 | 1663,59 | 0,01 | 134,55 |
| H3N5F1 | 1688,61 | 1688,61 | 0,00 | 24,11 |
| H4N5 | 1704,61 | 1704,61 | 0,00 | 77,20 |
| H8N2 | 1743,58 | 1743,59 | 0,01 | 20,08 |
| H4N4F2 | 1793,64 | 1793,64 | 0,00 | 4,76 |
| H5N4F1 | 1809,64 | 1809,64 | 0,00 | 131,68 |
| H6N4 | 1825,63 | 1825,66 | 0,03 | 8,34 |
| H4N5F1 | 1850,67 | 1850,66 | −0,01 | 132,90 |
| H5N5 | 1866,66 | 1866,67 | 0,01 | 60,31 |
| H9N2 | 1905,63 | 1905,63 | 0,00 | 17,61 |
| H5N4F2 | 1955,70 | 1955,69 | −0,01 | 12,36 |
| H4N5F2 | 1996,72 | 1996,71 | −0,01 | 14,19 |
| H5N5F1 | 2012,72 | 2012,72 | 0,00 | 185,47 |
| H6N5 | 2028,71 | 2028,73 | 0,02 | 27,71 |
| H4N6F1 | 2053,75 | 2053,76 | 0,01 | 6,67 |
| H5N4F3 | 2101,76 | 2101,69 | −0,07 | 4,56 |
| H5N5F2 | 2158,78 | 2158,77 | −0,01 | 104,46 |
| H6N5F1 | 2174,77 | 2174,78 | 0,01 | 58,62 |
| H5N6F1 | 2215,80 | 2215,81 | 0,01 | 23,45 |
| H6N6 | 2231,79 | 2231,80 | 0,01 | 27,31 |
| H5N5F3 | 2304,84 | 2304,84 | 0,00 | 35,93 |
| H6N5F2 | 2320,83 | 2320,84 | 0,01 | 10,61 |
| H5N6F2 | 2361,87 | 2361,85 | −0,02 | 8,90 |
| H6N6F1 | 2377,85 | 2377,86 | 0,01 | 95,44 |
| H7N6 | 2393,85 | 2393,87 | 0,02 | 11,36 |
| H6N5F3 | 2466,89 | 2466,89 | 0,00 | 5,64 |
| H6N6F2 | 2523,91 | 2523,92 | 0,01 | 92,80 |
| H7N6F1 | 2539,90 | 2539,94 | 0,04 | 29,83 |
| H7N6F2 | 2685,96 | 2685,95 | −0,01 | 6,25 |
| H7N7F1 | 2742,98 | 2743,00 | 0,02 | 10,04 |
| H7N6F3 | 2832,02 | 2832,04 | 0,02 | 4,07 |
| H8N7F1 | 2905,04 | 2905,04 | 0,00 | 6,00 |
Fig. 5.
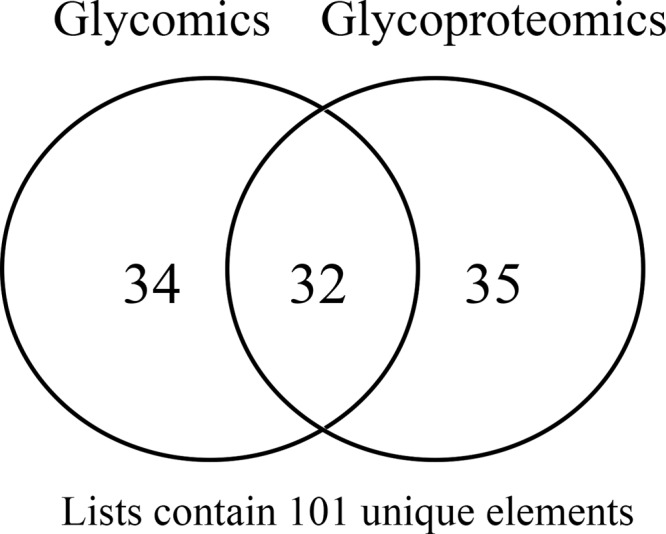
Venn diagram showing the comparison between N-glycan compositions found in glycomic analysis (having N-core glycan and nonmodified) and N-glycan compositions found in glycoproteomic analysis. The diagram was created at Sablabs website (http://sablab.net/venn.php) and modified thereafter.
Table III. Glycan compositions and masses of neutral and acidic N-glycans in the total N-glycome (as [M+Na]+ ions). Hexose (H), N-acetylhexosamine (N), deoxyhexose (F), sialic acid (S), sulphate or phosphate (P). For comparison of glycomic data with glycopeptide data, only the glycans containing full N-core were used, however here the complete list is provided.
| Composition | Calculated mass | Calibrated mass | Δm | Signal/Noise |
|---|---|---|---|---|
| H2N2F1 | 917,32 | 917,33 | 0,01 | 18,75 |
| H3N2 | 933,32 | 933,33 | 0,01 | 73,67 |
| H3N1F2 | 1022,35 | 1022,37 | 0,02 | 7,58 |
| H3N2F1 | 1079,38 | 1079,38 | 0,00 | 38,35 |
| H4N2 | 1095,37 | 1095,37 | 0,00 | 16,20 |
| H3N3 | 1136,40 | 1136,39 | −0,01 | 10,38 |
| H2N4 | 1177,42 | 1177,43 | 0,01 | 12,37 |
| H5N2 | 1257,42 | 1257,42 | 0,00 | 166,44 |
| H3N3F1 | 1282,45 | 1282,46 | 0,01 | 10,47 |
| H4N3 | 1298,45 | 1298,45 | 0,00 | 9,34 |
| H3N4 | 1339,48 | 1339,47 | −0,01 | 12,48 |
| H6N2 | 1419,48 | 1419,48 | 0,00 | 330,83 |
| H4N3F1 | 1444,51 | 1444,49 | −0,02 | 9,22 |
| H5N3 | 1460,50 | 1460,54 | 0,04 | 4,55 |
| H3N4F1 | 1485,53 | 1485,53 | 0,00 | 40,51 |
| H4N4 | 1501,53 | 1501,53 | 0,00 | 17,03 |
| H3N5 | 1542,56 | 1542,56 | 0,00 | 16,08 |
| H7N2 | 1581,53 | 1581,53 | 0,00 | 76,01 |
| H4N4F1 | 1647,59 | 1647,58 | −0,01 | 47,21 |
| H5N4 | 1663,58 | 1663,59 | 0,01 | 93,03 |
| H3N5F1 | 1688,61 | 1688,61 | 0,00 | 17,33 |
| H4N5 | 1704,61 | 1704,62 | 0,01 | 42,29 |
| H8N2 | 1743,58 | 1743,60 | 0,02 | 11,54 |
| H3N6 | 1745,64 | 1745,63 | −0,01 | 10,47 |
| H5N4F1 | 1809,64 | 1809,66 | 0,02 | 87,25 |
| H6N4 | 1825,63 | 1825,64 | 0,01 | 6,08 |
| H4N5F1 | 1850,67 | 1850,67 | 0,00 | 83,96 |
| H5N5 | 1866,66 | 1866,67 | 0,01 | 37,92 |
| H3N6F1 | 1891,69 | 1891,71 | 0,02 | 26,09 |
| H9N2 | 1905,63 | 1905,66 | 0,03 | 11,70 |
| H4N6 | 1907,69 | 1907,69 | 0,00 | 5,76 |
| S1H5N4 | 1954,68 | 1954,61 | −0,07 | 5,60 |
| H5N4F2 | 1955,70 | 1955,68 | −0,02 | 7,58 |
| S1H5N4 | 1976,66 | 1976,67 | 0,01 | 32,74 |
| H4N5F2 | 1996,72 | 1996,73 | 0,01 | 9,33 |
| H5N5F1 | 2012,72 | 2012,74 | 0,02 | 109,99 |
| H6N5 | 2028,71 | 2028,75 | 0,04 | 20,86 |
| H5N6 | 2069,74 | 2069,77 | 0,03 | 6,23 |
| S1H5N4F1 | 2122,72 | 2122,72 | 0,00 | 33,85 |
| H5N5F2 | 2158,78 | 2158,80 | 0,02 | 55,66 |
| S1H4N5F1 | 2163,74 | 2163,75 | 0,01 | 7,39 |
| H6N5F1 | 2174,77 | 2174,82 | 0,05 | 39,23 |
| S1H5N5 | 2179,74 | 2179,75 | 0,01 | 5,02 |
| H5N6F1 | 2215,80 | 2215,84 | 0,04 | 16,08 |
| H6N6 | 2231,79 | 2231,85 | 0,06 | 13,77 |
| S2H5N4 | 2289,74 | 2289,76 | 0,02 | 8,35 |
| H5N5F3 | 2304,84 | 2304,89 | 0,05 | 19,09 |
| H6N5F2 | 2320,83 | 2320,88 | 0,05 | 7,81 |
| H5N6F2 | 2361,86 | 2361,91 | 0,05 | 5,69 |
| H6N6F1 | 2377,85 | 2377,92 | 0,07 | 52,83 |
| H7N6 | 2393,85 | 2393,93 | 0,08 | 8,50 |
| H6N5F3 | 2466,89 | 2466,92 | 0,03 | 6,06 |
| H6N6F2 | 2523,91 | 2524,00 | 0,09 | 49,07 |
The average size of the glycan uniquely found in the glycomic analysis was 1900 Da, whereas those uniquely found in glycoproteomic analysis was 2466 Da. A few big glycans can skew the result of such a comparison so we also calculated median size of the unique glycans found in both the analyses and it was 1890 Da for glycomic analysis and 2465 Da for glycoproteomic analysis. A zoomed-in part of the neutral and acidic MALDI-TOF spectra is shown in Fig. 6 and complete spectra for total, neutral, and acidic fractions are shown in supplemental Figs. S3, S4, and S5 (supplemental File S1). High-mannose and hybrid glycans were common to both the analysis, but bigger complex type sialylated glycans were preferentially found in glycoproteomic analysis. For example, glycans containing one sialic acid were 51% of unique glycans found in glycoproteomic analysis (18 of 35 glycans). In comparison, only 12% of unique glycans found in glycomic analysis contained one sialic acid (4 of 34 glycans). One glycan containing two sialic acids was found in glycomic analysis (1 of 34, ∼3%), whereas seven of them were found in glycoproteomic analysis (7 of 35, 20%). No glycans containing three or four sialic acids were found in glycomic analysis, whereas five and two glycans containing three and four sialic acids, respectively, were found in glycoproteomic analysis.
Fig. 6.

Part of the MALDI-TOF spectra of neutral and acidic N-glycans. The major peaks are shown annotated with corresponding compositions. Full spectra are given in supplemental Figs. S3, S4, and S5 (Supplementary File S1).
Fifty one percent of unique glycans in glycoproteomic analysis were singly fucosylated, whereas only 24% were singly fucosylated in case of glycomic analysis. Glycans containing two fucoses were more present in glycomic analysis (26% of total unique glycans), whereas there were only 9% of them in glycoproteomic analysis. Nine percent of unique glycans found in glycomic study had three fucoses, whereas 14% of such glycans were present in glycoproteomic analysis.
In the glycomic analysis, in acidic fraction, we have also found sulfated and/or phosphorylated glycans (Table IV), which are absent in glycopeptides analysis. These glycans are not sialylated, but mainly represent complex type and 69% of them are fucosylated (9 of 13 glycan compositions). Total matched and unmatched peaks of neutral, total, and acidic N-glycans are given in supplemental Table S4.
Table IV. Glycan compositions and masses of acidic N-glycans (as [M-H]− ions). Hexose (H), N-acetylhexosamine (N), deoxyhexose (F), sialic acid (S), sulphate or phosphate (P).
| Composition | Calculated mass | Calibrated mass | Δm | Signal/Noise |
|---|---|---|---|---|
| H3N4F1P1 | 1541,49 | 1541,44 | −0,05 | 5,01 |
| H4N4F1P1 | 1703,55 | 1703,47 | −0,08 | 4,06 |
| H5N4P1 | 1719,54 | 1719,49 | −0,05 | 11,99 |
| H4N5P1 | 1760,57 | 1760,55 | −0,02 | 23,13 |
| H3N6P1 | 1801,59 | 1801,59 | 0,00 | 14,70 |
| H5N4F1P1 | 1865,60 | 1865,56 | −0,04 | 18,10 |
| H4N5F1P1 | 1906,63 | 1906,56 | −0,07 | 92,10 |
| S1H5N4 | 1930,68 | 1930,68 | 0,00 | 13,56 |
| H3N6F1P1 | 1947,65 | 1947,60 | −0,05 | 70,65 |
| H5N5F1P1 | 2068,68 | 2068,61 | −0,07 | 3,95 |
| S1H5N4F1 | 2076,74 | 2076,76 | 0,02 | 6,58 |
| H6N5P1 | 2084,67 | 2084,62 | −0,05 | 19,11 |
| H4N6F1P1 | 2109,70 | 2109,65 | −0,05 | 5,85 |
| S1H4N5F1 | 2117,76 | 2117,78 | 0,02 | 5,99 |
| S1H7N3F1 | 2197,76 | 2197,83 | 0,07 | 10,20 |
| H4N5F3P1 | 2198,74 | 2198,77 | 0,03 | 11,39 |
| S2H5N4 | 2221,78 | 2221,85 | 0,07 | 18,86 |
| S1H5N4F2 | 2222,80 | 2222,81 | 0,01 | 21,14 |
| H6N5F1P1 | 2230,73 | 2230,65 | −0,08 | 25,66 |
| S2H5N4F1 | 2367,83 | 2367,90 | 0,07 | 6,61 |
| S2H6N5 | 2586,91 | 2586,96 | 0,05 | 5,97 |
| S1H6N5F2 | 2587,93 | 2587,97 | 0,04 | 8,97 |
DISCUSSION
Exosomes are formed in the multivesicular bodies (MVB) and upon appropriate stimuli these MVB fuse with cell membranes to release their contents (28). Exosomes can reflect the state of the cells secreting them (29). They can reflect, very early in the course of diseases, the changes going on in the cells upon pathophysiological stimuli. However, glycosylation of exosomal proteins is widely unknown with the exception of classes of glycans on the surface as evidenced by lectin binding assays. This surface glycome is known to change in autosomal dominant polycystic kidney disease compared with healthy volunteers' urinary exosomes (30). In this study, we have characterized multiple glycoproteins, their N-glycosylation site, glycan compositions, and structures. This is the first glycomic and glycoproteomic analysis of urinary exosomes.
N-glycopeptides were enriched from original digest to avoid the matrix effect as their ionization is impaired compared with nonglycosylated peptides. Nonglycosylated and glycosylated peptides compete for ionization, and ion suppression of glycopeptides can happen. In addition, compared with unmodified peptides from the same protein the molar amount of glycopeptides decreases as microheterogeneity increases.
N-glycopeptides were enriched by SNA lectin and SEC. They were initially enriched using SNA affinity chromatography but the number of structures mapped using the SNA alone was low. In the case of some other lectins such as RCA and PHA-E, the analysis did not yield any structures because of the very low amount of N-glycopeptides bound. It is well known that most lectins prefer multivalent ligands (31, 32). This multivalent context may not be preserved when glycoproteins are digested to N-glycopeptides reducing the affinity of lectins to N-glycopeptides and the yield of the chromatography. Therefore, we decided to adopt size exclusion chromatography to enrich N-glycopeptides. N-glycopeptides are generally larger than peptides and separate well in SEC (23). Peaks from SNA and SEC analysis were combined as one peak list file. In supplemental Table S2, the m/z values of N-glycopeptides observed in SNA and/or SEC are indicated as SNA or SEC. Our complete workflow is depicted in Fig. 2.
The most valuable data in this study is the amino acid sequence of N-glycopeptides, the assignment of glycosylation site and glycan composition (from glycomics and glycoproteomics experiments). However, this study also contains the structures proposed for the glycan part of multiple N-glycopeptides, which is derived from GlycomeDB search. More details about derivation of structures are given in the Methods section. These structures are only proposed and wherever possible the ambiguity in these assignments has been mentioned in the text and/or figures. Many structural features (fucosylation, bisecting HexNAc, and classes of glycans) have been manually verified by confirming the presence of diagnostic ions and drawing the structures from the given compositions using the knowledge of N-glycans.
The highest numbers of glycoforms were found for five N-glycosylation sites in cubilin (Fig. 4) and two sites in the galectin-3-binding protein. For cubilin, a number of structures were bisecting GlcNAc and many of them were core and/or antennal fucosylated. We have used intact peptide+glycan fragments from MS2 spectra to manually validate the core and in some cases the antennal fucosylation site. In most of them, fragment ions containing fucose were found. For m/z values of 1076.78, 1125.47, 844.35, 1107.8, 1053.1, and 1067.45, the fragment containing a whole peptide and HexNAc+Fucose (N1F1) [PN1F1 where P is intact peptide], a diagnostic ion was found in the annotated spectra. For m/z 916.37, a fragment ion of PH2N2F1 was found in the annotated spectra confirming the core fucosylation. For 984.1, the fragment ion of PN1F1 was not found, however, the fragment ion for PH2N3F1 was found, but based on only this fragment ion, it cannot be resolved whether the fucosylation is of core or of antennae. For this purpose, a glycan fragment of H1N1F1 was found in the annotated spectra, which would not have been possible if the glycan was only core fucosylated. For the m/z value of 1105.7, a peptide containing fragment ion of PH1N3F1 was found, which can only be true if the structure is bisecting and core fucosylated, as this structure is. For m/z 1107.7, a glycan fragment of H1N1F1 was found in the annotated spectra, which confirms that the glycosylation is antennal. Similarly for m/z 1053.7, the glycan fragment of H1N1F1 confirms that it is antennal fucosylated.
In the case of galectin-3-binding protein (supplemental Table S3), ions with m/z values of 1073.0, 1125.8, 1058.1, 944.1, 1015.1, 907.0, 990.4, 1131.5, 1082.7, 1028.7, 961.0, 1016.9, 1136.8, 1112.1 1121.9, and 10149.1, have the PN1F1 diagnostic ion. These include all the proposed structures with core fucoses and confirm that the position of the fucose is the core. With m/z value of 925.6, the proposed composition was S1H6N5F1. The structure matched to antennally fucosylated complex oligosaccharide in the database. However, in the spectra a PH2N3F1 fragment was found. Considering this fragment, it could also be a core that is fucosylated. If you rearrange the fucose to core, the glycan composition holds true. Therefore, in the case of this composition the presence of fucose is ambiguous.
An ion withan m/z value of 1131.5, which has a diagnostic ion for core fucose, also has antennal fucosylation. This spectra in addition to PN1F1, has a glycan fragment of H1N1F1, which can only be true if it is antennally fucosylated. It is unambiguous in the case of m/z 1131.5 that it is core as well as antennally fucosylated. However, this could also be two isobaric ions with one core and the other antennally fucosylated with the same mass and retention times. Manual confirmation of the presence of fucoses (manually searching the spectra for diagnostic ions containing fucose) as well as sialic acid moieties by using multiple diagnostic ions and fragments is of paramount importance. It is well known that fucose can be rearranged between antennae during MS2 fragmentation and fucose can be erroneously assigned to wrong antennae (33). Therefore, we write these structures as Lewis X/A/H antigen.
Microheterogeneity in the glycosylation site was detected on multiple peptides as shown in Fig. 4. Several Lewis X and/or LewisA/blood group H antigen structures were found in our analysis. One study has been published on mouse kidney proteins in which multiple Lewis X conjugated proteins were found (34). The authors treated the tissue proteins with α 1–2 fucosidase and found no evidence of LewisY epitopes, and using cross-ring cleavages based diagnostic ions in glycans released by PNGase-F, confirmed the absence of Lewis A and -B epitopes (35). The proteins that they confirmed to be Lewis X-conjugated are found in our study together with the Lewis X distinctive ion H1N1F1 that cannot be from core fucose. Precursors with m/z values of 1125.4, 1053.7, 984.1, and 1107.7 have the characteristic fragment H1N1F1. This finding strengthens our results and is in agreement with the published reports.
A corresponding glycomic analysis of exosomal proteins was done with matrix assisted laser desorption-ionization time of flight (MALDI-TOF). Neutral N-glycans and total N-glycome were analyzed in positive ion reflector mode as [M+Na]+ ions and acidic N-glycans in negative ion reflector mode as [M-H]− ions. Despite the data acquisition differences in glycomic and glycoproteomic analysis, when the nonmodified glycan compositions (having N-core) were analyzed, the results were surprisingly similar in terms of number of unique compositions found (66 versus 67) with roughly, a one third overlap between the two techniques. However, there were some preferences such as: sialylated glycans were better represented in glycoproteomic analysis compared with glycomic analysis.
In the mass spectrometric analysis of glycan and glycopeptides, enrichment is typically needed because of poor ionization of glycans and glycopeptides from complex mixtures for e.g. tryptic digest of exosomal proteins. The molecular classes/types/chemical properties of glycans are glycopeptides are vastly different, and thus, the enrichment methods also vary. Majority of the differences between glycomic and glycoproteomic analysis can be explained with different enrichment techniques, a graphitized carbon solid phase extraction and lectin/SEC, respectively, and ionization methods (ESI versus MALDI). Another difference is the use of RP-UPLC in glycoproteomic analysis, which reduces the complexity even further, increases the ionization efficiency of glycopeptides, and gives the instrument time to fragment them properly. Our results show that glycomic and glycopeptides analysis are complementary to each other and with overlap in results; multiple compositions can be confirmed with both the techniques.
Sulfated and/or phosphorylated glycan compositions were found in the negative mode analysis in MALDI (Table IV), which are absent in the glycoproteomic analysis. Detecting these modifications in glycoproteomic analysis using ESI-MS is inherently difficult because of their labile nature.
It has to be noted that fundamentally these two analyses types are very different from each other. MALDI analyzes the glycans that are mainly singly charged sodium adducts or deprotonated species (Glycomic), whereas the ESI-MS analyzes the glycopeptides that are mainly multiply charged (we have found and resolved +3 to +5) protonated (Glycoproteomic). In glycomic analysis one single glycan composition signal might be coming from tens of different proteins containing the same glycan. On the other hand, because of the peptide part, these same glycans are detected as different species in glycoproteomic experiments.
Glycoproteomic experiments split the intensity of single type of glycan into several different peaks, whereas glycomic analysis combines the intensity from several different proteins, which makes the direct comparison of these two types of data less fruitful. Glycomic analysis lacks the information on the protein part completely when performed on complex mixtures. Glycopeptide analysis provides information, which can relate to the function of a protein and its modulation by glycosylation, which is important in physiological and/or pathological states. Based on these observations, we would like to say that both of these two techniques will give a different view to the same analysis, and their data complement each other. However, it is clear that advances in both the techniques are needed in the near future to get a complete picture of the glycome of a given entity such as cells, tissues, or exosomes for that matter.
Combining the data from the glycomic and glycoproteomic approach revealed that exosomes seem to be enriched in fucosylated glycans. Fucosylation of glycan structures has been linked with cancer progression and inflammation (36). Fucosylated proteins such as carbohydrate antigen 19–9 and α-fetoprotein (AFP) have been used as serum tumor markers of pancreatic and liver cancer, respectively (37). The fucosylated form of AFP is better than AFP in diagnosing liver cancer (38). Of the total complex glycan structures found in our study, 50% were found to be fucosylated. Therefore, exosomes might prove to be a valuable source of biomarkers for these diseases. However, further studies to provide information about this potential of glycan structures are needed. The present study paves the way for studies to exploit the glycoproteomics of urinary exosomes in search of glycopeptide biomarkers as well as identifying the target proteins for uptake of exosomes by cells.
Supplementary Material
Acknowledgments
We thank the European Union IAPP program (#286386, UroSense) for funding the project.
Footnotes
Author contributions: M.S., S.J., L.M., H.H., and R.R. designed research; M.S. and S.J. performed research; H.P. contributed new reagents or analytic tools; M.S., S.J., and L.M. analyzed data; M.S., S.J., H.P., H.H., and R.R. wrote the paper.
 This article contains supplemental Figs. S1 to S5 and Tables S1 to S4.
1 The abbreviations used are:
- rpm
- Rounds per minute
- DEF
- Diatomaceous earth filter
- FDR
- False discovery rate
- FLLA
- Fluorophore-linked lectin assay
- H
- Hexose
- N
- N-acetyl hexosamine
- P
- Peptide
- P18
- Centrifugal pellet 18,000 × g
- P200
- Centrifugal pellet 200,000 × g
- PBST
- PBS with 0.1% (v/v) Tween 20
- RFU
- Relative fluorescence unit
- RT
- Room temperature
- S
- Sialic acid
- SN
- Supernatant
- TEM
- Transmission electron microscopy
- THP
- Tamm-Horsfall glycoprotein (Uromodulin).
REFERENCES
- 1. Thongboonkerd V., Malasit P. (2005) Renal and urinary proteomics: current applications and challenges. Proteomics 5, 1033–1042 [DOI] [PubMed] [Google Scholar]
- 2. Goligorsky M. S., Addabbo F., O'Riordan E. (2007) Diagnostic potential of urine proteome: a broken mirror of renal diseases. J. Am. Soc. Nephrol. 18, 2233–2239 [DOI] [PubMed] [Google Scholar]
- 3. Pisitkun T., Johnstone R., Knepper M. A. (2006) Discovery of urinary biomarkers. Mol. Cell Proteomics 5, 1760–1771 [DOI] [PubMed] [Google Scholar]
- 4. Wang L., Li F., Sun W., Wu S., Wang X., Zhang L., Zheng D., Wang J., Gao Y. (2006) Concanavalin A-captured glycoproteins in healthy human urine. Mol. Cell Proteomics 5, 560–562 [DOI] [PubMed] [Google Scholar]
- 5. Adachi J., Kumar C., Zhang Y., Olsen J. V., Mann M. (2006) The human urinary proteome contains more than 1500 proteins, including a large proportion of membrane proteins. Genome Biol. 7, R80. [DOI] [PMC free article] [PubMed] [Google Scholar]
- 6. Nieuwland R., Sturk A. (2010) Why do cells release vesicles? Thrombosis Res. 1, S49–S51 [DOI] [PubMed] [Google Scholar]
- 7. Pisitkun T., Shen R.-F., Knepper M. A. (2004) Identification and proteomic profiling of exosomes in human urine. Proc. Natl. Acad. Sci. U.S.A. 101, 13368–13373 [DOI] [PMC free article] [PubMed] [Google Scholar]
- 8. Bhatia P. K., Mukhopadhyay A. (1999) Protein glycosylation: implications for in vivo functions and therapeutic applications. Adv. Biochem. Eng. Biotechnol. 64, 155–201 [DOI] [PubMed] [Google Scholar]
- 9. Huet G., Gouyer V., Delacour D., Richet C., Zanetta J. P., Delannoy P., Degand P. (2003) Involvement of glycosylation in the intracellular trafficking of glycoproteins in polarized epithelial cells. Biochimie 85, 323–330 [DOI] [PubMed] [Google Scholar]
- 10. Escrevente C., Keller S., Altevogt P., Costa J. (2011) Interaction and uptake of exosomes by ovarian cancer cells. BMC Cancer 11, 108. [DOI] [PMC free article] [PubMed] [Google Scholar]
- 11. Batista B. S., Eng W. S., Pilobello K. T., Hendricks-Muñoz K. D., Mahal L. K. (2011) Identification of a conserved glycan signature for microvesicles. J. Proteome Res. 10, 4624–4633 [DOI] [PMC free article] [PubMed] [Google Scholar]
- 12. Nyalwidhe J. O., Betesh L. R., Powers T. W., Jones E. E., White K. Y., Burch T. C., Brooks J., Watson M. T., Lance R. S., Troyer D. A., Semmes O. J., Mehta A., Drake R. R. (2013) Increased bisecting N-acetylglucosamine and decreased branched chain glycans of N-linked glycoproteins in expressed prostatic secretions associated with prostate cancer progression. Proteomics 7, 677–689 [DOI] [PMC free article] [PubMed] [Google Scholar]
- 13. Krishnamoorthy L., Bess J. W., Jr., Preston A. B., Nagashima K., Mahal L. K. (2009) HIV-1 and microvesicles from T cells share a common glycome, arguing for a common origin. Nat. Chem. Biol. 5, 244–250 [DOI] [PMC free article] [PubMed] [Google Scholar]
- 14. Hao S., Bai O., Li F., Yuan J., Laferte S., Xiang J. (2007) Mature dendritic cells pulsed with exosomes stimulate efficient cytotoxic T-lymphocyte responses and antitumor immunity. Immunology 120, 90–102 [DOI] [PMC free article] [PubMed] [Google Scholar]
- 15. Barrès C., Blanc L., Bette-Bobillo P., André S., Mamoun R., Gabius H.-J., Vidal M. (2010) Galectin-5 is bound onto the surface of rat reticulocyte exosomes and modulates vesicle uptake by macrophages. Blood 115, 696–705 [DOI] [PubMed] [Google Scholar]
- 16. Parker B. L., Thaysen-Andersen M., Solis N., Scott N. E., Larsen M. R., Graham M. E., Packer N. H., Cordwell S. J. (2013) Site-specific glycan-peptide analysis for determination of N-glycoproteome heterogeneity. J. Proteome Res. 12, 5791–5800 [DOI] [PubMed] [Google Scholar]
- 17. Halim A., Nilsson J., Rüetschi U., Hesse C., Larson G. (2012) Human urinary glycoproteomics; attachment site specific analysis of N- and O-linked glycosylations by CID and ECD. Mol. Cell Proteomics 11 M111.013649. [DOI] [PMC free article] [PubMed] [Google Scholar]
- 18. Joenväärä S., Ritamo I., Peltoniemi H., Renkonen R. (2008) N-glycoproteomics–an automated workflow approach. Glycobiology 18, 339–349 [DOI] [PubMed] [Google Scholar]
- 19. Peltoniemi H., Joenväärä S., Renkonen R. (2009) De novo glycan structure search with the CID MS/MS spectra of native N-glycopeptides. Glycobiology 19, 707–714 [DOI] [PubMed] [Google Scholar]
- 20. Musante L., Saraswat M., Duriez E., Byrne B., Ravida A., Domon B., Holthofer H. (2012) Biochemical and physical characterisation of urinary nanovesicles following CHAPS treatment. PloS One 7, e37279. [DOI] [PMC free article] [PubMed] [Google Scholar]
- 21. Musante L., Saraswat M., Ravidà A., Byrne B., Holthofer H. (2013) Recovery of urinary nanovesicles from ultracentrifugation supernatants. Nephrol. Dial. Transplant. 28, 1425–1433 [DOI] [PubMed] [Google Scholar]
- 22. Kinter M., Sherman N. E. (2005) Protein Sequencing and Identification Using Tandem Mass Spectrometry, Wiley, Hoboken, NJ [Google Scholar]
- 23. Alvarez-Manilla G., Atwood, Guo Y., Warren N. L., Orlando R., Pierce M. (2006) Tools for glycoproteomic analysis: size exclusion chromatography facilitates identification of tryptic glycopeptides with N-linked glycosylation sites. J. Proteome Res. 5, 701–708 [DOI] [PubMed] [Google Scholar]
- 24. Nilsson J., Ruetschi U., Halim A., Hesse C., Carlsohn E., Brinkmalm G., Larson G. (2009) Enrichment of glycopeptides for glycan structure and attachment site identification. Nat. Methods 6, 809–811 [DOI] [PubMed] [Google Scholar]
- 25. Jefferis R., Lund J., Mizutani H., Nakagawa H., Kawazoe Y., Arata Y., Takahashi N. (1990) A comparative study of the N-linked oligosaccharide structures of human IgG subclass proteins. Biochem. J. 268, 529–537 [DOI] [PMC free article] [PubMed] [Google Scholar]
- 26. Takegawa Y., Deguchi K., Nakagawa H., Nishimura S.-I. (2005) Structural analysis of an N-glycan with “β1–4 bisecting branch” from Human serum IgG by negative-ion MSn spectral matching and exoglycosidase digestion. Anal. Chem. 77, 6062–6068 [DOI] [PubMed] [Google Scholar]
- 27. McCarthy F. M., Bridges S. M., Wang N., Magee G. B., Williams W. P., Luthe D. S., Burgess S. C. (2007) AgBase: a unified resource for functional analysis in agriculture. Nucleic Acids Res. 35, D599–D603 [DOI] [PMC free article] [PubMed] [Google Scholar]
- 28. Keller S., Sanderson M. P., Stoeck A., Altevogt P. (2006) Exosomes: From biogenesis and secretion to biological function. Immunol. Lett. 107, 102–108 [DOI] [PubMed] [Google Scholar]
- 29. Kucharzewska P., Christianson H. C., Welch J. E., Svensson K. J., Fredlund E., Ringnér M., Mörgelin M., Bourseau-Guilmain E., Bengzon J., Belting M. (2013) Exosomes reflect the hypoxic status of glioma cells and mediate hypoxia-dependent activation of vascular cells during tumor development. Proc. Natl. Acad. Sci. 110, 7312–7317 [DOI] [PMC free article] [PubMed] [Google Scholar]
- 30. Gerlach J. Q., Kruger A., Gallogly S., Hanley S. A., Hogan M. C., Ward C. J., Joshi L., Griffin M. D. (2013) Surface glycosylation profiles of urine extracellular vesicles. PloS One 8, e74801. [DOI] [PMC free article] [PubMed] [Google Scholar]
- 31. Sharon N., Lis H. (2007) Lectins, Springer [Google Scholar]
- 32. García-Vallejo J. J., Ambrosini M., Overbeek A., van Riel W. E., Bloem K., Unger W. W. J., Chiodo F., Bolscher J. G., Nazmi K., Kalay H., van Kooyk Y. (2013) Multivalent glycopeptide dendrimers for the targeted delivery of antigens to dendritic cells. Mol. Immunol. 53, 387–397 [DOI] [PubMed] [Google Scholar]
- 33. Wuhrer M., Koeleman C. A. M., Hokke C. H., Deelder A. M. (2006) Mass spectrometry of proton adducts of fucosylated N-glycans: fucose transfer between antennae gives rise to misleading fragments. Rapid Commun. Mass Spectrom. 20, 1747–1754 [DOI] [PubMed] [Google Scholar]
- 34. Hashii N., Kawasaki N., Itoh S., Nakajima Y., Harazono A., Kawanishi T., Yamaguchi T. (2009) Identification of glycoproteins carrying a target glycan-motif by liquid chromatography/multiple-stage mass spectrometry: identification of lewis x-conjugated glycoproteins in mouse kidney. J. Proteome Res. 8, 3415–3429 [DOI] [PubMed] [Google Scholar]
- 35. Hashii N., Kawasaki N., Itoh S., Harazono A., Matsuishi Y., Hayakawa T., Kawanishi T. (2005) Specific detection of Lewis x-carbohydrates in biological samples using liquid chromatography/multiple-stage tandem mass spectrometry. Rapid Commun. Mass Spectrom. 19, 3315–3321 [DOI] [PubMed] [Google Scholar]
- 36. Lau K. S., Partridge E. A., Grigorian A., Silvescu C. I., Reinhold V. N., Demetriou M., Dennis J. W. (2007) Complex N-glycan number and degree of branching cooperate to regulate cell proliferation and differentiation. Cell 129, 123–134 [DOI] [PubMed] [Google Scholar]
- 37. Szymendera J. J. (1986) Clinical usefulness of three monoclonal antibody-defined tumor markers: CA 19–9, CA 50, and CA 125. Tumour Biol. 7, 333–342 [PubMed] [Google Scholar]
- 38. Aoyagi Y., Saitoh A., Suzuki Y., Igarashi K., Oguro M., Yokota T., Mori S., Suda T., Isemura M., Asakura H. (1993) Fucosylation index of alpha-fetoprotein, a possible aid in the early recognition of hepatocellular carcinoma in patients with cirrhosis. Hepatology 17, 50–52 [PubMed] [Google Scholar]
Associated Data
This section collects any data citations, data availability statements, or supplementary materials included in this article.