Abstract
Purpose
To determine the effect of bilateral superior laryngeal nerve (SLN) lesion on swallowing threshold volume and the occurrence of aspiration, using a novel measurement technique for videofluorscopic swallowing studies (VFSS).
Methods and Materials
We used a novel radiographic phantom to assess volume of the milk containing barium from fluoroscopy. The custom made phantom was firstly calibrated by comparing image intensity of the phantom with known cylinder depths. Secondly, known volume pouches of milk in a pig cadaver were compared to volumes calculated with the phantom. Using these standards, we calculated the volume of milk in the valleculae, esophagus and larynx, for 205 feeding sequences from four infant pigs feeding before and after had bilateral SLN lesions. Swallow safety was assessed using the IMPAS scale.
Results
The log-linear correlation between image intensity values from the phantom filled with barium milk and the known phantom cylinder depths was strong (R2>0.95), as was the calculated volumes of the barium milk pouches. The threshold volume of bolus in the valleculae during feeding was significantly larger after bilateral SLN lesion than in control swallows (p<0.001). The IMPAS score increased in the lesioned swallows relative to the controls (p<0.001).
Conclusion
Bilateral SLN lesion dramatically increased the aspiration incidence and the threshold volume of bolus in valleculae. The use of this phantom permits quantification of the aspirated volume of fluid. The custom made phantom and calibration allow for more accurate 3D volume estimation from 2D x-ray in VFSS.
Keywords: superior laryngeal nerve, threshold volume, phantom, aspiration, VFSS, animal model, videofluoroscopy, deglutition/deglutition disorders
INTRODUCTION
Dysphagia, the inability to swallow safely, is a significant but overlooked problem that can result in aspiration pneumonia [1, 2]. The gold standard for quantifying the kinematics of swallowing is a video fluoroscopic swallowing study, using barium (Ba) as a contrast agent [3]. In addition to measuring the movements of relevant anatomical structures, this 2D technique involves both quantitative measurements and qualitative assessments of bolus volume [4]. One critical measurement is the fluid remaining in the oropharynx after a swallow, the pharyngeal residue. The amount of residue in the pharynx after a swallow is known as a predictor of subsequent aspiration [4, 5]. However, there is no validated method to quantify the aspirated volume of liquid directly, and this is usually assessed qualitatively [6]. Most studies provide an a priori measured bolus to swallow [6–11].
Few studies use bolus area (2D) to indirectly estimate bolus volume (3D) in the videofluoroscopic swallowing study (VFSS), as a means of evaluating the changes of bolus volume in normal and abnormal swallowing [12, 13]. Although the area can indirectly represent the volume to some extent, especially lacking a better method to evaluate the volume, it will be valuable to accurately estimate the bolus volume based on both the area and the intensity in the VFSS for both clinical and research purposes.
The superior laryngeal nerve (SLN), a branch of Vagus (CN X) plays an important role in successful swallow. Our previous studies demonstrated that unilateral SLN lesion results in an increased swallowing threshold volume, measured by the 2D area in videofluroscopy, and higher aspiration incidence compared to the control swallows [13, 14]. However, it is unknown whether bilateral SLN lesion would have a more severe impact on swallowing.
In this study we first developed and validated a novel radiologic phantom as the basis for a new method to quantify bolus volume. We calibrated the image intensity values of the swallowing bolus area from the 2D fluoroscopic images, using known volumes of liquid. Then we used this phantom and technique and applied them to our validated infant pig animal model of dysphagia to measure the effect of bilateral SLN lesion on the pharyngeal threshold and aspirated volume.
MATERIALS AND METHODS
1. Phantom Study
(1) Design of Phantom
The calibration phantom had three parts: the lid, the bottom with eight tubes that contained the barium liquid and the subsidiary parts holding the lid to the bottom (Fig 1). The bottom was a custom designed rectangular block of Plexiglas with 100mm in length, 54mm in width and 35mm in height, with 8 counter-sunk cylindrical holes (tubes) ranging from 2 to 25mm in depth and 15mm in diameter. Each tube had a flat bottom and was counter-sunk from the opposite side to achieve a 10mm thick bottom Thus the eight tubes had the same bottom thickness. The lid is a thin plate of Plexiglas with 100mm in length, 54mm in width and 10mm in height. There are 15 additional large holes, sufficient for large screw-heads and 8 small holes to fit small O-rings and small screw-heads. The large O-ring indentation in the other surface to touch the bottom part is 1mm thick with an outer diameter of 17mm. The subsidiary parts included 15 large screws, 8 small screws, 8 large O-rings and 8 small O-rings. All O-rings are made of standard Viton Fluoroelastomer and the screws are made of Plastic Nylon 6/6. They are used to seal the lid to the base to prevent any liquid leakage from the tubes. The holes for large screws are evenly distributed across the lid surface. The holes of the small screws are located eccentrically in the lid facing each tube. The large O-rings are placed on the tube surface between the lid and the base with 15mm inside diameter and 17mm outside diameter. And the small O-rings are placed into the holes to make the contact surface tight between the small screws and the lid holes with 3.2mm inside diameter and 6.4 outside diameter. The large screws are fully threaded with 4.8mm in depth and 6.4mm in length. The small screws with 2.8mm by12.7mm were used to expel air from the tube after tightening the lid on the bottom to eliminate any potential error due to air. The phantom was made in the Mechanic Store in the Mechanical Engineering Department, the Johns Hopkins University.
Figure 1.
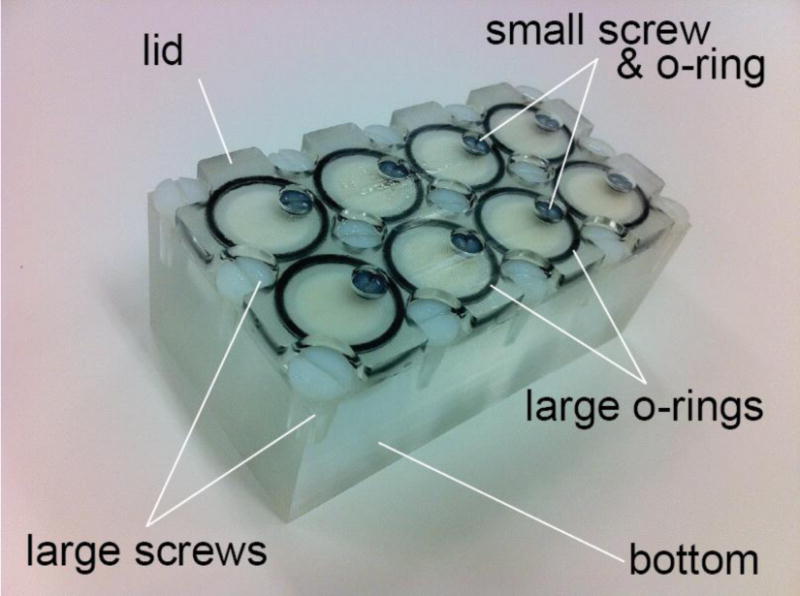
The custom made phantom is consisted of the lid, the bottom, and the subsidiary parts. The bottom had eight cylindical tubes ranging from 2 to 25mm in depth and all had the same 15mm diameter. The subsidiary parts included 15 large screws, 8 small screws, 8 large O-rings and 8 small O-rings. The barium milk was filled through the small screw opening and the offset location allowed for release of air bubbles to ensure a completely filled cylinder for accurate calibration. At the conclusion of every experiment, the lid was removed for cleaning the phantom and especially to ensure that new barium milk is used for every experiment because over time, the mixture can separate.
(2) Proof of Idea
We used a flat panel X-ray C-arm (FD20, Philips Healthcare, Best, The Netherlands) to test for accurate calculation of volume with the custom made phantom. For imaging, we set temporal resolution to be 60 frames per second and a fixed voltage of 60 kVp. The fixed voltage protocol ensured the tube voltage did not automatically change by the system during a single scanning session. The eight tubes were filled with milk at a concentration of 1/3 cup barium powder (E-Z-HD, E-Z-EM, Inc., Westbury, NY, USA) mixed with 8 oz milk replacement formula (Land O Lakes Solustart Pig Milk Replacer, St. Paul, MN). These ratios are same as the formula used in our live animal studies later. We attached the phantom bottom to the surface of the image detector with mounting strips (Command, 3M Co., St. Paul, MN, USA) so that all the tubes with barium milk could be imaged. Because the tubes have different depths, and contain different amounts of milk with barium, they will have different intensity on a radiographic image (Fig 2). We used ImageJ (NIH, Bethesda, MD, USA) [15] to measure the mean area intensity in each tube.
Figure 2.
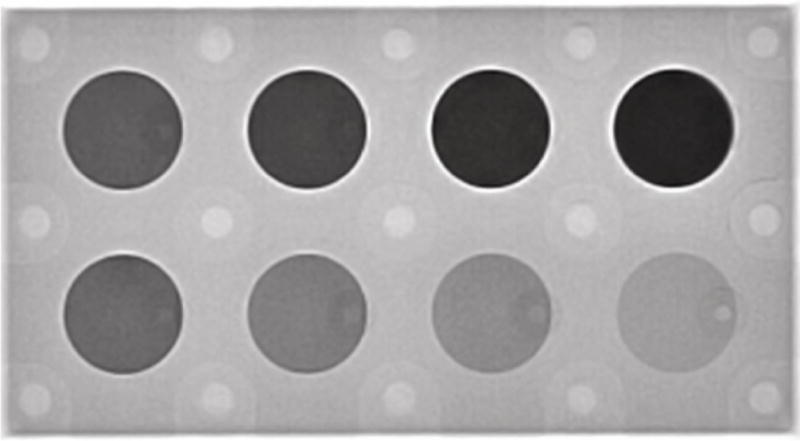
The phantom imaged under videofluoroscopy with eight tubes filled with barium milk. The tubes ranged from 2mm to 25mm in depth. The phantom was attached to the detector of the X-ray machine.
(3) Cadaver test
The phantom containing barium milk was imaged with a pig cadaver. Milk containing barium at the same concentration was placed in clear plastic pouches externally over the pharyngeal area on the neck of the cadaver. Placing the pouches internally was difficult because of the proximity of the teeth in the image. Three different pouches with known volumes (1, 2, and 3ml) were used. Then the cadaver and phantom were imaged with the same configuration as for the phantom alone (Fig 3). We used ImageJ to measure the mean area intensity and the area of the eight tubes, pouch, surrounding tissue around the pouch, for the analysis of calibration described below. Log transformation of the data in ImageJ uses natural logs (base e) and scales to the minimum and maximum of the image.
Figure 3.
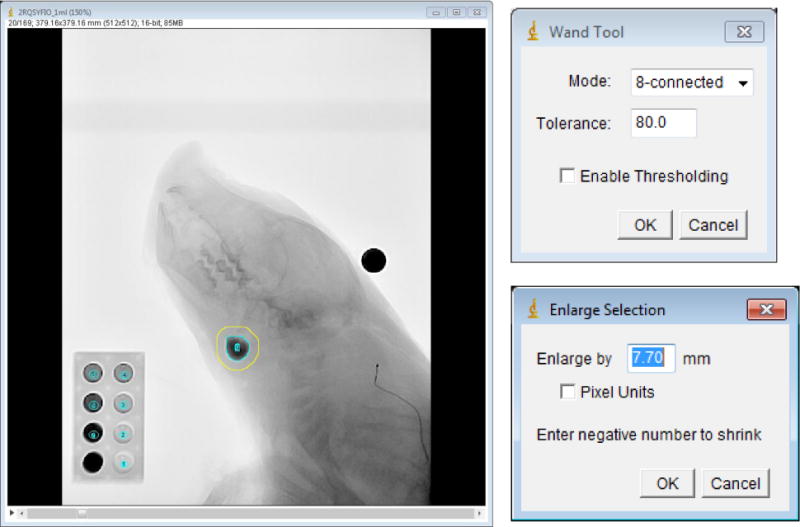
Determination of the area and intensity of the bolus and its surrounding tissue. Left: the barium bolus pouch indicated with the inner, blue circle. We measured the surrounding tissue, shown with the yellow circle. The high-intensity object above the animal’s head was a metal ball with diameter of 12.69mm used for spatial scaling. The phantom, shown on the lower left of this image, was used for the calibration of the intensity attenuation coefficient. Upper right panel: setup of the Wand Tool to measure the bolus area and intensity. Lower right panel: set up of the Enlarge Selection for the measurement of the bolus surrounding tissue.
(4) Calibration of Phantom
Calibration was performed as follows in four steps. (i) Calculation of the intensity attenuation coefficient (IAC) of the image. The IAC was calculated based on the relationship between the known phantom cylinder depth (represented by the barium liquid depth in each tube) and its intensity values measured in ImageJ from the original image data (Fig 4). (ii) Spatial scaling. The magnification of the videofluroscopic image was corrected by using a metal ball with known diameter (12.96mm) attached to the midline of the cadaver neck. Based on this scaling, we corrected the bolus area from pixel units to mm2. This was the bolus area. (iii) Measurement of the area and intensity of the bolus and its surrounding tissue. The bolus area and its surrounding tissue were segmented by a region growing method and mathematical morphological dilation. In ImageJ, we used the 8-connected region growing with empirically determined tolerance of 80. Then the bolus area and intensity of the region of interested were measured. Morphological dilation was employed to measure the mean intensity of the surrounding region (Fig 3). (iv) Calculation of the bolus volume. Due to the overlap with the surrounding tissue, the net bolus intensity was the reduction of the bolus intensity without its surrounding tissue. The formula was the bolus intensity subtracted by its surrounding tissue. Based on the IAC (R2) coming from the depth-intensity curve, we can calculate the bolus density with the net bolus intensity divided by the IAC. The bolus depth multiplied by its area then results in the bolus volume.
Figure 4.
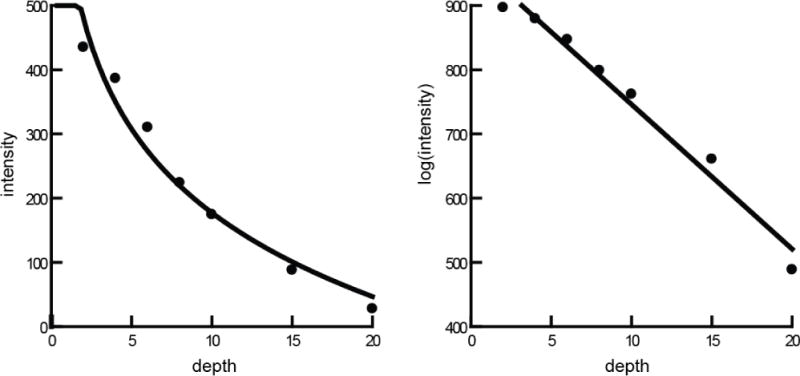
The depth-intensity curve of the phantom data. The left curve line was based on original image data and the right linear line was based on log image data, calculated by ImageJ. The seven points are from the data of the tubes filled with barium milk with different depth ranging from 2mm to 20mm. The scale is abritary units of intensity and volume. R2 > 0.97 for both models.
2. Nerve Lesion Study
The pigs were first fed using the standard protocol for studies of infant pigs [13, 14, 16–19]. Prior to feeding, animals were briefly anesthetized so that radio-opaque markers could be inserted into the tongue, jaws, hyoid, epiglottis and soft palate. After full recovery from anesthesia, the animals are permitted to stand, unrestrained, in a radiolucent box, and approach the nipple for feeding. The milk containing barium is in a standard 8 oz baby bottle, fitted with a pig nipple (Nasco Inc., Fort Atkinson, WI). The animals are recorded feeding, using the same radiographic apparatus, with the same settings, as was used for the tests described above.
After collecting sufficient control data (3 feeding sessions, including 110 swallows), the animals were fasted overnight, prior to the surgical procedure to lesion the SLN. The procedure was identical to that for a single SLN lesion, except performed on both sides (Ding et al. 2013). The animals were placed in a deep plane of anesthesia, and under sterile conditions, an incision was made, with the aid of surgical loupes, on the lateral side, first right, and then left, to expose, the SLN. This nerve was found as it originated from the Vagus inside the carotid sheath. It ran caudally and medially on the surface of the thyrohyoid membrane beneath the omohyoid muscle. At this point, its internal sensory branch pierced the thyrohyoid membrane. We dissected the SLN close to its Vagal origin. The SLN tracing procedures in the carotid triangle were performed with microsurgical instruments to avoid injury to the SLN and surrounding tissues (Ding et al 2013). After complete recovery from anesthesia, the animals were recorded while feeding, using the same protocol as for control feedings. The animals were given analgesics and antibiotics daily and showed no signs of distress or pain after the surgeries.
From the recorded digital images, we first outlined the bolus in the esophagus to get the bolus area and the intensity by ImageJ (Fig 5). Next, we measured the intensity in the empty esophagus in the same area after the bolus was propelled through shown in the right photo. With a similar method, we measured the volume in the valleculae. Finally, we compared these two volumes to determine the amount of milk aspirated into the larynx or trachea. We defined the aspirated volume by distracting the threshold volume in valleculae by that in the esophagus. The Infant Mammalian Penetration-Aspiration Scale (IMPAS) was used to measure swallow safet [20].
Figure 5.
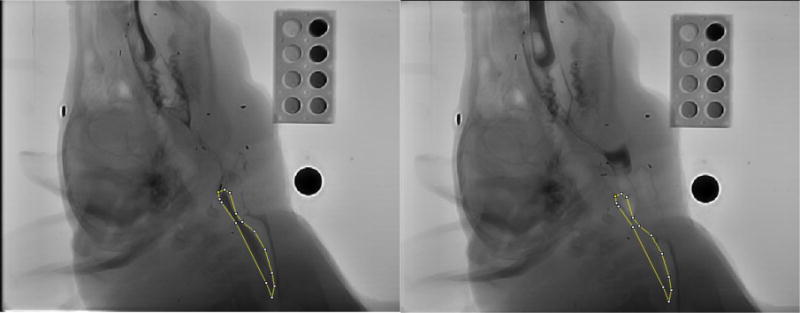
The method to estimate the bolus volume in the esophagus after swallowing. We first outlined the profile of the bolus in the esophagus to get the bolus area and the intensity by ImageJ (left). Next, we measured the empty esophagus intensity in the same area after bolus was propelled through it (right). These measurements were used to calculate the volume.
Results
1. Phantom Study
(1) Proof of Idea
The image intensity of the 25mm tube was too dark (x-rays could not penetrate to reach the detector) and unrepresentative of what is seen in-vivo, so it was excluded from subsequent analysis. The relationship between the seven phantom tubes density and its original intensity values (Table 1) fit a log-linear line with R2 value of 0.98 (Figure 3). Hence, we transformed the image data to a log measurement, using the scaled natural log algorithms of ImageJ. Based on the log image data (Table 2), the relationship between image intensity (y) and the amount of milk containing barium (x) was linear (Figure 4). The IAC (R2) was 0.98. The linear x-y equation was:
Table 1.
Image data of the seven phantom tubes depth and its intensity values.
| Depth | Area (mm2) | Mean Intensity | StdDev | Min | Max | Slice # |
|---|---|---|---|---|---|---|
| 2mm | 39.49 | 435.21 | 10.05 | 411 | 457 | 20 |
| 4mm | 39.49 | 386.6 | 8.27 | 372 | 409 | 20 |
| 6mm | 46.07 | 310.44 | 9.85 | 290 | 339 | 20 |
| 8mm | 55.94 | 224.25 | 9.51 | 197 | 248 | 20 |
| 10mm | 52.65 | 174.67 | 8.1 | 159 | 195 | 20 |
| 15mm | 46.07 | 88.11 | 5.01 | 77 | 101 | 20 |
| 20mm | 47.16 | 27.92 | 5.02 | 17 | 42 | 20 |
Table 2.
Logged (ImageJ protocol) image data of the seven phantom tubes depth and its intensity values.
| Depth | Area (mm2) | Mean Intensity | StdDev | Min | Max | Slice # |
|---|---|---|---|---|---|---|
| 2mm | 39.49 | 897.07 | 3.36 | 889 | 904 | 20 |
| 4mm | 39.49 | 879.61 | 3.19 | 874 | 888 | 20 |
| 6mm | 46.07 | 847.19 | 4.61 | 837 | 860 | 20 |
| 8mm | 55.94 | 799.02 | 6.22 | 780 | 814 | 20 |
| 10mm | 52.65 | 762.09 | 6.78 | 748 | 778 | 20 |
| 15mm | 46.07 | 661.01 | 8.46 | 641 | 681 | 20 |
| 20mm | 47.16 | 488.81 | 27.81 | 418 | 552 | 20 |
This means that every mm of barium milk thickness decreased the intensity by −22.52 intensity units.
(2) Cadaver test
The area and intensity of the bolus and its surrounding tissue as well as the metal ball diameter were shown on Table 3.
Table 3.
The area and intensity of the bolus and its surrounding tissue as well as the metal ball diameter in three different pouches with known volume 1, 2 and 3 ml.
| Area | Mean Intensity | StdDev | Min | Max | Length | ||
|---|---|---|---|---|---|---|---|
| 1 ml | Bolus | 299.98 | 677.62 | 67.69 | 544 | 818 | |
| Sur tissue | 955.89 | 794.35 | 89.12 | 544 | 904 | ||
| Metal ball | 19.36 | ||||||
| 2 ml | Bolus | 410.76 | 615.88 | 90.62 | 378 | 788 | |
| Sur tissue | 1141.25 | 774.79 | 133.31 | 378 | 934 | ||
| Metal ball | 19.25 | ||||||
| 3 ml | Bolus | 587.9 | 599.38 | 89.62 | 389 | 796 | |
| Sur tissue | 1433.01 | 759.8 | 149.17 | 389 | 967 | ||
| Metal ball | 19.25 |
The net surrounding tissue intensity was:
The net bolus intensity was:
The bolus depth was:
The bolus volume measured was:
-
(i)1ml bolus. The equation based on the log image data was:
Based on the equation shown above, the bolus volume measured was 0.93ml. -
(ii)2ml bolus. The equation we got based on the phantom was:
Based on the equation shown above, the bolus volume measured was 1.93ml. -
(iii)3ml bolus. The equation we got based on the phantom was:
Based on the equation shown above, the bolus volume measured was 3.09ml.
2. Nerve Lesion Study
(1) IMPAS
There was a significant difference in the IMPAS score between swallows in control animals relative to those in bilateral SLN (paired t-test, p<0.001) (Fig 6). The R2 of phantom volume for both the control and lesioned groups were significant (0.96±0.03 in control, 0.97±0.01 in lesioned swallows).
Figure 6.
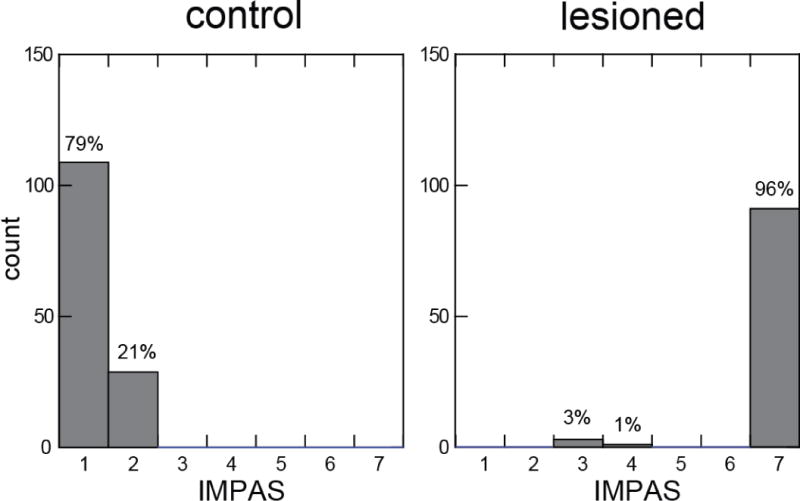
IMPAS scores for swallows from control and bilateral SLN lesioned animals. The IMPAS of the control swallows (1.2 ± 0.4) was significantly different from the lesioned swallows (6.8 ± 0.8) (paired test, p<0.001).
(2) Pharyngeal threshold
In control swallows, the threshold volume in valleculae was 0.89 ml (sd, 0.95). After bilateral SLN lesion, the threshold volume in valleculae was 1.19 ml (sd, .42). In three subjects, the median threshold volume was larger in the lesioned swallows than the control shown (Fig 7). The bolus volume threshold in valleculae in the post-lesion swallows was significantly larger than the pre-lesion swallows (ANOVA, p=0.004).
Figure 7.
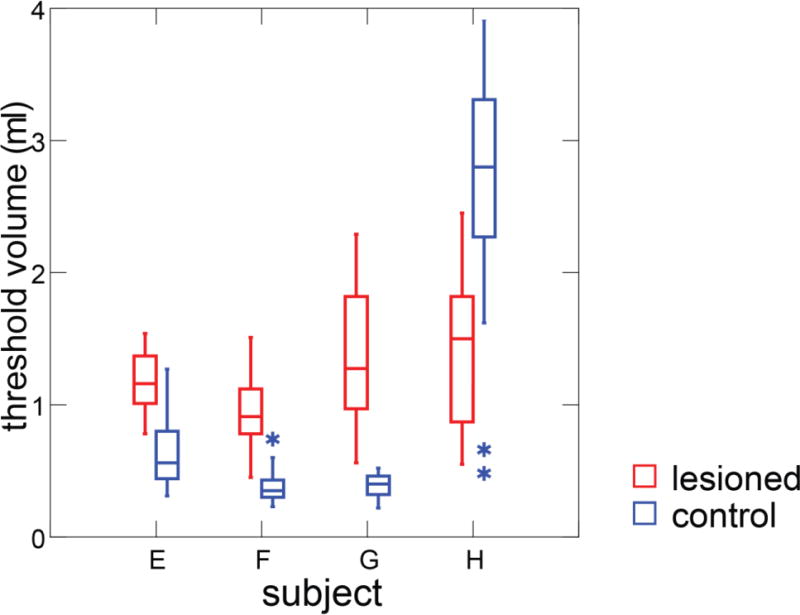
Box plots of threshold volume in the valleculae in control and bilateral SLN lesioned swallows.
(3) Aspirated volume
After bilateral SLN lesion, a large amount of fluid containing barium was visibly retained in the airway and then some of the bolus went down to the trachea and bronchi. The bolus volume in esophagus after swallowing was 0.89 ml (sd, 0.22) from 3 subjects after bilateral SLN lesion. The vallecular volume was 1.19 ml (sd, 0.42). One subject (Subject H) was excluded from aspiration calculation due to the caudal moving during the feeding after nerve lesion, which resulted in some esophagus image out of grid. Hence, the aspiration volume in three subjects was 0.18 ml (sd, ±0.21). The bolus volume in the esophagus was significantly smaller than that in the valleculae after bilateral SLN lesion (paired t-test, p<0.001) (Fig 8). No animal coughed during feeding.
Figure 8.
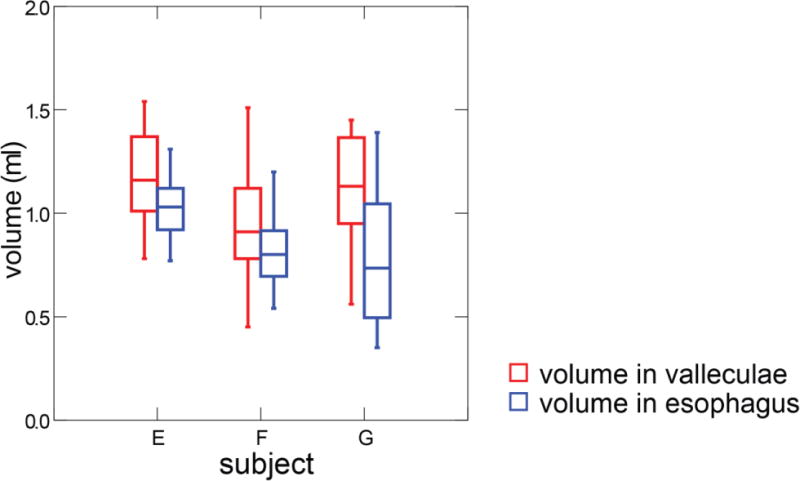
Box plots of threshold volume in valleculae compared to bolus volume in esophagus after swallowing in bilateral SLN lesion animals. Esophageal images were not visible for Subject H due to excessive movement of this individual.
Discussion
In recent years, numerous 3D techniques have been widely developed and utilized like CT [21], ultrasound [22], photography [23] etc. With 3D techniques, measurement of volume instead of area is relatively easy. For fluoroscopy imaging, biplanar techniques permit volume estimation [24]. However, high-dose radiation, expense and limited availability of equipment make biplanar fluoroscopy impractical and unethical for widespread clinical use. In this study we have shown that a custom designed phantom made it possible to calculate the 3D bolus volume in 2D VFSS with high accuracy and reliability. Relative to the biplanar fluoroscopy, the advantages of our proposed method are: (1) a much lower radiation dose, resulting in higher patient/subject safety; and (2) a cheaper and simpler approach which can easily be added to a VFSS. The limitations are: (1) clinical studies tend not to use barium powder, but commercial barium liquid. We did not test such fluids; and (2) our manual analysis was time-consuming. A semi-automated fluoroscopic analysis software could be developed in the future to facilitate the use of our methods in clinical applications. Given the high accuracy and advantages, such a custom made phantom has high potential for the clinical applications in the future, allowing researchers to study aspiration and its related risk factors quantitatively.
We have previously shown that a unilateral SLN lesion increases the estimated threshold volume of liquid for swallowing using maximum bolus area in valleculae [13]. In this study, we used a more accurate volume estimation to show that bilateral SLN lesion dramatically increased the threshold volume in valleculae. As we hypothesized in the single lesion model, the increase of threshold volume likely stems from the loss of the pharyngeal sensory input from the internal SLN lesions. In this study, one of the animals was different from this pattern in having a lower threshold volume after bilateral SLN lesion compared with pre-lesion swallows. This pig, however, had a distinct behavior that differed from its control behavior and every other post-lesion pig. It approached to the nipple many times to try, but drank very little, and backed away from the nipple. This behavior lasted for several days without variation. The avoidance of feeding may be due to voluntary caution since no enough pharyngeal sensory input was sent to the brain, or be due to the strong sensory input from the aspirated food in the trachea and lung, which could consequently inhibit the feeding.
The airway protection documented in this study after bilateral SLN lesion, was significantly worse than unilateral SLN lesion as measured by the IMPAS [13, 14]. One possible reason could be the dysfunctional laryngeal closure. An afferent signal arising from the internal SLN receptor field is necessary for normal deglutition, especially for providing feedback to central neural circuits that facilitate laryngeal closure during swallowing [25]. Another reason, not exclusive to the first, could lie in the increase of threshold volume in valleculae, an increase in the risk of spillage of bolus into the airway. Finally, the loss of the internal SLNs is known to cause dysfunction of the cough reflex [26], which in turn produces a failure of airway protection.
This study also provided a robust measurement to quantitate the aspirated fluid during VFSS with our custom made phantom. Using this method makes it possible to further quantify the relationship between aspirated volume and aspiration pneumonia in the future.
Conclusion
Bilateral SLN lesion dramatically increased the aspiration incidence and the threshold volume of bolus in valleculae. The use of our novel phantom and method permit quantification of the volume of fluid aspirated. The custom made phantom and calibration allow for highly accurate 3D volume estimation from 2D x-ray images in VFSS.
Acknowledgments
We appreciate Laurie Pipitone for her support in the radiologic procedures and tests. We also thank Melanie Albano and Kristy Koenig for their work in the animal surgery and Stacey L. Lukasik for her assistance during the whole study. This study was funded by the National Institutes of Health, DC009980 to RZG.
Footnotes
The work was done in the Johns Hopkins University School of Medicine.
Conflict of interest:
The authors declare that we have no conflicts of interest.
References
- 1.Holman SD, et al. Development, reliability, and validation of an infant mammalian penetration-aspiration scale. Dysphagia. 2013;28(2):178–87. doi: 10.1007/s00455-012-9427-8. [DOI] [PMC free article] [PubMed] [Google Scholar]
- 2.Marik PE, Kaplan D. Aspiration pneumonia and dysphagia in the elderly. Chest. 2003;124(1):328–36. doi: 10.1378/chest.124.1.328. [DOI] [PubMed] [Google Scholar]
- 3.van der Maarel-Wierink CD, et al. Meta-analysis of dysphagia and aspiration pneumonia in frail elders. J Dent Res. 2011;90(12):1398–404. doi: 10.1177/0022034511422909. [DOI] [PubMed] [Google Scholar]
- 4.Rugiu MG. Role of videofluoroscopy in evaluation of neurologic dysphagia. Acta Otorhinolaryngol Ital. 2007;27(6):306–16. [PMC free article] [PubMed] [Google Scholar]
- 5.O’Connell DA, et al. Swallowing function in patients with base of tongue cancers treated with primary surgery and reconstructed with a modified radial forearm free flap. Arch Otolaryngol Head Neck Surg. 2008;134(8):857–64. doi: 10.1001/archotol.134.8.857. [DOI] [PubMed] [Google Scholar]
- 6.Pauloski BR, et al. Relationship between manometric and videofluoroscopic measures of swallow function in healthy adults and patients treated for head and neck cancer with various modalities. Dysphagia. 2009;24(2):196–203. doi: 10.1007/s00455-008-9192-x. [DOI] [PMC free article] [PubMed] [Google Scholar]
- 7.Dua K, et al. Pharyngeal airway protective reflexes are triggered before the maximum volume of fluid that the hypopharynx can safely hold is exceeded. American journal of physiology. Gastrointestinal and liver physiology. 2011;301(2):G197–202. doi: 10.1152/ajpgi.00046.2011. [DOI] [PMC free article] [PubMed] [Google Scholar]
- 8.Ueda N, et al. Effects of the bolus volume on hyoid movements in normal individuals. Journal of oral rehabilitation. 2013;40(7):491–9. doi: 10.1111/joor.12060. [DOI] [PubMed] [Google Scholar]
- 9.Lazarus CL, et al. Effects of bolus volume, viscosity, and repeated swallows in nonstroke. Archives of physical medicine and rehabilitation. 1993;74(10):1066–70. doi: 10.1016/0003-9993(93)90063-g. [DOI] [PubMed] [Google Scholar]
- 10.Molfenter SM, Steele CM. Variation in temporal measures of swallowing: sex and volume effects. Dysphagia. 2013;28(2):226–33. doi: 10.1007/s00455-012-9437-6. [DOI] [PubMed] [Google Scholar]
- 11.Ren J, et al. Effect of age and bolus variables on the coordination of the glottis and upper esophageal sphincter during swallowing. The American journal of gastroenterology. 1993;88(5):665–9. [PubMed] [Google Scholar]
- 12.Shaker R, et al. Effect of aging, position, and temperature on the threshold volume triggering pharyngeal swallows. Gastroenterology. 1994;107(2):396–402. doi: 10.1016/0016-5085(94)90164-3. [DOI] [PubMed] [Google Scholar]
- 13.Imam H, Marrero F, Shay S. Impedance nadir values correlate with barium bolus amount. Dis Esophagus. 2012;25(7):600–7. doi: 10.1111/j.1442-2050.2011.01302.x. [DOI] [PubMed] [Google Scholar]
- 14.Ding P, et al. The effect of unilateral superior laryngeal nerve lesion on swallowing threshold volume. Laryngoscope. 2013 doi: 10.1002/lary.24051. [DOI] [PMC free article] [PubMed] [Google Scholar]
- 15.Ding P, et al. Unilateral Superior Laryngeal Nerve Lesion in an Animal Model of Dysphagia and Its Effect on Sucking and Swallowing. Dysphagia. 2013 doi: 10.1007/s00455-013-9448-y. [DOI] [PMC free article] [PubMed] [Google Scholar]
- 16.Schneider CA, Rasband WS, Eliceiri KW. NIH Image to ImageJ: 25 years of image analysis. Nature Methods. 2012;9:671–675. doi: 10.1038/nmeth.2089. [DOI] [PMC free article] [PubMed] [Google Scholar]
- 17.Holman SD, et al. Swallowing kinematics and airway protection after palatal local anesthesia in infant pigs. Laryngoscope. 2013 doi: 10.1002/lary.24204. [DOI] [PMC free article] [PubMed] [Google Scholar]
- 18.Holman SD, et al. Sucking and swallowing rates after palatal anesthesia: an electromyographic study in infant pigs. J Neurophysiol. 2013 doi: 10.1152/jn.00064.2013. [DOI] [PMC free article] [PubMed] [Google Scholar]
- 19.German RZ, et al. The mechanism of suckling in two species of infant mammal: miniature pigs and long-tailed macaques. J Exp Zool. 1992;261(3):322–30. doi: 10.1002/jez.1402610311. [DOI] [PubMed] [Google Scholar]
- 20.Thexton AJ, Crompton AW, German RZ. Transition from suckling to drinking at weaning: a kinematic and electromyographic study in miniature pigs. J Exp Zool. 1998;280(5):327–43. doi: 10.1002/(sici)1097-010x(19980401)280:5<327::aid-jez2>3.0.co;2-q. [DOI] [PubMed] [Google Scholar]
- 21.Ding P, et al. The effect of unilateral superior laryngeal nerve lesion on swallowing threshold volume. The Laryngoscope. 2013;123(8):1942–7. doi: 10.1002/lary.24051. [DOI] [PMC free article] [PubMed] [Google Scholar]
- 22.Ding P, Tufano RP, German RZ. Anatomical anomalies of the laryngeal branches of the vagus nerve in pigs (Sus scrofa) Laboratory animals. 2012;46(4):338–40. doi: 10.1258/la.2012.012091. [DOI] [PubMed] [Google Scholar]
- 23.Holman SD, et al. Development, Reliability, and Validation of an Infant Mammalian Penetration-Aspiration Scale. Dysphagia. 2012 doi: 10.1007/s00455-012-9427-8. [DOI] [PMC free article] [PubMed] [Google Scholar]
- 24.Sun Z. Multislice computed tomography angiography in the diagnosis of cardiovascular disease: 3D visualizations. Front Med. 2011;5(3):254–70. doi: 10.1007/s11684-011-0153-7. [DOI] [PubMed] [Google Scholar]
- 25.Dorosz JL, et al. Performance of 3-dimensional echocardiography in measuring left ventricular volumes and ejection fraction: a systematic review and meta-analysis. J Am Coll Cardiol. 2012;59(20):1799–808. doi: 10.1016/j.jacc.2012.01.037. [DOI] [PMC free article] [PubMed] [Google Scholar]
- 26.Meier JD, Glasgold RA, Glasgold MJ. 3D photography in the objective analysis of volume augmentation including fat augmentation and dermal fillers. Facial Plast Surg Clin North Am. 2011;19(4):725–35. ix. doi: 10.1016/j.fsc.2011.07.012. [DOI] [PubMed] [Google Scholar]
- 27.Furman MB, et al. Injectate volumes needed to reach specific landmarks in s1 transforaminal epidural injections. Pain Med. 2012;13(10):1265–74. doi: 10.1111/j.1526-4637.2012.01474.x. [DOI] [PubMed] [Google Scholar]
- 28.Jafari S, et al. Sensory regulation of swallowing and airway protection: a role for the internal superior laryngeal nerve in humans. J Physiol. 2003;550(Pt 1):287–304. doi: 10.1113/jphysiol.2003.039966. [DOI] [PMC free article] [PubMed] [Google Scholar]
- 29.Shin DU, et al. Bilateral internal superior laryngeal nerve palsy of traumatic cervical injury patient who presented as loss of cough reflex after anterior cervical discectomy with fusion. J Korean Neurosurg Soc. 2012;52(3):264–6. doi: 10.3340/jkns.2012.52.3.264. [DOI] [PMC free article] [PubMed] [Google Scholar]


