Melanomas can arise in any component of the uveal tract of the eye, including the iris, ciliary body, and choroid.1 Iris melanomas have a better prognosis and are often considered separately from posterior uveal melanomas of the ciliary body and choroid. A possible explanation for the less aggressive behavior of iris melanomas could be that they have acquired fewer genetic alterations than posterior uveal melanomas. To test this hypothesis, we performed gene expression profiling on 20 iris melanomas using a prospectively validated 15-gene assay that is now used in routine clinical practice to stratify posterior uveal melanomas into class 1 tumors (low metastatic risk) and class 2 (high metastatic risk) based on biopsy samples.2
The study was conducted at 3 centers associated with the Collaborative Ocular Oncology Group3 and represents the second report from that group. Institutional review board approval was obtained from each institution, and informed consent was obtained from each patient. Inclusion criteria included (1) a clinical diagnosis of melanoma arising from the iris as judged by slit lamp examination, gonioscopy and anterior segment ultrasonography, and (2) lack of prior treatment. Cases were not included in which iris involvement was judged to represent secondary invasion from a posterior uveal melanoma. Tumor dimensions were determined using 20-, 35- or 50-MHz anterior segment ultrasonography.
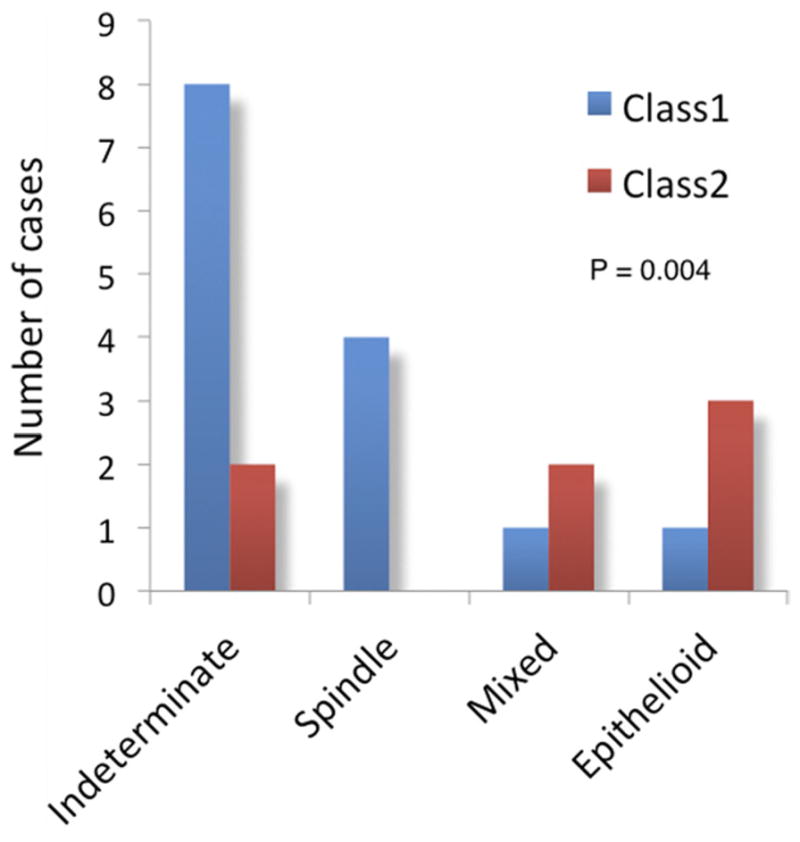
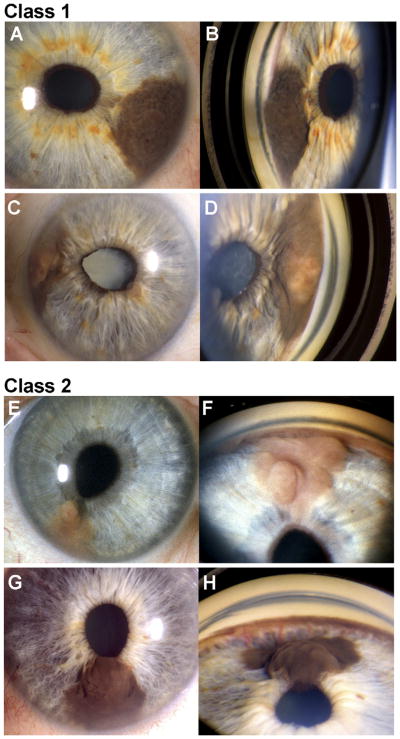
The study included 11 (52%) women and 10 (48%) men (Table 1, Fig 1, available at http://aaojournal.org). The mean age was 55 years (median, 61; range, 8 – 85). Mean largest tumor diameter was 7.1 mm (median, 7.0; range, 3.3–11.0). Mean tumor thickness was 2.8 mm (median, 2.9; range, 1.1–5.0). The tumor involved the anterior chamber angle in 19 of 21 (90%) cases. Extrascleral tumor extension was absent in all cases. Tumor samples were obtained by fine-needle biopsy in 16 cases (76%), vitrector-assisted biopsy in 3 (14%), and enucleation in 2 (10%). No biopsy-related complications were reported. Tumor cell type was predominantly spindle in 4 cases (19%), mixed in 3 (14%), epithelioid in 4 (19%), and indeterminate owing to insufficient cellular material in 10 (48%), yet the sample was sufficient for gene expression profiling in 100% of cases. The gene expression profiling was class 1 in 14 cases (67%) and class 2 in 7 cases (33%). Treatment after tumor sampling included I-125 plaque radiotherapy in 16 cases (76%), surgical excision in 3 (14%), and enucleation in 2 (10%). One class 2 tumor developed local recurrence after plaque radiotherapy, which presented as vitreous seeding 71 months after initial treatment (Fig 1E, F). The class 2 gene expression profile was associated with increased patient age (P = 0.003) and the presence of epithelioid cells (P = 0.004; Table 2, Fig 2, available at http://aaojournal.org). After a median follow-up of 24 months (mean, 34; range, 3–96), no patients had developed detectable metastatic disease. By comparison, at this median follow-up, >30% of patients with a class 2 posterior uveal melanoma will have developed detectable metastasis.3
Table 1.
Summary of Patients
| Tumor Number |
Gene Expression Profile |
Age | Gender | Largest Tumor Diameter |
Tumor Thickness |
Angle Involvement |
Extrascleral Tumor Extension |
Type of Sample |
Cytopathologic Cell Type |
Treatment | Follow-up (mos) |
Metastasis |
|---|---|---|---|---|---|---|---|---|---|---|---|---|
| 2062942 | Class 1 | 44 | Female | 6 | 2.0 | Yes | No | Vitrector | Indeterminate | Excision | 37 | No |
| 2109680 | Class 1 | 69 | Female | 6 | 1.5 | Yes | No | Vitrector | Spindle | Excision | 21.7 | No |
| CEI-005 | Class 1 | 18 | Female | NA | NA | Yes | No | FNAB | Spindle | Plaque | 22.1 | No |
| NB 002 | Class 1 | 42 | Male | 5 | 3.0 | Yes | No | FNAB | Indeterminate | Plaque | 95.8 | No |
| NB 006 | Class 1 | 55 | Female | 6 | 3.0 | Yes | No | FNAB | Indeterminate | Plaque | 78.7 | No |
| NB 044 | Class 1 | 42 | Male | 6 | 3.3 | Yes | No | FNAB | Indeterminate | Plaque | 60.9 | No |
| NB 051 | Class 1 | 61 | Male | 3 | 1.1 | Yes | No | FNAB | Mixed | Plaque | 65.6 | No |
| NB 099 | Class 1 | 76 | Male | 17 | 5.3 | Yes | No | Vitrector | Spindle | Enucleation | 2.5 | No |
| NB 118 | Class 1 | 46 | Male | 10 | 3.0 | Yes | No | FNAB | Indeterminate | Plaque | 21.5 | No |
| NB 160 | Class 1 | 64 | Male | 7 | 2.8 | No | No | FNAB | Indeterminate | Plaque | 26.2 | No |
| NB 163 | Class 1 | 49 | Male | 9 | 4.5 | Yes | No | FNAB | Indeterminate | Plaque | 24.3 | No |
| NB 168 | Class 1 | 8 | Male | 7 | 3.1 | Yes | No | FNAB | Indeterminate | Plaque | 14.8 | No |
| NB 198 | Class 1 | 46 | Female | 6 | 2.4 | Yes | No | FNAB | Spindle | Plaque | 23 | No |
| NB 295 | Class 1 | 25 | Female | 11 | 2.7 | Yes | No | FNAB | Epithelioid | Plaque | 6.2 | No |
| MM 127 | Class 2 | 79 | Male | NA | NA | Yes | No | Enucleation | Epithelioid | Enucleation | 20 | No |
| NB 049 | Class 2 | 63 | Male | 9 | 5.0 | Yes | No | FNAB | Epithelioid | Plaque | 63.9 | No |
| NB 065 | Class 2 | 63 | Female | 7 | 3.3 | Yes | No | FNAB | Indeterminate | Plaque | 35.6 | No |
| NB 134 | Class 2 | 76 | Female | 5 | 2.3 | Yes | No | FNAB | Indeterminate | Plaque | 20.4 | No |
| NB 138 | Class 2 | 63 | Female | 9 | 2.7 | No | No | FNAB | Mixed | Plaque | 32.3 | No |
| NB 193 | Class 2 | 82 | Male | 6 | 2.9 | Yes | No | FNAB | Mixed | Plaque | 27.7 | No |
| NB 206 | Class 2 | 85 | Female | 8 | 3.4 | Yes | No | FNAB | Epithelioid | Plaque | 20.9 | No |
FNAB = fine-needle aspiration biopsy; NA = not available.
Figure 1.
Examples of class 1 and class 2 iris melanomas. Paired slit-lamp photographs (left panels) and goniophotographs (right panels) of 2 class 1 iris melanomas (A–D) and 2 class 2 iris melanomas (E–H). Patient NB018 (A–B) presented with a dark brown tumor arising from the iris stroma and extending into the angle and causing slight peaking of the pupil (not a diagnostic criterion for iris melanoma). Patient NB006 (C, D) presented with a variably pigmented iris melanoma with angle involvement, peaking of the pupil, and secondary cataract. Patient NB206 (E, F) presented with a minimally pigmented, multilobular iris melanoma with angle involvement and peaking of the pupil. This tumor recurred with vitreous seeding 71 months after I-125 plaque radiotherapy. Patient NB138 (G, H) presented with a dark brown iris stromal tumor with no angle involvement. Prominent feeder vessels emanating from the angle could be seen on gonioscopy (H). Despite the lack of angle involvement, the tumor grew substantially on observation, so I-125 plaque radiotherapy was performed.
Table 2.
Association Between Gene Expression Class and Clinical Variables
| Variable | Class 1 | Class 2 | P Value |
|---|---|---|---|
| Ages (yrs) | 0.003 | ||
| Mean | 46.1 | 73.0 | |
| Median | 46.0 | 76.0 | |
| Minimum–maximum | 8–76 | 63–85 | |
| Largest tumor diameter | 0.6 | ||
| Mean | 6.9 | 7.4 | |
| Median | 6.3 | 7.5 | |
| Minimum–maximum | 3.3–11.0 | 5.1–9.4 | |
| Tumor thickness | 0.2 | ||
| Mean | 2.6 | 3.3 | |
| Median | 2.8 | 3.1 | |
| Minimum–maximum | 1.1–4.5 | 2.3–5.0 | |
| Cell type | 0.004 | ||
| Epithelioid | 1 | 3 | |
| Mixed | 1 | 2 | |
| Spindle | 4 | 0 | |
| Indeterminate | 8 | 2 |
Figure 2.

Association between gene expression profile, patient age, and tumor cell type. (A) Box and whiskers plot illustrating the relationship between patient age and gene expression class. The box represents the 25th–75th quartiles, and the line within the box represents the mean. T-bars indicate the range of values. (B) Bar graph illustrating the relationship between tumor cell type and gene expression class. “Indeterminate” indicates that insufficient sample was obtained for cytopathologic diagnosis.
To our knowledge, this is the first study of gene expression profiling in iris melanoma. The most surprising finding was that one third of iris melanomas exhibited the class 2 gene expression profile, indicating that the less aggressive behavior of iris melanomas cannot be explained simply on the basis of their having less advanced genetic alterations. Limitations of this study include small sample size and short follow-up. This patient cohort continues to be monitored to determine whether the class 2 patients begin developing metastasis after a longer follow-up, which would suggest a lag-time bias as a result of iris melanomas being diagnosed earlier, on average, than posterior uveal melanomas. Finally, it is important to emphasize that the iris melanomas in this study required operative intervention owing to their aggressive features and, hence, do not represent the typical spectrum of iris melanocytic neoplasms, most of which have a negligible risk of malignant behavior.4
Footnotes
Financial Disclosure(s):
This work was supported by grants to J.W.H. from the National Cancer Institute (R01CA125970), Tumori Foundation, Barnes-Jewish Hospital Foundation, Kling Family Foundation and by awards to the Department of Ophthalmology and Visual Sciences at Washington University from a Research to Prevent Blindness, Inc. Unrestricted grant, and the NIH Vision Core Grant P30 EY02687c.
Dr. Harbour and Washington University may receive royalties based on a license of related technology by the University to Castle Biosciences, Inc.
References
- 1.Khan S, Finger PT, Yu GP, et al. Clinical and pathologic characteristics of biopsy-proven iris melanoma: a multicenter international study. Arch Ophthalmol. 2012;130:57–64. doi: 10.1001/archophthalmol.2011.286. [DOI] [PubMed] [Google Scholar]
- 2.Onken MD, Worley LA, Tuscan MD, Harbour JW. An accurate, clinically feasible multi-gene expression assay for predicting metastasis in uveal melanoma. J Mol Diagn. 2010;12:461–8. doi: 10.2353/jmoldx.2010.090220. [DOI] [PMC free article] [PubMed] [Google Scholar]
- 3.Onken M, Worley L, Char D, et al. Collaborative Ocular Oncology Group. Report No. 1: prospective validation of a multi-gene prognostic assay in uveal melanoma. Ophthalmology. 2012;119:1596–603. doi: 10.1016/j.ophtha.2012.02.017. [DOI] [PMC free article] [PubMed] [Google Scholar]
- 4.Harbour JW, Augsburger JJ, Eagle RC., Jr Initial management and follow-up of melanocytic iris tumors. Ophthalmology. 1995;102:1987–93. doi: 10.1016/s0161-6420(95)30765-8. [DOI] [PubMed] [Google Scholar]


