

Abstract
Information theory-based methods have been shown to be sensitive and specific for predicting and quantifying the effects of non-coding mutations in Mendelian diseases. We present the Shannon pipeline software for genome-scale mutation analysis and provide evidence that the software predicts variants affecting mRNA splicing. Individual information contents (in bits) of reference and variant splice sites are compared and significant differences are annotated and prioritized. The software has been implemented for CLC-Bio Genomics platform. Annotation indicates the context of novel mutations as well as common and rare SNPs with splicing effects. Potential natural and cryptic mRNA splicing variants are identified, and null mutations are distinguished from leaky mutations. Mutations and rare SNPs were predicted in genomes of three cancer cell lines (U2OS, U251 and A431), which were supported by expression analyses. After filtering, tractable numbers of potentially deleterious variants are predicted by the software, suitable for further laboratory investigation. In these cell lines, novel functional variants comprised 6–17 inactivating mutations, 1–5 leaky mutations and 6–13 cryptic splicing mutations. Predicted effects were validated by RNA-seq analysis of the three aforementioned cancer cell lines, and expression microarray analysis of SNPs in HapMap cell lines.
Keywords: Mutation, mRNA splicing, Information theory, Next-generation sequencing, Genome interpretation
Introduction
The volume of human next-generation sequencing (NGS) data requiring bioinformatic analysis has necessitated development of high-performance software for genome scale assembly and analysis [1]. Genomic variations found in these analyses, particularly single nucleotide polymorphisms (SNPs), have traditionally been interpreted in terms of amino acid modifications in coding regions. Clinically-significant non-coding variants are a relatively unexplored source of pathogenic mutations and lack a general, high-throughput method to interpret their effects. We present genome-scale software to quantify the effect of mutations in the common classes of splice donor (U1) or acceptor (U2)-type sites in a high-throughput manner. Mutations predicted with this method will be useful for pinpointing potentially deleterious variants suitable for further laboratory investigation.
Clinical studies have deemed the vast majority of known variants in patients with Mendelian disorders to be of uncertain pathogenic significance (VUS) [2,3]. Cis mutations can affect protein translation, mRNA processing and initiation of transcription. In silico methods have been developed for the first two of these cases (e.g., [4,5]), but have only been routinely applied for protein coding changes in genome-scale applications (e.g., [6]). Many NGS studies classify mutations at only the highly conserved dinucleotides within each splice junction (e.g., [7]). Although more sensitive methods have been developed which assess other conserved sequence elements [8–12], none have been scaled for the large numbers of variants generated by NGS and nor have they been validated for these data. Exonic variants in close proximity to splice junctions but outside of this window may be classified as synonymous, missense or nonsense substitutions, yet still have profound effects on splicing, which may be the predominant contributor to the phenotype. Unless multiple affected patients are reported with the same mutation, the mutations are transmitted through pedigrees, and functional assays verify their effects, these variants in patients are generally be classified as VUS. mRNA splicing mutations are common in Mendelian diseases [13,14], and it is likely that they contribute to many complex disorders. Clearly, genome-scale predictive methods that filter out benign or small changes in mRNA splicing due to sequence variation will be essential for mutation discovery in exomes, complete genomes and high-density targeted deep sequencing projects. Examination of individual variants in the laboratory with functional assays is both expensive and inefficient as many variants are not likely to be deleterious, or differ significantly in their pathogenicity.
The Automated Splice Site Analysis (ASSA) [5] server evaluates single mutations that change splice site strength with information theory-based models [15]. The average information, Rsequence, of a set of binding sites recognized by the same protein (such as U1 or U2) describes the conservation of these sequences. Sequences are ranked according to their individual information content (Ri in bits) [15–17]. Individual information content is a portable, universal measure which allows direct comparison of binding sites across the genome or transcriptome, regardless of the sequence or protein recognizer. Functional binding sites have Ri > 0, corresponding to ΔG < 0 kcal/mol [18]. Strong binding sites have Ri ≫ Rsequence, while weak sites have Ri ≪ Rsequence. Any sequence variation may change its protein binding affinity, which is reflected by a change in the computed Ri of that binding site. A 1-bit change in information content (ΔRi) corresponds to a ⩾2-fold change in binding affinity (100/2ΔRi). The ASSA server has been widely used and its sensitivity and specificity have previously been extensively validated in hundreds of studies of individual mutations (http://tinyurl.com/splice-server-citations). However, it requires approximately 30 s to examine a single variant and is therefore not suitable for comprehensive analysis of whole-genome sequencing data. The Shannon pipeline was developed using the same mathematical approach and information weight matrices as ASSA to carry out batch information theory-based analysis of thousands of mutations from the BRCA1 and BRCA2 genes in Breast Cancer Information Core Database [19]. In the present study, the software has been adapted to perform a single matrix algebraic calculation across a genome with an efficient state machine that significantly increased computational speed over ASSA. Here we describe this software tool and analyze predicted mutations with RNA-seq data from genomes of 3 cancer cell lines.
Results
Performance of the Shannon pipeline software
We implemented an efficient algorithm for high-throughput detection and interpretation of mRNA splicing mutations based on information theory-based position weight matrices of a genome-wide set of curated splice donor and acceptor sites [20]. The present study focuses on software performance, interpretation of contextual changes identified from genomic annotations and supported by genome-scale RNA-seq data. The strategy underlying the Shannon splicing pipeline is to evaluate many sequence changes by information analysis quickly; this is followed by implementation of a set of heuristics based on these results combined with genome annotations to distinguish normal splice sites from those with diminished binding and cryptic sites with competitive binding affinities.
To assess performance, all point mutations detected in the complete genomes of the three cancer cell lines were analyzed using the pipeline. Variants in the cell lines U2OS (osteosarcoma-derived), A431 (epidermoid squamous carcinoma-derived) and U251 (glioblastoma-derived) were examined and filtered to create tractable sets of variants. Predicted splice-altering mutations not found in dbSNP135 (a list of ∼54 million known nucleotide polymorphisms) and those with less than 1% average heterozygosity are reported (Tables S1–3).
The software processes single nucleotide variants (SNVs) to identify and annotate putative splicing mutations with sufficient speed to analyze single or multiple genomes within a few hours. Analysis of all single nucleotide substitutions detected in the genome of the U2OS cell line – 211,049 variants – is completed in 1 h 12 min on an I7-based CPU in either Linux or Mac OSX. The speed of a genome analysis is dependent on the number of chromosomes represented in the input data. The state machine facilitates the analysis of all variants on a single chromosome with the highest efficiency because genomic data for each chromosome must be read and parsed. A complete analysis of 300 variants on a single small chromosome (e.g., chromosome 22) can be completed in 5 min. Variants distributed throughout all chromosomes require at least 1 h to process. The Shannon pipeline should be executed on a machine with sufficient RAM to store the entire human genome (⩾4 Gb). When all chromosomes are represented, increasing the number of mutations results in an approximately linear increase in actual computation time, after accounting for the overhead required for memory management of genome sequences and annotations. For example, 2 h 35 min is required to analyze 1,872,893 sequence variants from the most recent data release on the Exome Variant Server (http://evs.gs.washington.edu/EVS/).
The software sorts the results into categories of inactivated, leaky and cryptic splicing mutations (Figures 1 and 2). However, further in silico filtering by the user is recommended to select the variants most likely to be deleterious to normal mRNA splicing. Results are sorted according to the degree of change information (i.e., mutation severity) or by heterozygosity, and to deemphasize or eliminate common SNPs that affect mRNA splicing in cases where the phenotype is known to be rare. Filtering of cryptic splice sites exceeding the strength of and close to adjacent natural sites of the same phase eliminates many predicted unused cryptic sites with changes in Ri values. Predicted mutations in known genes with open reading frames exclude poorly characterized genes lacking HUGO-approved names or encoding non-coding RNAs, and pseudogenes. Post-hoc filtering (especially of cryptic splicing mutations) significantly enriches for likely mutations in the genomes of these cancer cell lines by the order of 10,000 fold (Table 1).
Figure 1.
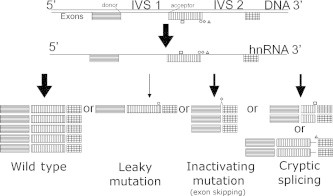
Types of splicing mutations that affect structure and/or abundance of resulting transcripts The diagram illustrates potential outcomes of mRNA splicing mutations predicted by the Shannon pipeline. Variation within splice donor and/or acceptor sites may lead to altered splicing events such as exon skipping (◊), exonic (□) or intronic (△) cryptic site use, and/or reduction in the abundance of normally spliced mRNA forms, termed leaky mutations (○).
Figure 2.
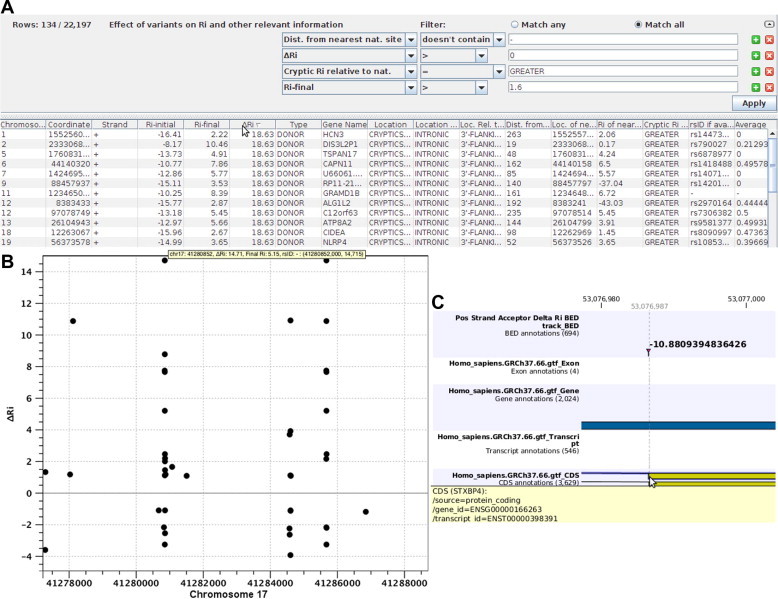
Sample output of the Shannon pipeline software The Shannon pipeline software generates the following types of output. A. Tabular results showing the first 12 of 134 changes in Ri values at different genomic coordinates predicted to be significant, after filtering for cryptic splicing mutations from all variants (n = 22,197) in a complete genome sequence. The first filter eliminates exonic cryptic sites, the second selects cryptic sites with increased Ri values, the third ensures that the cryptic site is stronger than the corresponding natural site of the same phase and the final filter ensures that all remaining sites exceed the minimum Ri value of a functional splice site. B. Manhattan-like plot indicating the locations and changes in Ri of all variants which alter splice site information in a region within intron 1 of BRCA1 (chr17:41277500-41288500) from different individuals with increased breast cancer risk. C. Custom track illustrating a cryptic splicing mutation detected in an ovarian serous carcinoma that inactivates the acceptor site of exon 4 in STXBP4, resulting in the activation of a pre-existing, in frame, alternative splice site 6 nucleotides downstream.
Table 1.
Performance of Shannon pipeline for human mRNA splicing mutation prediction
| Source of variants | Number of variants analyzed | Running timea |
|---|---|---|
| U2OS cell line | 211,049 | 1 h 12 min |
| A431 cell line | 290,589 | 1 h 17 min |
| U251 cell line | 314,637 | 1 h 20 min |
| ESP 6500 Exomes | 1,872,893 | 2 h 35 min |
Note:aIntel I7 CPU with 16 Gb RAM.
Comparison of predicted splicing mutations with expression data
Several variants detected in genomes of U2OS, U251 and A431, which were predicted to affect splicing, were compared to the distribution of RNA-seq reads in their respective regions of the transcriptome. When interpreting these data, we assume that predicted mutations are present in a genetic background, in which the other parentally derived allele lacks the same variant (i.e., heterozygous). Abnormal reads or exon skipping of the mutant allele is viewed in the context of a single allele and expected normal splicing of the corresponding exon. For mutations that are predicted to inactivate a splice site, we assume a binomial distribution in the number of expected reads, based on the wild type allele. Natural splice site mutations are expected to significantly reduce the number of splice junction-spanning reads in relation to those in the adjacent exons, consistent with exon skipping. In some cases, intron inclusion adjacent to a splice site variant with lower Ri value may also be evidence of a splicing mutation. In U2OS, 10 of 13 novel inactivating variants found in mutated natural splice sites met these criteria, along with 2 additional probable mutations (Table S1). The same criteria were met by 2 of 4 (with 1 additional probable) novel inactivating variants in U251 (Table S2), and 4 of 7 (with 1 additional probable) variants in A431 (Table S3).
Expression data support our predictions for 1 of 7 activated cryptic site variants in U2OS, 1 of 14 variants in A431 and 0 of 10 in U251. Many of the predicted splice sites reside in intronic regions or alternative exons that map far upstream or downstream of constitutively expressed exons. They are unlikely to displace constitutive isoforms, since donor site recognition is processive [21] and the increased lengths of such cryptic exons would probably be suboptimal [22]. Often, these sites are associated with rare, alternatively spliced ESTs expressed in other tissues than these cell lines. Because these variants are often extra-exonic, changes in expression must be inferred indirectly from decreased read count, intron inclusion or increased exon skipping. Changes in reading frame from inclusion of out-of-phase intronic sequences may induce nonsense-mediated decay (NMD). Reads mapping to adjacent introns are expected to be reduced in number as a result of NMD. Sequencing reads that are concentrated in the intronic region adjacent to exon of interest are considered support for predicted mutations. NMD may also affect transcript read counts associated with severe leaky or inactivated natural donor sites, which produce exon skipping with frame-shifting. Several predicted splicing mutations confirmed by RNA-seq are well-known driver mutations that contribute to tumor phenotypes.
We highlight a unique natural donor site mutation within RBBP8 (NM_203291.1:c.248G > A or chr18:20529676G > A; 6.2 → 3.2 bits, indicating the change in the Ri value of the donor site, before and after it is mutated) in A431, a tumor suppressor gene mutated in numerous neoplasias with a role in endonucleolytic processing of a covalent topoisomerase-DNA complexes. The mutation weakens but does not abolish the natural donor site from 6.2 to 3.2 bits. A cryptic mRNA splice form using a pre-existing donor site 24 bp downstream to the weakened natural site is confirmed by RNA-seq (Figure 3A). The ASSA server predicts the activation of this intronic cryptic donor site, as well as a second site of equal strength further downstream to the mutated donor site (Figure 3B). There are a total of 56 reads that both encroach into the intron and overlap this variant. Forty-one of these cover the cryptic exon splice junction of interest (the aligned reads stop at the 3.2 bit cryptic site, which is 24 nt downstream of the natural site, and continue into the next natural exon). Thirty-one junction spanning reads also contain the A-allele. There are an additional 23 reads that cross into the intron, but do not extend as far as the cryptic site of interest. In 19 cases, these reads contain the A-allele. The remaining 4 intron-crossing reads which contain the G-allele appear to be misaligned, as they contain short matches (of ⩽3 nt) to the downstream exon. There are an additional 2 reads that span the junction between the downstream cryptic exon junction and the adjacent exon (31 nt downstream; also 3.2 bits). Finally, 12 reads are correctly spliced and contain the mutant A-allele, suggesting that the natural site is not completely inactivated by this nucleotide substitution, which is consistent with leaky splicing.
Figure 3.
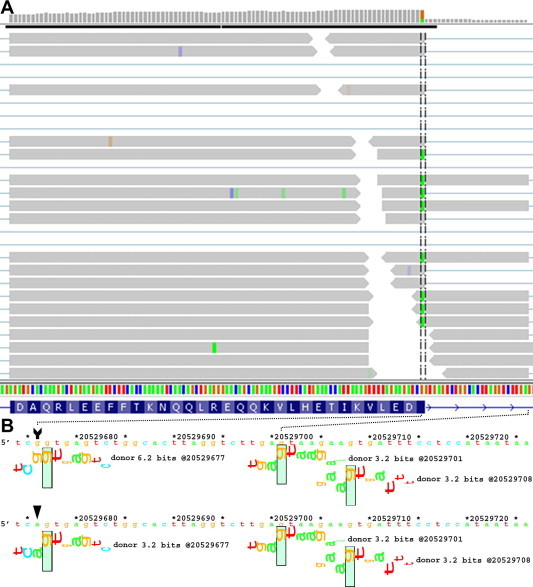
Predicted mutation splicing phenotype supported by RNA-seq Predicted RBBP8 splicing mutation, chr18:20529676G > A (NM_203291.1: c.248G > A), is related to transcripts mapped to this region. A. IVG genome browser display of read distribution at the exon 4/intron 4 junction. Green boxes within the vertical hashed lines indicate the presence of the A allele. B. The natural and cryptic splice sites illustrated by sequence walkers generated on the ASSA server. The arrow tail and head draw attention to the location and sequence of the reference and variant sequence. The mutation reduces the strength of the natural donor site from 6.2 to 3.2 bits. All but 3 of the 59 reads extending into the intron contain the variant allele, as indicated by the green positions within the reads. These reads extend into the exon and terminate at the closest intronic cryptic donor site (chr18:20529700). The mutated natural and cryptic sites are of equal strength, which explains splicing at both sites.
Changes in expression are also noted in other genes. DDX11 is inactivated in U2OS (chr12:31242087T > G; 6.89 → −11.73 bits). DDX11 is a component of the cohesin complex which has a crucial role in chromosome segregation, and is essential for survival of advanced melanoma [23]. In U2OS, WWOX, a tumor suppressor gene in osteosarcoma [24], contains a leaky mutation (chr16:78312497C > A; 10.24 → 6.67 bits). Both alleles of APIP, an apoptosis associated gene, are inactivated in U251 (chr11:34905054G > C; 9.32 → 0.54 bits). Gene expression of APIP is down regulated in non-small cell lung carcinoma [25]. Amplification of METTL2B, which harbors a leaky mutation in U251 (chr7:128117227G > A; 5.48 → 2.47 bits), has been demonstrated in several cancers, including glioblastoma [26]. In A431, leaky mutations are also confirmed in the glioblastoma-initiating gene TRRAP (chr7:98533187T > G; 9.09 → 7.16 bits) [27] and USF1 (chr1:161013165G > T; 4.89 → 3.59 bits), which encodes a transcription regulator important for TGFβ2 expression in glioblastoma [28]. SYNE2, which is mutated in a significant percentage of head and neck squamous cell carcinomas [29], contains an inactivating splice site variant in A431 (chr14:64669514T > A; 1.89 → −0.83 bits). RRM2B, an inducible DNA repair gene that has been implicated in squamous cell carcinoma [30], contains an inactivating mutation in A431 (chr8:103250667A > C; 3.6 → −15.02 bits). SMARCD1, encoding a chromatin modulator that interacts with nuclear receptor transcription factors, is also inactivated in A431 (chr12:50480538G > C; 8.46 → −3.21 bits), and has been shown to be mutated in hepato- and other carcinomas [31].
Several mutations were found in potential tumor-associated genes, with either suggestive or little supporting expression data. However, defects in many of these genes have been implicated in various neoplasias including glioblastoma, osteosarcoma, and epidermoid squamous carcinoma. In general, these were predicted leaky mutations, where effects (diminished read counts and exon skipping) were inferred against the confounding background of a presumably intact allele. Natural site mutations in FANCD2 (NM_033084.3:c.3106-9T > A; 6.0 → 3.5 bits; delayed activation of the DNA damage response in gliomas [32]) and MDC1 (NM_014641.2:c.2129-8G > C; 6.4 → 4.7 bits; mediator of the DNA damage checkpoint and underexpressed in many cancers [33]) were found in the U251 cells.
Characterization of defective biochemical and functional pathways
Potential driver mutations affecting protein coding of genes from the A431, U2OS, and U251 cell lines have recently been reported [34]. Functionally significant driver mutations affecting splicing are expected to comprise many of the same pathways implicated by protein coding mutations that are predicted to be damaging. The gene set with combined driver point and copy number alteration was examined using Reactome [35]. Shannon pipeline results, supported by RNA-seq data, were added to gene sets proposed by [34] and the expanded gene set was examined with the overrepresentation analysis tool in Reactome. Of the genes containing transcript-validated splicing mutations, both datasets were consistent in 2 of 5 pathways in A431 (interferon signaling and cytokine signaling in immune system), 8 of 8 pathways in U2OS (cell cycle mitotic, cell cycle, DNA replication, mitotic M–M/G1 phases, M phase, kinetochore capture of astral microtubules, mitotic prometaphase and apoptosis) and 0 of 2 pathways in U251. The gene set including all inactivating and leaky variants (regardless of verification status) was found in 5 of 7 of the same pathways in A431 (additionally, a variant was found in the semaphorin interaction pathway), 8 of 12 of the same pathways in U2OS and 0 of 11 pathways in U251. In A431 and U2OS, these splicing mutation predictions enhance and strengthen the pathway analysis based on protein coding mutations alone.
Discussion
Complete genome and exome sequencing detects numerous rare, non-recurrent mutations in different individuals with the same disease diagnosis. Making sense of genetically heterogeneous results requires detection and interpretation of mutations in many genomes. The identification of significant mutations in different driver genes, followed by a gene set or pathway analysis can reveal common, essential pathways in otherwise genetically heterogeneous diseases, such as cancer. Incomplete detection or reclassification of coding mutations will most likely impact the sensitivity of these analyses. Most existing methods to predict the effects of splice site variation lack scalability, transparency or portability, with respect to their scoring systems. Information content can be applied to any region of any adequately annotated genome. Change in information (ΔRi) is a portable measure and its thermodynamic basis meaningfully estimates the effects of splicing variation. By contrast, other systems (e.g., [36]) are not suited for genome scale analysis and produce results that are not directly related to splice site strength.
A recent study reported the genomic, transcriptomic and protein sequences in the cell lines that were the source of the data that we analyzed [34]. It described the same single splicing mutation in the APIP gene identified in the present study, but none of the others that we predicted. Further, there was no overlap between the genes containing predicted protein coding mutations in [34] and those indicated from the current study. This was somewhat surprising, as we anticipated that some loss of function mutations in tumor suppressor genes would arise from compound heterozygosity. Instead, mutant genes from both studies tended to occur in the same pathways (for U2OS and A431).
Many of our predictions were supported by the same RNA-seq data that identified only APIP [34]. Conventional splice junction mutation analysis of NGS data, which tends to emphasize only the significance of changes in conserved splice junction, intronic dinucleotides does not appear to be as sensitive or comprehensive as the information theory-based approach we describe [7]. Assuming the cell line genotypes faithfully reflect the tumor genetics, likely driver mutations in the tumors were missed. These genes contribute to the tumor signatures and in most instances, belong to major pathways that are dysfunctional in the tumor. The caveat is that many of these cancer-associated genes have been uncovered in other tumor types, rather than the tumors that gave rise to the cell lines studied here.
Many of the predicted mutations that are supported by expression data make sense in light of independent studies, which have suggested the same driver genes and pathways that are defective in these tumor types [29,37–39]. We note that the recommended filtering procedures eliminate and/or minimize inclusion of mutations in gene classes with no known connection to neoplastic disease etiology. The sensitivity and specificity of these predictions support use of the Shannon pipeline in other somatic genomic analyses, and possibly for a wider spectrum of heritable genetic disorders.
The interpretation of potential splicing mutations in complete genome data is also challenging because the source of annotations, Ensembl, contains many accurate but apparently irrelevant genomic features. These comprise of exons called on the basis of a single or a few ESTs with deep intronic locations (relative to constitutive exons) [40,41], and predicted mutant ESTs that are in fact present in non- or low expression genes (due to tissue specificity of the gene). Where the RNA-seq data are either insufficient or irrelevant, pseudogenes (or genes which are members of families containing pseudogenes) may contain mismapped reads for the non-functional copies that can produce false positive mutation calls. Automatic filtering of genes from the RNA-seq data prior to validating information theory-based predictions would significantly simplify post hoc processing of the Shannon pipeline. Until such a workflow is available, individual predicted mutations have to be assessed manually, because cryptic sites that alter the strength of a “decoy” exon, while a technically legitimate result, is probably irrelevant as a potential disease-causing mutation.
Accurate genome-scale mutation analysis of bulk sequencing data in a timeframe suitable for integration with prediction tools for other types of mutations will be needed to discover disease-related genes and pathways in large-scale genomic studies of many patients. The need to distinguish the probable pathogenic from benign sequence changes has become acute [42]. Computing efficiency is essential for concurrent analysis of large sets of genome sequences [43]. The processing speed we have attained has distinct advantages for identifying functional non-coding variants detected in large multi-genomic analyses. However, increased speed comes at the expense of diminished ability to analyze complex mutations on the fly, such as insertions and deletions or multinucleotide substitutions. Such variation is significantly less common than SNPs in wild type genome and exome sequences [44], but nevertheless can have consequences on gene function and phenotype. The ASSA server is capable of analyzing these categories of mutations; however it is considerably slower than the Shannon pipeline (30 s per variant). In the future, the Shannon pipeline will be integrated with the ASSA server to examine complex variants seamlessly.
Materials and methods
Shannon pipeline software architecture
We have implemented the Shannon pipeline software plugin using the CLC-Bio genomics developer toolkit to simplify access to this technology and interpretation by novice users. The same plugin can be executed on a single client computer, a remote server or a grid system, and benefits from automated software updates. The server version uses an architecture in which a Workbench client transmits variant data to the server, which performs the computations, and returns results that can be filtered and formatted on the client. A standalone version of the fully functional Genome Workbench plugin is also available. By contrast, the splicing mutation feature that is native in CLC-Bio Genomics products is limited to detecting changes in dinucleotides at the exon boundaries, which represent fewer than 5% of all splicing mutations detected by the Shannon pipeline.
The Shannon Human Splicing Pipeline uses an efficient algorithm coded in C++ to quickly analyze genome-scale data sources for information changes (Figure S1). Methods for computing Ri and ΔRi values determine the dot product of an information weight matrix and the unitary sequence vector for each genomic window and compare the resultant scalar values of the reference and variant sequences [45]. C++ libraries determine the information content of a position in the reference genome and after a variant is introduced. This method uses convolution-style sliding-window computation of all sequence changes for each complete chromosome sequence resident in RAM. To expedite processing, the software currently only handles SNVs – which are the most prevalent. Future versions will handle complex multi-nucleotide mutations. Changes in Ri introduced by genomic variation are computed by subtracting the initial Ri value of a position by the sum over a surrounding window, then adding the new value for each position (ΔRi). Perl scripts wrap these C libraries and annotate output. Integration with the CLC-Bio workbench environment was achieved through code written in Java utilizing the CLC-Bio developer API. This software is assembled as a client plugin requiring a connection to the server to execute, a server plugin and a standalone client plugin. Two additional dependency plugins contain a modified dbSNP135 (containing only variant, rsID and overall frequency), Ensembl Exon Data (Build 66) and GRCh37/NCBI36, respectively, allowing the software to execute with no active internet connection and incorporates all necessary annotations required to contextualize a potential mutation.
Input flat files containing sequence variants that differ from the reference genome are imported into the CLC-Bio Java environment. The file must be either a Variant Call Format (VCF) [46] or a tab-delimited format with the following fields: [chromosome #] [unique identifier] [coordinate] [reference/variant]. Coordinates can be hg18/NCBI36 or hg19/GRCh37. All variants appearing in this study are hg19. Genomic insertions and deletions (indels) present in input files are not considered for analysis. The unique identifier serves several purposes. Input data may be stored in a hash allowing efficient annotation of individual variants or those originating from multiple exome or genome sequences. Given the minimum startup time incurred to process each individual chromosome present in the input data (∼1 h if all chromosomes present in input file), unique identifiers allow input to be combined, thus reducing total run-time and required user interaction.
Stratification of variants
Similar to ASSA, the pipeline analysis produces summary tables (e.g., Figure 2A) for different types of mutations (assuming each type is represented): (1) complete sets of all splicing variants, (2) mutations predicted to inactivate splice sites, (3) leaky splicing mutations that reduce but do not abolish splicing and (4) cryptic splice sites that are either activated, inactivated or reduced in strength. We define inactivating variants as those that reduce the Ri of the affected binding site below 1.6 bits [20]. Binding sites containing a leaky variant are defined as those, in which initial Ri is decreased upon mutation to Ri > 1.6. Finally, candidate cryptic sites encompass all sites with higher affinity for binding than a corresponding natural site based on comparison of their respective Ri values (see below). Tabular data can be sorted by clicking the column header of each column. Data can be exported and viewed without modification in a spreadsheet program.
The 5′ end of the first exon and the 3′ end of the last exon of a gene are not splice sites. Therefore, the Shannon pipeline does not report mutations that affect their ΔRi at these positions; the exception is genes that encode alternate splice forms using further upstream/downstream exons present in Ensembl 66. Variants which alter the strength of cryptic splice sites within the first and last exons are also considered. Use of a strengthened cryptic donor in the first exon or acceptor in the last exon could lead to a truncated exon. The Shannon pipeline considers the exonic cryptic sites of the opposite polarity (acceptors in first exons and donors for last exons), as their activation could potentially (but rarely) lead to the formation of a cryptic intron within these exons if a second pre-existing cryptic site of opposite polarity is present in the proper orientation.
Although the Shannon pipeline output contains a vastly reduced number of potentially significant variants, further filtering is usually necessary to obtain the final set of functionally relevant sites. Pipeline output is generated for variants that result in ΔRi > ±1 bit. Each variant is annotated with the distance from nearest natural site, Ri of nearest natural site, location of cryptic sites (exonic or intronic), the strength of a cryptic site strength relative to the nearest natural site, gene name, information contents of the reference and variant sites, type of splice site (acceptor or donor) and rsID of SNP if catalogued. The user then filters out those variants least likely to be functionally relevant. For example, a natural site that increases in information content will generally not be of interest. The increase will likely only serve to widen the gap in Ri between the natural and nearby cryptic sites. Thus, we remove those natural sites with positive ΔRi values as well as cryptic sites with reductions in Ri value. Pipeline generated annotations that were found in the tabular output help simplify the data filtering process. To predict those variants with significant changes, tables were filtered to distinguish natural and cryptic splicing mutations (Tables S1–3). The filters used for cryptic splicing mutations were based on criteria given in [47] (a) ΔRi > 0, (b) either occurring within an exon or within an intron less than 300 bp from nearest natural site, (c) cryptic splice site Ri value exceeding the strength of the nearest natural site Ri of the same type and (d) intronic cryptic splice sites are selected 5′ to the exon if acceptors and 3′ to the exon, if donors. All reported variants were further categorized according to whether they had been previously reported or were novel. In Table 2, only novel and known variants of <1% average heterozygosity in dbSNP are reported, which are more likely to be functionally significant due to selection. Nevertheless, the threshold for filtering based on heterozygosity can be specified by the user.
Table 2.
Enrichment for predicted splicing mutations after processing and filtering
| Cell line | Initial variants analyzed | Novel natural site | Novel cryptic site | Natural site (SNP)a | Cryptic site (SNP)a | Overall mutation fraction (%) |
|---|---|---|---|---|---|---|
| A431 | 290,589 | 16 | 13 | 13 | 3 | 0.015 |
| U251 | 314,637 | 7 | 10 | 18 | 3 | 0.012 |
| U2OS | 211,049 | 22 | 9 | 13 | 4 | 0.022 |
| Total | 816,275 | 46 | 32 | 49 | 10 | 0.017 |
Note:adbSNP135; <1% heterozygosity; minor allele.
Pipeline results are also displayed visually. ΔRi and final Ri values are plotted by chromosome location, similar to Manhattan-style representations, for either individual chromosomes or entire genomes (Figure 2B). Hovering the cursor over data points generates tooltips containing information needed to find the complete entry within the corresponding tabular data. To locate interesting data points, a zoom function allows closer inspection of the plot. This visualization allows patterns to be observed and data points which stand out to be easily located and inspected more closely in a tabular format or on the ASSA server.
Chromosome-specific, custom browser tracks indicating ΔRi values in the BED format are created during analysis. This enables visualization of predicted mutations in the context of other genome annotations, for example, mapped reads from RNA-seq, spliced ESTs and known mRNAs. Figure 2C displays a result on the CLC Genomics Workbench browser along with the Ensembl genes v.66 track.
Experimental validation
RNA-seq analysis using published data from these cell lines [34] was used to compare our methods with expression data. TopHat [48] was executed with the following command-line options: -g 5 --solexa1.3-quals -p 8, and examined with the Integrative Genomics viewer (IGV) [49] to interrogate predictions made with the Shannon pipeline.
Authors’ contributions
PKR conceived of and directed the project. BCS implemented these methods, which involved modifying previous software developed by TW and EJM, creation of new modules, and integration with the CLC-Bio Genomics Workbench. EJM created and updated genome annotation databases required by the software. BCS and PKR compared variants predicted to be potentially deleterious with RNA-seq data provided by PIC and PA. BCS, EJM, and PKR wrote the manuscript, which has been approved by all of the authors.
Competing interests
PKR is the inventor of US Patent 5,867,402 and founder of Cytognomix, which is developing the software presented here.
Acknowledgements
The authors would like to acknowledge support from Natural Sciences and Engineering Research Council (Discovery Grant 371758-2009) (PKR), Canadian Breast Cancer Foundation (PKR), Compute Canada (PKR), Canadian Foundation for Innovation, Canada Research Chairs, MITACS Accelerate (BCS), the Ontario Graduate Scholarship Programs (BCS) and Cytognomix Inc. We thank Mikael Flensborg, Paul Fleischer and Alex Andersen for assistance with CLC-Bio products integration.
Footnotes
Peer review under responsibility of Beijing Institute of Genomics, Chinese Academy of Sciences and Genetics Society of China.

Appendix Supplementary. material
Supplementary Figure 1.

Figure S1. Flow chart of the Shannon Human mRNA Splicing pipeline Client and server tasks are depicted separately. Interactions between them are denoted by arrows crossing the client/server barrier. The pipeline can also be executed on the client in a standalone manner. In that case, all server actions are performed on the client machine.
Table S1. Splicing mutations in cell line U2OS predicted by Shannon pipeline.
Table S2. Splicing mutations in cell line U251 predicted by Shannon pipeline.
Table S3. Splicing mutations in cell line A431 predicted by Shannon pipeline.
References
- 1.Gullapalli R.R., Desai K.V., Santana-Santos L., Kant J.A., Becich M.J. Next generation sequencing in clinical medicine: challenges and lessons for pathology and biomedical informatics. J Pathol Inform. 2012;3:40. doi: 10.4103/2153-3539.103013. [DOI] [PMC free article] [PubMed] [Google Scholar]
- 2.Kavanagh D., Anderson H.E. Interpretation of genetic variants of uncertain significance in atypical hemolytic uremic syndrome. Kidney Int. 2012;81:11–13. doi: 10.1038/ki.2011.330. [DOI] [PubMed] [Google Scholar]
- 3.Spurdle A.B., Healey S., Devereau A., Hogervorst F.B., Monteiro A.N., Nathanson K.L. ENIGMA—evidence-based network for the interpretation of germline mutant alleles: an international initiative to evaluate risk and clinical significance associated with sequence variation in BRCA1 and BRCA2 genes. Hum Mutat. 2012;33:2–7. doi: 10.1002/humu.21628. [DOI] [PMC free article] [PubMed] [Google Scholar]
- 4.Adzhubei I.A., Schmidt S., Peshkin L., Ramensky V.E., Gerasimova A., Bork P. A method and server for predicting damaging missense mutations. Nat Methods. 2010;7:248–249. doi: 10.1038/nmeth0410-248. [DOI] [PMC free article] [PubMed] [Google Scholar]
- 5.Nalla V.K., Rogan P.K. Automated splicing mutation analysis by information theory. Hum Mutat. 2005;25:334–342. doi: 10.1002/humu.20151. [DOI] [PubMed] [Google Scholar]
- 6.Kumar A., White T.A., MacKenzie A.P., Clegg N., Lee C., Dumpit R.F. Exome sequencing identifies a spectrum of mutation frequencies in advanced and lethal prostate cancers. Proc Natl Acad Sci U S A. 2011;108:17087–17092. doi: 10.1073/pnas.1108745108. [DOI] [PMC free article] [PubMed] [Google Scholar]
- 7.O’Roak B.J., Vives L., Fu W., Egertson J.D., Stanaway I.B., Phelps I.G. Multiplex targeted sequencing identifies recurrently mutated genes in autism spectrum disorders. Science. 2012;338:1619–1622. doi: 10.1126/science.1227764. [DOI] [PMC free article] [PubMed] [Google Scholar]
- 8.Churbanov A., Vorechovský I., Hicks C. A method of predicting changes in human gene splicing induced by genetic variants in context of cis-acting elements. BMC Bioinformatics. 2010;11:22. doi: 10.1186/1471-2105-11-22. [DOI] [PMC free article] [PubMed] [Google Scholar]
- 9.Churbanov A., Rogozin I.B., Deogun J.S., Ali H. Method of predicting splice sites based on signal interactions. Biol Direct. 2006;1:10. doi: 10.1186/1745-6150-1-10. [DOI] [PMC free article] [PubMed] [Google Scholar]
- 10.Yeo G., Burge C.B. Maximum entropy modeling of short sequence motifs with applications to RNA splicing signals. J Comput Biol. 2004;11:377–394. doi: 10.1089/1066527041410418. [DOI] [PubMed] [Google Scholar]
- 11.Reese M.G., Eeckman F.H., Kulp D., Haussler D. Improved splice site detection in Genie. J Comput Biol. 1997;4:311–323. doi: 10.1089/cmb.1997.4.311. [DOI] [PubMed] [Google Scholar]
- 12.Pertea M., Lin X., Salzberg S.L. GeneSplicer: a new computational method for splice site prediction. Nucleic Acids Res. 2001;29:1185–1190. doi: 10.1093/nar/29.5.1185. [DOI] [PMC free article] [PubMed] [Google Scholar]
- 13.Cooper T.A., Mattox W. The regulation of splice-site selection, and its role in human disease. Am J Hum Genet. 1997;61:259–266. doi: 10.1086/514856. [DOI] [PMC free article] [PubMed] [Google Scholar]
- 14.López-Bigas N., Audit B., Ouzounis C., Parra G., Guigó R. Are splicing mutations the most frequent cause of hereditary disease? FEBS Lett. 2005;579:1900–1903. doi: 10.1016/j.febslet.2005.02.047. [DOI] [PubMed] [Google Scholar]
- 15.Schneider T.D. Information content of individual genetic sequences. J Theor Biol. 1997;189:427–441. doi: 10.1006/jtbi.1997.0540. [DOI] [PubMed] [Google Scholar]
- 16.Shannon C.E. A mathematical theory of communication: part I. Bell Syst Tech J. 1948;27:379–423. [Google Scholar]
- 17.Shannon C.E., Weaver W. University of Illinois Press; Urbana, IL: 1949. A mathematical model of communication. [Google Scholar]
- 18.Shultzaberger R.K., Schneider T.D. Using sequence logos and information analysis of Lrp DNA binding sites to investigate discrepancies between natural selection and SELEX. Nucleic Acids Res. 1999;27:882–887. doi: 10.1093/nar/27.3.882. [DOI] [PMC free article] [PubMed] [Google Scholar]
- 19.Mucaki E.J., Ainsworth P., Rogan P.K. Comprehensive prediction of mRNA splicing effects of BRCA1 and BRCA2 variants. Hum Mutat. 2011;32:735–742. doi: 10.1002/humu.21513. [DOI] [PubMed] [Google Scholar]
- 20.Rogan P.K., Svojanovsky S., Leeder J.S. Information theory-based analysis of CYP2C19, CYP2D6 and CYP3A5 splicing mutations. Pharmacogenetics. 2003;13:207–218. doi: 10.1097/00008571-200304000-00005. [DOI] [PubMed] [Google Scholar]
- 21.Robberson B.L., Cote G.J., Berget S.M. Exon definition may facilitate splice site selection in RNAs with multiple exons. Mol Cell Biol. 1990;10:84–94. doi: 10.1128/mcb.10.1.84. [DOI] [PMC free article] [PubMed] [Google Scholar]
- 22.Sterner D.A., Carlo T., Berget S.M. Architectural limits on split genes. Proc Natl Acad Sci U S A. 1996;93:15081–15085. doi: 10.1073/pnas.93.26.15081. [DOI] [PMC free article] [PubMed] [Google Scholar]
- 23.Bhattacharya C., Wang X., Becker D. The DEAD/DEAH box helicase, DDX11, is essential for the survival of advanced melanomas. Mol Cancer. 2012;11:82. doi: 10.1186/1476-4598-11-82. [DOI] [PMC free article] [PubMed] [Google Scholar]
- 24.Del Mare S., Kurek K.C., Stein G.S., Lian J.B., Aqeilan R.I. Role of the WWOX tumor suppressor gene in bone homeostasis and the pathogenesis of osteosarcoma. Am J Cancer Res. 2011;1:585–594. [PMC free article] [PubMed] [Google Scholar]
- 25.Moravcikova E., Krepela E., Prochazka J., Rousalova I., Cermak J., Benkova K. Down-regulated expression of apoptosis-associated genes APIP and UACA in non-small cell lung carcinoma. Int J Oncol. 2012;40:2111–2121. doi: 10.3892/ijo.2012.1397. [DOI] [PubMed] [Google Scholar]
- 26.Lee C.H., Alpert B.O., Sankaranarayanan P., Alter O. GSVD comparison of patient-matched normal and tumor aCGH profiles reveals global copy-number alterations predicting glioblastoma multiforme survival. PLoS One. 2012;7:e30098. doi: 10.1371/journal.pone.0030098. [DOI] [PMC free article] [PubMed] [Google Scholar]
- 27.Charles N., Holland E.C. The perivascular niche microenvironment in brain tumor progression. Cell Cycle. 2010;9:3012–3021. doi: 10.4161/cc.9.15.12710. [DOI] [PMC free article] [PubMed] [Google Scholar]
- 28.Kingsley-Kallesen M., Luster T.A., Rizzino A. Transcriptional regulation of the transforming growth factor-beta2 gene in glioblastoma cells. In Vitro Cell Dev Biol Anim. 2001;37:684–690. doi: 10.1290/1071-2690(2001)037<0684:TROTTG>2.0.CO;2. [DOI] [PubMed] [Google Scholar]
- 29.Stransky N., Egloff A.M., Tward A.D., Kostic A.D., Cibulskis K., Sivachenko A. The mutational landscape of head and neck squamous cell carcinoma. Science. 2011;333:1157–1160. doi: 10.1126/science.1208130. [DOI] [PMC free article] [PubMed] [Google Scholar]
- 30.Sun Z., Yang P., Aubry M.C., Kosari F., Endo C., Molina J. Can gene expression profiling predict survival for patients with squamous cell carcinoma of the lung? Mol Cancer. 2004;3:35. doi: 10.1186/1476-4598-3-35. [DOI] [PMC free article] [PubMed] [Google Scholar]
- 31.Stephens P.J., Tarpey P.S., Davies H., Van Loo P., Greenman C., Wedge D.C. The landscape of cancer genes and mutational processes in breast cancer. Nature. 2012;486:400–404. doi: 10.1038/nature11017. [DOI] [PMC free article] [PubMed] [Google Scholar]
- 32.Cappelli E., Vecchio D., Frosina G. Delayed formation of FancD2 foci in glioma stem cells treated with ionizing radiation. J Cancer Res Clin Oncol. 2012;138:897–899. doi: 10.1007/s00432-012-1217-z. [DOI] [PMC free article] [PubMed] [Google Scholar]
- 33.Stewart G.S., Wang B., Bignell C.R., Taylor A.M., Elledge S.J. MDC1 is a mediator of the mammalian DNA damage checkpoint. Nature. 2003;421:961–966. doi: 10.1038/nature01446. [DOI] [PubMed] [Google Scholar]
- 34.Akan P., Alexeyenko A., Costea P.I., Hedberg L., Solnestam B.W., Lundin S. Comprehensive analysis of the genome transcriptome and proteome landscapes of three tumor cell lines. Genome Med. 2012;4:86. doi: 10.1186/gm387. [DOI] [PMC free article] [PubMed] [Google Scholar]
- 35.Vastrik I., D’Eustachio P., Schmidt E., Gopinath G., Croft D., de Bono B. Reactome: a knowledge base of biologic pathways and processes. Genome Biol. 2007;8:R39. doi: 10.1186/gb-2007-8-3-r39. [DOI] [PMC free article] [PubMed] [Google Scholar]
- 36.Desmet F.O., Hamroun D., Lalande M., Collod-Beroud G., Claustres M., Beroud C. Human Splicing Finder: an online bioinformatics tool to predict splicing signals. Nucleic Acids Res. 2009;37:e67. doi: 10.1093/nar/gkp215. [DOI] [PMC free article] [PubMed] [Google Scholar]
- 37.Hanahan D., Weinberg R.A. Hallmarks of cancer: the next generation. Cell. 2011;144:646–674. doi: 10.1016/j.cell.2011.02.013. [DOI] [PubMed] [Google Scholar]
- 38.Stratton M.R., Campbell P.J., Futreal P.A. The cancer genome. Nature. 2009;458:719–724. doi: 10.1038/nature07943. [DOI] [PMC free article] [PubMed] [Google Scholar]
- 39.Cancer Genome Atlas Research Network Comprehensive genomic characterization defines human glioblastoma genes and core pathways. Nature. 2008;455:1061–1068. doi: 10.1038/nature07385. [DOI] [PMC free article] [PubMed] [Google Scholar]
- 40.Curwen V., Eyras E., Andrews T.D., Clarke L., Mongin E., Searle S.M. The Ensembl automatic gene annotation system. Genome Res. 2004;14:942–950. doi: 10.1101/gr.1858004. [DOI] [PMC free article] [PubMed] [Google Scholar]
- 41.Flicek P., Ahmed I., Amode M.R., Barrell D., Beal K., Brent S. Ensembl 2013. Nucleic Acids Res. 2013;41:D48–D55. doi: 10.1093/nar/gks1236. [DOI] [PMC free article] [PubMed] [Google Scholar]
- 42.Biesecker L.G. Opportunities and challenges for the integration of massively parallel genomic sequencing into clinical practice: lessons from the ClinSeq project. Genet Med. 2012;14:393–398. doi: 10.1038/gim.2011.78. [DOI] [PMC free article] [PubMed] [Google Scholar]
- 43.Richter B.G., Sexton D.P. Managing and analyzing next-generation sequence data. PLoS Comput Biol. 2009;5:e1000369. doi: 10.1371/journal.pcbi.1000369. [DOI] [PMC free article] [PubMed] [Google Scholar]
- 44.Lescai F., Bonfiglio S., Bacchelli C., Chanudet E., Waters A., Sisodiya S.M. Characterisation and validation of insertions and deletions in 173 patient exomes. PLoS One. 2012;7:e51292. doi: 10.1371/journal.pone.0051292. [DOI] [PMC free article] [PubMed] [Google Scholar]
- 45.Schneider TD, Rogan PK. Computational analysis of nucleic acid information defines binding sites. US Patent 5,867,402; 1999.
- 46.Danecek P., Auton A., Abecasis G., Albers C.A., Banks E., DePristo M.A. The variant call format and VCFtools. Bioinformatics. 2011;27:2156–2158. doi: 10.1093/bioinformatics/btr330. [DOI] [PMC free article] [PubMed] [Google Scholar]
- 47.Rogan P.K., Faux B.M., Schneider T.D. Information analysis of human splice site mutations. Hum Mutat. 1998;12:153–171. doi: 10.1002/(SICI)1098-1004(1998)12:3<153::AID-HUMU3>3.0.CO;2-I. [DOI] [PubMed] [Google Scholar]
- 48.Trapnell C., Pachter L., Salzberg S.L. TopHat: discovering splice junctions with RNA-Seq. Bioinformatics. 2009;25:1105–1111. doi: 10.1093/bioinformatics/btp120. [DOI] [PMC free article] [PubMed] [Google Scholar]
- 49.Robinson J.T., Thorvaldsdóttir H., Winckler W., Guttman M., Lander E.S., Getz G. Integrative genomics viewer. Nat Biotechnol. 2011;29:24–26. doi: 10.1038/nbt.1754. [DOI] [PMC free article] [PubMed] [Google Scholar]
Associated Data
This section collects any data citations, data availability statements, or supplementary materials included in this article.
Supplementary Materials
Table S1. Splicing mutations in cell line U2OS predicted by Shannon pipeline.
Table S2. Splicing mutations in cell line U251 predicted by Shannon pipeline.
Table S3. Splicing mutations in cell line A431 predicted by Shannon pipeline.