

Abstract
Tagging amplicons with tag sequences appended to PCR primers allow the multiplexing of numerous samples for high-throughput sequencing (HTS). This approach is routinely used in HTS-based diversity analyses, especially in microbial ecology and biomedical diagnostics. However, amplicon library preparation is subject to pervasive sample sequence cross-contaminations as a result of tag switching events referred to as mistagging. Here, we sequenced seven amplicon libraries prepared using various multiplexing designs in order to measure the magnitude of this phenomenon and its impact on diversity analyses. Up to 28.2% of the unique sequences correspond to undetectable (critical) mistags in single- or saturated double-tagging libraries. We show the advantage of multiplexing samples following Latin Square Designs in order to optimize the detection of mistags and maximize the information on their distribution across samples. We use this information in designs incorporating PCR replicates to filter the critical mistags and to recover the exact composition of mock community samples. Being parameter-free and data-driven, our approach can provide more accurate and reproducible HTS data sets, improving the reliability of their interpretations.
INTRODUCTION
Multiplexing considerably reduces the costs of high-throughput sequencing (HTS) for amplicon-based studies, but its results are often subject to a pervasive and overlooked bias. The samples labelled during the polymerase chain reaction (PCR) amplification by the incorporation of tag sequences appended to PCR primers are prone to cross-contamination. This is due to a phenomenon that consists in switching of the tags among amplicons and referred to as mistagging (1). A comprehensive solution is urgently needed since various multiplexing strategies are extensively being applied for microbial ecology (2), environmental biomonitoring (3,4) and biomedical diagnosis (5). This can become critical when interpreting HTS data sets in terms of species presence–absence and even more when used as a decisive basis for health care or ecosystem management.
Only multiplexing strategies involving the tagging of both primers (double-tagging) allow detecting mistagging events. Some of them, termed here non-critical mistags, are easily recognisable because these reads are labelled with unexpected tag combinations (6,7). Such unexpected combinations can represent up to 55% of an Illumina run, in which over 60% of the contaminants found in a control sample were also abundantly sequenced in other multiplexed samples (8). However, if the switched tags result in expected combinations (planned in the original multiplexing design), the mistagging events remain undetectable and are termed here critical mistags. Moreover, if all possible combinations are deployed, the design becomes saturated and every mistagging event becomes critical because tags can only switch among expected combinations, as in strategies involving only one primer tagged (single-tagging). In fact, the occurrence of mistagging events in single-tagging strategies has been suggested by inference from double-tagging data (6), but never directly documented.
Mistagging events partly originate from cross-contaminations of tagged primers that can be limited by increased purification during synthesis and rigorous laboratory practices (9). They may also result as artefacts of the PCR performed on the pool of labelled amplicons during library preparation (6). This PCR can be bypassed using long tagged primer constructs originally developed in order to multiplex homologous regions enriched from individual genomes, i.e. for single-species samples (10,11). Such constructs have been applied to multiplex homologous PCR products amplified from metagenomes, i.e. for multi-species samples (12–16). However, the long primers are costly and may introduce a primer bias that should be avoided for species diversity analysis (17).
Surprisingly, the impact of critical mistags has never been documented in metagenomic samples. Conversely, other biases stemming from PCR or sequencing errors have been extensively analysed both qualitatively and quantitatively, leading to the refinement of clustering or filtering procedures (18–21). New methods were proposed to account for the distribution and frequency of sequences across samples in order to delineate taxonomic units (22) or across PCR replicates to remove noise from data sets (23). Here, we measure the magnitude and analyse the behaviour of mistagging events in various multiplexing designs and we identify the optimal design to avoid critical mistags and detect non-critical mistags. We describe mistagging patterns across PCR replicates of mock community samples and take advantage of their distribution for each unique sequence, termed here Individual Sequence Unit (ISU) (sequences from the set obtained after removing replicate sequences from the data set) as a new rationale for accurate filtering of HTS diversity data.
MATERIALS AND METHODS
In order to avoid contaminations during sample preparation and multiplexing experiments, we employed several precautions including the systematic usage of gloves, filter tips as well as dedicated material and rooms. We manipulated the colonies using clean filter tips in a PCR-free environment. We systematically wiped each tip on an absorbent paper prior to gentle disposal. We performed frequent blank negative controls (see below), no more than one PCR session per day and we allowed no circulation from post- to pre-PCR laboratories.
Cloned sequence samples
We generated 18S rDNA sequences by PCR amplification on environmental DNA extracts, cloning and Sanger sequencing. We used the clones either as single-sequence templates or mixed as mock communities. Relying on clones that vehicle single-copy inserts precludes intra-genomic polymorphisms and allows focusing on technical rather than biological biases. Moreover, clones are not subject to aerosolisation, precluding cross-contaminations during handling. First, we amplified 18S rRNA gene fragments encompassing either the eukaryotic V9 region or the foraminiferal 37f region from marine sediment samples extracts available in the laboratory. All primers were purified based on reverse phased chromatography (High Pure Salt Free) and controlled by optical density and Matrix-Assisted Laser Desorption/Ionisation - Time-Of-Flight (MALDI-TOF) mass spectrometry analyses (Eurofins, Germany). For the eukaryotic fragment, we used 0.2 μM of s12.2 (24) and sBnew (25) primers in PCR volumes of 25 μl comprising 1.5 Units of Taq polymerase (Roche), 1× of Buffer containing 15 mM of MgCl2, 0.2 mM of each Deoxinucleotide solution mix (dNTP), 0.5 g/l of bovine serum albumin (BSA) and ca. 10 ng of environmental DNA extract. After denaturation at 94°C for 2.5 min and before elongation at 72°C for 5 min, we applied 45 cycles as follows: 94°C for 30 s, 50°C for 1 min and 72°C for 1.5 min. For the foraminiferal fragment, we used the primers s14F3 and s17 (25) in similar PCR conditions but without BSA and with 1 min at 72°C per cycle. We cloned and Sanger-sequenced the PCR products as in (26). Each sequenced clone was transferred on a new gridded Petri dish and associated with a number on the grid in order to trace each sequence. We used clean filter tips to touch-and-drop the colonies, that we incubated at 37°C for ca. 12 h and stored at 4°C prior to colony PCRs with tagged primers. In total, we isolated a total of 26 eukaryotic and 86 foraminiferal clones.
We built mock communities from PCR amplicons in order to control the relative abundance of each template. We amplified each sequence by colony PCR in 50 μl containing 1 U of Pfx50 Polymerase (Invitrogen), 1× of Buffer, 15 mM of MgCl2, 0.2 mM of each dNTP and 0.2 μM of each primer annealing to the cloning vector pCR2.1 (Invitrogen), namely Dir2 (5′-GGGATGTGCTGCAAGGCGATT-3′) and Rev2 (5′-CCGGCTCGTATGTTGTGTGGA-3′). For some colonies, we isolated plasmid DNA using the NucleoSpin Plasmid kit (Macherey-Nagel) after incubation in sterile Lysogeny Broth (LB) media (with 50 μg/ml of ampicillin) for ca. 12 h at 37°C. We Sanger-sequenced the inserts again in order to ensure traceability. We quantified the PCR products using the Qubit dsDNA HS kit (Invitrogen) and we mixed them in variable proportions. This way, we composed mock community samples of 4–40 template clones, introduced at a maximum sequence abundance ratio of 1:500 (Supplementary Table S1). We only used foraminiferal clones to form mock communities because the foraminiferal-specific primers do not amplify bacterial and eukaryotic fragments. We prepared the mock communities incrementally, meaning that we processed the batch of clones selected for a given mock only once we successfully built and used the batch of clones selected for the mock community template of the previous multiplexing experiment.
Tagged primer design
We designed primers labelled with eight-nucleotide-long tag sequences appended to their 5′-ends as in (21,27). The tags (i) are anti-complementary to their corresponding conserved positions; (ii) allow selections of primer sets of balanced per-base nucleotide compositions; and (iii) have minimum pairwise edit distances of 3 both for the forward and reverse primers. This allows completely circumventing the mistags stemming from sequencing errors (9). We also maximized the evenness of the base composition in the tag sequences in order to enhance the base calling accuracy of the first sequencing cycles. For the foraminiferal-specific primers, we appended 26 tags (from A to Z) on both s14F1 (5′-AAGGGCACCACAAGAACGC-3′) and s15 (5′-CCACCTATCACAYAATCATG-3′). We used BLASTN 2.2.25+ (28) to design s15 as to the most specific 20-nucleotide sub-sequence of the highly conserved region situated 3′ of the 37f region of the rRNA gene (Supplementary Figure S1). For eukaryotic-universal primers targeting the V9 region of the same gene, we appended 15 tags (from A to J and from 1 to 5) on both V9F (5′-TTGTACACACCGCCC-3′) and sBnew (5′-TGCCTTGTTCGACTTCTC-3′) (Supplementary Table S2).
PCR amplification, library preparation and sequencing
Each of our seven multiplexing experiment corresponds to an Illumina library composed of single-sequence or mock community samples labelled using tagged primers incorporated by PCR (Figure 1, Supplementary Figure S2, Supplementary Table S3). For each multiplexing experiment library, we chose samples corresponding to sequence sets of maximized pairwise distances (Supplementary Methods). Putting together only highly different sequences ensures unambiguous assignment after sequencing (Supplementary Figure S3). We performed colony PCR as above but in 30 μl volumes and using tagged primers. Following an incubation at 94°C for 5 min and before a final elongation at 68°C for 2 min, we applied 35 cycles at 94°C (15 s), 50°C (15 s) and 68°C (10 s). We included blank controls corresponding to filter tips scrapped on Petri dish surfaces free from colony at a ratio of 1:3. In the post-PCR laboratory, we purified a set of amplicons with the High Pure PCR Cleanup Micro kit (Roche) prior to quantification with the QuBit HS dsDNA kit (Invitrogen). We quantified the remaining amplicons based on absolute values and relative band intensities measured after electrophoresis on 2% agarose gels using ImageLab 4.0.1 and a Gel DocTM XR+ transilluminator (BioRad). We multiplexed the labelled samples by pooling approximately 10 ng of each PCR product that we further purified as above and shipped frozen to Fasteris SA (Plan-les-Ouates, Switzerland). Based on the TruSeq genomic DNA kit (Illumina), we realized the end-repair and A-tailing steps (17.5 μl DNA + 12.5 μl A-Mix). Then, in addition to the adapter and ligation mix, we added 0.5 μl of polynucleotide kinase and 1 μl of adenosine triphosphate 1 mM for the adapter ligation step. Finally, we performed eight cycles of indexing PCR to add the sequencing barcodes on the Illumina PE adapters before a last purification step. For MiSeq sequencing, we distributed our libraries across two paired-end runs of 2*151 cycles each. We used the regular PE sequencing primers, so that the first sequenced positions of each read correspond to the tags incorporated at each end of the PCR product inserts.
Figure 1.
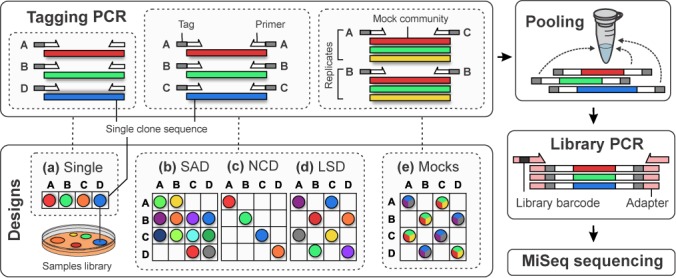
Multiplexing designs and library preparation. For each design, we deployed unique combinations of tagged primers to PCR amplify samples corresponding to isolated and sequenced single-sequence clones. (a) Single tagging: either all the forward (SFA-120) or all the reverse (SFA-121) primers are tagged. (b) Double-tagging saturated design (SAD): tagged primers are used in combinations and deployed to maximize the sample saturation (SFA-124). (c) Double-tagging non-combinatorial design (NCD): combinations are deployed so that each primer is used only once (SFA-122). (d) Latin Square Design (LSD): combinations are deployed to balance primer usage frequencies and to reduce the sample saturation (SFA-123). (e) Mock community replicates: each sample corresponding to mixtures of 5–40 clone sequences is labelled by five unique combinations (SFA-125 and SFA-126). After the tagging PCR, the labelled PCR products of each experiment are pooled in equimolar ratio and subject to the Illumina TruSeq PCR-based library preparation prior to sequencing on the MiSeq instrument. Interactive versions of these figures are available as online supplementary material.
Multiplexing design experiments
We tested five multiplexing designs involving primer deployments differing in number of primers tagged, usage frequency and samples corresponding either to single clones or PCR replicates of mock communities (Figure 1).
Detection protocols
We prepared two single-tagging and one double-tagging libraries to detect and quantify the magnitude of mistagging events. For the single-tagging libraries, we labelled the multiplexed amplicons using only the forward (SFA-120) or only the reverse (SFA-121) tagged primers. For the double-tagging library, we used both forward and reverse tagged primers but only as non-combinatorial pairs, i.e. each primer is employed strictly once (SFA-122). For each library, we multiplexed 26 foraminiferal and 15 eukaryotic single-sequence samples. We sequenced SFA-120 and SFA-122 on a first run and SFA-121 on a second run (Supplementary Table S3).
Saturated design and Latin Square Design
We prepared two double-tagging libraries to assess the robustness of multiplexing designs varying in terms of tagged primer usage frequency and configuration. In a first library (SFA-123), we multiplexed 15 single-sequence foraminiferal samples using 15 out of the 25 possible combinations possible with 5 forward and 5 reverse tagged foraminiferal primers. We say that this design has a saturation of 60%. The saturation of an experimental design is an indicator of the primer usage density and can be computed as the ratio of samples multiplexed over the number of tagged primer combinations. Hence, a saturation of 100% means that all tagged primer combinations are used. In the same library, we also multiplexed 14 eukaryotic samples using 14 out of the 49 possible combinations with 7 forward and 7 reverse tagged eukaryotic primers (28.5% saturation). We selected these 15 and 14 expected combinations according to the mathematical framework referred to as the Latin Square Design (LSD) in order to balance the tagged primer usage frequencies (see Computational Methods section). The goal of the LSD is to ensure that the samples are equally distributed over all tagged primers, i.e. each primer is used the same number of times (29). This means that our design ensure that all primers are used in the same number of samples over the complete multiplexing design (see Computational Methods section). In the second library (SFA-124), we multiplexed the same 15 foraminiferal samples based on the same 5 forward and 5 reverse tagged foraminiferal primers as in SFA-123 (60% saturation). For 10 samples we even re-used the same PCR products that we generated for SFA-123. However, we selected the tag combinations in order to skew the primer usage frequency towards what we call here a saturated design (SAD). We sequenced SFA-124 on the first run and SFA-123 on the second run (Supplementary Table S3).
Mock community replicates
We prepared two double-tagging libraries from PCR replicates performed on mock communities to analyse the distribution and test the filtering of mistagging events in complex diversity samples. In the first library (SFA-125), we labelled and multiplexed 20 PCR products representing five PCR replicates of four mock community samples with highly varying abundances of cloned 18S rRNA sequence targets (hllll, hhmll, hhhhl and Hhml). In the second library (SFA-126), we multiplexed 10 PCR products for the five PCR replicates of two mock community samples (even and random depending on the relative abundance of the cloned 18S rDNA). We sequenced SFA-125 on the first run and SFA-126 on the second run (Supplementary Table S3).
Computational analysis
Quality filtering and paired-end reads assembly
In order to keep a maximum of reads for deeper insights into the understanding of mistagging biases, we kept sequences with a mean Phred quality score above 20, but no ambiguous base call. We compared the tagged primers using Needleman–Wunsch alignments, allowing up to one and two errors in the tag and primer sequences, respectively. If we could not find a matching tagged primer, the corresponding pair was discarded. Then, we reconstructed the sequence from each paired reads according to the Needleman–Wunsch alignment resulting in the best overlap, with at least 12 bp and up to five differences. We removed sequences of less than 20 nucleotides.
Clone sequence assignment
We computed a reference, hashing tree structure containing all the sequences of the clones, our extensive foraminiferal database and the PR2 database (30). Each sequence found in the hashing tree was de-replicated and statistics associated with the reference sequence name, number of reads and tagged primers were updated. If no hit was found, the new sequence was appended in the tree and assigned by Needleman–Wunsch alignments against our databases. First, we searched the clone sequences database relying on a hard threshold of 95% similarity for unambiguous assignment, according to the pairwise distances of the selected clones (Supplementary Figure S3). Then, we checked the complete distance set with a soft threshold of 90% similarity. If no match was found in the clone sequences database, we repeated this procedure on the foraminiferal and PR2 databases. If still no hit was found, we searched for Basic Local Alignment Search Tool (BLAST) hits of least 90% identity and 90% coverage against (i) the sequences of the hashing tree, (ii) the National Center for Biotechnology Information (NCBI) nucleotide database and (iii) the PhiX genome. We analysed the remaining unassigned sequences to screen for the presence of chimeras and repeated motifs of at least seven bases. First, based on the BLAST results, we considered a sequence as chimeric if different parents form heat shock proteins separated by less than two nucleotides and had an identity threshold above 90%. Subsequently, we ran UChime (31) in database mode and considered a sequence as chimeric above a score of 0.3. Finally, we searched for repeated sub-sequences of at least seven nucleotides, starting with the detection of primer sequence motifs. If we found no match throughout these steps, we considered the sequence as unknown.
Mistagging-based filter
Our filtering procedure is designed to discriminate critical mistags from true sequences based on the information conveyed by the occurrences of non-critical mistags. Our rationale is that each sequence with a particular level of abundance that is genuine inside a sample will generate a set of non-critical mistags with lower abundance (and more frequently with one of the tagged primer shared with their original genuine sequences). Therefore, if a sequence is found in a sample with a level of abundance comparable to the abundance of non-critical mistags for the same sequence, then there is a high probability for this sequence to be a critical mistag. Hence, this ISU-based filter relies on the abundance of each sequence found as non-critical mistags as a baseline of abundance for the mistagging. As the idea of this filter is to shift the focus of filtering processes towards an ISU-centred approach, we consider each ISU of each sample as a separate event and decide for a different threshold for each ISU. This means that if the same ISU is found in several samples, a different threshold for this ISU will be computed for each of the samples in which it was found. Therefore, the relative proportions of reads in each sample are accounted implicitly. To compute these thresholds, we gather for each sequence labelled with an expected combination the distribution of abundance of this sequence labelled with all unexpected combinations that share at least one primer with the current expected combination. This leads to a set of abundances from which we compute a non-parametric rejection region to decide whether the corresponding sequence is genuine or a critical mistag (see Computational Methods).
All the analysed raw read data sets are submitted to the NCBI BioProject ID 245467. All software used to produce the data or generate LSD experimental planning is available at https://github.com/esling/mistagging.
RESULTS
From a total of 15 742 041 reads, we obtain 8 700 874 reads after quality filtering and assembly (Supplementary Table S4). No extraneous contamination occurred as confirmed by the absence of match against extensive reference databases (Supplementary Table S5). No clone carried more than one sequence, as assessed across incrementally prepared libraries (Supplementary Figure S4).
Single-tagging mayhem
We quantified mistagging events in single-tagging libraries, in which each single-sequence sample should appear labelled with only one tag (Figure 1, Supplementary Table S3). This is clearly not the case, as displayed by the dense and intricate networks of critical mistags (Figure 2 and Supplementary Figure S5). On average, each sample is found labelled with 74.7% of other possible tags and 61.1% of the samples are even found associated with all tags. Moreover, the tags label primer dimers and chimeras. Small proportions of unknown ISUs are found labelled with eukaryotic (2.85%) and foraminiferal (8.94%) tagged primers, and all are represented by single reads (Supplementary Tables S6–S8). After primer dimer and chimera removal, the proportion of critical mistag ISUs is 28.9% on average (36.3 and 15.2% for foraminiferal and eukaryotic samples, respectively), and 9.6% in terms of reads abundance.
Figure 2.
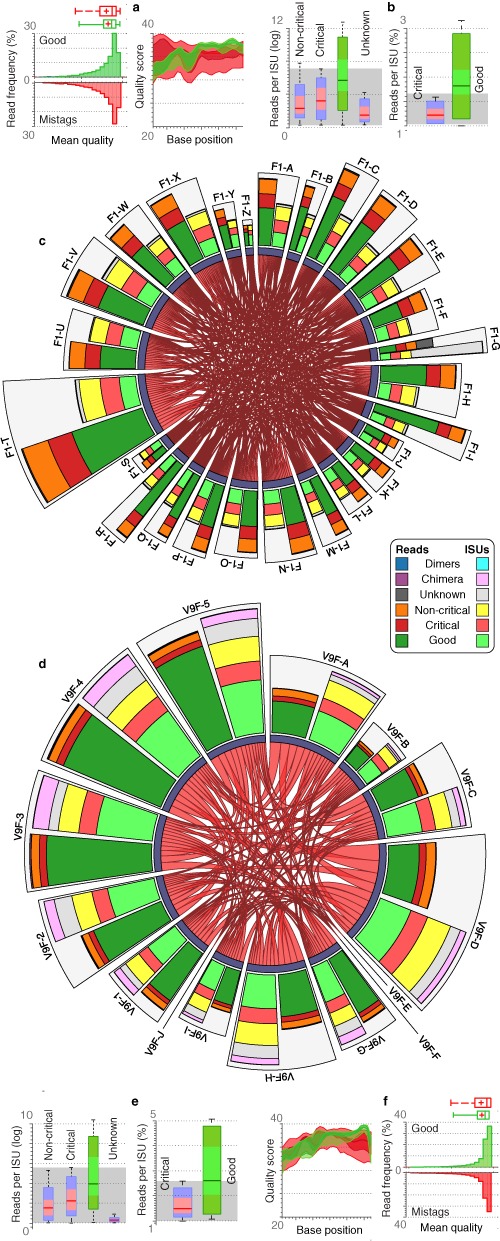
Single-tagging mayhem (SFA-120). Mistagging events are displayed in the chord diagrams separately for foraminiferal (c) and eukaryotic (d) data. The central parts represent critical mistags as red links indicating the amount of reads when a sample targeted by a specific tag (one extremity of the string) is found labelled with another tag (other extremity). These central parts would be completely empty in the absence of mistags. For each expected tagged primer, joint barplots indicate the amounts of ISUs (light colours) and reads (dark colours) binned into good (expected sample), critical (unexpected sample), non-critical (spurious combination), chimera, dimers and unknown sequences. The abundance data are shown in terms of reads per ISUs for foraminifera (b) and eukaryotic samples (c). Mean and per-base qualities of correct and mistagging reads are also displayed separately for foraminiferal (a) and eukaryotic (f) samples.
Even though the critical mistag reads are on average less frequent than correctly demultiplexed reads, they can represent up to 21.4% of the reads and 48.3% of the ISU diversity associated with a given tag (Supplementary Tables S6 and S7). In terms of number of reads per ISU, critical mistags can be as abundant as correct sequences (Figure 2b and e). Hence, the abundance filtering parameters needed to remove all mistags would also discard 99.6% of correctly labelled ISUs. This also holds for quality-based filters since the quality distributions of mistagged and correct reads are equivalent, even at the per-base level in the tagged primer region (Figure 2a and f). The distribution of mistagging read abundances shows that few tagged primers are preferentially involved in mistagging events (Supplementary Figure S6).
Double-tagging saturation
We describe the behaviour of the mistagging phenomenon in double-tagging multiplexing strategies by comparing the SAD and non-combinatorial design. In the SAD (SFA-124) where the primer usage frequencies are not balanced and 60% of the combinations are deployed, the proportions of critical mistags are even higher than those obtained with single-tagging strategies, both in terms of sequence diversity (33.6% of ISUs) and abundance (19.2% of reads) (Supplementary Tables S6 and S7). All possible primer-to-primer associations appear (Figure 3b), with a strong bias towards the primers more frequently used in the SAD combinations. Interestingly, we also detected tagged primers not deployed in the library, represented by the primers nodes not connected to any sample node on Figure 3b. Moreover, all samples except one are found labelled with the 15 expected combinations (Supplementary Table S9). The 10 unexpected combinations of the SAD label 14.9% of the sequence diversity (9.1% of the reads). Additionally, spurious tag associations are 30 times more numerous than the unexpected combinations, although they correspond to very low-abundance non-critical mistagging events (unexpected combinations axis on Figure 3b, Supplementary Table S10).
Figure 3.
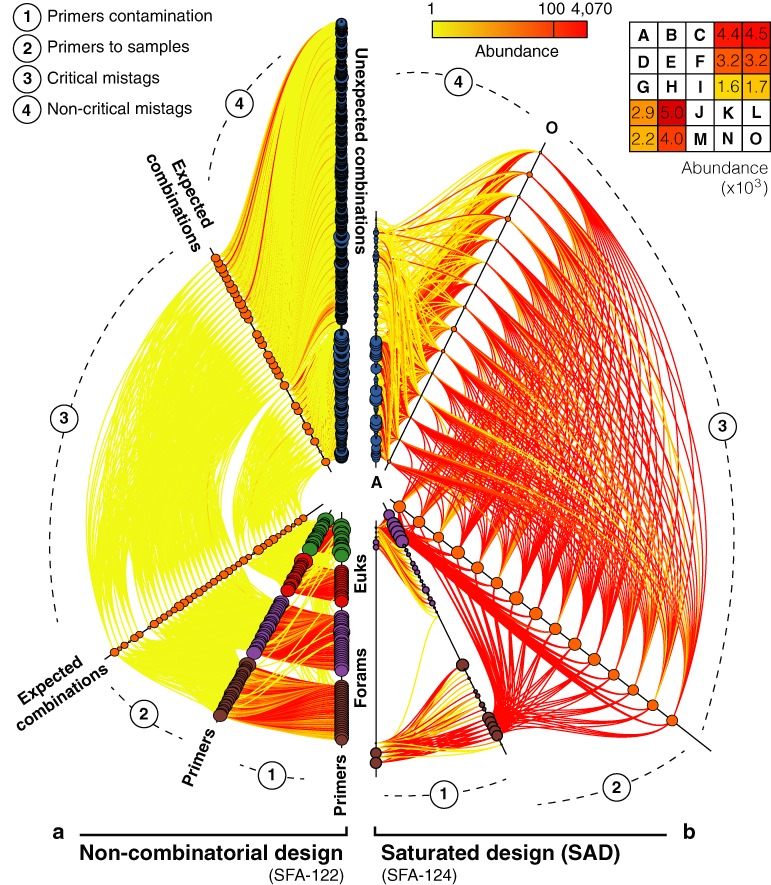
Double-tagging saturation (SFA-122 and SFA-124). Cross-contamination patterns between pairs of elements inferred from mistagging events, namely (1) among primers, (2) between primers and expected combinations, (3) among expected combinations and (4) sequences corresponding to expected combinations found labelled with unexpected and spurious combinations. Two hive plots are placed alongside, one for the non-combinatorial strategy (left) and one for the saturated strategy (right). The different instances of each type of elements are gathered on the categorical axes, labelled in bold. Each axis node represents either a primer, an expected combination or an unexpected combination. The nodes relative radii are proportional to the mistagged read abundances. The edges represent directional mistagging events (i.e. the association of a sample with a wrong combination) and their colours indicate the amount of these events in terms of read abundances, ranging from low (yellow) to high (red). The non-combinatorial library is composed using all foraminiferal tagged primers (purple and brown nodes) and all eukaryotic primers (red and green nodes). The saturated library is composed using 10 foraminiferal primers. For each design, a tagged primer usage matrix is filled either with letters or number. Letters indicate the expected combinations and numbers indicate the amount of reads found for each unexpected combination (see Supplementary Table S1). Two letters corresponding to the first and last sorted combinations are reported at the extremities on the expected combinations axes.
In the non-combinatorial design (SFA-122) where each primer is used only once (providing the minimal saturation possible), critical mistags are extremely rare (Figure 3a). On average, there is only 0.5% of critical mistag reads per expected combination and even three combinations are completely free from critical mistag. On average, each of the 26 foraminiferal samples is found in 46.1% of the expected combinations, but with very low read abundances. As illustrated by the numerous links in the networks of Figure 3a, the overall proportion of mistags is as high as in the SAD, but these events are mainly non-critical (97.2% of reads). Non-critical mistags represent 1681 combinations, including all 860 unexpected combinations and numerous spurious tag associations (Supplementary Table S10). Interestingly, non-critical mistags are evenly distributed among unexpected combinations (see nodes sizes on the unexpected combinations axis of Figure 3a).
Latin Square Design
In LSDs, the expected tag combinations are chosen so that the tagged primer usage frequencies are balanced (Figure 1). At constant saturation (60% of the tagged foraminiferal primer combinations deployed, as in the SAD), we found that critical mistags are less frequent in LSD (SFA-123) than in SAD (SFA-124). This trend is visible on our networks by sparser and less abundant critical mistags (Figure 3b versus Figure 4a). On average, critical mistags represent only 7.8% of reads in LSD against 19.2% in SAD, corresponding to 17.9% and 33.5% of ISUs, respectively. This trend is also visible in the number of reads per ISU, with mean values of 13.5 and 9.8 reads per critical ISU for SAD and LSD, respectively (Supplementary Tables S6 and S7).
Figure 4.
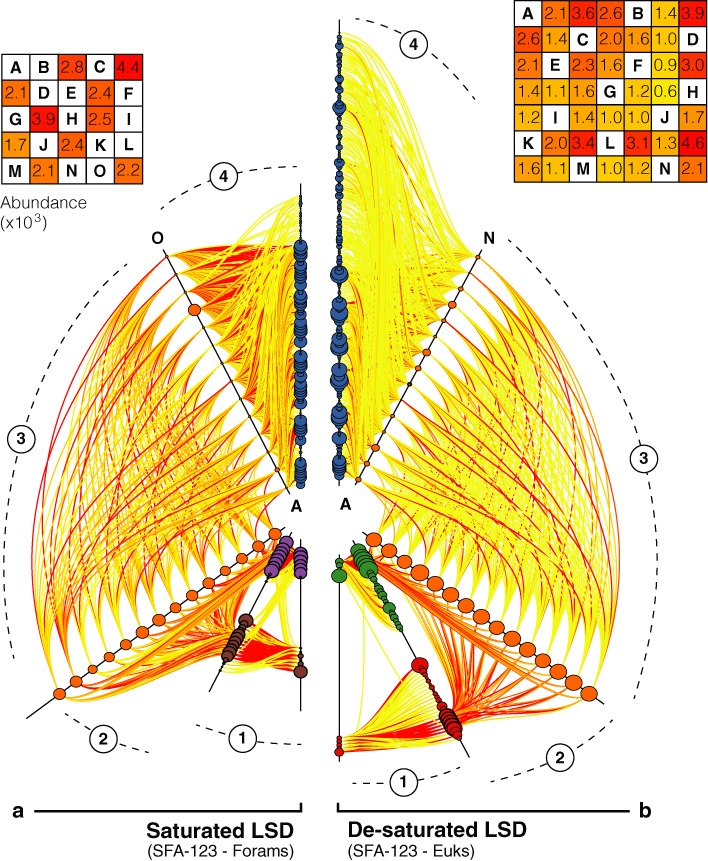
Latin Square Design and de-saturation (SFA-123). The overall structure of this figure is to be interpreted as Figure 3. The two hive plots placed alongside represent two Latin Square Designs but either deployed at (a) high density (60% saturation) or (b) low density (28.5% saturation).
Reducing the saturation yields even more accurate results, as shown for the eukaryotic samples multiplexed using 14 expected combinations deployed in LSD out of 49 possible combinations (28.5% saturation). On average, the proportion of critical mistags drops down to 2.5% of reads (7.9% of ISUs), and although a sample is found labelled with 52.9% of the expected combinations, no sample is found labelled with all these combinations. The distribution of the mistags is similar in the de-saturated LSD and in the non-combinatorial design. Indeed, most mistag reads are non-critical, as they are associated with the 35 unexpected combinations of the LSD (89.7% of all mistag reads). Moreover, these non-critical mistags correspond to diverse but rare events, with a mean abundance of 11.03 reads per ISU.
Interestingly, we observe that the sample composition analysed from the 10 PCR products multiplexed in SAD is different when they are re-sequenced in LSD and include less frequent mistags (Supplementary Figure S7). Indeed, up to half of the cross-contaminating clone diversity can be found sequenced in only one of the two sequencing replicates. Even when found sequenced in both replicates, the relative abundances of the clone sequences can be sharply different.
Mock community replicates and mistagging-based filtering
We analyse the distribution of mistagging events in two libraries containing PCR replicates of mock community samples. In each library, the reads are evenly distributed among samples notwithstanding 25% of non-critical mistags (Supplementary Table S11). In every PCR replicate of a sample are present all the ISUs perfectly matching the reference sequences of the clones that compose this sample (i.e. reference ISUs), along with other ISUs that have slight errors but could still be assigned to these clone sequences (i.e. error ISUs) as well as critical mistag ISUs (4.7% on average). Most critical mistag reads found in a given sample are assigned to clones ascribed to another sample of the same library (88.5% on average) (Supplementary Table S12), but never to a clone incorporated as a rare template. This observation supporting that mistagging events happen at the library level is clearly illustrated in SFA-125 where the cross-contaminated samples contain no more than five clones (Supplementary Figure S8). This is further confirmed by the global distribution of clones across the libraries of each run (Supplementary Figure S4).
Mistagging events are importing ISUs as cohorts into samples labelled either with expected (critical mistags) or unexpected combinations (non-critical mistags), but with the relative read abundances of the sample from which they originate. In the case of critical mistags, we found that the read abundance ratios between a reference ISU and each of its error ISUs are conserved across samples, i.e. irrespectively of whether the ISU correspond to an expected or a mistag clone. This is exemplified across the two samples of SFA-126, where one error ISU is more abundant than the reference ISU of three clones (foram18, 70 and 78) (Supplementary Figure S8). In the case of non-critical mistags, we found that the most reads are labelled with unexpected combinations sharing at least one of the initial tagged primers (Supplementary Figure S9). For each ISU, the correctly tagged copies become outliers standing above the ‘mistagging noise’ represented by the read abundance distribution of non-critical mistags. The rationale of our ISU-centred filtering approach is based on this observation and we evaluated its effect on the ability to recover the diversity of mock community samples using PCR replicates intersection sets.
Taking the ISUs at the intersection of PCR replicates discards numerous, but rare error ISUs, while the mistagging-based filter removes few, but abundant critical-mistag ISUs that can be sequenced in all replicates. Neither of the approaches discards any expected clone, even among as few as 58 ISUs found in five replicates (Supplementary Figure S10). In intersection sets of increasingly numerous PCR replicates, the ISU diversity decreases while the numbers of reads per ISU increase for both correctly labelled and mistagged ISU (Supplementary Figure S11). Only two replicates intersection sets are sufficient to remove all unknown sequences and on average over all mock communities, 87.4% of error ISUs (35.5% of reads). This proportion climbs to 93.3% (41.9% of reads) and to up to 96.8% (47.2% of reads) when intersection sets of three and five replicates are considered, respectively (Supplementary Tables S13 and S14).
Our mistagging-based filter removes from the replicates of each sample the critical-mistag ISUs more efficiently than the ISUs assigned to the correct clones (Figure 5a). However, it only discards 69.7% of the artefactual ISUs (Supplementary Table S15). Up to 42% of the correct ISUs sequenced in all five replicates remain in the five replicates after filtering, while the majority of the critical-mistag ISUs present in three, four or even in all five replicates are discarded from most of them. Interestingly, the correct ISUs occurring in only two replicates tend to be preserved from filtering in both of them. In general, few correct ISUs are filtered from all the replicates in which they occur, including for the ISUs exclusive to one PCR replicate. Surprisingly, the critical-mistag ISUs sequenced in only one replicate are not filtered, because they are too rare to form cohorts of non-critical mistag for the filter to operate.
Figure 5.
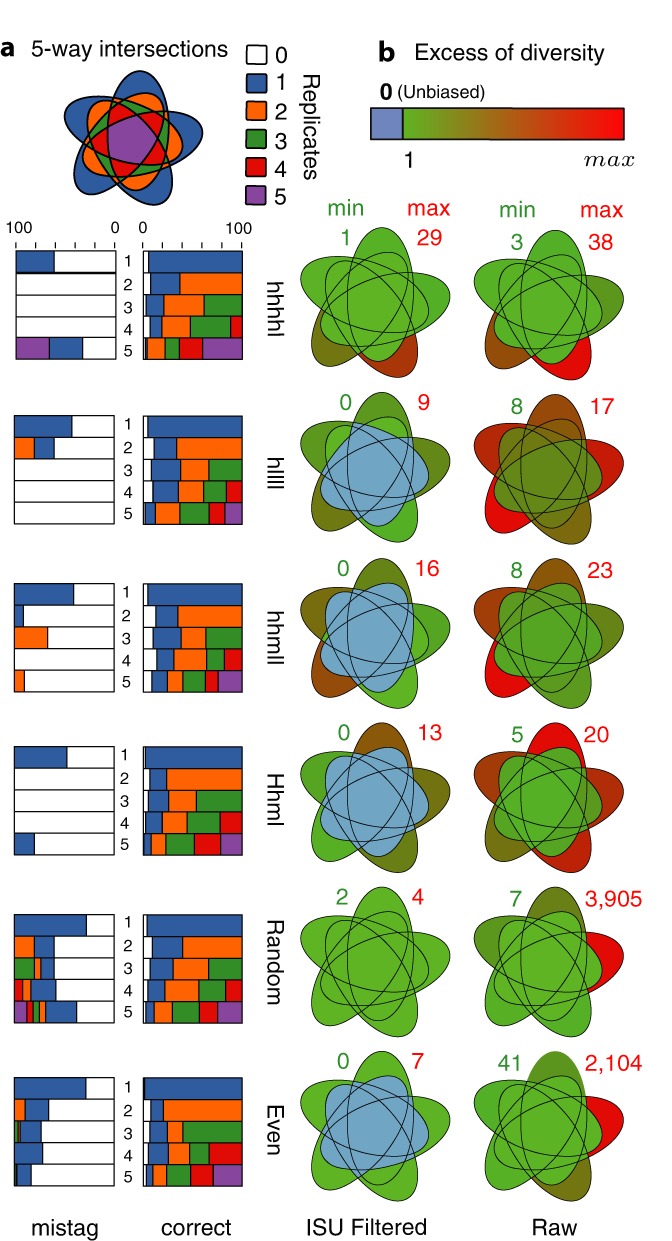
Mistagging-based filtering and intersection sets of PCR replicates for mock community samples (SFA-125 and SFA-126). For each mock community (in lines) is indicated on the left side (a) the effect of the mistagging-based filter using barplots and on the right side (b) the clone diversity retrieved in each replicate intersection set using five-way Venn diagrams. (a) The barplots indicate the fraction of the ISUs present in a given number of replicates (horizontal bars) that remain in 1 (blue), 2 (orange), 3 (green), 4 (red) or 5 (violet) replicates after filtering. The correct ISUs assigned to expected clones (right barplots) are separated from critical mistag ISUs (left barplots). (b) The differences to the expected number of clones are represented in each replicate intersection set by five-way Venn diagrams both before (raw) and after mistagging-based filtering (filtered). The numbers associated with each Venn diagram indicate the minimum (green number) and maximum (red number) difference in the number of clones recovered in the intersections, including unassigned and artefactual ISUs. The colour variation within each diagram is defined by these values reported on the diversity variation legend (upper right).
Based on filtered data, the exact composition of four samples can be recovered from the ISUs present in at least three replicates (Figure 5b and Supplementary Table S16). In fact, after the removal of critical-mistag ISUs, the exact composition can be retrieved in 55.7% of all possible replicate intersections, including in 41.6% of two-replicates intersections and in 66.7% of all the four-replicates. Finally, the observed relative abundances of the ISUs assigned to the clones constituting a given sample reflect the theoretical relative abundances and even more faithfully when only the ISUs shared across replicates are considered (Supplementary Figure S12).
DISCUSSION
We showed that multiplexing of amplicon libraries for studying the diversity in metagenomic samples is prone to intractable cross-contamination events due to the mistagging phenomenon. Single-tagging as well as saturated double-tagging strategies are flawed by numerous and undetectable critical mistags. We showed that non-combinatorial designs minimize the occurrence of critical mistags by eliciting the formation of unexpected combinations, but offer a poor multiplexing capacity. The LSD represents the optimal trade-off between the error minimisation ability of non-combinatorial designs (7) and the multiplexing capacity of SAD (32). LSD enforces non-critical mistags in designs defined according to a number of possible combinations and a number of samples, as shown with the comparison to the SAD at identical saturation levels. For example, by relying on a LSD involving 30 forward and 30 reverse primers used 10 times each, one could multiplex 300 samples (or 100 samples in triplicates) at a saturation level of 33% only. This provides a perfect framework for our filtering method based on non-critical mistags information, but also a considerable gain of time and money. Moreover, limiting the number of deployed tagged primers reduces tag misidentification problems through the design of highly variable tag sequences (9), as well as the risk of cross-contamination during handling.
The magnitude of the mistagging phenomenon by far exceeds the expectations of previous studies relying on tagged primer constructs (6,9). It has been proposed that one of the major sources of mistagging is primer cross-contamination (6,8). However, we obtained no positives in 60-cycles PCR tests involving only one of two tagged primers in the mix, and in an additional library containing more than 300 000 reads, we found only 0.096% of them labelled with at least one of nine tagged primers left untouched out of 40 ordered primers (data not shown). Therefore, the impact of primer cross-contaminations seems negligible and only visible because of the sequencing depth of HTS. To some extent, especially purified primers can alleviate this source of mistagging, but at high expense for numerous samples, and even without removing them entirely (9).
Our study shows clearly that the mistagging events mainly occur during the PCR performed on the pool of labelled amplicons. This is demonstrated by the fact that the clones contaminating a sample originate from the other samples multiplexed within the same library. PCR-free library-preparation methods are promising, but necessitate high amounts of input DNA. This could be achieved by multiplexing more samples or non-homologous material such as a species genome or transcriptome (33). It has been demonstrated that the frequency of chimera formation is inversely related to the complexity of the sequence sample subject to PCR (34). Therefore, multiplexing non-homologous PCR products prior to library-preparation PCR enhances the sequence diversity and reduces the impact of chimera, which is probably responsible for the recombination of fragments ends where the tags are located. Hence, with more complex environmental DNA samples it could be predicted that chimera-driven mistags might be less prominent. However, their appearances might range in the same amounts as chimeras usually witnessed in environmental samples. This may explain what we observed in the LSD library, where both foraminiferal and eukaryotic PCR products were multiplexed. Alternatively, pooling high quantities of PCR products can increase the amount of input DNA. However, this second solution is risky because PCR products are stable laboratory contaminants that can be readily discovered in HTS conditions (35). Although appealing indexing library-preparation methods are flourishing, it is wise to label PCR products during the first amplification in order to be able to trace potential contaminants.
This first PCR enriches a specific diversity from complex samples, but also creates biases responsible for the inflation of diversity estimates (36,37) and the introduction of artefactual variability across samples (38). To correct such biases, internal controls such as co-sequenced mock community samples can be employed (33), but their suitability depends on their complexity (39). Instead, our filtering method does not require the addition of a supplementary sample and rather relies directly on the properties of the data itself. Moreover, it is particularly suited to HTS, as its statistical power increases with the amount of sequence data. Indeed, a higher amount of non-critical mistags provides a finer resolution in the detection and removal of critical mistags.
Theoretically, each species genome template should produce exactly one ISU, including the polymorphic copies of a gene. Our filter operates at such a resolution because it is ISU-centred, i.e. it computes the read abundance distribution across samples of each ISU independently. Hence, it does not rely on a unique abundance threshold applied over all samples but computes a different threshold for each ISU in each sample, accounting for differential sample sequencing depths (40,41). Moreover, our filter requires no tuning of subjective parameters resulting in different sets of arbitrary thresholds (19,20). Being completely parameter-free, our approach has the utmost advantage of allowing the establishment of synoptic models towards more comparable diversity analyses.
The robustness of our approach is greatly reinforced by the incorporation of PCR replicates. As shown by our study, the replicates labelled using non-combinatorial tag pairs are less prone to cross-contamination by identical mistags or to the accumulation of random errors. Indeed, the probability of such co-occurring events corresponds to the product of the probabilities associated with each replicate. The importance of technical replicates has been emphasized for the filtering of erroneous sequences (23,42). One approach is to focus on the union of replicates, assuming that the full sample complexity is missed by individual PCRs (43) and because arbitrary abundance-based filtering can lead to removing many rare genuine species (44,45). Another approach is to analyse the diversity at the intersection of replicates, assuming that genuine species are detected in every PCR. Even with as few as 17% of diversity shared among replicates (46), this conservative assumption has been corroborated previously (23) and by our own results, although we cannot exclude false positive artefacts due to the size of our mock community samples. The incorporation of PCR replicates in a multiplexing design is not trivial under this assumption since (i) more replicates may result in more mistags and (ii) the same chimeras are likely to happen across replicates since the initial sequence diversity is similar in the replicates of a sample (34,47). A trade-off between the number of samples and the amount of replication must be considered to ensure that rare species sequences remain unfiltered from replicates. Finally, it should be noted that the same amount of caution towards mistagging and applying alleviating measures should also be taken into account for non-environmental studies pooling together the tagged specimens (48).
In conclusion, we propose a few recommendations to increase the accuracy of HTS data sets based on multiplexed amplicon libraries:
Proscribe single-tagging and saturated double-tagging designs.
Choose tagged primer combinations according to LSD to maximize the mistagging information.
Minimize the sample saturation to reduce the proportion of critical mistags.
Incorporate at least two PCR replicates to remove error ISUs.
Label PCR replicates with tagged primers used only once to avoid inter-replicate mistags.
Use parameter-free, data-driven and ISU-centred filtering approach.
Avoid long primer constructs for multi-species samples.
Some of these recommendations can be easily implemented. We provide a LSD generator to assist the design of double-tagging strategies and a filter accounting for mistagging patterns and PCR replicates. Our approach allows accurate HTS data denoising and preserves both the relative abundance and the occurrence of rare, genuine sequences templates. We are confident that associating robust experimental planning with powerful sequence-data filtering is the condicio sine qua non of comprehensive surveys requiring the deployment of numerous samples and replicates.
SUPPLEMENTARY DATA
Supplementary Data are available at NAR Online.
Acknowledgments
The authors thank Simon Gregory, Sev Kender and Juan Montoya for fruitful comments on the manuscript as well as anonymous referees for helpful comments, and Fasteris SA for sequencing services.
Footnotes
Present address: Philippe Esling, Department of Genetics and Evolution, University of Geneva, Sciences 3, 30, Quai Ernest Ansermet, CH-1211 Geneva 4, Switzerland.
FUNDING
Swiss National Science Foundation [31003A-140766]. Funding for open access charge: Swiss National Science Foundation [31003A-140766].
Conflict of interest statement. None declared.
REFERENCES
- 1.Carlsen T., Aas A.B., Lindner D., Vrålstad T., Schumacher T., Kauserud H. Don't make a mista(g)ke: is tag switching an overlooked source of error in amplicon pyrosequencing studies. Fungal Ecol. 2012;5:747–749. [Google Scholar]
- 2.Jiang X.T., Peng X., Deng G.H., Sheng H.F., Wang Y., Zhou H.W., Tam N.F.Y. Illumina sequencing of 16S rRNA tag revealed spatial variations of bacterial communities in a mangrove wetland. Microb. Ecol. 2013;66:96–104. doi: 10.1007/s00248-013-0238-8. [DOI] [PubMed] [Google Scholar]
- 3.Carew M.E., Pettigrove V.J., Metzeling L., Hoffmann A.A. Environmental monitoring using next generation sequencing: rapid identification of macroinvertebrate bioindicator species. Front. Zool. 2013;10:45–59. doi: 10.1186/1742-9994-10-45. [DOI] [PMC free article] [PubMed] [Google Scholar]
- 4.Yu D.W., Ji Y., Emerson B.C., Wang X., Ye C., Yang C., Ding Z. Biodiversity soup: metabarcoding of arthropods for rapid biodiversity assessment and biomonitoring. Methods Ecol. Evol. 2012;3:613–623. [Google Scholar]
- 5.Moreau M.M., Eades S.C., Reinemeyer C.R., Fugaro M.N., Onishi J.C. Illumina sequencing of the V4 hypervariable region 16S rRNA gene reveals extensive changes in bacterial communities in the cecum following carbohydrate oral infusion and development of early-stage acute laminitis in the horse. Vet. Microbiol. 2014;168:436–441. doi: 10.1016/j.vetmic.2013.11.017. [DOI] [PubMed] [Google Scholar]
- 6.Kircher M., Sawyer S., Meyer M. Double indexing overcomes inaccuracies in multiplex sequencing on the Illumina platform. Nucleic Acids Res. 2012;40:e3. doi: 10.1093/nar/gkr771. [DOI] [PMC free article] [PubMed] [Google Scholar]
- 7.Deagle B.E., Thomas A.C., Shaffer A.K., Trites A.W., Jarman S.N. Quantifying sequence proportions in a DNA based diet study using Ion Torrent amplicon sequencing: which counts count? Mol. Ecol. Resour. 2013;13:620–633. doi: 10.1111/1755-0998.12103. [DOI] [PubMed] [Google Scholar]
- 8.Degnan P.H., Ochman H. Illumina-based analysis of microbial community diversity. ISME J. 2011;6:183–194. doi: 10.1038/ismej.2011.74. [DOI] [PMC free article] [PubMed] [Google Scholar]
- 9.Quail M.A., Smith M., Jackson D., Leonard S., Skelly T., Swerdlow H.P., Gu Y., Ellis P. SASI-Seq: sample assurance Spike-Ins, and highly differentiating 384 barcoding for Illumina sequencing. BMC Genomics. 2014;15:110–121. doi: 10.1186/1471-2164-15-110. [DOI] [PMC free article] [PubMed] [Google Scholar]
- 10.Hoffmann C., Minkah N., Leipzig J., Wang G., Arens M.Q., Tebas P., Bushman F.D. DNA bar coding and pyrosequencing to identify rare HIV drug resistance mutations. Nucleic Acids Res. 2007;35:e91. doi: 10.1093/nar/gkm435. [DOI] [PMC free article] [PubMed] [Google Scholar]
- 11.Meyer M., Kircher M. Illumina sequencing library preparation for highly multiplexed target capture and sequencing. Cold Spring Harb. Protoc. 2010;6 doi: 10.1101/pdb.prot5448. pdb-prot5448. [DOI] [PubMed] [Google Scholar]
- 12.Bartram A.K., Lynch M.D., Stearns J.C., Moreno-Hagelsieb G., Neufeld J.D. Generation of multimillion-sequence 16S rRNA gene libraries from complex microbial communities by assembling paired-end Illumina reads. Appl. Environ. Microbiol. 2011;77:3846–3852. doi: 10.1128/AEM.02772-10. [DOI] [PMC free article] [PubMed] [Google Scholar]
- 13.Bokulich N.A., Thorngate J.H., Richardson P.M., Mills D.A. Microbial biogeography of wine grapes is conditioned by cultivar, vintage, and climate. Proc. Natl. Acad. Sci. U.S.A. 2013;111:E139–E148. doi: 10.1073/pnas.1317377110. [DOI] [PMC free article] [PubMed] [Google Scholar]
- 14.Caporaso J.G., Lauber C.L., Walters W.A., Berg-Lyons D., Huntley J., Fierer N., Owens S.M., Betley J., Fraser L., Bauer M., et al. Ultra-high-throughput microbial community analysis on the Illumina HiSeq and MiSeq platforms. ISME J. 2012;6:1621–1624. doi: 10.1038/ismej.2012.8. [DOI] [PMC free article] [PubMed] [Google Scholar]
- 15.Clarke L.J., Czechowski P., Soubrier J., Stevens M.I., Cooper A. Modular tagging of amplicons using a single PCR for high-throughput sequencing. Mol. Ecol. Resour. 2014;14:117–121. doi: 10.1111/1755-0998.12162. [DOI] [PubMed] [Google Scholar]
- 16.Song S.J., Lauber C., Costello E.K., Lozupone C.A., Humphrey G., Berg-Lyons D., Caporaso G.J., Knights D., Clemente J.C., Nakielny S., et al. Cohabiting family members share microbiota with one another and with their dogs. ELife. 2013;2:e00458. doi: 10.7554/eLife.00458. [DOI] [PMC free article] [PubMed] [Google Scholar]
- 17.Berry D., Mahfoudh K.B., Wagner M., Loy A. Barcoded primers used in multiplex amplicon pyrosequencing bias amplification. Appl. Environ. Microbiol. 2011;77:7846–7849. doi: 10.1128/AEM.05220-11. [DOI] [PMC free article] [PubMed] [Google Scholar]
- 18.Schloss P.D., Westcott S.L. Assessing and improving methods used in operational taxonomic unit-based approaches for 16S rRNA gene sequence analysis. Appl. Environ. Microbiol. 2011;77:3219–3226. doi: 10.1128/AEM.02810-10. [DOI] [PMC free article] [PubMed] [Google Scholar]
- 19.Bokulich N.A., Subramanian S., Faith J.J., Gevers D., Gordon J.I., Knight R., Mills D.A., Caporaso J.G. Quality-filtering vastly improves diversity estimates from Illumina amplicon sequencing. Nat. Methods. 2012;10:57–59. doi: 10.1038/nmeth.2276. [DOI] [PMC free article] [PubMed] [Google Scholar]
- 20.Caporaso J.G., Lauber C.L., Walters W.A., Berg-Lyons D., Lozupone C.A., Turnbaugh P.J., Fierer N., Knight R. Global patterns of 16S rRNA diversity at a depth of millions of sequences per sample. Proc. Natl. Acad. Sci. U.S.A. 2011;108:4516–4522. doi: 10.1073/pnas.1000080107. [DOI] [PMC free article] [PubMed] [Google Scholar]
- 21.Pawlowski J., Esling P., Lejzerowicz F., Cedhagen T., Wilding T.A. Environmental monitoring through protist NGS metabarcoding: assessing the impact of fish farming on benthic foraminifera communities. Mol. Ecol. Resour. 2014;14:1129–1140. doi: 10.1111/1755-0998.12261. [DOI] [PubMed] [Google Scholar]
- 22.Preheim S.P., Perrotta A.R., Martin-Platero A.M., Gupta A., Alm E.J. Distribution-based clustering: using ecology to refine the operational taxonomic unit. Appl. Environ. Microbiol. 2013;79:6593–6603. doi: 10.1128/AEM.00342-13. [DOI] [PMC free article] [PubMed] [Google Scholar]
- 23.Morgan M.J., Chariton A.A., Hartley D.M., Hardy C.M. Improved inference of taxonomic richness from environmental DNA. PLoS One. 2013;8:e71974. doi: 10.1371/journal.pone.0071974. [DOI] [PMC free article] [PubMed] [Google Scholar]
- 24.Lecroq B., Gooday A.J., Cedhagen T., Sabbatini A., Pawlowski J. Molecular analyses reveal high levels of eukaryotic richness associated with enigmatic deep-sea protists (Komokiacea) Mar. Biodivers. 2009;39:45–55. [Google Scholar]
- 25.Lejzerowicz F., Pawlowski J., Fraissinet-Tachet L., Marmeisse R. Molecular evidence for widespread occurrence of Foraminifera in soils. Environ. Microbiol. 2010;12:2518–2526. doi: 10.1111/j.1462-2920.2010.02225.x. [DOI] [PubMed] [Google Scholar]
- 26.Pawlowski J., Fontaine D., da Silva A.A., Guiard J. Novel lineages of Southern Ocean deep-sea foraminifera revealed by environmental DNA sequencing. Deep Sea Res. Part II Top. Stud. Oceanogr. 2011;58:1996–2003. [Google Scholar]
- 27.Lejzerowicz F., Esling P., Majewski M., Szczuciński W., Decelle J., Obadia C., Martinez Arbizu P., Pawlowski J. Ancient DNA complements microfossil record in deep-sea subsurface sediments. Biol. Lett. 2013;9:e20130283. doi: 10.1098/rsbl.2013.0283. [DOI] [PMC free article] [PubMed] [Google Scholar]
- 28.Altschul S.F., Madden T.L., Schäffer A.A., Zhang J., Zhang Z., Miller W., Lipman D.J. Gapped BLAST and PSI-BLAST: a new generation of protein database search programs. Nucleic Acids Res. 1997;25:3389–3402. doi: 10.1093/nar/25.17.3389. [DOI] [PMC free article] [PubMed] [Google Scholar]
- 29.McKay B.D., Wanless I.M. On the number of Latin squares. Ann. Comb. 2005;9:335–344. [Google Scholar]
- 30.Guillou L., Bachar D., Audic S., Bass D., Berney C., Bittner L., Boutte C., Burgaud G., de Vargas C., Decelle J., et al. The protist ribosomal reference database (PR2): a catalog of unicellular eukaryote small sub-unit rRNA sequences with curated taxonomy. Nucleic Acids Res. 2013;41:D597–D604. doi: 10.1093/nar/gks1160. [DOI] [PMC free article] [PubMed] [Google Scholar]
- 31.Edgar R.C., Haas B.J., Clemente J.C., Quince C., Knight R. UCHIME improves sensitivity and speed of chimera detection. Bioinformatics. 2011;27:2194–2200. doi: 10.1093/bioinformatics/btr381. [DOI] [PMC free article] [PubMed] [Google Scholar]
- 32.Galan M., Guivier E., Caraux G., Charbonnel N., Cosson J.-F. A 454 multiplex sequencing method for rapid and reliable genotyping of highly polymorphic genes in large-scale studies. BMC Genomics. 2010;11:296–310. doi: 10.1186/1471-2164-11-296. [DOI] [PMC free article] [PubMed] [Google Scholar]
- 33.Kozich J.J., Westcott S.L., Baxter N.T., Highlander S.K., Schloss P.D. Development of a dual-index sequencing strategy and curation pipeline for analyzing amplicon sequence data on the MiSeq Illumina sequencing platform. Appl. Environ. Microbiol. 2013;79:5112–5120. doi: 10.1128/AEM.01043-13. [DOI] [PMC free article] [PubMed] [Google Scholar]
- 34.Fonseca V.G., Nichols B., Lallias D., Quince C., Carvalho G.R., Power D.M., Creer S. Sample richness and genetic diversity as drivers of chimera formation in nSSU metagenetic analyses. Nucleic Acids Res. 2012;40:e66. doi: 10.1093/nar/gks002. [DOI] [PMC free article] [PubMed] [Google Scholar]
- 35.Orsi W., Biddle J.F., Edgcomb V. Deep sequencing of subseafloor eukaryotic rRNA reveals active fungi across marine subsurface provinces. PLoS One. 2013;8:e56335. doi: 10.1371/journal.pone.0056335. [DOI] [PMC free article] [PubMed] [Google Scholar]
- 36.Logares R., Sunagawa S., Salazar G., Cornejo-Castillo F.M., Ferrera I., Sarmento H., Hingamp P., Ogata H., de Vargas C., Lima-Mendez G., et al. Metagenomic 16S rDNA Illumina tags are a powerful alternative to amplicon sequencing to explore diversity and structure of microbial communities. Environ. Microbiol. 2013 doi: 10.1111/1462-2920.12250. doi:10.1111/1462-2920.12250. [DOI] [PubMed] [Google Scholar]
- 37.Engelbrektson A., Kunin V., Wrighton K.C., Zvenigorodsky N., Chen F., Ochman H., Hugenholtz P. Experimental factors affecting PCR-based estimates of microbial species richness and evenness. ISME J. 2010;4:642–647. doi: 10.1038/ismej.2009.153. [DOI] [PubMed] [Google Scholar]
- 38.Schmidt P.A., Bálint M., Greshake B., Bandow C., Römbke J., Schmitt I. Illumina metabarcoding of a soil fungal community. Soil Biol. Biochem. 2013;65:128–132. [Google Scholar]
- 39.Lee C.K., Herbold C.W., Polson S.W., Wommack K.E., Williamson S.J., McDonald I.R., Cary S.C. Groundtruthing next-gen sequencing for microbial ecology–biases and errors in community structure estimates from PCR amplicon pyrosequencing. PLoS One. 2012;7:e44224. doi: 10.1371/journal.pone.0044224. [DOI] [PMC free article] [PubMed] [Google Scholar]
- 40.Adams R.I., Amend A.S., Taylor J.W., Bruns T.D. A unique signal distorts the perception of species richness and composition in high-throughput sequencing surveys of microbial communities: a case study of Fungi in indoor dust. Microb. Ecol. 2013;66:735–741. doi: 10.1007/s00248-013-0266-4. [DOI] [PMC free article] [PubMed] [Google Scholar]
- 41.Harris J.K., Sahl J.W., Castoe T.A., Wagner B.D., Pollock D.D., Spear J.R. Comparison of normalization methods for construction of large, multiplex amplicon pools for next-generation sequencing. Appl. Environ. Microbiol. 2010;76:3863–3868. doi: 10.1128/AEM.02585-09. [DOI] [PMC free article] [PubMed] [Google Scholar]
- 42.Robasky K., Lewis N.E., Church G.M. The role of replicates for error mitigation in next-generation sequencing. Nat. Rev. Genet. 2014;15:56–62. doi: 10.1038/nrg3655. [DOI] [PMC free article] [PubMed] [Google Scholar]
- 43.Gonzalez J.M., Portillo M.C., Belda-Ferre P., Mira A. Amplification by PCR artificially reduces the proportion of the rare biosphere in microbial communities. PLoS One. 2012;7:e29973. doi: 10.1371/journal.pone.0029973. [DOI] [PMC free article] [PubMed] [Google Scholar]
- 44.Zhan A., Hulak M., Sylvester F., Huang X., Adebayo A.A., Abbott C.L., Adamowicz S.J., Heath D.D., Cristescu M.E., MacIsaac H.J. High sensitivity of 454 pyrosequencing for detection of rare species in aquatic communities. Methods Ecol. Evol. 2013;4:558–565. [Google Scholar]
- 45.Egge E., Bittner L., Andersen T., Audic S., de Vargas C., Edvardsen B. 454 pyrosequencing to describe microbial eukaryotic community composition, diversity and relative abundance: a test for marine haptophytes. PLoS One. 2013;8:e74371. doi: 10.1371/journal.pone.0074371. [DOI] [PMC free article] [PubMed] [Google Scholar]
- 46.Zhou J., Wu L., Deng Y., Zhi X., Jiang Y.H., Tu Q., Xie J., Van Nostrand J.D., He Z., Yang Y. Reproducibility and quantitation of amplicon sequencing-based detection. ISME J. 2011;5:1303–1313. doi: 10.1038/ismej.2011.11. [DOI] [PMC free article] [PubMed] [Google Scholar]
- 47.Turnbaugh P.J., Quince C., Faith J.J., McHardy A.C., Yatsunenko T., Niazi F., Affourtit J., Egholmd M., Henrissate B., Knight R., Gordon J.I. Organismal, genetic, and transcriptional variation in the deeply sequenced gut microbiomes of identical twins. Proc. Natl. Acad. Sci. U.S.A. 2010;107:7503–7508. doi: 10.1073/pnas.1002355107. [DOI] [PMC free article] [PubMed] [Google Scholar]
- 48.Shokralla S., Gibson J.F., Nikbakht H., Janzen D.H., Hallwachs W., Hajibabaei M. Next-generation DNA barcoding: using next-generation sequencing to enhance and accelerate DNA barcode capture from single specimens. Mol. Ecol. Resour. 2014;14:892–901. doi: 10.1111/1755-0998.12236. [DOI] [PMC free article] [PubMed] [Google Scholar]
Associated Data
This section collects any data citations, data availability statements, or supplementary materials included in this article.