

Abstract
Epithelial to mesenchymal transition transcription factors (EMT-TFs) such as SNAI2 have been found to be expressed endogenously in epidermal stem and progenitor cells and downregulated upon differentiation. The presence of SNAI2 in progenitor cells is necessary to repress the expression of differentiation genes by binding directly to their promoters. SNAI2 is downregulated upon differentiation which allows expression of differentiation genes. Furthermore overexpression of SNAI2 can block the differentiation process suggesting that the levels of SNAI2 are crucial to epidermal cell fate decisions. To address on a genome wide level the genes that are impacted by changing the levels of SNAI2, we performed microarray analysis on SNAI2 knockdown and overexpressing epidermal progenitor cells. Here we provide detailed methods and analysis on these microarray data which has been deposited in Gene Expression Omnibus (GEO): GSE55269.
Keywords: Microarrays, Transcriptional profiling, Epidermis, SNAI2, SLUG, Gene expression
| Specifications | |
|---|---|
| Organism/cell line/tissue | Homo sapiens/primary human neonatal keratinocytes from foreskin |
| Sex | Male |
| Sequencer or array type | Affymetrix Human Genome U133 Plus 2.0 Array |
| Data format | Raw and processed |
| Experimental factors | Primary human keratinocytes knocked down or overexpressing SNAI2 compared to control shRNA or LACZ overexpressing retroviral vectors. |
| Experimental features | We performed microarray analysis on control and SNAI2 knockdown cells to determine differentially expressed genes. Furthermore we also performed the same analysis on control LACZ overexpressing and SNAI2 overexpressing cells to determine gene expression changes with increased SNAI2 levels. |
| Consent | N/A |
| Sample source location | La Jolla, CA, USA |
Direct link to deposited data
The deposited data can be found at: http://www.ncbi.nlm.nih.gov/geo/query/acc.cgi?acc=GSE55269.
Experimental design, materials and methods
Tissue culture
Primary human neonatal keratinocytes were derived from newborn foreskin as previously described [1], [2]. Alternatively keratinocytes can also be purchased from a variety of vendors including Cell Applications, Lonza, and ATCC. Cells were cultured in KCSFM (Life Technologies) supplemented with bovine pituitary extract (BPE) and epidermal growth factor (EGF). Amphotropic phoenix cells (ATCC) were cultured in 10% fetal calf serum in DMEM.
Retroviral gene transfer
3 μg of each retroviral construct (overexpression or knockdown) was transfected (Fugene 6) into phoenix cells plated on 6 well plates. Viral supernatants were collected 48 h after transfection and placed on keratinocytes. Polybrene (5 μg/ml) was added and cells were spun for 1 h at 1000 rpm. After spinning, the cells were washed once in 1 × PBS and then replaced with KCSFM. Cells were transduced a total of two times on consecutive days [3]. Cells were transferred to a larger dish a day following the last transduction. Puromycin (2 μg/ml) was added to cells transduced with the pSuper Retro vector to express shRNAs targeting SNAI2 or control [4], [5]. No puromycin was added to cells transduced with the LZRS retroviral vector to overexpress control (LACZ) or SNAI2 [5].
RNA isolation
Total RNA was isolated from cells expressing control shRNAs and shRNAs to knockdown SNAI2. RNA was also harvested from control LACZ and SNAI2 overexpressing cells. Cells were harvested 7 days post-transduction using the GeneJet RNA purification kit (Thermo Scientific). RNA quality and quantity were determined by using a NanoDrop 2000 (Thermo Scientific). One microgram of total RNA was reverse transcribed and quantitative PCR was performed to confirm microarray results. Samples were normalized to GAPDH.
Microarray and gene expression analysis
Microarray analysis was performed on biological duplicate samples. Labeling of cDNA and hybridization to Affymetrix HG-U133 2.0 plus arrays were performed at the University of California, San Diego's Gene Chip Core Facility. The samples included: 1) GSM1333055, keratinocytes with control shRNA replicate 1, 2) GSM1333056, keratinocytes with control shRNA replicate 2, 3) GSM1333057, keratinocytes with SNAI2 shRNA replicate 1, 4) GSM1333058, keratinocytes with SNAI2 shRNA replicate 2, 5) GSM1333059, keratinocytes overexpressing LACZ control replicate 1, 6) GSM1333060, keratinocytes overexpressing LACZ control replicate 2, 7) GSM1333061, keratinocytes overexpressing SNAI2 replicate 1, and 8) GSM1333062, keratinocytes overexpressing SNAI2 replicate 2. All samples were normalized through the Robust Multi-array Average (RMA) which utilizes a correction method based on the distribution of perfect match values among the probes through median polish [6], [7]. Differentially expressed genes were identified using significance analysis of microarrays 3.0 with a false discovery rate of less than 5%, an average fold change of ≥ 2 in any group, and an average raw expression of ≥ 100 in any group [8].
R workflow for differential gene expression analysis
Below is a detailed workflow for RMA normalization as well as determining differentially expressed genes using the parameters stated in “Microarray and gene expression analysis” written in R.
-
Step 1.
Normalization
library(affy)
library(siggenes)
library(samr)
library(annotate)
library(hgu133plus2.db)
library(gplots)
get.gene<-function(row)
row<-unlist(row)
genename<-get(row[1], hgu133plus2SYMBOL)
return (genename)
ttest.row<-function(row)
row<-unlist(row)
y=row[1:2]
y=unlist(y)
n=row[3:4]
pvalue=t.test(y,n)$p.value
return (pvalue)
meanY.row<-function(row)
row<-unlist(row)
y=row[1:2]
y=unlist(y)
n=row[3:4]
meanY = mean(y)
return (meanY)
meanN.row<-function(row)
row<-unlist(row)
y=row[1:2]
y=unlist(y)
n=row[3:4]
meanN = mean(n)
return (meanN)
stdY.row<-function(row)
row<-unlist(row)
y=row[1:2]
y=unlist(y)
n=row[3:4]
stdY = sd(y)
return (stdY)
stdN.row<-function(row)
row<-unlist(row)
y=row[1:2]
y=unlist(y)
n=row[3:4]
stdN = sd(n)
return (stdN)
mean_gene_value<-function(col){
col<-unlist(col)
col<-as.numeric(col)
mean_value<-tapply(col, wholegenelistf, mean)
return (mean_value)
setwd(“/Users/gsen/Desktop/ConZNF2”) This is where your files are stored on your desktop
normdata<-justRMA()
write.exprs(normdata,file =“normalized.txt”,sep = “\t”)
a<-read.delim(“normalized.txt”, header=T, sep =“\t”, as.is=T)
colnames(a)[1]=“AffyID”
aa<-a[,2:ncol(a)]
meanYlist<-apply(aa, 1, meanY.row)
meanNlist<-apply(aa, 1, meanN.row)
aa=cbind(aa, meanYlist)
colnames(aa)[ncol(aa)]=“meanY”
aa=cbind(aa, meanNlist)
colnames(aa)[ncol(aa)]=“meanN”
aa=cbind(a[,1], aa)
colnames(aa)[1]=“AffyID”
# delete low response probes
aa<-aa[((aa$meanY>6.64)|(aa$meanN>6.64)),]
aa$meanY<-NULL
aa$meanN<-NULL
write.table(aa,file =“normalized.txt”,sep =“\t”,row.names=FALSE, quote=FALSE)
-
Step 2.
SAM analysis
a<-read.delim(“normalized.txt”, header=T, sep =“\t”, as.is=T)
aa<-a[,2:ncol(a)]
colnames(aa)[1]=“1”
colnames(aa)[2]=“1”
colnames(aa)[3]=“2”
colnames(aa)[4]=“2”
aa<-as.matrix(aa)
yy<-colnames(aa)[1:4]
AffyID<-a[,1]
data=list(x=aa,y=yy, geneid=AffyID, logged2=TRUE)
#data=list(x=aa,y=yy,geneid=as.character(1:nrow(x)),genenames=paste(“g”,as.character(1:nrow(x)), logged2=TRUE)
samr.obj<-samr(data, resp.type =“Two class unpaired”, nperms=100)
delta.table<-samr.compute.delta.table(samr.obj,nvals=100)
delta.table
# decide delta value from delta.table so that the FDR is less than 5%
delta = 0.319
fdc = 2
# only if you want to see the plot
samr.plot(samr.obj,delta, min.foldchange=fdc)
siggenes.table<-samr.compute.siggenes.table(samr.obj, delta, data, delta.table, min.foldchange=fdc, all.genes=FALSE, compute.localfdr=FALSE)
#check out the table to see how many genes are up and how many down
#siggenes.table$ngenes.up
#siggenes.table$ngenes.lo
siggenes<-siggenes.table$genes.up
siggenes<-rbind(siggenes, siggenes.table$genes.lo)
siggenes<-data.frame(siggenes)
write.table(siggenes,file =“sigprobes.txt”,sep =“\t”,row.names=FALSE, quote=FALSE)
siggenes<-read.delim(file =“sigprobes.txt”,sep =“\t”, header=T, as.is=T)
siggenes.allinfo<-a[(siggenes$Row-1),]
siggenes.allinfo<-cbind(siggenes.allinfo, siggenes$Fold.Change)
colnames(siggenes.allinfo)[ncol(siggenes.allinfo)] = “Fold.Change”
write.table(siggenes.allinfo,file =“sigprobes.txt”,sep =“\t”,row.names=FALSE, quote=FALSE)
con.test<-siggenes.allinfo
con.test$Fold.Change=log(con.test$Fold.Change)/log(2)
wholelist<-apply(con.test,1,get.gene)
con.test<-cbind(wholelist, con.test)
#con.test[,1]=wholelist
colnames(con.test)[1] = “GeneID”
dim(con.test)
write.table(con.test,file =“sigprobes.txt”,sep =“\t”,row.names=FALSE, quote=FALSE)
con.test.gene<-con.test[!apply(is.na(con.test), 1, any),]
wholegenelist<-con.test.gene[,1]
wholegenelistf<-factor(wholegenelist)
# if you want to use mean of all probes for same gene
con.test.meangene<-apply(con.test.gene[,3:6],2,mean_gene_value)
write.table(con.test.meangene,file =“siggenes.txt”,sep =“\t”,row.names=TRUE, quote=FALSE)
dim(con.test.meangene)
Assessment of microarray data
After normalization and SAM analysis with two fold change to identify differentially expressed genes a Samr plot can be used to determine the quality of the data set. Fig. 1 shows the differentially expressed genes between SNAI2 knockdown and control cells. In red are genes upregulated and in green are genes downregulated upon SNAI2 knockdown.
Fig. 1.

Plot showing genes that are differentially expressed between SNAI2 knockdown and control samples after RMA normalization and analysis for differential gene expression using SAM and greater than or equal to two fold change.
Validation of microarray data by qRT-PCR
In order to validate the microarray data, qRT-PCR was performed on identified differentially expressed genes. These genes included differentiation induced transcripts such as IVL, TGM1, SPRR1A, and GRHL3 which were upregulated in SNAI2 knockdown cells (Fig. 2).
Fig. 2.
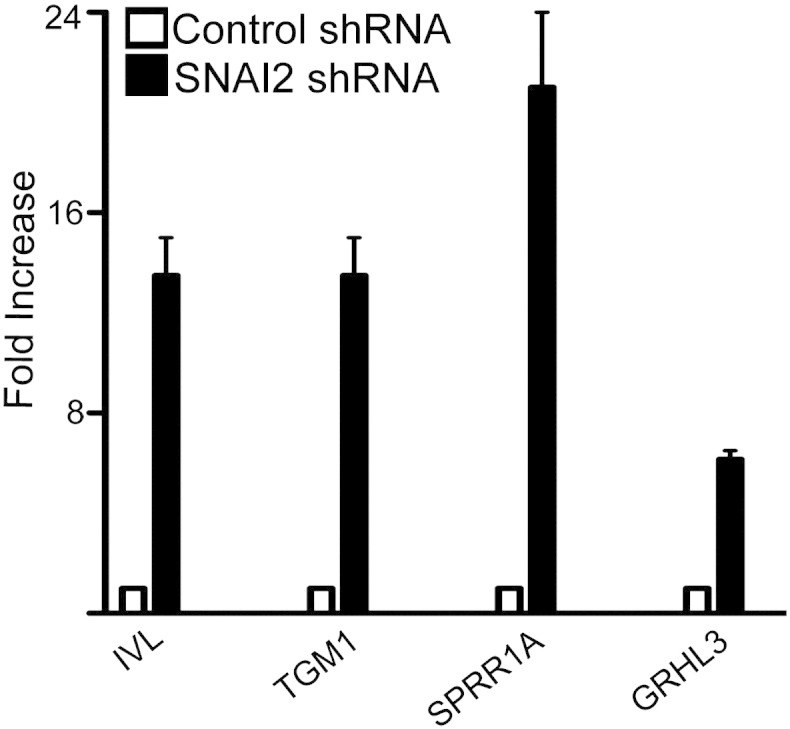
Validation of microarray data set. qRT-PCR was performed on control and SNAI2 knockdown cells for genes identified as being upregulated on the microarray after SNAI2 depletion. Samples were normalized to GAPDH expression levels. Error bars = SD and n = 3.
Discussion
We describe here a data set containing the effects of differing levels of SNAI2 on epidermal cell fate choices. This includes microarray data with loss and gain of SNAI2 expression. Furthermore we also provide the R code for analysis of this data set or other data sets using the Affymetrix U133 Plus 2.0 arrays. This analysis uses Robust Multi-array Average normalization as well as Significance Analysis of Microarrays to identify differentially expressed genes. With loss of SNAI2, epidermal progenitor cells prematurely expressed differentiation genes. In contrast gain of SNAI2 expression inhibited baseline differentiation expression. These data suggest that SNAI2 is critical for epidermal progenitor function [5].
Conflict of interest
The authors declare no conflict of interests.
Acknowledgments
This work is supported by the American Cancer Society Research Scholars Grant (RSG-12-148-01-DDC) to G.L. Sen and the UCSD Dermatologist Investigator Training Program (1T32-AR062497-01) to D.S. Mistry.
References
- 1.Sen G.L. DNMT1 maintains progenitor function in self-renewing somatic tissue. Nature. 2010;463(7280):563–567. doi: 10.1038/nature08683. [DOI] [PMC free article] [PubMed] [Google Scholar]
- 2.Mistry D.S., Chen Y., Sen G.L. Progenitor function in self-renewing human epidermis is maintained by the exosome. Cell Stem Cell. 2012;11(1):127–135. doi: 10.1016/j.stem.2012.04.022. [DOI] [PMC free article] [PubMed] [Google Scholar]
- 3.Chen Y., Mistry D.S., Sen G.L. Highly rapid and efficient conversion of human fibroblasts to keratinocyte-like cells. J. Investig. Dermatol. 2014;134(2):335–344. doi: 10.1038/jid.2013.327. [DOI] [PMC free article] [PubMed] [Google Scholar]
- 4.Sen G. Restriction enzyme-generated siRNA (REGS) vectors and libraries. Nat. Genet. 2004;36(2):183–189. doi: 10.1038/ng1288. [DOI] [PubMed] [Google Scholar]
- 5.Mistry D.S. SNAI2 controls the undifferentiated state of human epidermal progenitor cells. Stem Cells. 2014;32(12):3209–3218. doi: 10.1002/stem.1809. [DOI] [PMC free article] [PubMed] [Google Scholar]
- 6.Bolstad B.M. A comparison of normalization methods for high density oligonucleotide array data based on variance and bias. Bioinformatics. 2003;19(2):185–193. doi: 10.1093/bioinformatics/19.2.185. [DOI] [PubMed] [Google Scholar]
- 7.Irizarry R.A. Exploration, normalization, and summaries of high density oligonucleotide array probe level data. Biostatistics. 2003;4(2):249–264. doi: 10.1093/biostatistics/4.2.249. [DOI] [PubMed] [Google Scholar]
- 8.Tusher V.G., Tibshirani R., Chu G. Significance analysis of microarrays applied to the ionizing radiation response. Proc. Natl. Acad. Sci. U. S. A. 2001;98(9):5116–5121. doi: 10.1073/pnas.091062498. [DOI] [PMC free article] [PubMed] [Google Scholar]