Abstract
Reports of molecular and cellular imaging using computed tomography (CT) are rapidly increasing. Many of these reports use gold nanoparticles. Bismuth has similar CT contrast properties to gold while being approximately 1000-fold less expensive. Herein we report the design, fabrication, characterization, and CT and fluorescence imaging properties of a novel, dual modality, fluorescent, polymer encapsulated bismuth nanoparticle construct for computed tomography and fluorescence imaging. We also report on cellular internalization and preliminary in vitro and in vivo toxicity effects of these constructs. 40 nm bismuth(0) nanocrystals were synthesized and encapsulated within 120 nm Poly(DL-lactic-co-glycolic acid) (PLGA) nanoparticles by oil-in-water emulsion methodologies. Coumarin-6 was co-encapsulated to impart fluorescence. High encapsulation efficiency was achieved ∼ 70% bismuth w/w. Particles were shown to internalize within cells following incubation in culture. Bismuth nanocrystals and PLGA encapsulated bismuth nanoparticles exhibited >90% and >70% degradation, respectively, within 24 hours in acidic, lysosomal environment mimicking media and both remained nearly 100% stable in cytosolic/extracellular fluid mimicking media. μCT and clinical CT imaging was performed at multiple X-ray tube voltages to measure concentration dependent attenuation rates as well as to establish the ability to detect the nanoparticles in an ex vivo biological sample. Dual fluorescence and CT imaging is demonstrated as well. In vivo toxicity studies in rats revealed neither clinically apparent side effects nor major alterations in serum chemistry and hematology parameters. Calculations on minimal detection requirements for in vivo targeted imaging using these nanoparticles are presented. Indeed, our results indicate that these nanoparticles may serve as a platform for sensitive and specific targeted molecular CT and fluorescence imaging.
Keywords: bismuth, computed tomography, nanoparticle, fluorescence imaging, Poly(DL-lactic-co-glycolic acid)
Introduction
High atomic number (Z) metal nanocrystals are recognized for their potential to move computed tomography (CT) from a mostly structural imaging paradigm into a molecular imaging modality1-4, particularly if coupled with emerging spectral CT methodologies5-8. The field is reviewed in Cormode, et al9. Gold nanoparticles (Z = 79, k-edge = 80.7 keV) are the most well developed nanoparticle platform, however the cost of gold may be prohibitive for widespread use. Bismuth nanoparticles (Z = 83, k-edge = 90.5 keV) are a cost effective alternative with potentially equal CT contrast/biocompatibility to gold. Further, bismuth compounds are biodegradable and biocompatible with a long history in biomedicine.
To date, most investigations centering on the use of bismuth for nanoparticulate CT agents have used Bi2S3 as the payload, formulating hydrophilic nanoparticles by using surfactant-based coatings10, 11. While excellent size control of nanocrystals has recently been reported12, one disadvantage of Bi2S3 is the reduction in the mass percent of bismuth in the formula unit to 80%. Furthermore, the density of Bi2S3 is 6.78 g/ml while that of pure bismuth is 9.78 g/ml, a 31% decrease. Combining these two percentages (80% × 69%) yields 55% decrease in the concentration of bismuth in Bi2S3 versus elemental bismuth. An alternative formulation has incorporated organometallic bismuth neodecanoate complexes into nanoemulsions, again resulting in a relatively low bismuth loading density13. A third nanoparticle formulation has incorporated ∼ 20 nm elemental bismuth nanocrystals within 130 nm dextran particles14. This packing is similar to ferumoxides, an iron oxide nanoparticle for MRI, and inefficiently packages bismuth by volume, with the bismuth payload forming only 0.3% of the total volume.
CT suffers from inherently poor sensitivity, with minimal detection concentrations in the millimolar range15. As such, to facilitate molecular and cellular CT, a premium must be placed on efficient delivery and packaging of CT dense contrast material. Herein we describe the design, synthesis, characterization, and ex vivo CT and fluorescence imaging of novel fluorescent, Poly(DL-lactic-co-glycolic acid) (PLGA) encapsulated bismuth nanoparticles for dual CT/fluorescence applications. These particles build on previously reported technology that has been used to form PLGA encapsulated iron oxide16, 17, manganese oxide18 and gadolinium oxide nanoparticles19. This platform has been shown to incorporate high payloads of inorganic nanocrystals via a facile oil-in-water emulsion approach. The major innovations in the use of bismuth-based CT nanoparticles are: 1) the use of elemental bismuth nanocrystals for higher contrast density, rather than Bi2S3, 2) the encapsulation of nanocrystals within an FDA approved polymer, 3) very simple and scalable encapsulation process, and 4) high encapsulation efficiency, resulting in high weight percent of internalized bismuth.
Materials and Methods
Bismuth Nanocrystal Synthesis
Bismuth nanocrystals were synthesized according to Son, et al12. Briefly, 3.6 grams (5 mmol) of bismuth neodecanoate (Sigma-Aldrich St. Louis, MO, USA) was combined with 25 mL of 1-octadecene (Sigma-Aldrich St. Louis, MO, USA). The mixture was then heated to 120 °C under a N2 atmosphere for 2 hours to remove water and dissolved oxygen. The mixture was then cooled to 80 °C with continuous stirring. 1.2 mL of 1-dodecanethiol (DDT) (Sigma-Aldrich St. Louis, MO, USA) was then added and the mixture was kept at 80 °C for 5 minutes. The addition of DDT caused the solution to change from colorless to yellow, indicating the formation of the bismuth dodecanethiolate complex. Next, 5 mL of tri-octylphosphine (Alfa Aesar, Heysham, England) was injected, causing the yellow solution to turn black. The reaction was then cooled and maintained at its growing temperature of 60 °C for 30 minutes with continuous stirring. The nanocrystals formed were then precipitated with a 10:1 (v/v) mixture of acetone/tetrahydrofuran (THF), and retrieved by centrifugation (17,000 g × 10 minutes) and washed several times with 10:1 (v/v) acetone/THF.
Bismuth Nanocrystal Characterization
X-ray diffraction patterns (D8 Advance diffractometer, Bruker Corporation, Billerica, MA) were matched with library of diffraction patterns to determine molecular identity as bismuth(0)12, 20. Fourier transform infrared spectroscopy (FTIR) was performed on a Mattson Genesis 3025 FTIR spectrometer to verify that DDT was present on the bismuth nanocrystals. Nanocrystals were imaged with transmission electron microscopy (TEM) using a JEOL 2200FS Transmission Electron Microscope (JEOL Ltd, Tokyo, Japan). Nanocrystal size (average +/- SD) was determined by ImageJ (http://rsbweb.nih.gov/ij/) analysis of TEM images.
Nanocrystal Encapsulation in PLGA nanoparticles
Prior to encapsulation, bismuth nanocrystals were incubated at room temperature in oleic acid for 24 hours (1 mL oleic acid per 200 mg bismuth). Nanocrystals were then washed twice with 2 ml ethanol to remove excess oleic acid.
The PLGA encapsulation method was based on that reported by Granot, et al16. A stock solution of Poly(DL-lactic-co-glycolic acid) (PLGA) was made by dissolving 1 gram of PLGA in 20 mL dichloromethane (DCM) overnight. Separate solutions of 5% (5 g in 100 mL) and 0.3% (0.3 g in 100 mL) polyvinyl alcohol (PVA) in deionized water were prepared.
To fabricate particles, 2 mL PLGA polymer solution was first placed in a small test tube. Between 10-200 mg of nanocrystals were then added along with 500 μL of a 2 mg/mL DCM solution of coumarin-6 to enable fluorescent labeling. The mixture was then bath sonicated and vortexed to disperse the nanocrystals. The organic mixture was then added drop-wise to 4 mL 5% PVA solution while vortexing at high speed. The mixture was then vortexed for an additional 10 seconds. The test tube was then tip sonicated three times at 40% amplitude for ten seconds each time to create an oil-in-water emulsion. The test tube was placed in an ice bath between each sonication. After the third tip sonication, the tube's contents were poured into a 60 mL 0.3% PVA solution. The mixture was then stirred with an overhead stirrer for 3 hours to allow nanoparticle formation and DCM evaporation. The nanoparticles were washed 3 times with 20 mL portions of deionized water and collected by centrifugation (17,000 g for 10 minutes). The nanoparticles were then re-suspended in 1 mL deionized water, flash frozen in liquid N2, and lyophilized.
Nanoparticle Characterization
Nanoparticle formation was analyzed and diameter was measured (average +/- SD) by scanning electron microscopy (SEM) using an AURIGA® CrossBeam Dual Column SEM-FIB Workstation (Carl Zeiss, Jena, Germany). Bismuth content and encapsulation efficiency was determined by thermogravimetric analysis (TGA) using a Q500 TGA from TA instruments (New Castle, DE). TEM was performed to determine spatial localization of bismuth nanocrystals within the PLGA particle.
Nanocrystal Dissolution
The dissolution of bare bismuth nanocrystals and bismuth nanocrystals in PLGA nanoparticles was assessed using inductively coupled plasma optical emission spectrometry (Varian, 710-ES ICP-OES). To determine the rate at which bismuth dissolves into phosphate buffer saline (PBS) and sodium citrate, 10 mg of bismuth nanocrystals or 15 mg of particles containing 66% w/w bismuth were suspended in either 1 mL of PBS or 1 mL of sodium citrate (pH 5.5). Microcentrifuge tubes containing the 4 mixtures were sonicated and then maintained on a rotary shaker at 36 °C. The tubes were centrifuged briefly to collect the supernatant sample and the remaining pellet was then resuspended in fresh solution prior to being returned to the oven. Supernatant was collected from samples at 1, 4, 9, 18, and 24 hrs on the first day, every 24 hrs for 2 weeks, and subsequently every week for the remainder of the experiment. After the supernatant for all the desired time points had been collected, all the samples were dried using a heating block and then 1 mL of concentrated nitric acid (69% HNO3) was added to each dried sample. After 48 hrs, samples were diluted with ultrapure water to a final concentration of 2% HNO3 and then each sample was analyzed in triplicate using ICP-OES.
Cell Labeling and In Vitro Toxicity
For all in vitro assays, STO mouse fibroblasts (ATCC) were maintained in Dulbecco's modified Eagle medium (DMEM) supplemented with 10% fetal bovine serum at 37°C and 5% CO2. All cell culture materials are from Life Technologies.
For the cell proliferation assay, STO cells were plated at 100,000 per well in a 24-well plate and allowed to adhere overnight. PLGA encapsulated bismuth nanoparticles were suspended in media at 1 mg Bi/mL, sonicated, and 10-fold dilutions in media were made down to 0.1 μg/mL. 500 μL of nanoparticle solution was added to each well. Controls received fresh media only. After 2 days of co-incubation, the nanoparticle solution was removed and replaced with a mixture of 400 μL media and 40 μL of MTT powder (1-(4,5-Dimethylthiazol-2-yl)-3,5-diphenylformazan, Sigma) at 5 mg/mL in PBS. 2 hours later, the media was aspirated and 1 mL of dimethylsulfoxide (DMSO, Fisher) was added to each well. 50 μL was immediately transferred to a 96-well plate and absorbance was measured at 560 nm using a plate reader (SpectraMax 190, Molecular Devices). The absorbance of DMSO-only wells was used to establish a baseline. For each experiment, 3 wells were tested per concentration of bismuth, and the experiment was repeated twice. The optical density measurements were normalized to that of the wells containing cells that were not exposed to the PLGA encapsulated bismuth nanoparticles.
To measure apoptosis and cell viability after incubation with PLGA encapsulated bismuth nanoparticles, a flow cytometry assay was used (Pacific Blue annexin V apoptosis detection kit with 7-AAD, BioLegend). STO cells were plated and allowed to adhere overnight. The next day, PLGA encapsulated bismuth nanoparticles were suspended in PBS containing 0.01% poly-L-lysine (PLL) (poly-L-lysine hydrobromide, Sigma), bath sonicated, then added to the cells at 5, 50 or 150 pg/cell for 24 hours. Cells were harvested by trypsinization and stained with annexin V and 7AAD according to the manufacturer's protocol. Cell samples were analyzed on a BD LSR II flow cytometer using FACSDiva software (Becton Dickson). Results were visualized using FlowJo vX software (TreeStar).
For the TEM, cells were plated and allowed to adhere overnight. PLGA encapsulated bismuth nanoparticles were suspended in PBS containing 0.01% PLL and added to the cells at 25 and 200 pg/cell for 24 hours. The cells were harvested by trypsinization and washed thrice in HBSS, then fixed in a mixture of 2.5% glutaraldehyde + 2.5 % paraformaldehyde in 0.1 M cacodylate buffer at 4°C for 24 hours, postfixed in 1% osmium tetroxide and dehydrated in a graded acetone series. Samples were infiltrated and embedded in Spurr resin (Polysciences). Thin sections (70 nm) were obtained with a PTXL ultramicrotome (RMC, Boeckeler Instruments, Tucson, AZ) on 200 mesh copper grids stained with uranyl acetate and lead citrate. Sections were imaged using a JEOL 100CX Transmission Electron Microscope at a 100kV accelerating voltage.
In Vivo Toxicity
18 male Sprague-Dawley rats, weighing approximately 250-300g each, were acclimated to the laboratory environment for at least 1 week, then injected IV or IP with PLGA encapsulated bismuth nanoparticles at 0, 2 or 20 mg Bi/kg of Bi NP (6 groups, 3 rats per group) at a volume of 5 ml/kg. Animals were anesthetized with isoflurane at 24 hours post-dosing and again on Study Day 8 for blood collection. Blood was collected into EDTA and serum tubes for biochemistry and hematology panels. Following the final blood collection on Day 8, all animals were euthanized, and the kidneys, liver, lungs, and spleen were collected, weighed, and preserved in 10% buffered formalin. One animal per group was selected for histopathological analysis and processed for paraffin sectioning, H&E staining and examination by a trained pathologist.
Within group differences were assessed using a one-way ANOVA with post-hoc comparisons to the vehicle group (Group 1 or 2) of the same dosing route using Dunnett's procedure to correct for multiple comparisons (GraphPad Prism 5.03). In cases where insufficient data were available for one-way ANOVA assessment, but the vehicle group and one or more dose groups could be analyzed, two-tailed paired or unpaired t-tests were used to evaluate within-group differences. Parameters are reported as group mean ±SE. In all cases, a p-value of <0.05 was considered significant.
In Vitro and Ex Vivo Sample Preparation for μCT and Clinical CT
In vitro samples of PLGA encapsulated bismuth nanoparticles containing 0, 14, 46, 64, and 143 mM bismuth were prepared in 200μL of 0.5% agarose.
A 90 mM bismuth suspension was prepared using 10.2 mg PLGA encapsulated bismuth nanoparticles (63% w/w bismuth from TGA) in 340μL of di H2O for ex vivo imaging in chicken wing forearm. Using a one mL syringe in combination with 26 gauge ½ inch needle, the 90 mM suspension of nanoparticles was injected slowly over the course of 1 minute between the radius and the ulna of a chicken wing forearm. After the injection was complete, the needle was allowed to rest in the injection site for an additional minute prior to removal.
μCT and Clinical CT
In vitro and ex vivo imaging was performed using both μCT and clinical CT scanners, guided using parameters described by Galper, et al15. μCT scans were performed on a GE eXplore Locus μCT Scanner (GE, Waukesha, Wisconsin) with a tube voltage of 80 kV and 450 μA, while clinical CT scans were performed on a GE Discovery 750 HD CT scanner (GE, Waukesha, Wisconsin) with tube voltages of 80, 100, 120, and 140 kV and 100 mA. Regions of interest were drawn within areas of contrast following calibration to Hounsfield units.
Ex Vivo Fluorescent Imaging and μCT
∼50 μg of PLGA encapsulated bismuth fluorescence particles was delivered into chicken meat. Ex vivo fluorescent imaging was performed with IVIS Spectrum (Perkin Elmer, Waltham, MA) using a 430 nm excitation filter, 530 nm emission filter and automatic exposure and f stop settings. μCT scans were performed as above.
Results
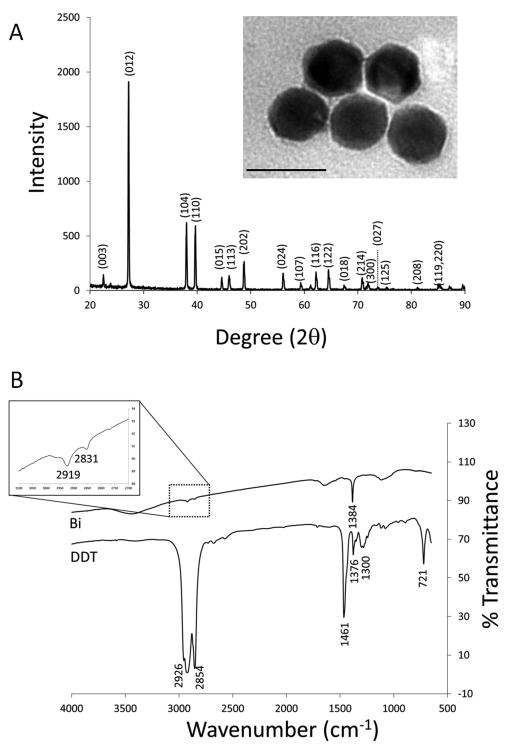
Bismuth(0) nanocrystals were synthesized by reduction of bismuth dodecanthiolate12. The average nanocrystal diameter as determined by TEM was 38.0 ± 7.1 nm (Figure 1A). We found that temperature control was the single most important parameter in maintaining uniform crystal size as reported in Son, et al12. XRD confirmed that the nanocrystals were composed of elemental bismuth (Figure 1A), as opposed to a bismuth salt. FTIR confirmed that dodecanethiol (DDT) coated the nanocrystals by the presence of peaks at wavenumbers of 2831 and 2919 cm-1 (Figure 1B).
Figure 1.
(A) XRD analysis of bismuth nanocrystal product. Inset: TEM image of bismuth nanocrystals. Average diameter: 38.0 ± 7.1 nm. Scale bar is 50 nm. (B) FTIR analysis of bismuth nanocrystals and a reference sample of DDT. Inset: expansion of peaks at wavenumbers of 2919 and 2831 cm-1.
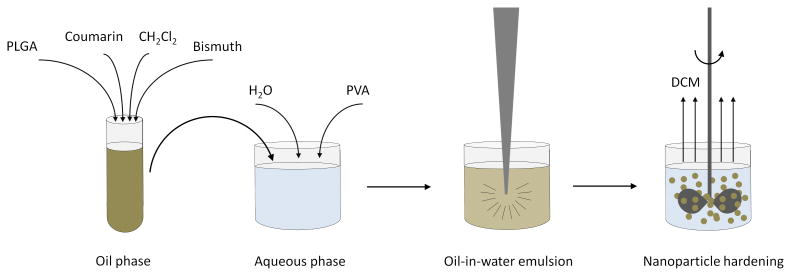
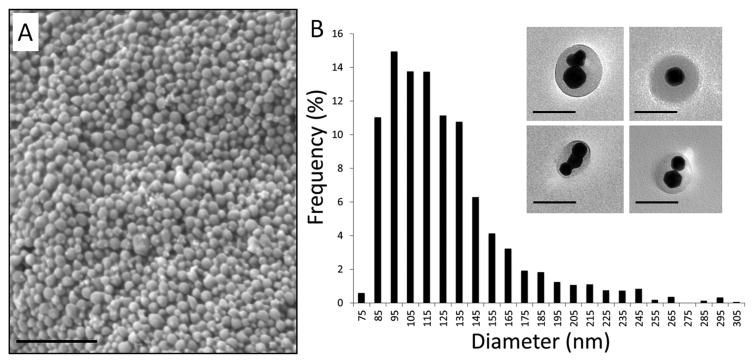
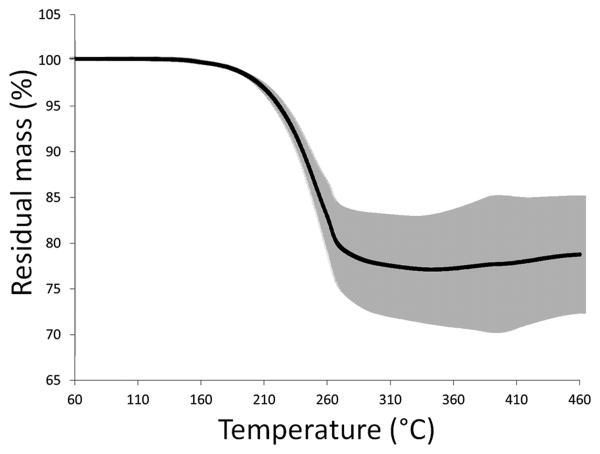
Bismuth nanocrystals and coumarin-6 were co-encapsulated into PLGA nanoparticles by a simple oil-in-water emulsion approach, as shown schematically in Figure 2. The formation of PLGA nanoparticles was confirmed by SEM (Figure 3A) and the nanoparticles were determined to have an average diameter of 120.4 ± 37.0 nm. TEM confirmed that bismuth nanocrystals were encapsulated within the core of the PLGA nanoparticles, rather than at or near the surface (Figure 3B). Different nanoparticle formulations were determined to contain ∼ 60-80% w/w bismuth by TGA analysis, with Figure 4 showing a thermogram for a sample with 78.0 ± 6.9% bismuth w/w. Initial experiments found that DDT coated bismuth nanocrystals did not incorporate at all within PLGA without preincubation in oleic acid. FTIR analysis (data not shown) indicates that oleic acid does not adsorb to the surface of the nanocrystal, as the sharp carbonyl peak of the acid group remains following washing with ethanol. Adsorption would result in the disappearance of this carbonyl peak and the appearance of two C-O-O stretches. In this synthetic approach, we hypothesize that oleic acid acts as a surfactant. The requirement of an excipient for successful encapsulation of bismuth is similar to Mieszawska, et al21, where elemental gold nanocrystals coated with DDT were challenging to incorporate within PLGA. In that case, they used a covalent binding strategy to overcome the issue. Fluorescence spectra indicate no spectral shift in the wavelength of coumarin-6 following incorporation into nanoparticles.
Figure 2.
Schematic illustration of fabrication scheme for fluorescent, PLGA encapsulated bismuth nanocrystals. Coumarin and bismuth nanocrystals, along with PLGA, are dissolved in dichloromethane. This oil phase is added to the aqueous phase, comprised of 5% PVA. An oil-in-water emulsion is formed by tip sonication. Mechanical stirring for three hours allows dichloromethane to evaporate, generating hardened PLGA nanoparticles encapsulating both coumarin and bismuth nanocrystals.
Figure 3.
(A) SEM image of bismuth containing nanoparticles with average size of 120.4 ± 37.0 nm. Scale bar is 1 micron. (B) Bismuth nanoparticle diameter distribution. Inset: TEM images of bismuth nanocrystal containing nanoparticles. Scale bar is 100 nm.
Figure 4.
Averaged thermograms with standard deviations for bismuth nanocrystal containing PLGA nanoparticles (n=4). Bismuth content of the nanoparticles was determined to be 78% w/w.
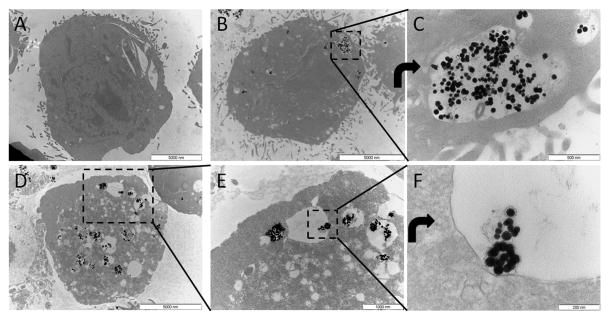
As expected, following incubation of STO fibroblasts with particles in culture, particles were internalized into endo/lysosomes. Figure 5 shows TEM of control cells (Figure 5A) and labeled cells (Figure 5B-F), with Figure 5B&C showing labeling from 25 pg Bi/cell labeling condition and Figure 5D-F showing labeling from 200 pg Bi/cell labeling condition. In labeled cells, black nanocrystals can be seen within fluid-filled endo/lysosomal compartments with the number of labeled compartments increasing with labeling dose.
Figure 5.
Transmission electron microscopy of A) unlabeled cell, B&C) cell labeled with 25 pg Bi/cell, D-F) cell labeled with 200 pg Bi/cell. C is a rotated zoom of boxed region in B. E is an zoom of boxed region in D. F is a rotated zoom of boxed region in E. Still intact PLGA encapsulated bismuth nanoparticles can potentially be seen in the endo/lysosome in F.
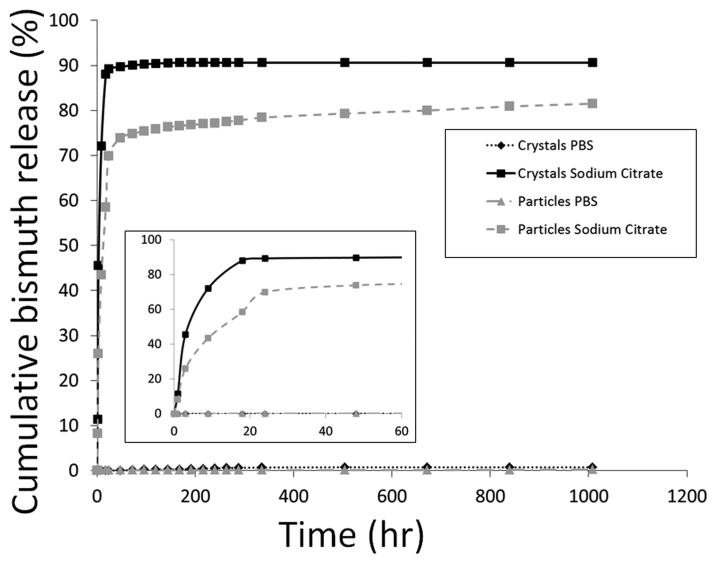
The dissolution of bismuth nanocrystals, both as bare nanocrystals and encapsulated in PLGA, was studied in solvents representing physiological relevant conditions in vitro. Specifically, incubation in sodium citrate mimics the post-endocytosis environment of a lysosome with a low pH and the presence of citrate 22, 23. PBS mimics cytosolic and extracellular pH. As previously reported for PLGA encapsulated iron oxide nanoparticles, the bismuth particles had a similar initial “burst” pattern of dissolution17. However, the rate of the dissolution was faster for PLGA encapsulated bismuth nanoparticles than for iron particles, consuming almost 70% of the bismuth nanocrystals in 24 hr (Figure 6). The rate of the initial burst phase was even greater in the bare 38 nm bismuth nanocrystals samples, reaching 90% of the bismuth dissolved within the first 24 hrs (Figure 6). In stark contrast, neither the bismuth nanocrystals nor nanocrystal loaded nanoparticles degraded in the PBS solution. At the completion of the experiment only 0.7% of the crystals and 0.2% of the particles had dissolved into the solution, indicating that both are relatively stable in the neutral environment representative of the extracellular environment of a cell17.
Figure 6.
Bismuth release from unencapsulated bismuth nanocrystals and PLGA encapsulated bismuth nanoparticles in PBS and sodium citrate over 42 days. Inset: Expansion of the results over the first 48 hrs.
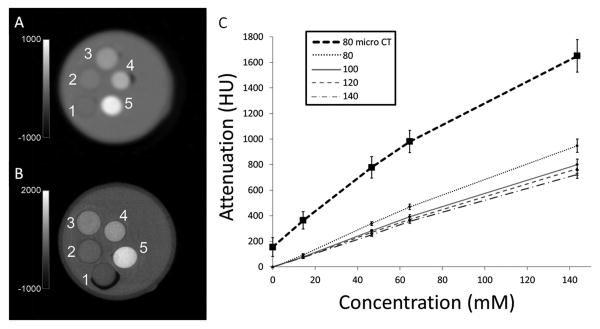
To measure the rate of attenuation of PLGA encapsulated bismuth nanoparticles, μCT and clinical CT imaging was performed on vials containing 0, 14, 46, 64, and 143 mM concentrations of bismuth (Figure 7A). For μCT, a linear relationship between attenuation and bismuth concentration (R2=0.98) was revealed with a slope or rate of attenuation of 10.2 HU/mM (Figure 7B). In vitro clinical CT of these same vials at 80, 100, 120, and 140kV (Figure 7A) were similarly linear and had rates of attenuation of 6.6, 5.9, 5.3 and 5.1 HU/mM, respectively (Figure 7B), similar to that previously determined for gold15. The discrepancy in rates of attenuation between the pre-clinical and clinical systems, due to the μCT having a greater low energy component of its X-ray beam than the clinical CT, highlights the importance of evaluating new CT materials on clinical systems. Further, this also suggests that preclinical use of CT agents may afford more sensitive investigations than clinical projects, opening the door for the expanded use of preclinical μCT in basic biology as is common with MRI.
Figure 7.
(A) Clinical CT image and (B) μCT image of vials containing bismuth nanoparticles labeled 1-5 with bismuth concentrations of 0, 14, 46, 64, and 143 mM, respectively. (C) Graph of attenuation vs. concentration of bismuth at different X-ray tube voltages. Clinical CT kVp values of 80, 100, 120, and 140kVp and μCT value of 80kV.
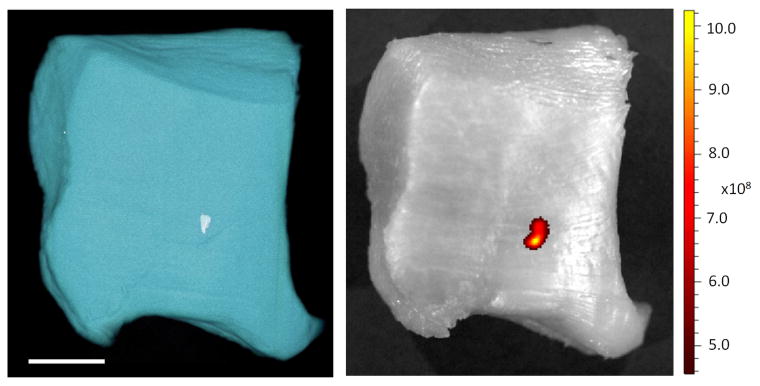
To demonstrate μCT and clinical CT detection PLGA encapsulated bismuth nanoparticles, particles were injected into a chicken wing. Ex vivo CT imaging of the chicken wing with both μCT and clinical CT at 80 kV (Figure 8) detected nanoparticles as hypointense signal, measured to be 2435 ± 44 HU on the μCT and 1344 ± 178 HU on the clinical CT. Using the calculated HU/mM for Bi at 80 kVp as determined in Figure 7 yields Bi concentrations of 238 and 204 mM, respectively, statistically insignificant with respect to each other. These values are more than double the concentration of bismuth delivered, 90 mM, and likely reflect precipitation or aggregation of the injected nanoparticles following injection within the tissue. This data proved that the nanoparticles retain their contrast generating properties after injection into tissue. However, this result encouragingly points towards the potential of significant accumulations of contrast agent occurring in a tumor or within an atherosclerotic plaque by EPR effect or by targeted delivery. In Figure 9 we present side by side CT and fluorescence images of a tissue sample injected with the nanoparticles. As can be seen, there is excellent co-localization of the fluorescence and CT signal, demonstrating the bimodal imaging functionality of the agent.
Figure 8.
(A) μCT image of chicken forearm prior to bismuth nanoparticle injection. (B) μCT image of the same slice, post bismuth nanoparticle injection. (C) Clinical CT image of the same slice, post bismuth nanoparticle injection. Arrow indicates the site of injection.
Figure 9.
(A) Volume rendering from μCT image of chicken thigh meat injected with fluorescent, PLGA encapsulated bismuth nanoparticles. Scale bar is 1 cm. (B) Fluorescent image of the same. Fluorescence units are radiant efficiency .
MTT assays were performed on cells labeled with particles in vitro. After a one-way ANOVA found that there was a significant effect of bismuth concentration on cell proliferation (p=0.0001), t-tests were performed to determine which values were significantly different from the controls. At 0.0001 mg/mL, 0.001 mg/mL and 0.01 mg/mL, there was no statistically significant effect on proliferation. At the highest concentrations (0.1 mg/mL and 1 mg/mL), there was significantly less cell proliferation than in the controls (Sup Figure 1).
Flow cytometry was used to measure cells that were either apoptotic and/or dead. Flow cytometry assays for annexin V and 7AAD found that the control cells were 10% double-positive. Low levels of labeling did not affect cell viability but higher concentrations of bismuth reduced viability. Cells that were incubated with 5 pg/cell of bismuth were 24% double positive, while cells exposed to 150 pg/cell were 36% double positive (Sup Figure 2).
A rigorous in vivo toxicity study was also performed. The full results are detailed in Supplemental Data. No animals showed any apparent clinical abnormalities, aside from loose stools in a few animals at 24 hours post injection (both IV injected experimental groups) and at day 8 (control group, IP injection).
Some serum chemistry values were altered at both 24 hours and 7 days post-injection. These alterations were most significantly noted in those animals that received IV administration of the nanoparticles, although some were also noted in the high dose IP injected animals. As expected, these changes are within the pathways for kidney and liver metabolism. Notably, elevation in liver enzymes at 24 hours post injection of particles was fully resolved at 7 days.
Hematology was also examined. At 24-hours post-injection, and at 7 day time point, mean platelet volume (MPV) was statistically increased in the group of animals receiving 20mg/kg IV. The same group had a statistically significant reduction in hematocrit and hemoglobin, with increased white blood cell and lymphocyte counts.
A pathological and histopathological evaluation was performed on one animal from each group. No statistically significant changes in organ weights were noted and no gross changes were identified on necropsy. Mild to moderate BALT hyperplasia was a common finding in nearly every animal, possibly due to mycoplasma infection. In one animal from high dose IV injection, focal regions of alveolar macrophages within alveoli were identified. Occasional pathological findings were observed in spleen, kidney and liver. Of note, one animal from the high dose IV injection showed evidence of regeneration of the kidney following transient injury.
Discussion
In this manuscript we report on the design, fabrication, characterization and extensive in vitro and in vivo assaying of PLGA encapsulated bismuth nanoparticles, which can be utilized as a potential CT contrast agent. The synthetic approach is facile and flexible, permitting one to tailor the approach for encapsulating less bismuth if desired, changing the overall size of the particle and using other hydrophobic polymers for encapsulation.
The toxicological aspects of bismuth preparations are well established and the published side effects of various routes of injection include nephropathy, hepatitis, encephalopathy, gastroenteritis and osteoarthropathy24-30. In this study, although no clinically apparent side effects were noted, several changes were identified on clinicopathological and histopathological evaluation of animals and their internal organs. The group with the most apparent changes was the high dose, 20mg/kg IV group. Histopathological changes in this group included ones suggestive of transient kidney injury and periportal inflammatory process in the liver. These changes correlate with the routes of bismuth excretion from the body27, 28. Previous studies have shown that after IV injection of various bismuth preparations the majority of bismuth concentrates in the kidneys27, 31. Studies have previously described reversible kidney failure after ingestion of bismuth and characteristic histopathological changes24, 32. In this study, characteristic kidney injury affecting tubular epithelial cells was noted in an animal from the 20mg/kg IV group. Regarding clinicopathologic values that may suggest kidney injury, only magnesium levels were significantly lower in this group. Significant reduction of hematocrit may be a result of kidney injury, although eryptosis – an apoptotic death of erythrocytes, is more likely. Bismuth has recently been described as a potential trigger of eryptosis 33. This metal induces cellular multiple changes characteristic for this process – phosphatydylserine expression on cell surface, decrease in erythrocyte size, increase in intracellular Ca2+ activity and formation of ceramide leading to erythrocyte death33.
Another route of excretion of this heavy metal is via bile, and rarely, liver injury has also been reported after bismuth ingestion27, 31. Periportal inflammatory cell infiltrates in the liver were apparent in the 20mg/kg IV group and early (24 hours post particle injection) increase in liver enzymes was significant in this group. Decrease in hemoglobin concentration may be also associated with liver toxicity due to bismuth and how it affects the liver cells and their mitochondria. Concurrent lymphocyte and total white blood cell count increases, and subsequently an increase in globulin and total protein levels, are suggesting an inflammatory response that is probably triggered by bismuth injection.
As mentioned earlier, CT imaging suffers from low sensitivity, with contrast agent concentration requirements currently being in the millimolar range. However, the dense encapsulation of contrast agents like elemental bismuth within nanoparticles can overcome a seemingly difficult barrier to detection. Take for example a cancer targeting paradigm, where one strives to achieve a very high 100 mM bismuth concentration targeted to a tumor. Elemental bismuth has a molecular weight of ∼ 200 g/mol and density ∼ 10g/ml. A 40 nm bismuth spherical nanocrystal has a volume of 3.2 × 10⁻²⁰ L and weighs 3.2 × 10⁻¹⁶ g. Cubic nanocrystals would have double the volume and mass. In this example we assume the use of 1 mm isotropic pixels in a clinical CT scan. To achieve 100 mM bismuth, one would require 3.0 × 10⁶ spherical or 1.5 × 10⁶ cubic nanocrystals in that pixel. Assuming in this tumor model that there are ∼ 106-107 tumor cells per mm3, one would need to target 3-30 PLGA-encapsulated single bismuth spherical nanocrystals to each cell in this tumor to achieve 100 mM concentration. Given that targetable cell surface antigens are in the range of 104-105, this becomes a solvable challenge. Were one to accomplish encapsulation of multiple nanocrystals within single particles, as Figure 2 shows is possible, this becomes an even easier problem to solve, with requirements ∼ single particles/cell for 100 mM detection.
Conclusions
In summary, degradable, elemental bismuth nanocrystals have been efficiently encapsulated within 120 nm PLGA nanoparticles. As PLGA is an FDA approved polymer, these particles have an advantage for long term clinical potential, though mild, transient toxicity from bismuth was identified in preliminary in vitro and in vivo assays. Further refinements to this system depend on proposed use. Toxicity can likely be reduced by tailoring the dissolution rate of the bismuth as has been achieved with manganese based particles34. For cell tracking, simple incubation of particles with cells results in high internalization, similar to what has been accomplished with previous metal oxide nanoparticles16-19, 35. For passive targeting of compromised vascularity due to injury or disease, cryoprotection35 and PEG coating36 would likely be necessary. Active targeting would necessitate a careful balance between PEG and targeting ligand36. Lastly, paradigms such as described here, where multiple nanocrystal cores are encapsulated in polymer nanoparticles may enable molecular and cellular CT as it addresses the well-accepted concentration challenge associated with CT contrast agents.
Supplementary Material
Acknowledgments
This work was supported in part by NIH DP2 OD001880 (EMS) and R00 EB012165 (DPC). Authors thank X. Fan of the MSU TEM facility, K. Severin of the MSU Chemistry ICP and FTIR facilities, R. Staples of the MSU Chemistry XRD facility, P. Askeland of the MSU Chemical Engineering Composite Materials and Structures Center, S. Reilly of the IVIS facility, A. Withrow of the Center for Advanced Microscopy, K. Mietelka of the Diagnostic Center for Population & Animal Health, MSU In Vivo Facility, and MSU Department of Radiology for the use of the clinical CT system.
Reference List
- 1.Bulte JW. Radiology. 2010;256:675. doi: 10.1148/radiol.101127. [DOI] [PubMed] [Google Scholar]
- 2.Li J, Chaudhary A, Chmura SJ, Pelizzari C, Rajh T, Wietholt C, Kurtoglu M, Aydogan B. Phys Med Biol. 2010;55:4389. doi: 10.1088/0031-9155/55/15/013. [DOI] [PubMed] [Google Scholar]
- 3.Popovtzer R, Agrawal A, Kotov NA, Popovtzer A, Balter J, Carey TE, Kopelman R. Nano Lett. 2008;8:4593. doi: 10.1021/nl8029114. [DOI] [PMC free article] [PubMed] [Google Scholar]
- 4.Reuveni T, Motiei M, Romman Z, Popovtzer A, Popovtzer R. Int J Nanomedicine. 2011;6:2859. doi: 10.2147/IJN.S25446. [DOI] [PMC free article] [PubMed] [Google Scholar]
- 5.Schlomka JP, Roessl E, Dorscheid R, Dill S, Martens G, Istel T, Baumer C, Herrmann C, Steadman R, Zeitler G, Livne A, Proksa R. Phys Med Biol. 2008;53:4031. doi: 10.1088/0031-9155/53/15/002. [DOI] [PubMed] [Google Scholar]
- 6.Roessl E, Brendel B, Engel KJ, Schlomka JP, Thran A, Proksa R. IEEE Trans Med Imaging. 2011;30:1678. doi: 10.1109/TMI.2011.2142188. [DOI] [PubMed] [Google Scholar]
- 7.Cormode DP, Roessl E, Thran A, Skajaa T, Gordon RE, Schlomka JP, Fuster V, Fisher EA, Mulder WJ, Proksa R, Fayad ZA. Radiology. 2010;256:774. doi: 10.1148/radiol.10092473. [DOI] [PMC free article] [PubMed] [Google Scholar]
- 8.Feuerlein S, Roessl E, Proksa R, Martens G, Klass O, Jeltsch M, Rasche V, Brambs HJ, Hoffmann MH, Schlomka JP. Radiology. 2008;249:1010. doi: 10.1148/radiol.2492080560. [DOI] [PubMed] [Google Scholar]
- 9.Cormode DP, Naha PC, Fayad ZA. Contrast Media Mol Imaging. 2014;9:37. doi: 10.1002/cmmi.1551. [DOI] [PMC free article] [PubMed] [Google Scholar]
- 10.Ai K, Liu Y, Liu J, Yuan Q, He Y, Lu L. Adv Mater. 2011;23:4886. doi: 10.1002/adma.201103289. [DOI] [PubMed] [Google Scholar]
- 11.Rabin O, Manuel PJ, Grimm J, Wojtkiewicz G, Weissleder R. Nat Mater. 2006;5:118. doi: 10.1038/nmat1571. [DOI] [PubMed] [Google Scholar]
- 12.Son JS, Park K, Han MK, Kang C, Park SG, Kim JH, Kim W, Kim SJ, Hyeon T. Angew Chem Int Ed Engl. 2011;50:1363. doi: 10.1002/anie.201005023. [DOI] [PubMed] [Google Scholar]
- 13.Pan D, Roessl E, Schlomka JP, Caruthers SD, Senpan A, Scott MJ, Allen JS, Zhang H, Hu G, Gaffney PJ, Choi ET, Rasche V, Wickline SA, Proksa R, Lanza GM. Angew Chem Int Ed Engl. 2010;49:9635. doi: 10.1002/anie.201005657. [DOI] [PMC free article] [PubMed] [Google Scholar]
- 14.Brown AL, Goforth AM. Chem Mater. 2012;24:1599. [Google Scholar]
- 15.Galper MW, Saung MT, Fuster V, Roessl E, Thran A, Proksa R, Fayad ZA, Cormode DP. Invest Radiol. 2012;47:475. doi: 10.1097/RLI.0b013e3182562ab9. [DOI] [PMC free article] [PubMed] [Google Scholar]
- 16.Granot D, Nkansah MK, Bennewitz MF, Tang KS, Markakis EA, Shapiro EM. Magn Reson Med. 2014;71:1238. doi: 10.1002/mrm.24741. [DOI] [PMC free article] [PubMed] [Google Scholar]
- 17.Nkansah MK, Thakral D, Shapiro EM. Magn Reson Med. 2011;65:1776. doi: 10.1002/mrm.22765. [DOI] [PMC free article] [PubMed] [Google Scholar]
- 18.Bennewitz MF, Lobo TL, Nkansah MK, Ulas G, Brudvig GW, Shapiro EM. Acs Nano. 2011;5:3438. doi: 10.1021/nn1019779. [DOI] [PMC free article] [PubMed] [Google Scholar]
- 19.Bennewitz MF, Williams SS, Nkansah MK, Shapiro EM. J Nanosci Nanotechnol. 2013;13:3778. doi: 10.1166/jnn.2013.7435. [DOI] [PubMed] [Google Scholar]
- 20.Qin F, Wang RM, Li GF, Tian F, Zhao HP, Chen R. Catalysis Communications. 2013;42:14. [Google Scholar]
- 21.Mieszawska AJ, Gianella A, Cormode DP, Zhao Y, Meijerink A, Langer R, Farokhzad OC, Fayad ZA, Mulder WJ. Chem Commun (Camb) 2012;48:5835. doi: 10.1039/c2cc32149a. [DOI] [PMC free article] [PubMed] [Google Scholar]
- 22.Skotland T, Sontum PC, Oulie I. J Pharm Biomed Anal. 2002;28:323. doi: 10.1016/s0731-7085(01)00592-1. [DOI] [PubMed] [Google Scholar]
- 23.Arbab AS, Wilson LB, Ashari P, Jordan EK, Lewis BK, Frank JA. NMR Biomed. 2005;18:383. doi: 10.1002/nbm.970. [DOI] [PubMed] [Google Scholar]
- 24.James JA. California Medicine. 1968;109:317. [PMC free article] [PubMed] [Google Scholar]
- 25.Boyette DP. Journal of Pediatrics. 1946;28:493. doi: 10.1016/s0022-3476(46)80036-2. [DOI] [PubMed] [Google Scholar]
- 26.Czerwins AW, Ginn HE. American Journal of Medicine. 1964;37:969. doi: 10.1016/0002-9343(64)90137-8. [DOI] [PubMed] [Google Scholar]
- 27.Sollmann T, Seifter J. Journal of Pharmacology and Experimental Therapeutics. 1942;74:134. [Google Scholar]
- 28.Slikkerveer A, Dewolff FA. Medical Toxicology and Adverse Drug Experience. 1989;4:303. doi: 10.1007/BF03259915. [DOI] [PubMed] [Google Scholar]
- 29.Karelitz S, Freedman AD. Pediatrics. 1951;8:772. [PubMed] [Google Scholar]
- 30.Hudson M, Ashley N, Mowat G. British Medical Journal. 1989;299:159. [Google Scholar]
- 31.Sollmann T, Seifter J. Journal of Pharmacology and Experimental Therapeutics. 1939;67:17. [Google Scholar]
- 32.Pappenheimer AM, Maechling EH. American Journal of Pathology. 1934;10:577. [PMC free article] [PubMed] [Google Scholar]
- 33.Braun M, Foller M, Gulbins E, Lang F. Biometals. 2009;22:453. doi: 10.1007/s10534-008-9180-5. [DOI] [PubMed] [Google Scholar]
- 34.Lee YC, Chen DY, Dodd SJ, Bouraoud N, Koretsky AP, Krishnan KM. Biomaterials. 2012;33:3560. doi: 10.1016/j.biomaterials.2012.01.062. [DOI] [PMC free article] [PubMed] [Google Scholar]
- 35.Tang KS, Hashmi SM, Shapiro EM. Nanotechnology. 2013;24:125101. doi: 10.1088/0957-4484/24/12/125101. [DOI] [PMC free article] [PubMed] [Google Scholar]
- 36.Hak S, Helgesen E, Hektoen HH, Huuse EM, Jarzyna PA, Mulder WJ, Haraldseth O, Davies CL. ACS Nano. 2012;6:5648. doi: 10.1021/nn301630n. [DOI] [PMC free article] [PubMed] [Google Scholar]
Associated Data
This section collects any data citations, data availability statements, or supplementary materials included in this article.


