Abstract
Objective:
The location of comprehensive stroke centers (CSCs) is critical to ensuring rapid access to acute stroke therapies; we conducted a population-level virtual trial simulating change in access to CSCs using optimization modeling to selectively convert primary stroke centers (PSCs) to CSCs.
Methods:
Up to 20 certified PSCs per state were selected for conversion to maximize the population with 60-minute CSC access by ground and air. Access was compared across states based on region and the presence of state-level emergency medical service policies preferentially routing patients to stroke centers.
Results:
In 2010, there were 811 Joint Commission PSCs and 0 CSCs in the United States. Of the US population, 65.8% had 60-minute ground access to PSCs. After adding up to 20 optimally located CSCs per state, 63.1% of the US population had 60-minute ground access and 86.0% had 60-minute ground/air access to a CSC. Across states, median CSC access was 55.7% by ground (interquartile range 35.7%–71.5%) and 85.3% by ground/air (interquartile range 59.8%–92.1%). Ground access was lower in Stroke Belt states compared with non–Stroke Belt states (32.0% vs 58.6%, p = 0.02) and lower in states without emergency medical service routing policies (52.7% vs 68.3%, p = 0.04).
Conclusion:
Optimal system simulation can be used to develop efficient care systems that maximize accessibility. Under optimal conditions, a large proportion of the US population will be unable to access a CSC within 60 minutes.
Stroke is a leading cause of death and disability in the United States.1 The effectiveness of acute stroke therapies decreases rapidly over time as neurons die.2,3 Prehospital delays are the primary reason that ischemic stroke patients are ineligible for acute therapies.4–6 Once a stroke is recognized, prehospital providers must be able to rapidly deliver patients to appropriate centers, making the geographic accessibility of these centers critically important.
Geographic disparities in stroke outcomes are well described, with increased burden in the southeastern United States (“Stroke Belt”) and in rural areas.7–9 Reduced access to health care resources has been proposed as one possible explanation for regional variation in stroke mortality.10 A population-based approach to health planning would prevent disparities in access to specialized stroke care.
Regionalized systems of care11 for stroke have been recommended.11,12 A 3-tiered system has been proposed, consisting of acute stroke–ready hospitals, primary stroke centers (PSCs), and comprehensive stroke centers (CSCs), in order of increasing resources/capabilities.13–15 Certification of PSCs began in December 2003 by The Joint Commission (TJC).16 Compared with noncertified hospitals, PSCs utilize more recombinant tissue plasminogen activator and have lower mortality.17–20 In September 2012, TJC began certifying CSCs. Certification for acute stroke–ready hospitals does not yet exist.
In this report, we demonstrate how mathematical optimization modeling can inform the strategic development of the US network of stroke centers by simulating the conversion of PSCs into CSCs. This allows for virtual trials of competing system configurations in order to design a system that maximizes population access to care.
METHODS
Study design.
A virtual trial of competing stroke system configurations was conducted using optimization modeling and a greedy adding algorithm to maximize 60-minute population CSC access.
Access calculations.
Access to care was calculated at the block group level and then summed to the state level. Block groups are small geographic units defined by the US Census (population approximately 800–1,700). There are 208,667 block groups in the United States. Total prehospital time, the time from calling 911 to arriving at a hospital, was estimated from the population-weighted center, or centroid, of each block group to candidate hospitals. Location of population-weighted centroids was obtained from Nielsen Claritas and based on 2010 US Census estimates.
For ground transportation, the Network Analyst functionality in ESRI (Environmental Systems Research Institute) ArcMap 10.1 was used to determine the shortest road distance between each centroid and candidate hospitals. Transport times were calculated based on posted speed limits with 10 mph added in the path to the hospital. Key prehospital time intervals, adjusted for urbanization, were added to the transport time to estimate total prehospital time. The 911 activation to ambulance dispatch interval was estimated as 1.4, 1.4, and 2.9 minutes for urban, suburban, and rural areas, respectively.21 The time from ambulance dispatch until arrival at the scene was determined by multiplying the drive time from the scene to the hospital by 1.6, 1.5, and 1.4 for urban, suburban, and rural drives, respectively.21 Lastly, 13.5, 13.5, and 15.1 minutes were added to account for time spent by emergency medical services (EMS) on the scene before transport for urban, suburban, and rural areas.22,23 For air transportation, air ambulance data were obtained from the 2010 Atlas and Database of Air Medical Services, including the location, type, and airspeed of ambulances as well as the location of helicopter depots operated by air medical providers responding to emergency scenes in the United States. Air medical services relying on fixed wing aircraft were excluded. Assuming that helicopters travel in a straight line, Euclidean distances between points were used. Empirically derived, validated constants for helicopter activation time (3.5 minutes) and helicopter on-scene time (21.6 minutes) were added to the model.21 It was assumed that patients and EMS providers would not cross state lines. Air transport models were created in C# (Microsoft, Redmond, WA).
Optimization.
In the primary analysis, hospitals certified by TJC as PSCs before December 31, 2010, were considered candidates for CSC certification. A list of certified PSCs was obtained directly from TJC on May 17, 2011 (personal communication, Jean Range, Executive Director of Disease Specific Care, TJC). There were no TJC-certified CSCs at that time. Population data, including 2010 population counts and geographic data were obtained from the 2010 Nielsen Claritas Census Estimations.
Population access to candidate hospitals was calculated by ground transportation, and the hospital that would contribute the maximal population access was selected as the first CSC. A greedy adding algorithm was then used.24 In this algorithm, CSCs are added in an iterative manner to maximize population access. Of all of the candidate hospitals, the hospital with the greatest population coverage is selected as the first CSC. Of the remaining candidates, the hospital that provides the greatest marginal increase in population is selected as the second CSC, and so on, until either all candidate hospitals have been used or a maximum of 20 CSCs have been added. This process was repeated using ground/air transportation calculations. In a sensitivity analysis, calculations were repeated allowing EMS providers to cross state lines and changing candidate hospitals from PSCs to any hospital with an emergency department (ED). Optimization modeling was conducted in C# (Microsoft).
Analysis.
Optimal access to CSCs was compared across US Census regions (Northeast, Midwest, South, West). Stroke Belt states (AL, AR, GA, LA, MS, NC, SC, TN) were compared with non–Stroke Belt states.25 Hypothesizing that EMS policy could improve access by incentivizing PSC certification, we compared states with EMS destination policies routing stroke patients to designated stroke centers (FL, GA, IL, MA, MD, MO, ND, NJ, NY, OK, RI, TX, UT, VA, VT, WA) to states without such policies.26 Access to care was summarized using medians and interquartile range (IQR). The relationship between optimal CSC access and rurality, defined as the percentage of people living in rural areas for each state (2010 US Census), was assessed by Spearman rank correlation.
RESULTS
Ground only.
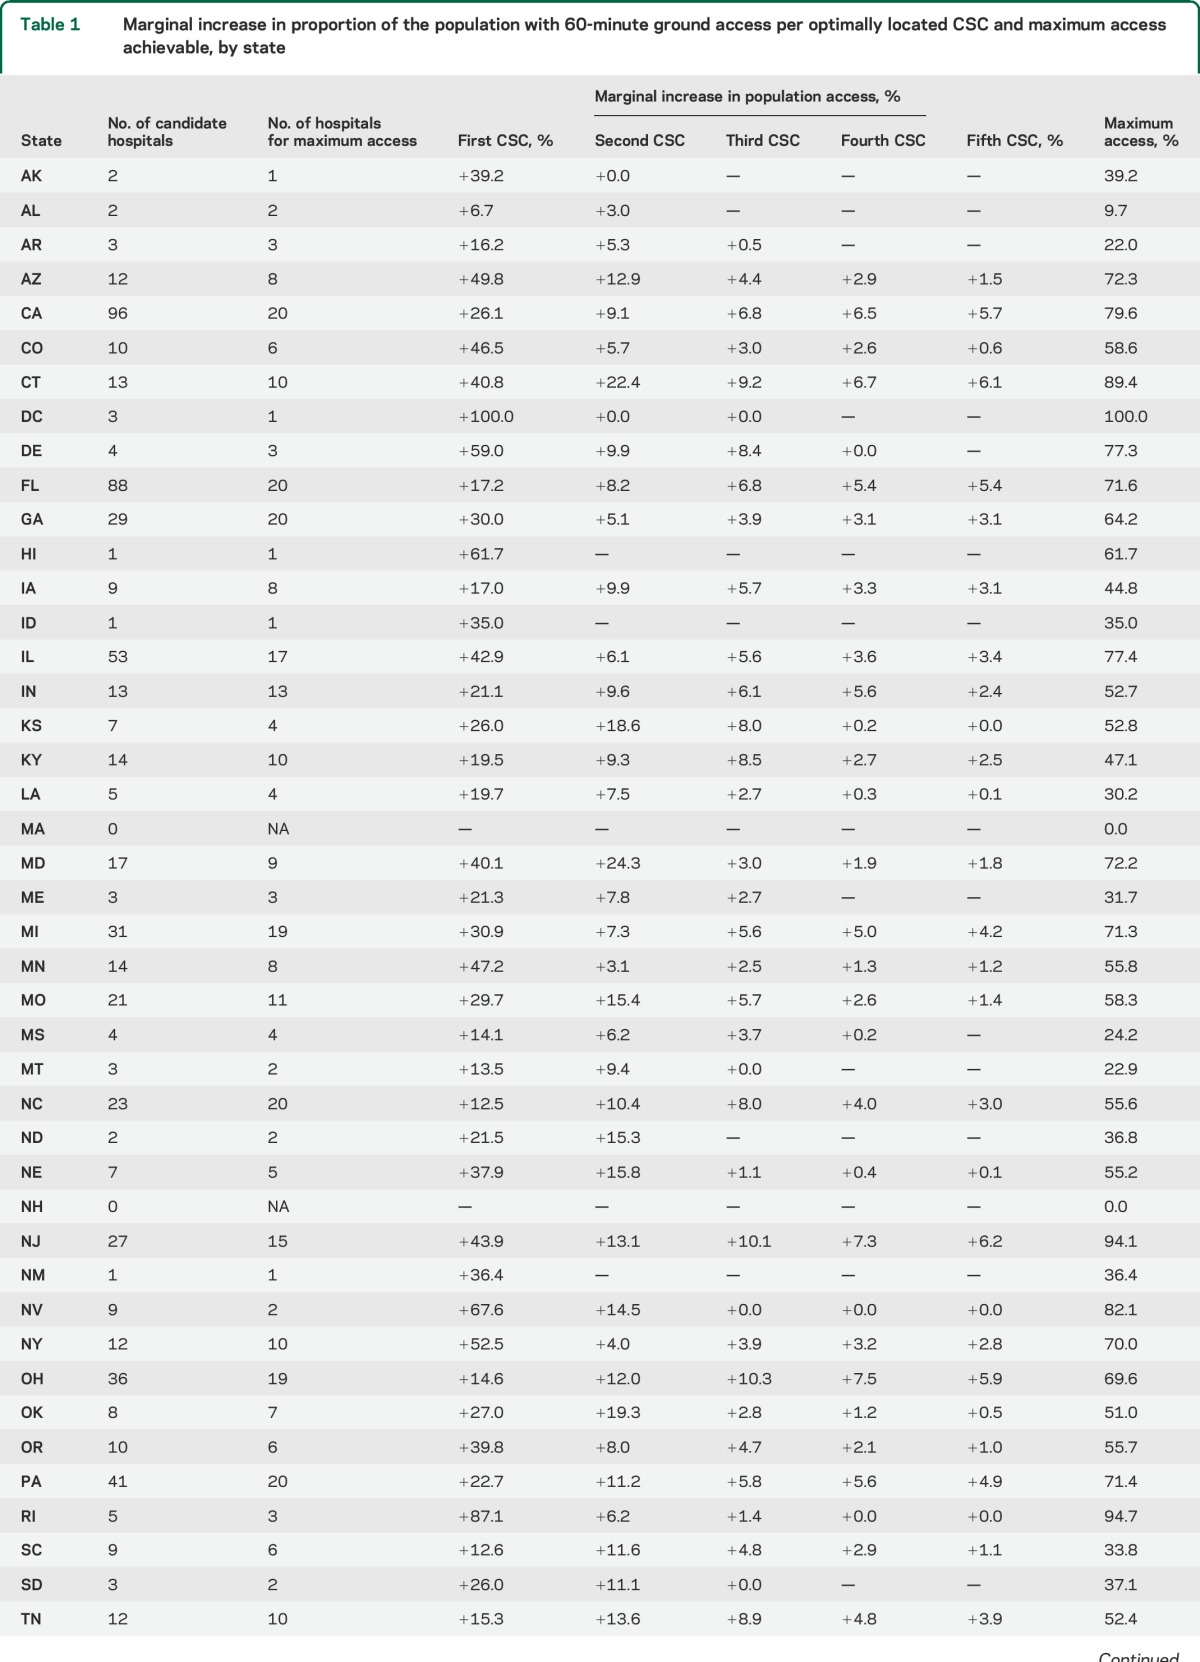
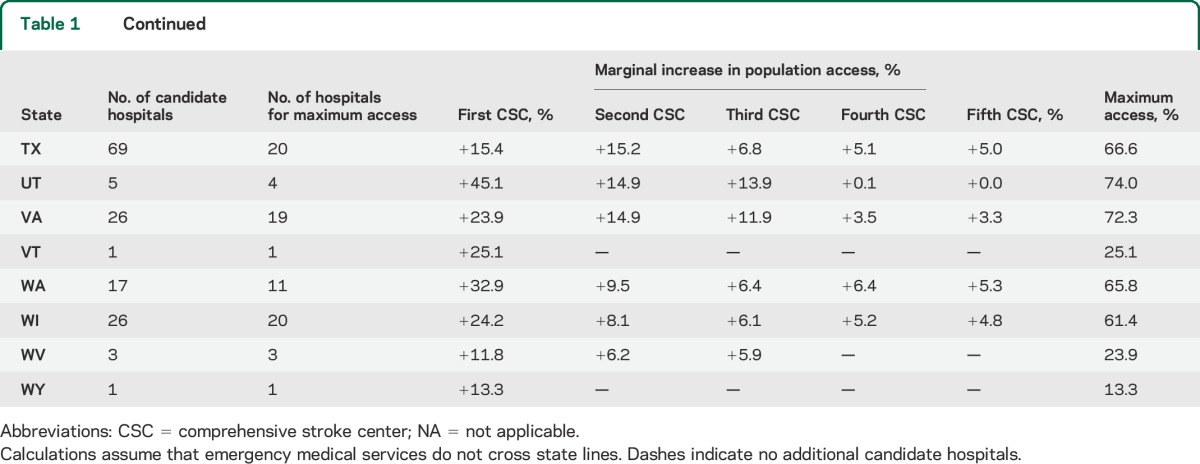
As of December 31, 2010, there were 811 TJC-certified PSCs that served as candidate hospitals, and 65.8% of the US population had 60-minute ground access to these facilities. The number of candidate hospitals in each state ranged from 0 to 96. After adding up to 20 optimally located CSCs per state using the greedy adding algorithm, 63.1% of the US population had 60-minute ground access to a CSC. Averaging across states, the median population with 60-minute ground access was 26.1% after the first optimally placed CSC, 35.6% after the second CSC, 41.2% after the third CSC, 44.2% after the fourth CSC, and 47.0% after the fifth CSC. After up to 20 CSCs had been added, the median access across all states was 55.7% (IQR 35.7%–71.5%). Ground access, including the marginal increase in population access for the first 5 CSCs, is summarized in table 1.
Table 1.
Marginal increase in proportion of the population with 60-minute ground access per optimally located CSC and maximum access achievable, by state
Ground/air.
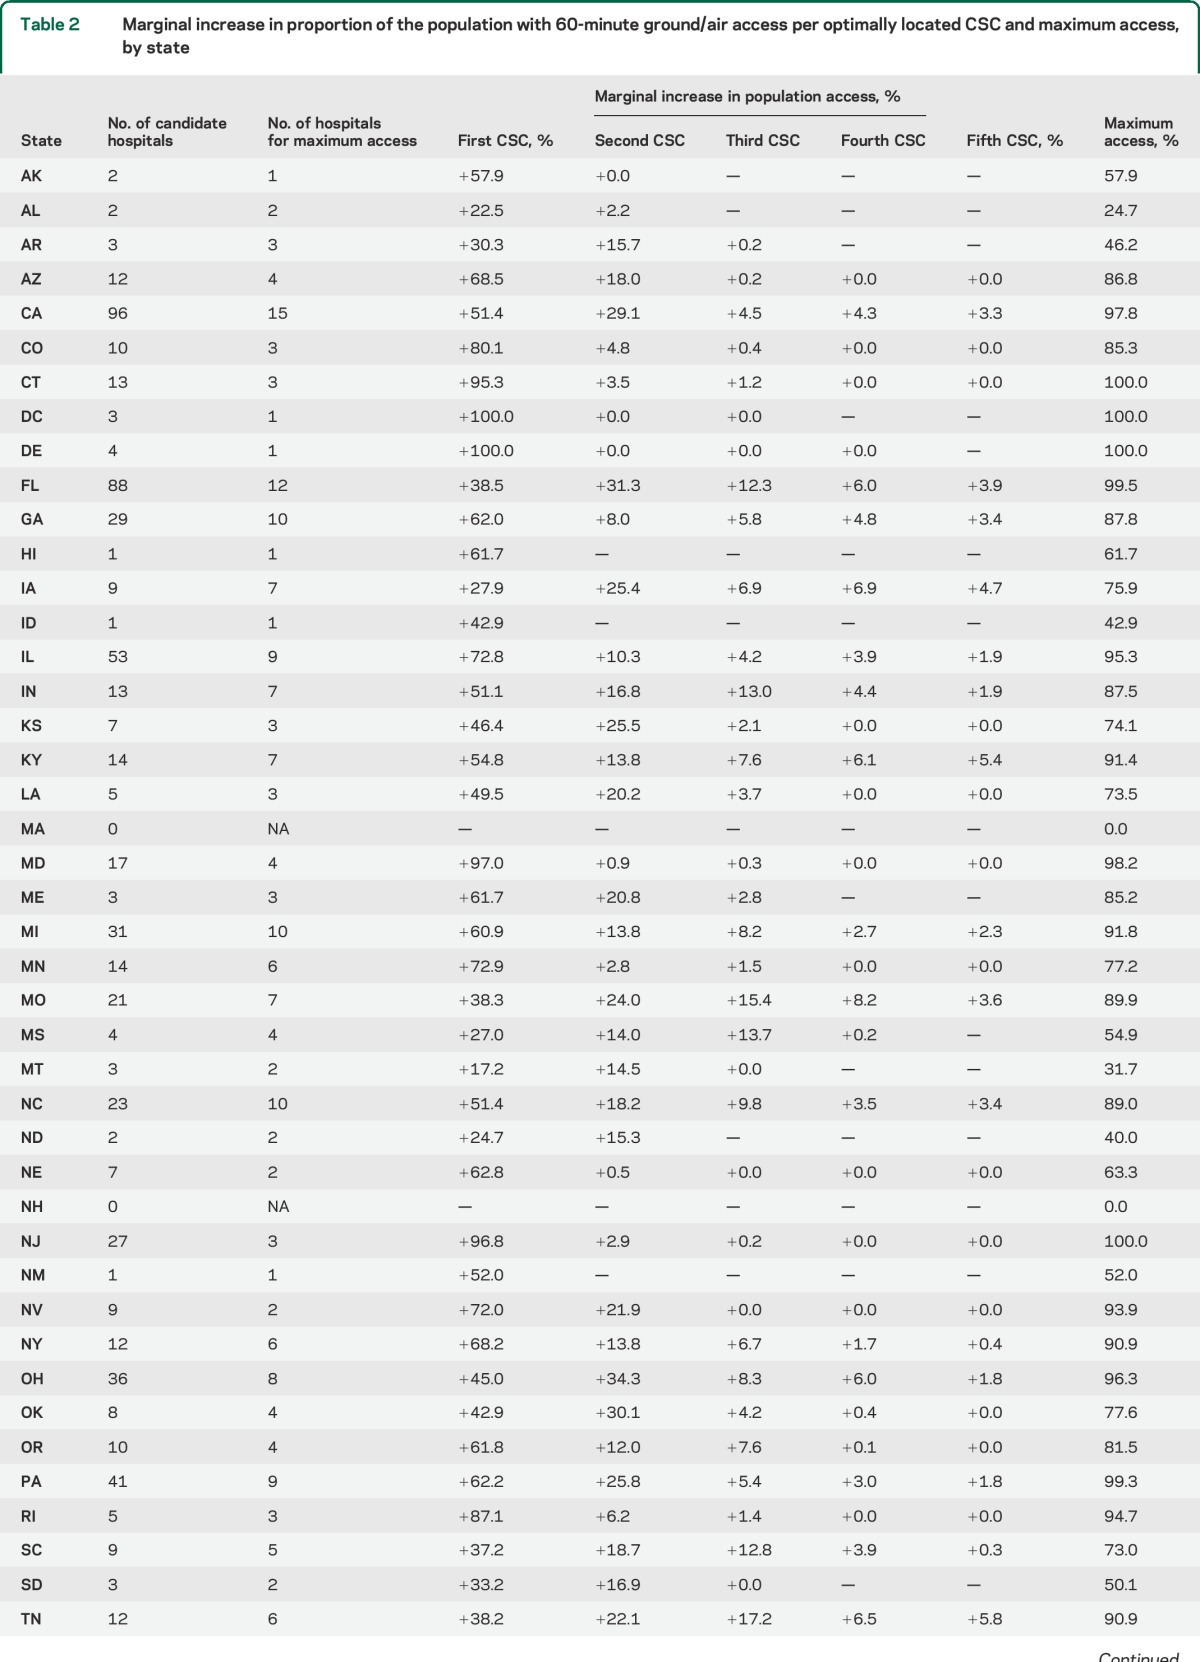
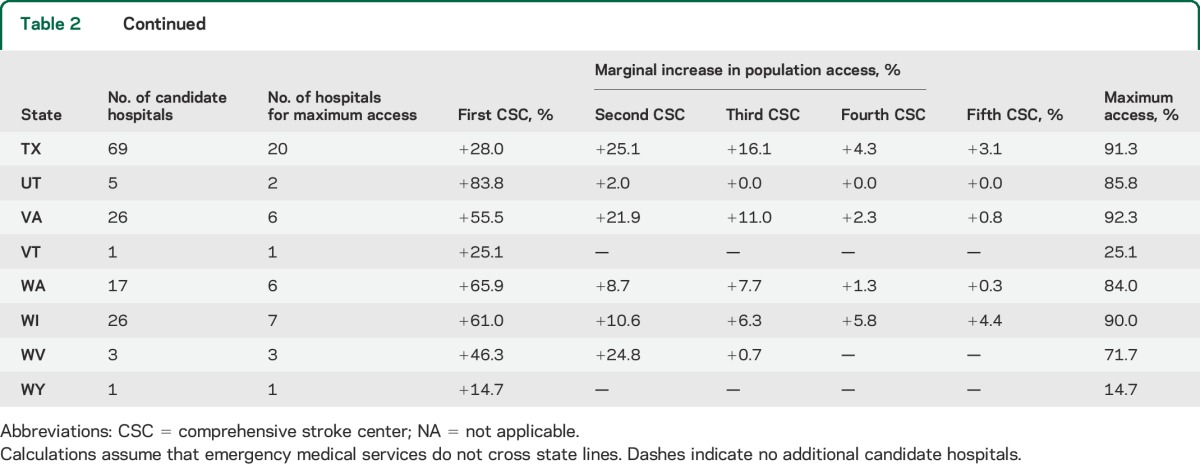
After adding up to 20 optimally located CSCs per state, 86.0% of the US population had 60-minute access to a PSC by ground/air. Averaging across states, the median population with 60-minute ground/air access was 54.8% after the first CSC, 69.7% after the second CSC, 73.9% after the third CSC, 75.6% after the fourth CSC, and 76.0% after the fifth CSC. After up to 20 CSCs had been added, the median access by ground/air across all states was 85.3% (IQR 59.8%–92.1%). Ground/air access, including the maximum access and the marginal increase in population access for the first 5 CSCs, is summarized in table 2. The proportion of the population with access to a CSC after each CSC is added is presented by state in the data supplement (tables e-1 and e-2 on the Neurology® Web site at Neurology.org).
Table 2.
Marginal increase in proportion of the population with 60-minute ground/air access per optimally located CSC and maximum access, by state
Subgroups.
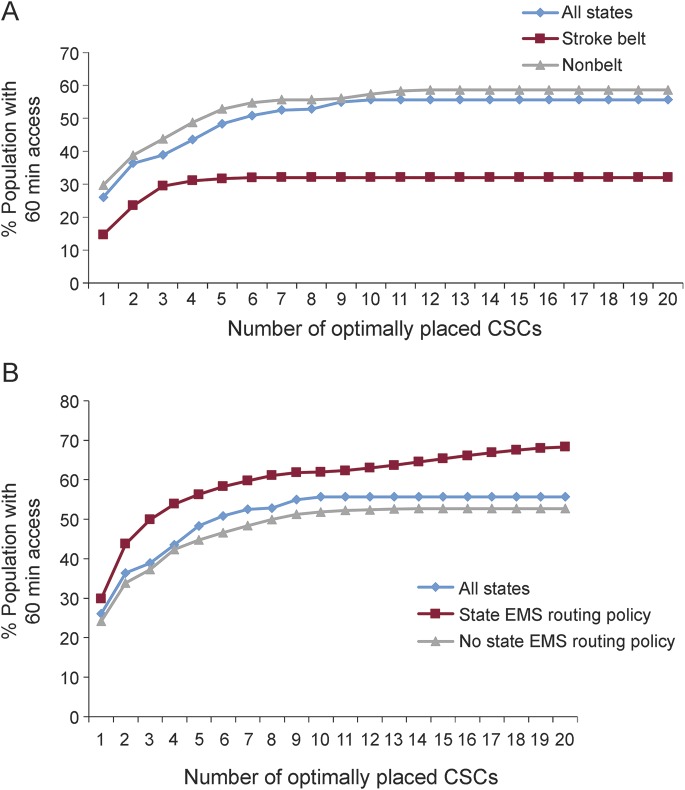
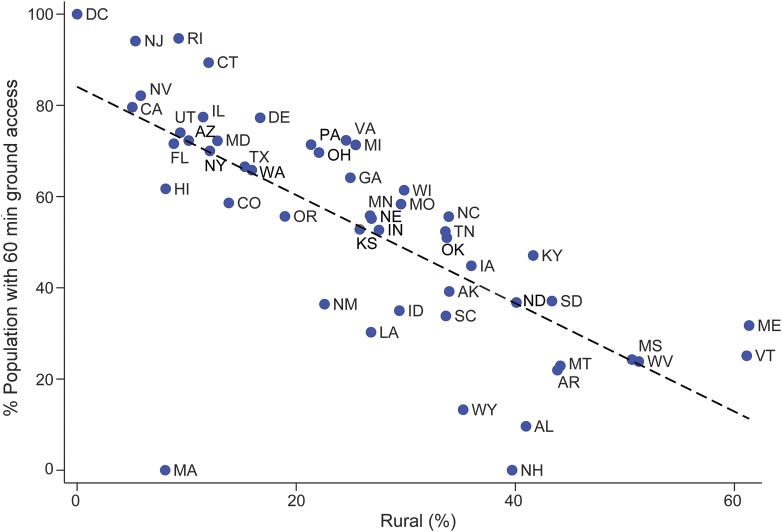
Although population access to CSCs was greatest in the Northeast, there was no statistically significant difference across US Census regions. Median access in Stroke Belt states was significantly worse than non–Stroke Belt states by ground (32.0% vs 58.6%, p = 0.02; figure 1A). Ground/air access was less in Stroke Belt states, but this difference was not statistically significant (73.2% vs 85.8%, p = 0.17). Median ground-only access was significantly higher in states with an EMS destination policy than in states without such a policy (68.3% vs 52.7%, p = 0.04; figure 1B). Ground/air access was higher in states with an EMS destination policy, but this difference was not statistically significant (90.4% vs 77.2%, p = 0.17). There was a significant association between the percentage of people living in rural areas and the percentage of people with 60-minute CSC access by ground only (Spearman ρ = −0.79, p < 0.001; figure 2). Median ground access, by quartile, was 77.4% in quartile 1 (least rural), 66.6% in quartile 2, 52.4% in quartile 3, and 25.7% in quartile 4 (most rural). Seven of the 8 Stroke Belt states were above the US median in rurality. Comparing these 7 states with the 19 non–Stroke Belt states that were above the median in rurality, access was lower in the Stroke Belt states by ground, but this difference was not statistically significant (30.2% vs 39.2%, p = 0.26). Ground/air access was similar in rural Stroke Belt states and rural non–Stroke Belt states (73.0% vs 71.7%, p = 0.89).
Figure 1. Access to CSCs within 60 minutes.
Population access to CSCs within 60 minutes. (A) PSC access, ground only, Stroke Belt vs non–Stroke Belt. (B) PSC access, ground only, EMS routing policy vs none. CSC = comprehensive stroke center; EMS = emergency medical service; PSC = primary stroke center.
Figure 2. CSC access and percentage rural.
Relationship between CSC access and percentage of the population living in rural areas, by state. CSC = comprehensive stroke center.
Sensitivity analysis.
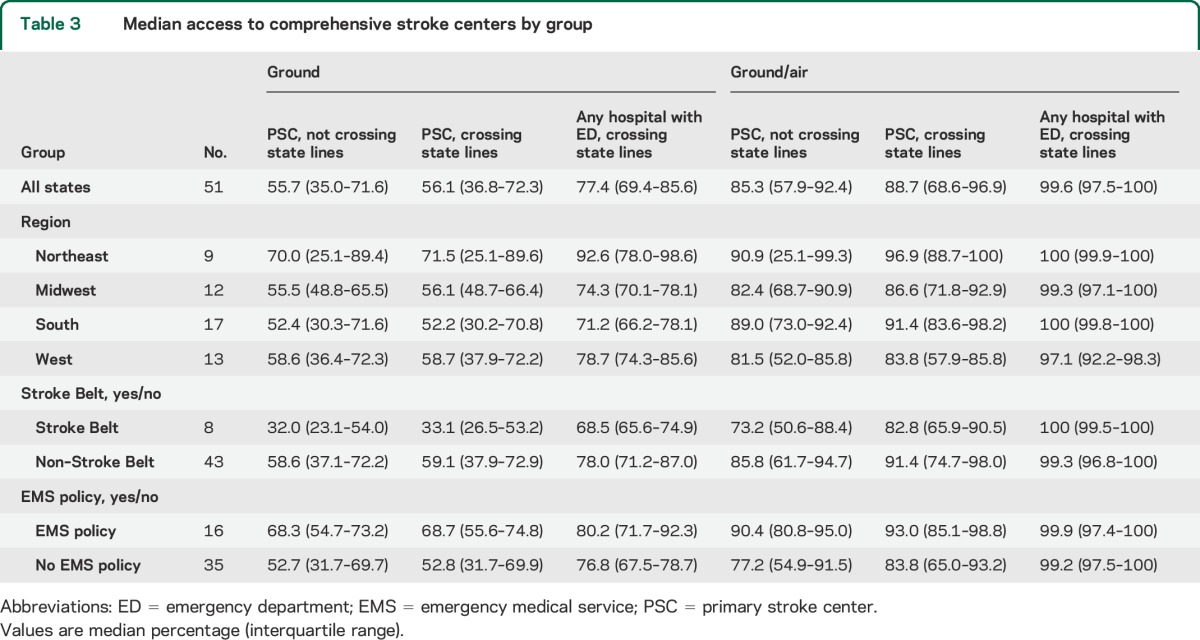
Calculations for ground-only and ground/air transportation were repeated first, allowing EMS providers to cross state lines and then changing candidate hospitals from PSCs to any hospital with an ED. Median access and IQR are reported overall, by region, Stroke Belt location, and presence or absence of EMS routing policy in table 3. Allowing EMS providers to cross state lines had little impact on median population access. Changing candidate hospitals from PSCs to any hospital with an ED increased access, particularly in the ground-only model. Variability across states, as indicated by the IQR, was reduced when candidate hospitals were expanded. Differences between Stroke Belt and non–Stroke Belt states and states with and without EMS routing policies were also attenuated when candidate hospitals were expanded. Full results of these models are available in table e-3.
Table 3.
Median access to comprehensive stroke centers by group
DISCUSSION
We performed a population-level virtual trial describing the development of optimal comprehensive stroke care systems across the United States. We found that 36.9% of the US population, approximately 114 million people, would be unable to access a CSC within 60 minutes by ground transportation, even if CSCs are optimally located throughout the United States. Allowing for air transportation improves access, but in one-quarter of the states, less than 60% of the population has ground/air access to CSCs. Because CSCs have not yet been proven to improve outcomes relative to other hospitals, the ideal level of population access is unknown. Nonetheless, variability in access across states is important, because it suggests that there is potential for significant geographic disparities in access to care.
Our results highlight the need for population-based planning in developing systems of care. CSCs are resource-intensive, both in terms of physicians (neurology, neurosurgery, vascular surgery) and equipment (neurocritical care units, MRI, angiography suite).14 In addition, CSC certification requires a minimum volume of cases.14,27–29 As a result, the number of actual CSCs in the United States is likely to be much less than 20 per state. Dramatically increasing the number of CSCs is not the ideal way to improve access because it would be expensive and would result in lower case volumes at each center, potentially lowering quality of care. Given finite resources, it is critically important to locate CSCs in a way that maximizes population access. In most instances, the decision to pursue stroke center designation is at the discretion of individual hospitals/health care systems. Systems that develop organically are unlikely to be as effective or efficient as systems that are planned using data-driven methods. Our results demonstrate this in several important ways. First, the marginal increase in population access with each subsequent CSC falls dramatically. Second, population access often plateaus before all candidate hospitals are used. This suggests significant geographic clustering of candidate hospitals (PSCs), reducing the efficiency of potential systems. Increased access when candidate hospitals change from PSCs to any hospital with an ED also supports this notion. Third, access to care is highly variable. In particular, access is poor in the Stroke Belt states, 6 of which are below the national median despite a high regional burden of cerebrovascular disease. This suggests that systems that are allowed to develop without data-derived guidance may not meet population needs. Simulation studies such as ours allow for a comparison of stroke care systems across states. By highlighting variability, such studies should allow public health planners to identify areas with poor access and consider interventions to improve access in those areas. Greater access in states with EMS policies that preferentially route patients to stroke centers suggests that prehospital policy interventions may be one means to incentivize access. We are unable to determine whether this relationship is causal and EMS-based policy interventions may not produce the most efficient solution. Optimization modeling could be used to develop targeted interventions on selected facilities with the greatest impact on access to care. Population-based quality metrics could also be used to encourage nearby hospitals to work together to build systems of care with a population health focus.30
The observed association between access to CSCs and rurality is likely related to a lack of candidate hospitals in nonurban areas. Prior work, evaluating geographic accessibility of PSCs at the block group level, showed that PSC access is much lower in nonurban areas.31 There may be a higher burden of cerebrovascular disease per capita in rural areas, but because of low population density, the absolute number of cases is likely to be low. Systems planners will need to carefully assess the local need in rural areas to determine whether there is sufficient need to justify a CSC. If not, alternative strategies, such as PSCs and acute stroke–ready hospitals, may be used to provide basic stroke care, with telemedicine and rapid transfer protocols linking these hospitals to more distant CSCs.
In future work, we hope to incorporate other important elements of system design, such as differential capacity across hospitals, cost, and availability of health care resources. We also hope to consider local population demand or need for specialized care. Nonetheless, judgments will need to be made about whether centers should be located to have the maximal impact on the general population, which favors location in urban areas, or whether areas with high rates of disease should be prioritized. Some of these considerations will be highly region-specific, so the development of flexible tools that can be utilized by local policy-makers may have the greatest impact.
This study has several limitations that should be discussed. The empirically derived estimates underlying prehospital time calculations are approximations based on the trauma literature. Prehospital time intervals for stroke may differ slightly.32,33 This has the potential to introduce nondifferential measurement bias toward the null, but relative comparisons across geographic areas should remain valid. Our methods for calculating population access are based on where people live, not the location of strokes; however, it is estimated that >70% of strokes occur at home.34 In the primary analysis, candidate hospitals were limited to TJC-certified PSCs. This ensures that hospitals considered for CSC status have some baseline ability to provide acute stroke care. We did not account for PSCs certified by other agencies, including state health departments. There are 10 states with state-based stroke centers (CT, FL, MD, MA, NJ, NY, OK, TX, VA, WA).35 We likely underestimated CSC access in these states. Allowing hospitals certified by state-based programs to serve as candidate hospitals would increase CSC access in these states, but variability in how PSCs are defined and certified across states would limit the interpretability of these results. There may also be hospitals that are capable of functioning as a PSC or CSC that have chosen not to become certified by any mechanism. We are unable to identify these hospitals. Recognizing that our estimates are therefore an underestimate, we have also conducted a sensitivity analysis in which any hospital with an ED is a candidate, which shows the maximum potential CSC access in each state (table e-3). Greedy adding, in which optimally placed CSCs are added sequentially, may produce a solution that is suboptimal compared with placing all 20 CSCs simultaneously. Techniques for simultaneous optimization are extremely computationally intensive and not feasible for a national analysis. In addition, greedy algorithm solutions may be more realistic, since systems of care are likely to develop slowly over time. Estimates of geographic accessibility are imperfect. Population data are estimated at the block group level. Our calculations assume that all individuals in a block group have access if the block group centroid has access, even though some portion of the block group may be >60 minutes from a CSC. Similarly, we assume that no individuals in a block group have access if the block group centroid does not have access, even though some individuals in the block group may be ≤60 minutes from a CSC. The use of population-weighted centroids, rather than geographic centroids, should reduce the potential for error, but our estimates may either over- or underestimate geographic access. Also, geographic access may not accurately reflect realized access to care, which depends on a variety of additional social and demographic factors.36 Prior work, using data from a national cohort study, found that geography was the major determinate of evaluation at a PSC, validating the importance of geographic accessibility for acute stroke care.37
Mathematical optimization techniques and virtual trials can inform the development of systems of care for time-critical, unplanned illness. Even under optimal conditions, a large proportion of the US population will be unable to access a CSC within 60 minutes. Systems planning and policy initiatives that incentivize certification of selected hospitals should be considered to ensure maximum population benefit.
ACKNOWLEDGMENT
The authors thank the Cartographic Modeling Lab at the University of Pennsylvania, in particular Tara Jackson, Karl Dailey, Vicky Tam, and Krista Heinlen.
GLOSSARY
- CSC
comprehensive stroke center
- ED
emergency department
- EMS
emergency medical service
- IQR
interquartile range
- PSC
primary stroke center
- TJC
The Joint Commission
Footnotes
Editorial, page 1188
Supplemental data at Neurology.org
AUTHOR CONTRIBUTIONS
Michael T. Mullen, MD: drafting/revising the manuscript for content, study concept or design, analysis or interpretation of data, statistical analysis. Charles C. Branas, PhD: drafting/revising the manuscript for content, analysis or interpretation of data, study supervision or coordination, obtaining funding. Scott E. Kasner, MD, MS: drafting/revising the manuscript for content. Catherine Wolff, MS: drafting/revising the manuscript for content, analysis or interpretation of data, study concept or design. Justin C. Williams, PhD: drafting/revising the manuscript for content, study concept or design, analysis or interpretation of data. Karen C. Albright, MD, MPH: drafting/revising the manuscript for content. Brendan G. Carr, MD, MS: drafting/revising the manuscript for content, study concept or design, analysis or interpretation of data, study supervision or coordination, obtaining funding.
STUDY FUNDING
This research was supported by a grant from the Agency for Healthcare Research & Quality (R01HS010914, to Carr, Branas, Mullen, Williams, Kasner). Dr. Carr is funded by a career development award from the Agency for Healthcare Research and Quality (AHRQ) (K08 HS017960). The findings and conclusions in this report are those of the author and do not necessarily represent the views of the Department of Health and Human Services or its components. Dr. Albright is supported by awards 5 T32 HS013852-10 from AHRQ and 3 P60 MD000502-08S1 from The National Institute on Minority Health and Health Disparities, NIH. This content is solely the responsibility of the authors and does not necessarily represent the official views of the AHRQ or the NIH.
DISCLOSURE
M. Mullen receives funding from the Agency for Healthcare Research and Quality (AHRQ) for a grant on which this work is based. C. Branas receives funding from the AHRQ for a grant on which this work is based. S. Kasner receives funding from the AHRQ for a grant on which this work is based. C. Wolff reports no disclosures relevant to the manuscript. J. Williams receives funding from the AHRQ for a grant on which this work is based. K. Albright is funded by the AHRQ and NIH. B. Carr spends a portion of his time as a Senior Policy Analyst in the Office of the Assistant Secretary for Preparedness and Response. Go to Neurology.org for full disclosures.
REFERENCES
- 1.Go AS, Mozaffarian D, Roger VL, et al. Heart disease and stroke statistics—2013 update: a report from the American Heart Association. Circulation 2013;127:e6–e245. [DOI] [PMC free article] [PubMed] [Google Scholar]
- 2.Lees KR, Bluhmki E, von Kummer R, et al. Time to treatment with intravenous alteplase and outcome in stroke: an updated pooled analysis of ECASS, ATLANTIS, NINDS, and EPITHET trials. Lancet 2010;375:1695–1703. [DOI] [PubMed] [Google Scholar]
- 3.Saver JL. Time is brain—quantified. Stroke 2006;37:263–266. [DOI] [PubMed] [Google Scholar]
- 4.Barber PA, Zhang J, Demchuk AM, Hill MD, Buchan AM. Why are stroke patients excluded from TPA therapy? An analysis of patient eligibility. Neurology 2001;56:1015–1020. [DOI] [PubMed] [Google Scholar]
- 5.Chiu D, Krieger D, Villar-Cordova C, et al. Intravenous tissue plasminogen activator for acute ischemic stroke: feasibility, safety, and efficacy in the first year of clinical practice. Stroke 1998;29:18–22. [DOI] [PubMed] [Google Scholar]
- 6.O'Connor RE, McGraw P, Edelsohn L. Thrombolytic therapy for acute ischemic stroke: why the majority of patients remain ineligible for treatment. Ann Emerg Med 1999;33:9–14. [DOI] [PubMed] [Google Scholar]
- 7.Howard G. Why do we have a Stroke Belt in the southeastern United States? A review of unlikely and uninvestigated potential causes. Am J Med Sci 1999;317:160–167. [DOI] [PubMed] [Google Scholar]
- 8.Howard VJ, Kleindorfer DO, Judd SE, et al. Disparities in stroke incidence contributing to disparities in stroke mortality. Ann Neurol 2011;69:619–627. [DOI] [PMC free article] [PubMed] [Google Scholar]
- 9.Adams PF, Hendershot GE, Marano MA. Current estimates from the national health interview survey, 1996. Vital Health Stat 10 1999;(200):1–203. [PubMed] [Google Scholar]
- 10.Perry HM, Roccella EJ. Conference report on stroke mortality in the southeastern United States. Hypertension 1998;31:1206–1215. [DOI] [PubMed] [Google Scholar]
- 11.Rymer MM, Thrutchley DE. Organizing regional networks to increase acute stroke intervention. Neurol Res 2005;27(suppl 1):S9–S16. [DOI] [PubMed] [Google Scholar]
- 12.Schwamm LH. Recommendations for the establishment of stroke systems of care: recommendations from the American Stroke Association's Task Force on the Development of Stroke Systems. Circulation 2005;111:1078–1091. [DOI] [PubMed] [Google Scholar]
- 13.Alberts MJ, Latchaw RE, Jagoda A, et al. Revised and updated recommendations for the establishment of primary stroke centers: a summary statement from the brain attack coalition. Stroke 2011;42:2651–2665. [DOI] [PubMed] [Google Scholar]
- 14.Alberts MJ, Latchaw RE, Selman WR, et al. Recommendations for comprehensive stroke centers: a consensus statement from the Brain Attack Coalition. Stroke 2005;36:1597–1616. [DOI] [PubMed] [Google Scholar]
- 15.Higashida R, Alberts MJ, Alexander DN, et al. Interactions within stroke systems of care: a policy statement from the American Heart Association/American Stroke Association. Stroke 2013;44:2961–2984. [DOI] [PubMed] [Google Scholar]
- 16.Facts About Primary Stroke Centers [online]. 2011. Available at: http://www.jointcommission.org/facts_about_primary_stroke_center_certification/. Accessed June 28, 2012. [Google Scholar]
- 17.Mullen MT, Kasner SE, Kallan MJ, Kleindorfer DO, Albright KC, Carr BG. Joint Commission primary stroke centers utilize more rt-PA in the nationwide inpatient sample. J Am Heart Assoc 2013;2:e000071. [DOI] [PMC free article] [PubMed] [Google Scholar]
- 18.Prabhakaran S, McNulty M, O'Neill K, Ouyang B. Intravenous thrombolysis for stroke increases over time at primary stroke centers. Stroke 2012;43:875–877. [DOI] [PubMed] [Google Scholar]
- 19.Lichtman JH, Jones SB, Wang Y, Watanabe E, Leifheit-Limson E, Goldstein LB. Outcomes after ischemic stroke for hospitals with and without Joint Commission–certified primary stroke centers. Neurology 2011;76:1976–1982. [DOI] [PMC free article] [PubMed] [Google Scholar]
- 20.Xian Y, Holloway RG, Chan PS, et al. Association between stroke center hospitalization for acute ischemic stroke and mortality. JAMA 2011;305:373–380. [DOI] [PMC free article] [PubMed] [Google Scholar]
- 21.Carr BG, Caplan JM, Pryor JP, Branas CC. A meta-analysis of prehospital care times for trauma. Prehosp Emerg Care 2006;10:198–206. [DOI] [PubMed] [Google Scholar]
- 22.Branas CC, MacKenzie EJ, Williams JC, et al. Access to trauma centers in the United States. JAMA 2005;293:2626–2633. [DOI] [PubMed] [Google Scholar]
- 23.Carr BG, Branas CC, Metlay JP, Sullivan AF, Camargo CA., Jr Access to emergency care in the United States. Ann Emerg Med 2009;54:261–269. [DOI] [PMC free article] [PubMed] [Google Scholar]
- 24.Cormen TH, Leiserson CE, Rivest RL, Stein C. Greedy algorithms. In: Introduction to Algorithms, 2nd ed New York: McGraw-Hill Book Company/MIT Press; 2001:370–404. [Google Scholar]
- 25.Howard VJ, Cushman M, Pulley L, et al. The reasons for geographic and racial differences in stroke study: objectives and design. Neuroepidemiology 2005;25:135–143. [DOI] [PubMed] [Google Scholar]
- 26.Song S, Saver J. Growth of regional acute stroke systems of care in the United States in the first decade of the 21st century. Stroke 2012;43:1975–1978. [DOI] [PMC free article] [PubMed] [Google Scholar]
- 27.Bardach NS, Zhao S, Gress DR, Lawton MT, Johnston SC. Association between subarachnoid hemorrhage outcomes and number of cases treated at California hospitals. Stroke 2002;33:1851–1856. [DOI] [PubMed] [Google Scholar]
- 28.Holt PJ, Poloniecki JD, Loftus IM, Thompson MM. Meta-analysis and systematic review of the relationship between hospital volume and outcome following carotid endarterectomy. Eur J Vasc Endovasc Surg 2007;33:645–651. [DOI] [PubMed] [Google Scholar]
- 29.Saposnik G, Baibergenova A, O'Donnell M, Hill MD, Kapral MK, Hachinski V. Hospital volume and stroke outcome: does it matter? Neurology 2007;69:1142–1151. [DOI] [PubMed] [Google Scholar]
- 30.Institute of Medicine (IOM). Toward Quality Measures for Population Health and the Leading Health Indicators. Washington, DC: The National Academies Press; 2013. [PubMed] [Google Scholar]
- 31.Mullen MT, Bowman A, Wiebe D, et al. Disparities in access to primary stroke centers: geography not gender, race, or ethnicity. Stroke (in press).
- 32.Ramanujam P, Castillo E, Patel E, Vilke G, Wilson MP, Dunford JV. Prehospital transport time intervals for acute stroke patients. J Emerg Med 2009;37:40–45. [DOI] [PubMed] [Google Scholar]
- 33.Wojner-Alexandrov AW, Alexandrov AV, Rodriguez D, Persse D, Grotta JC. Houston Paramedic and Emergency Stroke Treatment and Outcomes Study (HoPSTO). Stroke 2005;36:1512–1518. [DOI] [PubMed] [Google Scholar]
- 34.Kelly-Hayes M, Wolf PA, Kase CS, Brand FN, McGuirk JM, D'Agostino RB. Temporal patterns of stroke onset: the Framingham Study. Stroke 1995;26:1343–1347. [DOI] [PubMed] [Google Scholar]
- 35.Centers for Disease Control and Prevention. A Summary of Primary Stroke Center Policy in the United States. Atlanta: Department of Health and Human Services; 2011. [Google Scholar]
- 36.Penchansky R, Thomas JW. The concept of access: definition and relationship to consumer satisfaction. Med Care 1981;19:127–140. [DOI] [PubMed] [Google Scholar]
- 37.Mullen MT, Judd S, Howard VJ, et al. Disparities in evaluation at certified primary stroke centers in a national cohort: Reasons for Geographic and Racial Differences in Stroke (REGARDS). Stroke 2013;44:1930–52. [DOI] [PMC free article] [PubMed] [Google Scholar]


