Abstract
Renal metabolism by UDP-glucuronosyltransferase (UGT) enzymes is central to the clearance of many drugs. However, significant discrepancies about the relative abundance and activity of individual UGT enzymes in the normal kidney prevail among reports, whereas glucuronidation in tumoral kidney has not been examined. In this study, we performed an extensive profiling of glucuronidation metabolism in normal (n = 12) and tumor (n = 14) kidneys using targeted mass spectrometry quantification of human UGTs. We then correlated UGT protein concentrations with mRNA levels assessed by quantitative polymerase chain reaction and with conjugation activity for the major renal UGTs. Beyond the wide interindividual variability in expression levels observed among kidney samples, UGT1A9, UGT2B7, and UGT1A6 are the most abundant renal UGTs in both normal and tumoral tissues based on protein quantification. In normal kidney tissues, only UGT1A9 protein levels correlated with mRNA levels, whereas UGT1A6, UGT1A9, and UGT2B7 quantification correlated significantly with their mRNA levels in tumor kidneys. Data support that posttranscriptional regulation of UGT2B7 and UGT1A6 expression is modulating glucuronidation in the kidney. Importantly, our study reveals a significant decreased glucuronidation capacity of neoplastic kidneys versus normal kidneys that is paralleled by drastically reduced UGT1A9 and UGT2B7 mRNA and protein expression. UGT2B7 activity is the most repressed in tumors relative to normal tissues, with a 96-fold decrease in zidovudine metabolism, whereas propofol and sorafenib glucuronidation is decreased by 7.6- and 5.2-fold, respectively. Findings demonstrate that renal drug metabolism is predominantly mediated by UGT1A9 and UGT2B7 and is greatly reduced in kidney tumors.
Introduction
Kidneys mediate excretion of polar drugs and metabolites through urine and are an important site of inactivation of drugs, hormones, lipids, and other endogenous compounds (Anders, 1980; Shipkova et al., 2001; Gaganis et al., 2007; Chu et al., 2009). The contribution of renal UDP-glucuronosyltransferases (UGTs) to the maintenance of renal homeostasis and metabolic drug clearance is increasingly appreciated (Chu et al., 2009; Knights and Miners, 2010; Gundert-Remy et al., 2014). Renal conjugation contributes to the clearance of many drugs, including the nonsteroidal anti-inflammatory drugs such as S-naproxen and ibuprofen, the GABAA receptor agonist and sleeping aid gaboxadol, the anesthetic propofol, and the immunosuppressant drug mycophenolic acid (MPA). Other studies further support that renal glucuronidation surpasses that in the liver for the clearance of propofol, gaboxadol, MPA, and several other drugs (McGurk et al., 1998; Gaganis et al., 2007; Knights et al., 2013).
The expression of UGTs by liver and kidney tissues is variable. Of the 19 documented UGT enzymes, 13 are appreciably expressed in the liver, the main site of glucuronidation of drugs, whereas only 4 are documented to be significantly expressed in the kidney (Knights and Miners, 2010; Guillemette et al., 2014). These observations are based on polymerase chain reaction (PCR) quantification of mRNAs (Sutherland et al., 1993; McGurk et al., 1998; Nakamura et al., 2008; Ohno and Nakajin, 2009; Court et al., 2012), immunohistochemistry detection of UGTs (Gaganis et al., 2007; Bellemare et al., 2011), assessment of conjugation activity toward specific substrates (Gaganis et al., 2007; Chu et al., 2009; Menard et al., 2013), and more recently quantification of UGT proteins by targeted proteomics (Harbourt et al., 2012; Sato et al., 2012; Fallon et al., 2013a,b; Sato et al., 2014). UGT1A9 and UGT2B7 appear as the major UGTs expressed in the kidney. A number of other UGTs are expressed at lower levels, including UGT1A5, UGT1A6, UGT1A7, and UGT2B4, but conflicting results have arisen from different quantification methods (reviewed by Knights and Miners, 2010). In situ analysis of UGT1A and UGT2B7 expression has exposed a heterogeneous localization of renal expression, with strongest expression in the proximal convoluted tubules. Additionally, strong to weak expression has been documented in the cortex and medulla. Only the glomerulus and Bowman’s capsule are devoid of UGT expression (Gaganis et al., 2007; Bellemare et al., 2011). Developmental stage and disease state further affect UGT expression in tissues, and this has was recently documented in the kidney (Menard et al., 2013). Indeed, fetal and tumor kidney tissues display a differential expression pattern for UGT2B7 caused by the differential usage of alternate promoters (Menard et al., 2013). Despite these several studies, none have been conducted to systematically compare UGT mRNA and protein expression and their relationship to enzyme activity.
It was therefore the goal of this study to address UGT mRNA and protein expression profiles in normal and tumoral kidney tissues and determine their value as predictors of drug metabolizing capacity by correlating expression levels with glucuronidation activity using probe substrates. The glucuronidation profiles of 26 discrete kidneys samples (12 normal and 14 tumoral) were established by targeted protein quantification, mRNA quantification, and glucuronidation activity to reveal important contributions of UGT1A9, UGT2B7, and UGT1A6 in the normal kidney. However, drastically reduced UGT expression and function were revealed in kidney tumors.
Materials and Methods
Tissue Collections and Homogenates
Normal (n = 12) and neoplastic (adenocarcinoma, clear cell) kidney samples (n = 14) from male and female subjects, including nine matched normal peritumoral and tumor pairs, were obtained from the Tissue Procurement services at the University of North Carolina Lineberger Comprehensive Cancer Center (Chapel Hill, NC) and have been described (Menard et al., 2013). All subjects provided written consent for the use of their tissues for experimental purposes, and the Institutional Review Board approved the project. Kidney homogenates were prepared in phosphate-buffered saline containing 0.5 mM dithiothreitol as described below and protein concentration was determined by a bicinchoninic acid assay (ThermoFisher Scientific, Ottawa, ON, Canada).
Absolute Quantification by Multiple Reaction Monitoring
Fourteen UGT1A and UGT2B proteins were quantified using targeted quantitative proteomics as described (Fallon et al., 2013b). Signature peptides are given in Supplemental Table 1. All UGTs were quantified with the exception of UGT2B11, UGT2B28, and UGT2As for which specific signature peptides are not available. Before quantification, kidney homogenates were diluted to ∼10 mg/ml with phosphate-buffered saline/0.5 mM dithiothreitol and then further diluted with 50 mM ammonium bicarbonate to 1 mg/ml. For all samples except one, 20 µg of homogenized proteins was denatured, reduced, carbamidomethylated, and then digested with trypsin (Fallon et al., 2013b); 18 µg of homogenized proteins was used for the additional sample. Quantification was also assessed in two commercial protein lysates of paired normal and tumoral kidney tissues purchased from Oncogene (Rockville, MD), similarly diluted and digested. A mixture of stable isotope labeled standard peptides (Thermo Biopolymers, Ulm, Germany) corresponding to the selected signature peptides of each UGT was added to each sample. Quantitative analysis was achieved on a nanoACQUITY binary pump system coupled to a QTRAP 5500 mass spectrometer (ABSCIEX, Framingham, MA), using two multiple reaction monitoring transitions to quantify each UGT, as described recently (Fallon et al., 2013b) (Supplemental Table 1). Limit of detection was 0.2 pmol/mg proteins for all UGTs with the exception of UGT1A9, for which it was 1.0 pmol/mg protein.
Quantification of UGT1A and UGT2B7 mRNAs by Quantitative PCR
Total RNA from 25–35 mg kidney tissue was extracted using TriReagent and following recommendation of the manufacturer (Sigma-Aldrich, St. Louis, MO). The integrity of all RNA samples was verified using an Agilent 2100 Bioanalyzer (Agilent Technologies, Santa Clara, CA), and those with an RNA integrity number above 6 were used for further analysis. cDNA was synthesized from 1 µg total RNA using Superscript III (Life Technologies, Burlington, ON, Canada) and 125 pmol p(dN)6 random hexamers (Roche Diagnostics, Laval, QC, Canada). Quantitative PCR reactions were conducted in triplicates in an ABI7000 thermal cycler (Life Technologies) with 12.5 ng cDNA in a final volume of 15 µl containing 7.5 µl Sybr Green PCR Master Mix and 125–200 nM primers (Life Technologies). Cycling conditions were as follows: 10 minutes, 95°C; 40 cycles of 95°C for 15 seconds, 58–60°C for 1 minute; final melting curve of 95°C for 15 seconds, 60°C for 1 minute, and 95°C for 15 seconds. The list of primer pairs and specific amplification conditions are given in Supplemental Table 2. Quantitative PCR data for each UGT (CtUGT) were normalized with 36B4 as an internal amplification standard (CtUGT − Ct36B4 = ΔCtUGT), and were then normalized with ΔCt values (ΔCtLow) of the sample expressing lowest levels of UGTs to determine ΔΔCtUGT. The relative quantification was determined using the equation 2−ΔΔCtUGT, as described (Livak and Schmittgen, 2001).
Glucuronidation Activity
Glucuronidation assays were conducted on kidney tissue homogenates with a panel of UGT probe substrates: bilirubin, deferiprone [3-hydroxy-1,2-dimethylpyridin-4(1H)-one], propofol (diisopropylphenol), and zidovudine (azidothymidine, AZT) were from Sigma-Aldrich, mycophenolic acid was from MP Biomedicals (Solon, OH), tacrolimus was from Cell Signaling Technologies (Danvers, MA), and sorafenib (4-[4-[[4-chloro-3-(trifluoromethyl)phenyl]carbamoylamino] phenoxy]-N-methyl-pyridine-2-carboxamide) was from Toronto Research Chemicals (Toronto, ON, Canada). Glucuronidation assays were performed in triplicate as described (Lepine et al., 2004; Benoit-Biancamano et al., 2009). Briefly, each enzymatic assay was conducted in a final volume of 100 µl and contained kidney tissue homogenates corresponding to 50 µg proteins. Probe substrate final assay concentrations and incubation times were as follows: bilirubin, 10 µM, 10 minutes; deferiprone, 20 mM, 60 minutes; propofol, 50 µM, 30 minutes; AZT, 500 µM, 60 minutes; MPA, 100 µM, 60 minutes; tacrolimus, 200 µM, 60 minutes; sorafenib, 200 µM, 60 minutes. Glucuronide products were measured by mass spectrometry-based methods as described (Lepine et al., 2004; Thibaudeau et al., 2006; Belanger et al., 2009).
Statistical Analysis
Statistical significance between normal and tumor kidneys for UGT protein concentration, mRNA expression levels, and glucuronidation activity was determined by a paired Mann-Whitney statistical test (*P ≤ 0.05; **P ≤ 0.01; ***P ≤ 0.001) using GraphPad Prism (GraphPad Software, La Jolla, CA). Statistical correlation scores between protein concentration, mRNA expression levels and activity were determined by a Spearman correlation test using XLSTAT (Addinsoft, New York, NY).
Results
Quantitative Profiling of UGTs in Human Kidney Tissues
UGT Protein Concentration in Normal and Tumor Kidneys Measured by Mass Spectrometry.
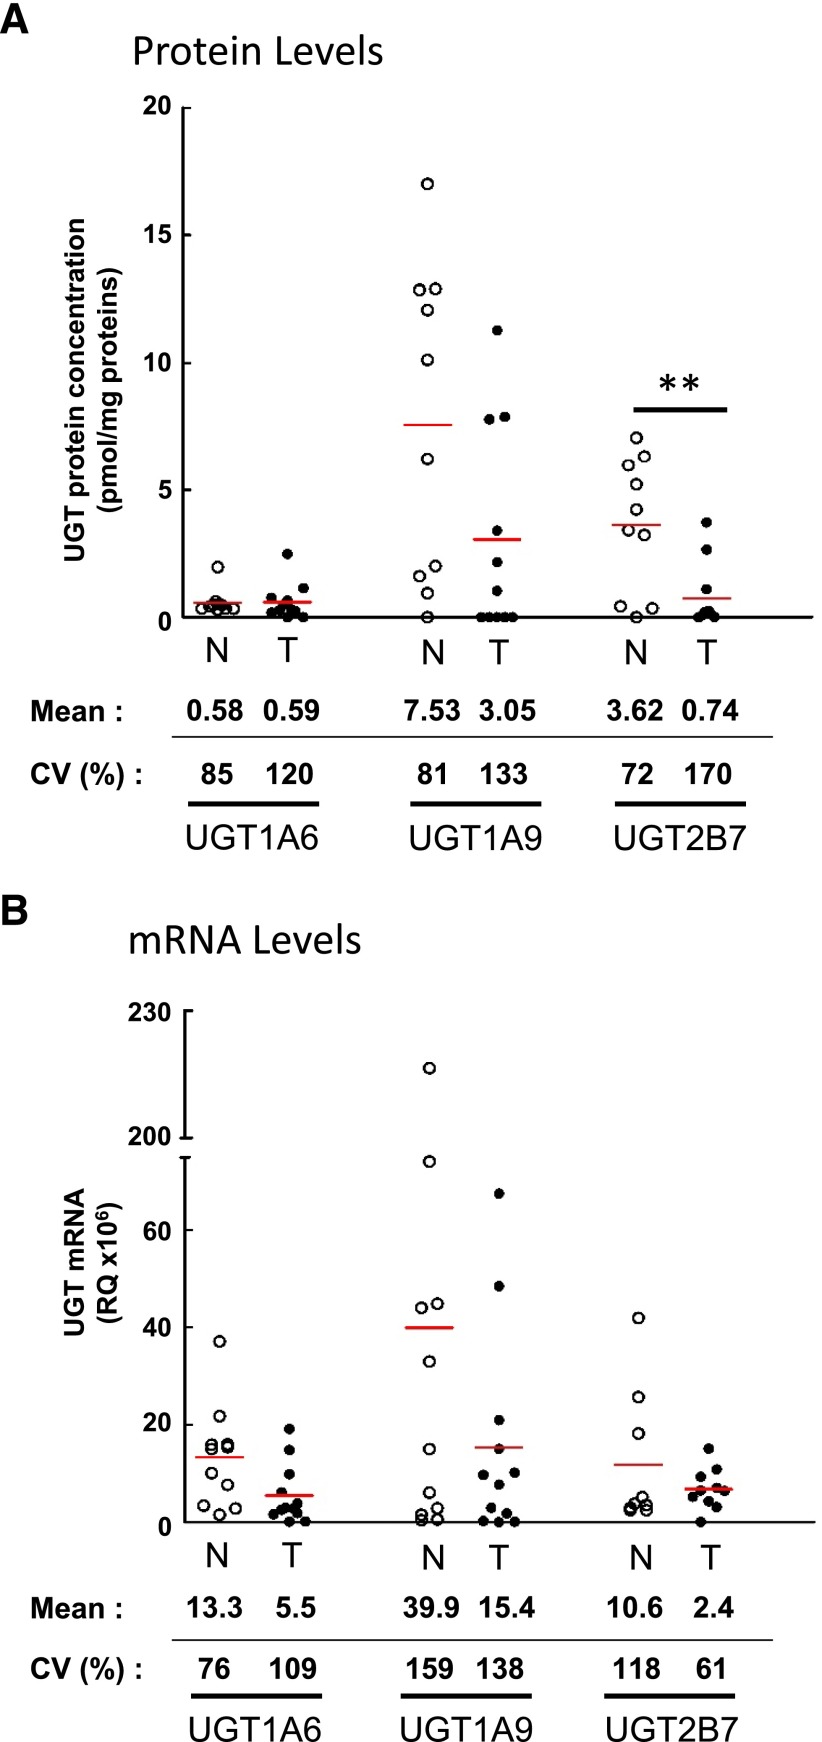
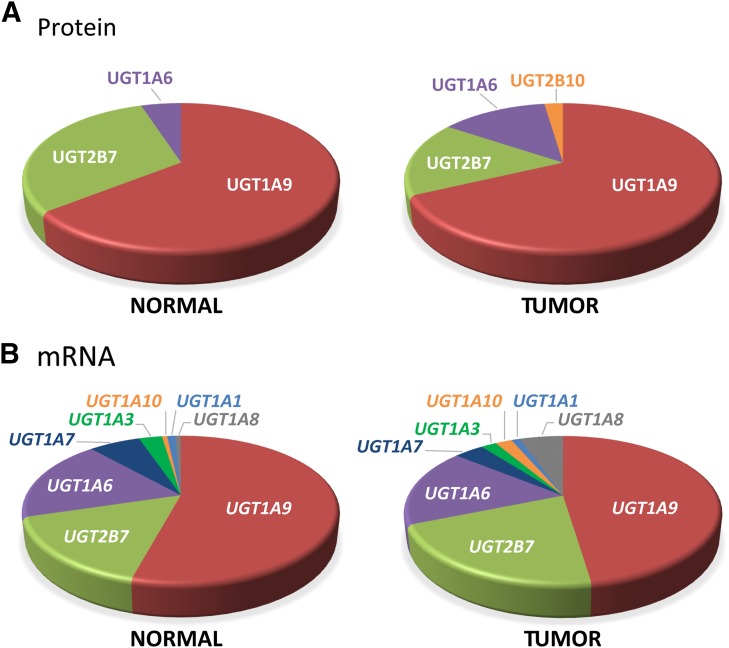
Signature peptides specific to each UGT were used to determine expression levels of UGTs in 10 normal and 11 tumoral tissues. Based on absolute protein concentrations, UGT1A9, UGT2B7, and UGT1A6 were the predominant UGT proteins expressed in both normal and tumoral kidney tissues (Fig. 1A). The relative abundance of UGT1A9 and UGT2B7 was considerably reduced between normal and tumoral tissues (Figs. 1A and 2A). The average concentrations of UGT2B7 and UGT1A9 in normal kidney homogenates were 3.6 and 7.5 pmol/mg proteins, respectively. However, 4.9 (P = 0.007)- and 2.5 (P = 0.06)-fold lower concentrations were found in kidney tumor tissues versus normal tissues, whereas UGT1A6 levels remained unchanged (P = 0.46) (Figs. 1A and 2A; Table 1). Of note, UGT1A10 was detected in two tumor samples. UGT1A3, 1A4, 1A5, 1A7, 1A8, 2B4, 2B10, 2B15, and 2B17 were below limits of detection or undetected. In both normal and tumoral tissues, interindividual variability was notable, especially for UGT1A9, for which five individuals expressed levels above 10 pmol/mg proteins whereas five others had low or undetectable levels.
Fig. 1.
Expression profiles of UGTs in normal and tumoral kidneys. (A) Absolute quantification of protein concentrations determined by multiple reaction monitoring in normal (n = 10) and tumoral (n = 11) kidney homogenates. (B) Relative expression of UGT mRNA levels established by reverse transcription-quantitative PCR in normal (n = 11) and tumoral (n = 12) kidneys. mRNA quantification of UGTs used a general strategy enabling amplification of all known variants. N, normal kidneys (○); T, tumoral kidneys (●). Mean protein concentrations (pmol/mg proteins) and mRNA relative quantification (×106) of each UGT are given below the graph, as well as coefficients of variation (CV) among normal and tumoral samples. Detailed quantification data are given in Tables 1 and 2. **, P≤0.01.
Fig. 2.
Relative UGT expression in normal and tumoral kidneys. (A) Relative protein concentrations of quantified UGTs in normal and tumoral kidneys, based on average concentrations from data shown in Fig. 1A and Tables 1 and 2. (B) Relative UGT mRNA expression in normal and tumoral kidneys based on reverse transcription-quantitative PCR quantification data shown in Fig. 1B and Tables 1 and 2.
TABLE 1.
UGT protein concentrations in normal and tumor kidney homogenates
| UGT | Normal |
Tumor |
||||||||||||
|---|---|---|---|---|---|---|---|---|---|---|---|---|---|---|
| UGT positive tissuesa | Min | Max | Average | S.D. | ALT CVb | CV | UGT positive tissues | Min | Max | Average | S.D. | ALT CV | CV | |
| % | pmol/mg proteins | % | % | pmol/mg proteins | % | |||||||||
| 1A6 | 100 | 0.30 | 1.97 | 0.58 | 0.50 | 85 | 85 | 72 | 0.00 | 2.48 | 0.59 | 0.71 | 93 | 120 |
| 1A9 | 80 | 0.00 | 17.00 | 7.53 | 6.16 | 63 | 81 | 54 | 0.00 | 11.27 | 3.05 | 4.06 | 71 | 133 |
| 2B7 | 90 | 0.00 | 7.05 | 3.62 | 2.62 | 60 | 72 | 45 | 0.00 | 3.72 | 0.74 | 1.27 | 97 | 170 |
% Tissues with levels above limit of detection.
% Alternative (ALT) coefficients of variation (CV), calculated for tissues above limit of detection.
UGT mRNA Levels in Normal and Tumor Kidneys.
UGTs detected in kidneys by targeted mass spectrometry were also assessed by quantitative PCR of reverse-transcribed mRNA isolated from the same kidney samples. For UGT1 transcripts, this quantification was based on the specific amplification of exons 1. For UGT2B7, the strategies relied on amplification of exons 2 and 3, present in all known variants. Interindividual variability observed at the protein concentration level was also a prominent feature of UGT mRNA expression (Fig. 1B). Relative quantification of UGT mRNA expression indicates that in both normal and tumoral kidney tissues, UGT1A6, UGT1A9, and UGT2B7 were the predominant mRNA species (Figs. 1B and 2B). UGT1A3 and UGT1A7 were also expressed at a low but appreciable level (Fig. 2B; Table 2). In line with UGT protein concentrations, the relative amount of all UGT mRNAs was reduced in tumor samples, in particular UGT1A9 (Fig. 1B, Table 2).
TABLE 2.
Expression levels of UGT mRNAs in normal and tumor kidneys
| Gene | Normal |
Tumor |
||||||||
|---|---|---|---|---|---|---|---|---|---|---|
| Min | Max | Average | S.D. | CV | Min | Max | Average | S.D. | CV | |
| RQ × 103 | % | RQ × 103 | % | |||||||
| UGT1A1 | 96 | 1991 | 759 | 619 | 82 | 65 | 1037 | 338 | 306 | 91 |
| UGT1A3 | 261 | 4893 | 2113 | 1598 | 76 | 29 | 1964 | 621 | 570 | 92 |
| UGT1A6 | 1580 | 37112 | 13385 | 10,234 | 76 | 155 | 19197 | 5555 | 6057 | 109 |
| UGT1A7 | 231 | 12264 | 4686 | 4229 | 90 | 44 | 4797 | 1194 | 1609 | 135 |
| UGT1A8 | 107 | 1071 | 487 | 342 | 70 | 52 | 18821 | 1751 | 5377 | 307 |
| UGT1A9 | 488 | 216460 | 39942 | 63346 | 159 | 72 | 67481 | 15440 | 21298 | 138 |
| UGT1A10 | 136 | 991 | 473 | 354 | 75 | 22 | 4787 | 670 | 1393 | 208 |
| UGT2B7 (ex1–2) | 232 | 44548 | 10597 | 15760 | 149 | 45 | 11058 | 2387 | 3419 | 143 |
| UGT2B7 (ex2–3) | 2506 | 41922 | 11852 | 14001 | 118 | 122 | 15154 | 6847 | 4210 | 61 |
CV, coefficients of variation; RQ, relative quantity; ex, exons.
UGT-Specific Glucuronidation Activity and Relationship with Protein and mRNA Levels.
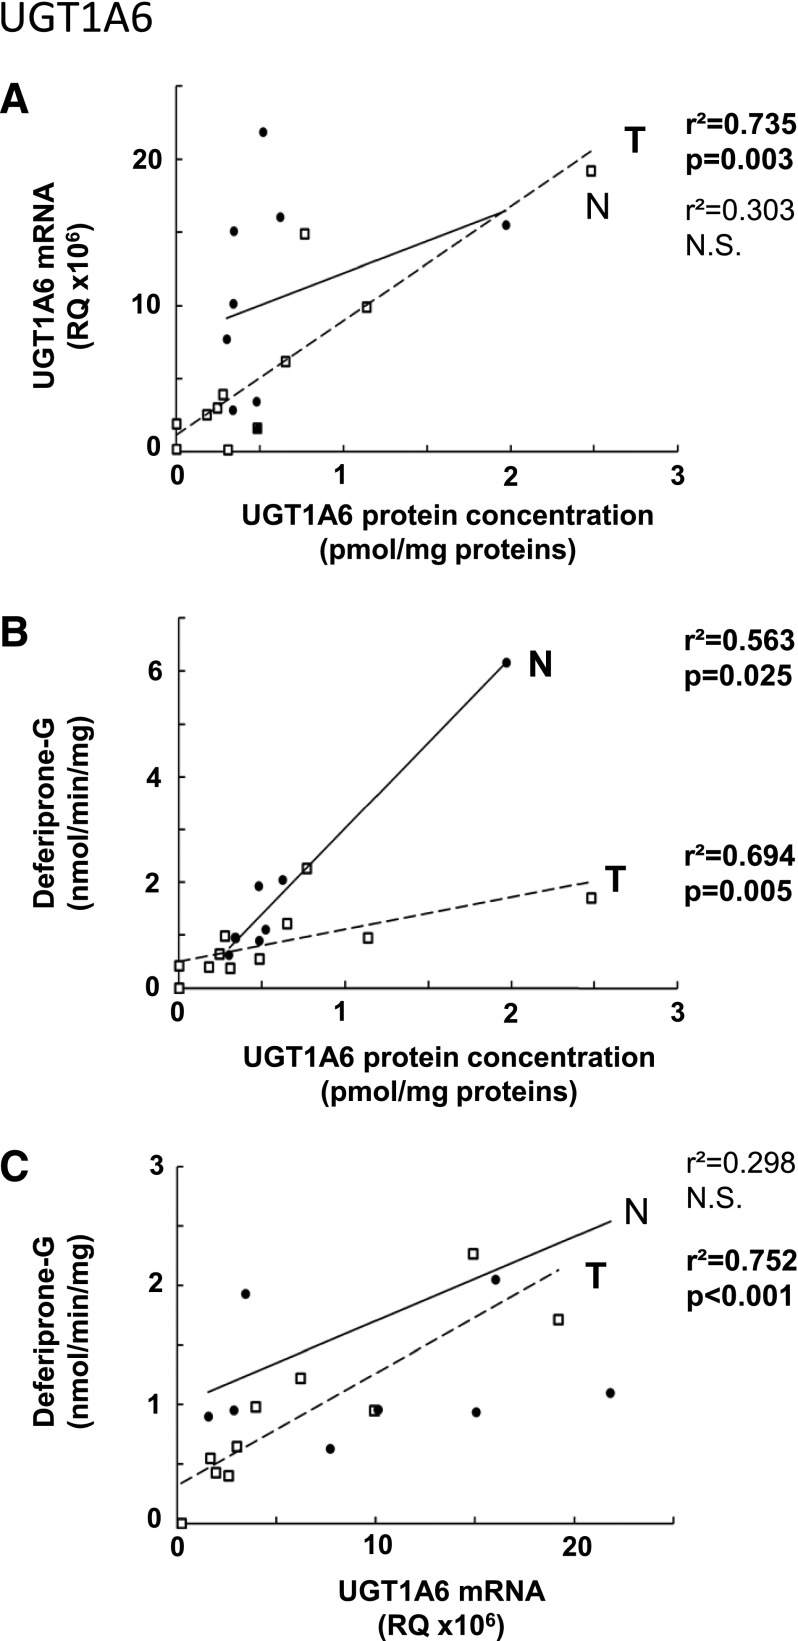
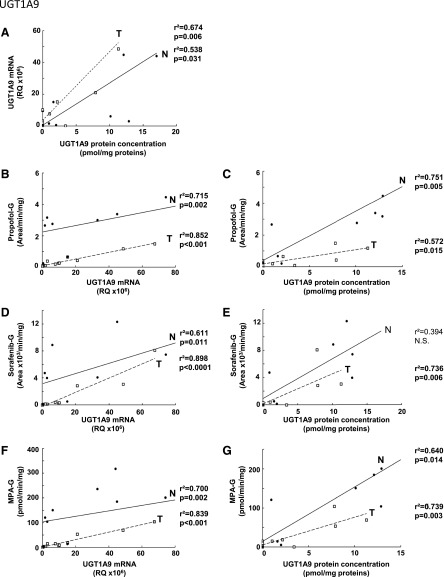
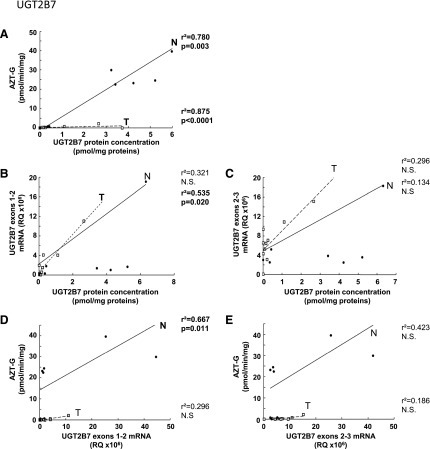
Glucuronidation activity in kidney tissues was assessed using probe substrates for several UGTs, including tacrolimus (UGT1A4), deferiprone (UGT1A6) (Benoit-Biancamano et al., 2009), propofol, sorafenib, and mycophenolic acid (UGT1A9), and zidovudine or AZT (UGT2B7). Conjugating activity was measured in 12 normal and 14 tumoral kidney tissues. Glucuronidation of tacrolimus was not detected in any kidney samples, in line with the undetected UGT1A4 protein by mass spectrometry. Glucuronidation activity was detected for all other substrates, as expected from the expression levels of the UGTs responsible for conjugating each substrate (Fig. 3; Table 3). The glucuronidation activity of UGT1A6 (deferiprone) was similar between normal and tumor kidney tissues (Fig. 3A) and correlated well with protein concentrations (Fig. 4B). However, mRNA levels correlated with UGT1A6 protein concentration and activity only in tumor tissues and not in normal tissues (Fig. 4, A and C). Glucuronidation of UGT1A9 substrates propofol, sorafenib, and MPA were significantly reduced in kidney tumors, by 7.6-, 5.2-, and 6.4-fold. respectively, relative to normal tissues (Fig. 3, B–D). This decreased glucuronidation capacity is further emphasized when only paired normal and tumor samples are considered (sorafenib, 10.3-fold, P = 0.01; propofol, 8.7-fold, P = 0.008; MPA, 9.0-fold, P = 0.02). There were significant correlations between UGT1A9 metabolism of propofol, MPA, and sorafenib and UGT1A9 protein concentration and mRNA levels, in both normal and tumor kidney tissues (Fig. 5). Glucuronidation of AZT (UGT2B7 substrate) was the most drastically impaired in tumor relative to normal kidney tissues, with a 96-fold overall decrease and a 148-fold decrease (P = 0.002) for paired tissues (Fig. 3E). The concentration of UGT2B7 protein correlated significantly with AZT glucuronidation in both normal and tumor kidney tissue samples (Fig. 6A). On the other hand, UGT2B7 activity correlated with mRNA levels only in normal kidney tissues and only when UGT2B7 mRNA levels were measured by a strategy assessing the classic exon 1 comprised in mRNA transcripts encoding the UGT2B7 enzyme (Fig. 6D). There was a lack of correlation between mRNA levels assessed by a global strategy targeting exons 2–3 (common to all mRNA transcripts derived from the UGT2B7 gene) and AZT glucuronidation (Fig. 6E) or UGT2B7 protein concentration (Fig. 6C) in both normal and tumoral tissues. UGT2B7 mRNA levels determined by the exons 1–2 strategy correlated with UGT2B7 protein concentration only in tumor tissues (Fig. 6B).
Fig. 3.
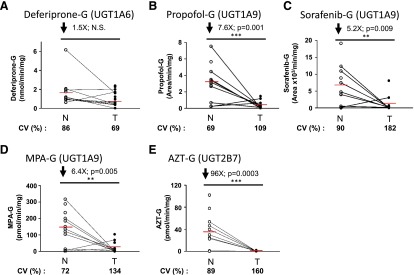
Glucuronidation is impaired in tumor kidneys. Glucuronidation activity in normal and tumoral kidney homogenates for deferiprone (A), propofol (B), sorafenib (C), mycophenolic acid (D) (specifically the formation of MPA-G), and zidovudine (E). N, normal kidneys homogenates (n = 12), ○; T, tumoral kidney homogenates (n = 14), ●. Paired normal and tumoral samples are connected with a black line. Coefficients of variation (CV) among normal and tumoral samples are given. Detailed quantification data are given in Table 3. **P≤0.01; ***P≤0.001; N.S. not significant.
TABLE 3.
Glucuronidation activity of kidney homogenate samples for listed probe substrates
| Substrate | Normal |
Tumor |
||||||||
|---|---|---|---|---|---|---|---|---|---|---|
| Min | Max | Average | S.D. | CV | Min | Max | Average | S.D. | CV | |
| % | % | |||||||||
| Deferiprone-G (nmol/min per mg) | 0.7 | 6.2 | 1.7 | 1.5 | 86 | 0.01 | 2.4 | 1.1 | 0.8 | 69 |
| Propofol-G (area/min per mg) | 0.2 | 7.5 | 3.1 | 2.2 | 69 | 0.01 | 1.5 | 0.4 | 0.4 | 109 |
| Sorafenib-G (area/min per mg) | 33 | 19133 | 6558 | 5940 | 91 | 0 | 8083 | 1257 | 2295 | 183 |
| MPA-G (pmol/min per mg) | 1.0 | 318 | 147 | 106 | 72 | 0.1 | 104 | 23 | 31 | 134 |
| AZT-G (pmol/min per mg) | 0.01 | 102.0 | 35.1 | 31.4 | 89 | 0.00 | 2.2 | 0.4 | 0.6 | 160 |
CV, coefficients of variation.
Fig. 4.
Correlation between UGT1A6 protein and mRNA levels (A); protein levels and deferiprone glucuronidation activity (B); mRNA levels and deferiprone glucuronidation activity (C) in normal (N, ●) and tumor (T, □) kidneys. The correlation coefficients r2 were determined using a Spearman correlation test. N.S., not significant.
Fig. 5.
Correlation between UGT1A9 protein and mRNA levels (A); mRNA levels and glucuronidation activity of propofol (B), sorafenib (D), and mycophenolic acid (F); protein levels and glucuronidation activity of propofol (C), sorafenib (E), and mycophenolic acid (G) in normal (N, ●) and tumor (T, ⬜) kidneys. The correlation coefficients r2 were determined using a Spearman correlation test. N.S., not significant.
Fig. 6.
Correlation between UGT2B7 protein concentration and zidovudine glucuronidation activity (A); mRNA and protein levels (B, C); mRNA levels and zidovudine glucuronidation activity (D, E) in normal (N, ●) and tumor (T, ⬜) kidneys. mRNA levels were determined for all variants using an exon 2–3 amplification strategy (B and C) or only for active variants using an exon 1-2 strategy (D and E). The correlation coefficients r2 were determined using a Spearman correlation test. N.S., not significant.
Discussion
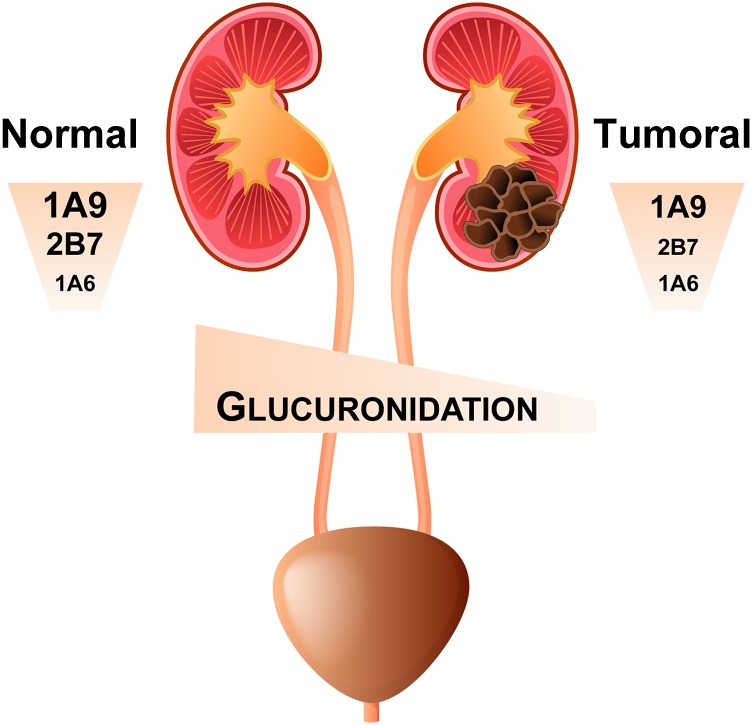
This study portrays UGT expression and glucuronidation activity in the kidney and addresses for the first time the difference in UGT expression and activity between normal and tumor kidney tissues (Fig. 7). In both normal and tumor kidneys, UGT1A9 mRNA and protein levels predominate, and this is well reflected by the high conjugating capacity of its probe substrates propofol as well as the anticancer agent sorafenib. UGT2B7 is a major expressed and active UGT enzyme only in normal kidneys. This high UGT1A9 and UGT2B7 expression is in line with previous reports based on mRNA expression levels and protein concentrations in normal kidney microsomes (Nakamura et al., 2008; Ohno and Nakajin, 2009; Harbourt et al., 2012; Fallon et al., 2013a; Sato et al., 2014). We also observed that all individuals expressed low but significant amounts of UGT1A6 and conjugating activity toward the probe substrate deferiprone (Benoit-Biancamano et al., 2009). All kidney samples were devoid of UGT1A1 expression, supported by a lack of bilirubin-conjugating activity. These findings are in agreement with previous mRNA (Nakamura et al., 2008; Ohno and Nakajin, 2009) and absolute protein quantification analyses (Fallon et al., 2013a). None of the individuals expressed UGT1A4, based on protein levels and activity toward the probe substrate tacrolimus, in contrast to previous mRNA quantifications (Nakamura et al., 2008; Ohno and Nakajin, 2009). All expressed kidney UGTs displayed a high degree of interindividual variability, as previously observed in other drug metabolizing tissues. Some variability may arise from the sex of the donors, which could not be taken into account due to the limited number of individuals, as well as from the site of biopsy sampling, because the kidney is characterized by a structural heterogeneity that is paralleled by variable UGT expression within the kidney structures (Gaganis et al., 2007; Knights and Miners, 2010; Bellemare et al., 2011).
Fig. 7.
Graphical summary. Glucuronidation activity in the normal kidney is governed by UGT1A9, UGT2B7, and to a lesser extent by UGT1A6. However, UGT expression and glucuronidation activity are significantly reduced in tumor kidney tissues, with potential clinical implications for disease treatment.
Our study further reports the first assessment of UGT expression and activity in kidney tumor tissues. It demonstrates a drastically reduced conjugation capacity of kidney tumors for propofol, sorafenib, MPA, and zidovudine, owing to considerably decreased UGT1A9 and UGT2B7 gene and protein expression in tumor relative to normal tissues. In contrast, UGT1A6 protein expression and activity were similar in normal and tumor kidney tissues. This analysis included paired peritumoral and tumoral tissues, enhancing the strength of this assessment. We also establish that the glucuronidation of the tyrosine kinase inhibitor sorafenib is significantly reduced in tumors compared with normal kidney tissues. The decreased glucuronidation activity of kidney tumors relative to normal tissues is of particular relevance in advanced renal clear cell carcinoma treatment strategies, given that sorafenib is an important renal carcinoma anticancer agent (Escudier et al., 2007; Zustovich et al., 2011). It is primarily metabolized by CYP3A4 and UGT1A9 in the liver, but its renal metabolism has not been assessed (Keating and Santoro, 2009; Ye et al., 2014). The biologic impact of locally reduced glucuronidation capacity in diseased tissues remains to be examined but could be of clinical relevance to susceptibility to kidney cancer or treatment of kidney cancer. The important loss of UGT1A9- and UGT2B7-conjugating activity in tumor kidneys is in line with the reduced expression of several UGT1A and UGT2B7 observed at both mRNA and protein levels in hepatocellular carcinomas (Strassburg et al., 1997; Yan et al., 2014; Ye et al., 2014), UGT1A10 and UGT2B7 in breast cancer tissues (Starlard-Davenport et al., 2008), as well as UGT2B7 mRNA and glucuronidation activity in kidney tumors (Menard et al., 2013). However, some UGTs (UGT1A, UGT2B7, UGT2B15, and UGT2B17) are increased in other types of cancers, including those from the endometrium and in patients with acute myeloid leukemia and chronic lymphocytic leukemia, and emerge as a feature associated with drug resistance (Lepine et al., 2010; Dellinger et al., 2012; Gruber et al., 2013; Zahreddine et al., 2014), supporting the relevance to develop analytical tools that accurately establish the glucuronidation activity of various tissues.
Although our absolute quantification of UGT proteins was conducted in kidney homogenates, they are well in line with previous reports that assessed UGT concentrations in normal kidney microsomes (Harbourt et al., 2012; Fallon et al., 2013a; Sato et al., 2014). Indeed, UGT1A9 protein concentration is 13.0-fold and 2.1-fold higher than UGT1A6 and UGT2B7, respectively, as observed by others (Fallon et al., 2013a; Sato et al., 2014). Our absolute quantification of UGTs in kidney homogenates generally lies in the 10% range of that measured in microsomes by others, consistent with the lower UGT protein concentration measured in human liver S9 fractions being 10–15% that of liver microsomes (Fallon et al., 2013b). Therefore, in our study, the use of homogenates may have limited the quantitative assessment of minor UGTs such as UGT1A5, previously detected in human kidney microsomes (Harbourt et al., 2012), and of UGT1A10, which were detected in two kidney samples in our study. However, actual tissue samples from patients with diseases of interest are potentially of higher translational relevance.
As previously reported for several UGTs in other organs, there is a clear discrepancy between mRNA expression and protein concentration or UGT activity, supporting that posttranscriptional events are important modulators of UGT protein expression and activity. This has been highlighted in previous studies addressing alternative splicing of UGT mRNA transcripts. For instance, our previous work supports that alternative splicing modulates UGT2B7 activity, as there was a good correlation between exon 1–containing mRNA levels and conjugating activity in normal kidney tissues but not with total mRNA levels (assessed by an exons 2–3 strategy) (Fig. 6). The correlation with exon 1–containing mRNAs was lost in tumoral kidney tissues, indicating that alternative splicing or other posttranscriptional events are occurring, as previously proposed (Menard et al., 2013). On the other hand, protein concentrations correlated well with activity for most abundant enzymes, indicating that absolute protein quantification is therefore a good surrogate for predicting the activity of UGT1A6, UGT1A9, and UGT2B7.
In conclusion, this study characterized for the first time UGT mRNA, protein, and enzymatic activity in normal and tumor kidneys and reveals that the predominant UGTs in normal kidneys, namely UGT1A9 and UGT2B7, are significantly reduced in tumor tissues (Fig. 7). Our observations highlight that the glucuronidating activity of tumor tissues, such as for the anticancer agent sorafenib, is strongly suppressed relative to normal tissues, with potential impact on tumor response or adverse effects. It further documents a high interindividual variability in the expression of UGTs and in particular for UGT1A9. The regulation of UGT and glucuronidation in kidneys remains to be examined, but our study pinpoints posttranscriptional events such as alternative splicing as important contributors of this variability in normal tissues. Nonetheless, the mechanism resulting in the repression of UGT expression and activity in tumorigenic tissues remains to be characterized.
Supplementary Material
Abbreviations
- AZT
zidovudine
- MPA
mycophenolic acid
- PCR
polymerase chain reaction
- UGT
UDP-glucuronosyltransferase
Authorship Contributions
Conducted experiments: Margaillan, Fallon, Caron, Villeneuve, Turcotte.
Contributed new reagents: Smith, Joy.
Participated in research design: Guillemette.
Performed data analysis: Margaillan, Rouleau, Fallon, Caron, Villeneuve, Turcotte, Smith, Joy, Guillemette.
Wrote or contributed to the writing of the manuscript: Margaillan, Rouleau, Guillemette.
Footnotes
This work was supported by the Canadian Institutes of Health Research (CIHR) [MOP-42392]; the Natural the Sciences and Engineering Research Council of Canada [CG086976]; the Canada Research Chair in Pharmacogenomics (Tier I); the Fonds d’enseignement et de recherche, Laval University (graduate scholarship); and supported in part by the National Institutes of Health Division of Research Resources [Instrumentation Grant S10-RR024595].
 This article has supplemental material available at dmd.aspetjournals.org.
References
- Anders MW. (1980) Metabolism of drugs by the kidney. Kidney Int 18:636–647. [DOI] [PubMed] [Google Scholar]
- Bélanger AS, Caron P, Harvey M, Zimmerman PA, Mehlotra RK, Guillemette C. (2009) Glucuronidation of the antiretroviral drug efavirenz by UGT2B7 and an in vitro investigation of drug-drug interaction with zidovudine. Drug Metab Dispos 37:1793–1796. [DOI] [PMC free article] [PubMed] [Google Scholar]
- Bellemare J, Rouleau M, Harvey M, Popa I, Pelletier G, Têtu B, Guillemette C. (2011) Immunohistochemical expression of conjugating UGT1A-derived isoforms in normal and tumoral drug-metabolizing tissues in humans. J Pathol 223:425–435. [DOI] [PubMed] [Google Scholar]
- Benoit-Biancamano MO, Connelly J, Villeneuve L, Caron P, Guillemette C. (2009) Deferiprone glucuronidation by human tissues and recombinant UDP glucuronosyltransferase 1A6: an in vitro investigation of genetic and splice variants. Drug Metab Dispos 37:322–329. [DOI] [PubMed] [Google Scholar]
- Chu XY, Liang Y, Cai X, Cuevas-Licea K, Rippley RK, Kassahun K, Shou M, Braun MP, Doss GA, Anari MR, et al. (2009) Metabolism and renal elimination of gaboxadol in humans: role of UDP-glucuronosyltransferases and transporters. Pharm Res 26:459–468. [DOI] [PubMed] [Google Scholar]
- Court MH, Zhang X, Ding X, Yee KK, Hesse LM, Finel M. (2012) Quantitative distribution of mRNAs encoding the 19 human UDP-glucuronosyltransferase enzymes in 26 adult and 3 fetal tissues. Xenobiotica 42:266–277. [DOI] [PubMed] [Google Scholar]
- Dellinger RW, Matundan HH, Ahmed AS, Duong PH, Meyskens FL., Jr (2012) Anti-cancer drugs elicit re-expression of UDP-glucuronosyltransferases in melanoma cells. PLoS ONE 7:e47696. [DOI] [PMC free article] [PubMed] [Google Scholar]
- Escudier B, Eisen T, Stadler WM, Szczylik C, Oudard S, Siebels M, Negrier S, Chevreau C, Solska E, Desai AA, et al. TARGET Study Group (2007) Sorafenib in advanced clear-cell renal-cell carcinoma. N Engl J Med 356:125–134. [DOI] [PubMed] [Google Scholar]
- Fallon JK, Neubert H, Goosen TC, Smith PC. (2013a) Targeted precise quantification of 12 human recombinant uridine-diphosphate glucuronosyl transferase 1A and 2B isoforms using nano-ultra-high-performance liquid chromatography/tandem mass spectrometry with selected reaction monitoring. Drug Metab Dispos 41:2076–2080. [DOI] [PMC free article] [PubMed] [Google Scholar]
- Fallon JK, Neubert H, Hyland R, Goosen TC, Smith PC. (2013b) Targeted quantitative proteomics for the analysis of 14 UGT1As and -2Bs in human liver using NanoUPLC-MS/MS with selected reaction monitoring. J Proteome Res 12:4402–4413. [DOI] [PubMed] [Google Scholar]
- Gaganis P, Miners JO, Brennan JS, Thomas A, Knights KM. (2007) Human renal cortical and medullary UDP-glucuronosyltransferases (UGTs): immunohistochemical localization of UGT2B7 and UGT1A enzymes and kinetic characterization of S-naproxen glucuronidation. J Pharmacol Exp Ther 323:422–430. [DOI] [PubMed] [Google Scholar]
- Gruber M, Bellemare J, Hoermann G, Gleiss A, Porpaczy E, Bilban M, Le T, Zehetmayer S, Mannhalter C, Gaiger A, et al. (2013) Overexpression of uridine diphospho glucuronosyltransferase 2B17 in high-risk chronic lymphocytic leukemia. Blood 121:1175–1183. [DOI] [PubMed] [Google Scholar]
- Guillemette C, Lévesque É, Rouleau M. (2014) Pharmacogenomics of human uridine diphospho-glucuronosyltransferases and clinical implications. Clin Pharmacol Ther 96:324–339. [DOI] [PubMed] [Google Scholar]
- Gundert-Remy U, Bernauer U, Blömeke B, Döring B, Fabian E, Goebel C, Hessel S, Jäckh C, Lampen A, Oesch F, et al. (2014) Extrahepatic metabolism at the body’s internal-external interfaces. Drug Metab Rev 46:291–324. [DOI] [PubMed] [Google Scholar]
- Harbourt DE, Fallon JK, Ito S, Baba T, Ritter JK, Glish GL, Smith PC. (2012) Quantification of human uridine-diphosphate glucuronosyl transferase 1A isoforms in liver, intestine, and kidney using nanobore liquid chromatography-tandem mass spectrometry. Anal Chem 84:98–105. [DOI] [PMC free article] [PubMed] [Google Scholar]
- Keating GM, Santoro A. (2009) Sorafenib: a review of its use in advanced hepatocellular carcinoma. Drugs 69:223–240. [DOI] [PubMed] [Google Scholar]
- Knights KM, Miners JO. (2010) Renal UDP-glucuronosyltransferases and the glucuronidation of xenobiotics and endogenous mediators. Drug Metab Rev 42:63–73. [DOI] [PubMed] [Google Scholar]
- Knights KM, Rowland A, Miners JO. (2013) Renal drug metabolism in humans: the potential for drug-endobiotic interactions involving cytochrome P450 (CYP) and UDP-glucuronosyltransferase (UGT). Br J Clin Pharmacol 76:587–602. [DOI] [PMC free article] [PubMed] [Google Scholar]
- Lépine J, Audet-Walsh E, Grégoire J, Têtu B, Plante M, Ménard V, Ayotte P, Brisson J, Caron P, Villeneuve L, et al. (2010) Circulating estrogens in endometrial cancer cases and their relationship with tissular expression of key estrogen biosynthesis and metabolic pathways. J Clin Endocrinol Metab 95:2689–2698. [DOI] [PubMed] [Google Scholar]
- Lépine J, Bernard O, Plante M, Têtu B, Pelletier G, Labrie F, Bélanger A, Guillemette C. (2004) Specificity and regioselectivity of the conjugation of estradiol, estrone, and their catecholestrogen and methoxyestrogen metabolites by human uridine diphospho-glucuronosyltransferases expressed in endometrium. J Clin Endocrinol Metab 89:5222–5232. [DOI] [PubMed] [Google Scholar]
- Livak KJ, Schmittgen TD. (2001) Analysis of relative gene expression data using real-time quantitative PCR and the 2(-Delta Delta C(T)) Method. Methods 25:402–408. [DOI] [PubMed] [Google Scholar]
- McGurk KA, Brierley CH, Burchell B. (1998) Drug glucuronidation by human renal UDP-glucuronosyltransferases. Biochem Pharmacol 55:1005–1012. [DOI] [PubMed] [Google Scholar]
- Ménard V, Lévesque E, Chen S, Eap O, Joy MS, Ekström L, Rane A, Guillemette C. (2013) Expression of UGT2B7 is driven by two mutually exclusive promoters and alternative splicing in human tissues: changes from prenatal life to adulthood and in kidney cancer. Pharmacogenet Genomics 23:684–696. [DOI] [PubMed] [Google Scholar]
- Nakamura A, Nakajima M, Yamanaka H, Fujiwara R, Yokoi T. (2008) Expression of UGT1A and UGT2B mRNA in human normal tissues and various cell lines. Drug Metab Dispos 36:1461–1464. [DOI] [PubMed] [Google Scholar]
- Ohno S, Nakajin S. (2009) Determination of mRNA expression of human UDP-glucuronosyltransferases and application for localization in various human tissues by real-time reverse transcriptase-polymerase chain reaction. Drug Metab Dispos 37:32–40. [DOI] [PubMed] [Google Scholar]
- Sato Y, Nagata M, Kawamura A, Miyashita A, Usui T. (2012) Protein quantification of UDP-glucuronosyltransferases 1A1 and 2B7 in human liver microsomes by LC-MS/MS and correlation with glucuronidation activities. Xenobiotica 42:823–829. [DOI] [PubMed] [Google Scholar]
- Sato Y, Nagata M, Tetsuka K, Tamura K, Miyashita A, Kawamura A, Usui T. (2014) Optimized methods for targeted peptide-based quantification of human uridine 5′-diphosphate-glucuronosyltransferases in biological specimens using liquid chromatography-tandem mass spectrometry. Drug Metab Dispos 42:885–889. [DOI] [PubMed] [Google Scholar]
- Shipkova M, Strassburg CP, Braun F, Streit F, Gröne HJ, Armstrong VW, Tukey RH, Oellerich M, Wieland E. (2001) Glucuronide and glucoside conjugation of mycophenolic acid by human liver, kidney and intestinal microsomes. Br J Pharmacol 132:1027–1034. [DOI] [PMC free article] [PubMed] [Google Scholar]
- Starlard-Davenport A, Lyn-Cook B, Radominska-Pandya A. (2008) Novel identification of UDP-glucuronosyltransferase 1A10 as an estrogen-regulated target gene. Steroids 73:139–147. [DOI] [PMC free article] [PubMed] [Google Scholar]
- Strassburg CP, Manns MP, Tukey RH. (1997) Differential down-regulation of the UDP-glucuronosyltransferase 1A locus is an early event in human liver and biliary cancer. Cancer Res 57:2979–2985. [PubMed] [Google Scholar]
- Sutherland L, Ebner T, Burchell B. (1993) The expression of UDP-glucuronosyltransferases of the UGT1 family in human liver and kidney and in response to drugs. Biochem Pharmacol 45:295–301. [DOI] [PubMed] [Google Scholar]
- Thibaudeau J, Lépine J, Tojcic J, Duguay Y, Pelletier G, Plante M, Brisson J, Têtu B, Jacob S, Perusse L, et al. (2006) Characterization of common UGT1A8, UGT1A9, and UGT2B7 variants with different capacities to inactivate mutagenic 4-hydroxylated metabolites of estradiol and estrone. Cancer Res 66:125–133. [DOI] [PubMed] [Google Scholar]
- Yan T, Gao S, Peng X, Shi J, Xie C, Li Q, Lu L, Wang Y, Zhou F, Liu Z, et al. (2014) Significantly decreased and more variable expression of major cyps and ugts in liver microsomes prepared from HBV-positive human hepatocellular carcinoma and matched pericarcinomatous tissues determined using an isotope label-free UPLC-MS/MS method. Pharm Res, in press. [DOI] [PMC free article] [PubMed]
- Ye L, Yang X, Guo E, Chen W, Lu L, Wang Y, Peng X, Yan T, Zhou F, Liu Z. (2014) Sorafenib metabolism is significantly altered in the liver tumor tissue of hepatocellular carcinoma patient. PLoS ONE 9:e96664. [DOI] [PMC free article] [PubMed] [Google Scholar]
- Zahreddine HA, Culjkovic-Kraljacic B, Assouline S, Gendron P, Romeo AA, Morris SJ, Cormack G, Jaquith JB, Cerchietti L, Cocolakis E, et al. (2014) The sonic hedgehog factor GLI1 imparts drug resistance through inducible glucuronidation. Nature 511:90–93. [DOI] [PMC free article] [PubMed] [Google Scholar]
- Zustovich F, Lombardi G, Pastorelli D, Farina P, Bianco MD, De Zorzi L, Palma MD, Nicoletto O, Zagonel V. (2011) Clinical experience and critical evaluation of the role of sorafenib in renal cell carcinoma. Open Access J Urol 3:69–82. [DOI] [PMC free article] [PubMed] [Google Scholar]
Associated Data
This section collects any data citations, data availability statements, or supplementary materials included in this article.


