Significance
Here we use newly available methods to examine the dynamical association between cosmic rays (CR) and global temperature (GT) in the 20th-century observational record. We find no measurable evidence of a causal effect linking CR to the overall 20th-century warming trend; however, on short interannual timescales, we find a significant, although modest, causal effect of CR on short-term, year-to-year variability in GT. Thus, although CR clearly do not contribute measurably to the 20th-century global warming trend, they do appear as a nontraditional forcing in the climate system on short interannual timescales, providing another interesting piece of the puzzle in our understanding of factors influencing climate variability.
Keywords: climate variability, cosmic rays, global temperature, causality, convergent cross mapping
Abstract
As early as 1959, it was hypothesized that an indirect link between solar activity and climate could be mediated by mechanisms controlling the flux of galactic cosmic rays (CR) [Ney ER (1959) Nature 183:451–452]. Although the connection between CR and climate remains controversial, a significant body of laboratory evidence has emerged at the European Organization for Nuclear Research [Duplissy J, et al. (2010) Atmos Chem Phys 10:1635–1647; Kirkby J, et al. (2011) Nature 476(7361):429–433] and elsewhere [Svensmark H, Pedersen JOP, Marsh ND, Enghoff MB, Uggerhøj UI (2007) Proc R Soc A 463:385–396; Enghoff MB, Pedersen JOP, Uggerhoj UI, Paling SM, Svensmark H (2011) Geophys Res Lett 38:L09805], demonstrating the theoretical mechanism of this link. In this article, we present an analysis based on convergent cross mapping, which uses observational time series data to directly examine the causal link between CR and year-to-year changes in global temperature. Despite a gross correlation, we find no measurable evidence of a causal effect linking CR to the overall 20th-century warming trend. However, on short interannual timescales, we find a significant, although modest, causal effect between CR and short-term, year-to-year variability in global temperature that is consistent with the presence of nonlinearities internal to the system. Thus, although CR do not contribute measurably to the 20th-century global warming trend, they do appear as a nontraditional forcing in the climate system on short interannual timescales.
The basic principles behind a possible connection between galactic cosmic rays (CR) and global temperature (GT) are as follows: It has been known since the invention of the cloud chamber in 1911 by Charles Thomson Rees Wilson that ionizing radiation leads to atmospheric cloud nucleation. Although the prime source of ionizing radiation in the global troposphere is CR, the flux of CR reaching the troposphere depends on the solar wind. The solar wind is a stream of ionized gases that blows outward from the Sun, and its intensity varies strongly with the level of surface activity on the Sun. The Earth's magnetic field shields the planet from much of the solar wind, deflecting that wind like water around the bow of a ship. When solar activity is great, the solar wind is strong, swiping away CR arriving at the top of the atmosphere. These CR are hypothesized to affect cloud formation and cloudiness, and therefore GT. The net radiative effect of cloudiness depends on the difference between incoming solar radiation and outgoing long-wave radiation. Increased cloudiness in the upper troposphere reduces outgoing long-wave radiation, thereby resulting in warming of the planet. Increased cloudiness in the lower troposphere causes less incoming radiation, and therefore cooling of the planet. Data suggest (6) that the amount of CR is positively correlated with the amount of low-level clouds but has no effect on middle- or high-level clouds. Although this is still an open question (7, 8), the reduction in flux in CR in times of high solar activity is hypothesized to result in less cloud nucleation and fewer cloud condensation nuclei, and consequently, reduced low-level cloud amounts. This, in turn, leads to a higher solar radiation flux at the Earth’s surface, and warmer temperatures. Conversely, a weaker solar wind results in cooler temperatures. The actual chemical processes and reactions involved in this problem are complex, but a growing body of experimental and theoretical work has uncovered a chemical pathway by which CR ionization may increase nucleation rates to levels appropriate for cloud condensation nuclei (2–5, 9–11 and references therein). This suggests a superficially simple network linking the Sun, CR, and global climate, with the interaction between the Sun and CR having a potential influence on the climate system. However reasonable this may be, as described in a 2006 review (12), “The suggested mechanisms are, however, too complex to evaluate meaningfully at present.”
Data Analysis and Results
In this article, we use a recently developed method to examine the causal connection, as it exists, between CR and GT in the observational record. To date, attempts at finding observational evidence for the link between solar activity/CR and climate have relied on simple linear cross correlation or spectral coherence analysis (6, 13–17). Although suggestive, it is well known that such statistical analyses cannot actually establish causation and, indeed, can be highly misleading in moderate to weakly coupled nonlinear dynamical systems, where “mirage correlations” (spurious correlations that come and go and even change sign) are common (18). Indeed, the singular case in which correlation is valid in nonlinear dynamical systems would require strong coupling (so-called synchrony) between the solar-mediated CR forcing and the climate system, which is unlikely on decadal timescales because of embedded nonlinearities in the climate system. Thus, to test for causal linkage between CR and GT, we apply a recently developed method, convergent cross mapping (CCM) (18), which is based on empirical dynamic modeling (18–20), as described here. This method is specifically designed to measure causality in nonlinear dynamical systems.
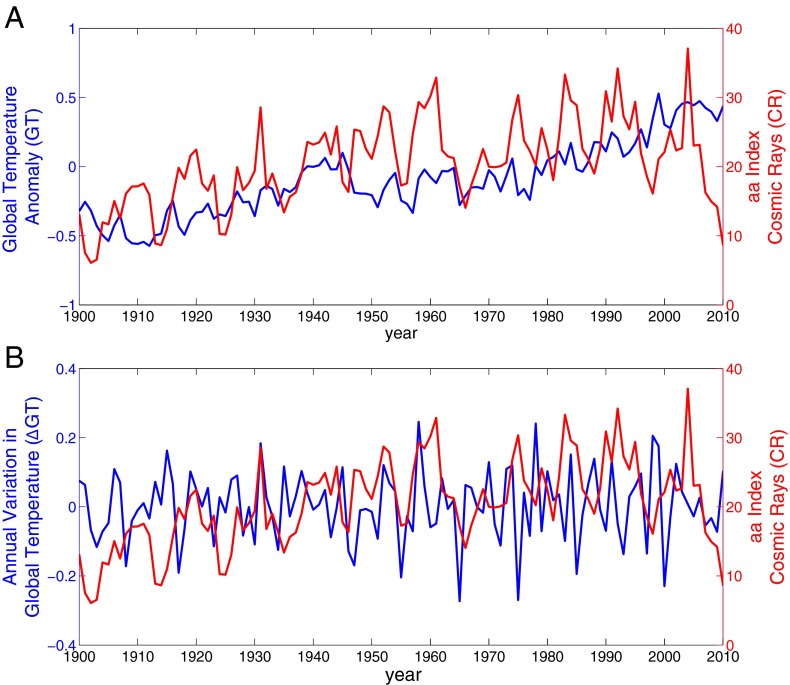
For this analysis, we use the aa index (21) as the CR proxy. This index is a well-documented proxy that characterizes magnetic activity resulting from the interaction between solar wind and Earth’s magnetic field (stronger solar wind → stronger magnetic disturbances → higher aa index). The GT record we used is the HadCRUT3 set of the United Kingdom’s Met Office. There is increasing uncertainty before 1900 in both data series, so we confine our analysis to the post-1900 period and use yearly averages. The chosen interval represents a compromise between noise in the data and sample size. Both time series exhibit a positive trend; however, the GT warming trend is more distinct and dominates the much smaller superimposed interannual fluctuations (Fig. 1A). This is in contrast to the CR record, in which large interannual variation dominates the 20th-century signal.
Fig. 1.
(A) Annual values for the aa index (CR proxy) and normalized GT, and (B) annual variations (first-differences) in GT (ΔGT) and CR. Despite a correlation between the CR and raw GT time series (ρ = 0.38), there is no measureable dynamic causality on the century-long timescale (Fig. 4). However, on the annual timescale, even though CR and ΔGT are not correlated (ρ = 0.02), evidence suggests they are dynamically coupled (Fig. 3).
CCM is a new methodological approach that can help distinguish causality from spurious correlation in time series from dynamical systems (18). The technique is based on the idea that causation can be established if states of the causal variable can he recovered from time series of the affected variable. For example, if past sea surface temperatures can be estimated from time series of sardine abundance, temperature had a measurable and recoverable influence on the population dynamics of sardines (18). The idea is based on empirical dynamics (18–20) and a theorem proven by Takens (22), which states that the essential information of a multidimensional dynamical system is retained in the time series of any single variable of that system. Thus, CCM uses Takens’ theorem to detect whether two variables belong to the same dynamical system. Effectively, if variable X is influencing Y, then causality is established if states of the causal variable X can be recovered from the time series history of Y. Simply put, CCM measures the extent to which the historical record of the affected variable Y (or its proxies) reliably estimates states of a causal variable X (or its proxies), which is quantified by calculating the correlation coefficient ρ between predicted and observed X. If the skill of cross mapping increases with the length of the time series, a direct or indirect causal effect of X on Y can be inferred. The relative level to which predictive skill converges (“CCM skill” hereafter) can be viewed as an estimator of the strength of the causal link. Convergence occurs with additional data as the underlying attractor manifold becomes denser and the nearest neighbors get closer. The essential mechanics of CCM are detailed in Sugihara and colleagues (18) and are summarized in three 1-min animations (Movies S1–S3).
CCM can identify bidirectional causality when variables are mutually coupled [the primary case covered by Takens (22)], as well as unidirectional causality when X influences Y but Y has no effect on X, as occurs when X is an external forcing variable. As explained in Sugihara and colleagues (18), CCM applies in dynamical systems, in contrast to Granger causality (23) framework (SI Appendix), which is aimed at purely stochastic systems that exhibit linear “separability” (independence between variables), in which case, Takens’ theorem does not apply. Specifically, CCM addresses cases not covered by Granger involving interdependent (nonlinear) dynamical systems (i.e., cases in which Granger’s assumption of separable piecewise independence is explicitly violated).
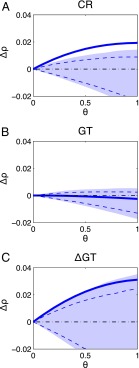
To verify we are dealing with a nonlinear dynamical system, rather than a purely stochastic one, we analyze each time series separately, using S-maps, a simple test for nonlinear dynamics based on the relative ability to predict on the basis of a linear stochastic (AR model) versus an analogous nonlinear model (19, 20) (SI Appendix). Evidence for nonlinear dynamics is demonstrated if forecast performance improves as the S-map model is tuned toward nonlinear solutions (θ > 0, where θ is the nonlinear tuning parameter). The results presented in Fig. 2 show that although CR and ΔGT both exhibit evidence for nonlinear dynamics, the raw GT time series does not. It is likely that evidence for nonlinearity is masked by the strong linear trend dominating the raw GT record over the course of the 20th century. However, Fig. 2C shows that the nonlinear dynamics in temperature variability for this period can be unmasked by taking first the differences of GT. That is, although the strong overall 20th-century warming trend (linear trend ρ = 0.8) lacks the signature of nonlinear dynamics, year-to-year temperature variability (ΔGT) shows evidence of nonlinear dynamics operating on the annual timescale. The S-map test also demonstrates nonlinear dynamics in the CR (aa) record, where the relatively rapid nontrend fluctuations are large compared with the secular increase. Thus, the best result with CCM (tests for nonlinear dynamic coupling between variables) should be expected when testing for causality between first-differenced GT (year-to-year temperature variability or ΔGT) and the raw CR time series.
Fig. 2.
The S-map analysis of (A) the CR time series (aa proxy), (B) the GT time series, and (C) the first-differenced ΔGT time series. Δρ is the difference in the correlation between actual and predicted values between a linear model (global linear map) and an equivalent nonlinear model (local or nonlinear mappings). In a sense, it is a measure of the curvature of the manifold. Evidence for nonlinear dynamics is demonstrated if predictability improves as the S-map model parameter θ is tuned toward nonlinear solutions (θ > 0). The shaded area is the 5th/95th and the dashed blue line the 10th/90th percentile confidence intervals using surrogate data (see Data Analysis and Results). The figure shows that although CR and ΔGT both show statistical nonlinear state-dependent dynamics, the raw GT time series does not.
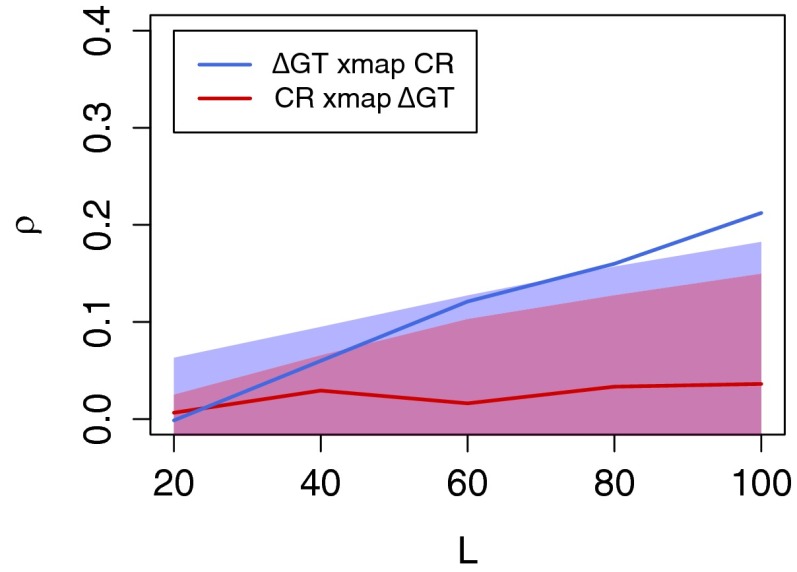
Fig. 3 shows the CCM results. More specifically, it shows the correlation coefficient between actual and predicted values (ρ) as a function of sample size L when CR cross maps ΔGT (red) and when ΔGT cross maps CR (blue). Here, the optimum embedding dimension is E = 5 (SI Appendix, Fig. S1), and the optimal time lags used for CR cross mapping ΔGT and for ΔGT cross mapping CR are 3 and −2, respectively (SI Appendix, Fig. S3). These lags are based on maximizing cross map signal strength (i.e., maximizing cross map correlations). Clearly, there is no evidence for a causal effect of ΔGT on CR, as witnessed by the lack of convergence (no cross map improvement as the sample size increases) when cross mapping from CR to ΔGT. This indicates (as one should expect) that information about GT is not present in the CR time series. However, cross mapping from ΔGT to CR succeeds. We observe convergence as L increases, indicating that information about CR is recoverable in the ΔGT record. Thus, CCM shows that there is a modest causal effect of CR on annual GT fluctuations.
Fig. 3.
Results of CCM analysis between the CR time series and the annual variations in GT (ΔGT). Although there is no correlation between these variables (ρ = 0.02), convergence (increasing and significant ρ with longer time series; blue line) suggests that year-to-year changes in GT are causally forced by galactic CR (i.e., ΔGT cross maps CR, information about CR is encoded in ΔGT). As explained in the text, a comparison with phase randomized surrogate data (shaded areas) shows that this result is significant at the 5% level and is independently confirmed with AR1 surrogates (SI Appendix, Fig. S4). Lack of convergence (red line) confirms, as expected, that ΔGT has no causal influence on CR.
These results are qualitatively robust to choice of embedding dimension (e.g., SI Appendix, Figs. S4 and S5) and are statistically significant (P < 0.05). The first surrogate data analysis shown in Fig. 2 involves standard phase randomized surrogates (n = 1,000) generated by inverting the spectra for ΔGT and CR and randomizing the phases (24). The blue shaded area depicts the 0.05 and 0.95 intervals of CCM results for observed ΔGT cross mapping surrogate CR, and the red shaded area shows the actual CR cross mapping surrogate ΔGT. Again, this result is robust, with SI Appendix, Fig. S4 providing independent verification when surrogates are generated as best-fit autoregressive one (AR1) time series. Finally, as a null check, we applied CCM analysis to the CR time series and to annual variations in GT (ΔGT) generated by the Community Climate Systems Model 4 of the National Center for Atmospheric Research, an Intergovernmental Panel of Climate Change (IPCC) Fifth Assessment Report model lacking any mechanism for CR to affect temperature. As expected (SI Appendix, Fig. S6), there is no significant cross mapping between the historical CR time series and ΔGT from the model. As a further check, in SI Appendix, Fig. S7, cross mapping results are shown as observed versus predicted along the CR time series (the overall correlation coefficient is 0.20 in accordance with the blue line in Fig. 3). In addition, in SI Appendix, Fig. S8, cross mapping is done with sixfold cross validation, where the cross map period is held out of sample from the libraries used to predict the out-of-sample period. We observe that in five of six subperiods, the correlation coefficient between actual and predicted values is positive, as one would expect when CR causes ΔGT. Given the small sample sizes involved, as well as the fact that the effect of CR on ΔGT is weak to moderate, this result provides additional support for causality between CR and ΔGT.
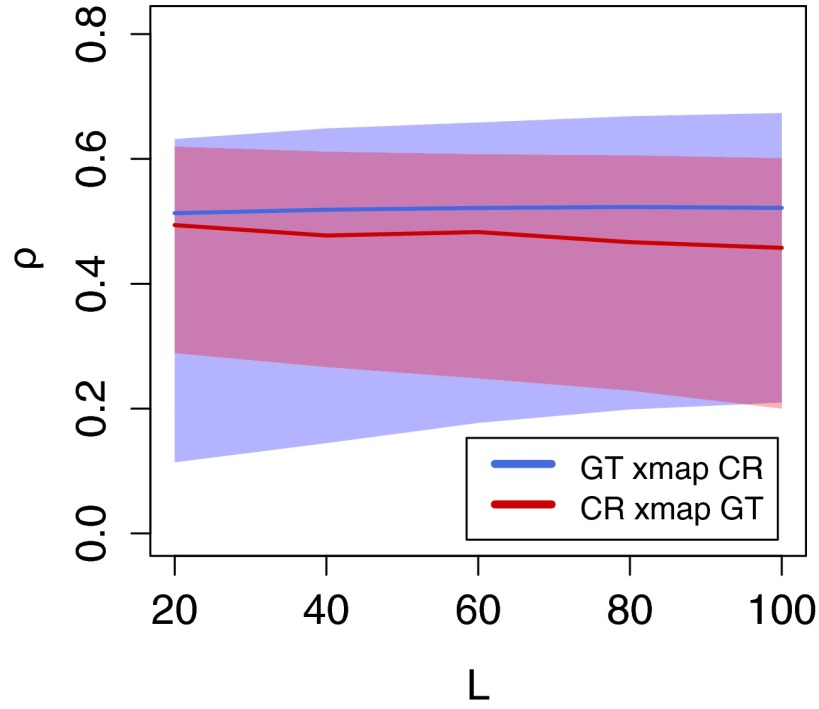
As might be expected from the S-map analysis, there is no detectable convergence with the raw GT data containing the 20th-century warming trend (Fig. 4). The nonconvergent cross map signal is consistent with a statistical association that is noncausal in terms of dynamic coupling (18). Indeed, the cross map estimates contain less information than is contained in the linear trend of GT (ρ = 0.8), reflecting little beyond the incidental cross-correlation between CR and GT (ρ = 0.38). Lack of convergence combined with a failure to manifest significance beyond the surrogates demonstrates that CR has no discernable causal effect on the overall warming pattern for the 20th century. The analysis shows that the dominant warming signal on this century-long timescale is not a measurable consequence of dynamic forcing by CR.
Fig. 4.
CCM analysis between CR and raw GT time series with the secular warming trend shows no convergence and no significance with surrogates generated as in Fig. 3. Thus, although CR is statistically correlated with GT (ρ = 0.38), it shows no measurable causal effect on the 20th-century warming trend.
For completeness, a traditional Granger causality (23) analysis was implemented. Because the S-map test demonstrated that the CR time series is from a nonlinear dynamical system and not a purely stochastic one, Granger’s test should not apply (18). Granger causality requires separability (dynamic independence of system parts), and is therefore not defined for interdependent dynamic systems. Thus, it is not surprising that the Granger test fails to detect any meaningful association (in fact, the nonsensible case for temperature affecting CR is slightly stronger by Granger’s test; SI Appendix, SI Text).
Summary
Our results suggest weak to moderate coupling between CR and year-to-year changes of GT. They resonate with the physical and chemical evidence emerging from laboratory studies suggesting a theoretical dynamic link between galactic CR and GT. However, we find that the realized effect is modest at best, and only recoverable when the secular trend in GT is removed (by first-differencing). Thus, it is important to stress that they do not suggest that CR influences can explain global warming and should not be misinterpreted as being in conflict with the IPCC (25). Indeed, the opposite is true: we show specifically that CR cannot explain secular warming, a trend that the consensus attributes to anthropogenic forcing. Nonetheless, the results verify the presence of a nontraditional forcing in the climate system, an effect that represents another interesting piece of the puzzle in our understanding of factors influencing climate variability.
Supplementary Material
Acknowledgments
A.A.T. is supported by Department of Energy Grant DE-SC0005305 and University of Wisconsin–Milwaukee Research Growth Initiative Grant 101X286. G.W. is supported by National Science Foundation China Grant 41275087. G.S. and E.R.D. are supported by the Sugihara Family Trust, Deutsche Bank-Jameson Complexity Studies Fund, McQuown Chair in Natural Science, National Science Foundation (DEB1020372), and National Science Foundation Graduate Research Fellowship Program.
Footnotes
The authors declare no conflict of interest.
This article contains supporting information online at www.pnas.org/lookup/suppl/doi:10.1073/pnas.1420291112/-/DCSupplemental.
References
- 1.Ney ER. Cosmic radiation and weather. Nature. 1959;183:451–452. [Google Scholar]
- 2.Duplissy J, et al. Results from the CERN pilot CLOUD experiment. Atmos Chem Phys. 2010;10:1635–1647. [Google Scholar]
- 3.Kirkby J, et al. Role of sulphuric acid, ammonia and galactic cosmic rays in atmospheric aerosol nucleation. Nature. 2011;476(7361):429–433. doi: 10.1038/nature10343. [DOI] [PubMed] [Google Scholar]
- 4.Svensmark H, Pedersen JOP, Marsh ND, Enghoff MB, Uggerhøj UI. Experimental evidence for the role of ions in particle nucleation under atmospheric conditions. Proc R Soc A. 2007;463:385–396. [Google Scholar]
- 5.Enghoff MB, Pedersen JOP, Uggerhoj UI, Paling SM, Svensmark H. Aerosol nucleation induced by high energy particle beam. Geophys Res Lett. 2011;38:L09805. [Google Scholar]
- 6.Marsh ND, Svensmark H. Low cloud properties influenced by cosmic rays. Phys Rev Lett. 2000;85(23):5004–5007. doi: 10.1103/PhysRevLett.85.5004. [DOI] [PubMed] [Google Scholar]
- 7.Harrison RG, Ambaum MHP, Lockwood M. Cloud bases height and cosmic rays. Proc R Soc Lond A. 2011;467:2777–2791. [Google Scholar]
- 8.Rawal A, Tripathi SN, Michael M, Srivastava AK, Harrison RG. Quantifying the importance of galactic cosmic rays in cloud microphysical processes. J Atmos Sol Terr Phys. 2013;102:243–251. [Google Scholar]
- 9.Svesmark H, Enghoff MB, Pedersen JOP. Response of cloud condensation nuvlei (> 50 nm) to changes in ion-nucleation. Phys Lett A. 2013;377:2343–2347. [Google Scholar]
- 10.Zhang R, Khalizov A, Wang L, Hu M, Xu W. Nucleation and growth of nanoparticles in the atmosphere. Chem Rev. 2012;112(3):1957–2011. doi: 10.1021/cr2001756. [DOI] [PubMed] [Google Scholar]
- 11.Yu F. Quasi-unary homogeneous nucleation of H2SO4-H2O. J Chem Phys. 2005;122(7):074501. doi: 10.1063/1.1850472. [DOI] [PubMed] [Google Scholar]
- 12.Foukal P, Fröhlich C, Spruit H, Wigley TML. Variations in solar luminosity and their effect on the Earth’s climate. Nature. 2006;443(7108):161–166. doi: 10.1038/nature05072. [DOI] [PubMed] [Google Scholar]
- 13.Neff U, et al. Strong coherence between solar variability and the monsoon in Oman between 9 and 6 kyr ago. Nature. 2001;411(6835):290–293. doi: 10.1038/35077048. [DOI] [PubMed] [Google Scholar]
- 14.Bond G, et al. Persistent solar influence on North Atlantic climate during the Holocene. Science. 2001;294(5549):2130–2136. doi: 10.1126/science.1065680. [DOI] [PubMed] [Google Scholar]
- 15.Svensmark H. Influence of cosmic rays on Earth’s climate. Phys Rev Lett. 1998;81:5027–5030. [Google Scholar]
- 16.Usoskin IG, Marsh N, Kovaltsov GA, Mursula K, Gladysheva OG. Latitudinal dependence of low cloud amount on cosmic ray induced ionization. Geophys Res Lett. 2004;31(16):L16109. [Google Scholar]
- 17.Shaviv N. The spiral structure of the Milky Way, cosmic rays, and ice age epochs on Earth. New Astron. 2003;8:39–77. [Google Scholar]
- 18.Sugihara G, et al. Detecting causality in complex ecosystems. Science. 2012;338(6106):496–500. doi: 10.1126/science.1227079. [DOI] [PubMed] [Google Scholar]
- 19.Sugihara G, May RM. Nonlinear forecasting as a way of distinguishing chaos from measurement error in time series. Nature. 1990;344(6268):734–741. doi: 10.1038/344734a0. [DOI] [PubMed] [Google Scholar]
- 20.Sugihara G. Nonlinear forecasting for the classification of natural time series. Philos Trans R Soc Lond A. 1994;348:477–495. [Google Scholar]
- 21.Nayaud PN. The aa indices: A 100-year series characterizing magnetic activity. J Geophys Res. 1972;17:6870–6874. [Google Scholar]
- 22.Takens F. Detecting strange attractors in turbulence. In: Rand DA, Young L-S, editors. Dynamical Systems and Turbulence. Springer; New York: 1981. pp. 366–381. [Google Scholar]
- 23.Granger CWJ. Investigating causal relations by econometric models and cross-spectral analysis. Econometrica. 1969;37:424–438. [Google Scholar]
- 24.Ebisuzaki W. A method to estimate the statistical significance of a correlation when the data are serially correlated. J Clim. 1997;10:2147–2158. [Google Scholar]
- 25.Solomon S, et al. Climate Change 2007: The Physical Science Basis. 2007 Available at www.ipcc.ch/pdf/assessment-report/ar4/wg1/ar4_wg1_full_report.pdf.
Associated Data
This section collects any data citations, data availability statements, or supplementary materials included in this article.


