

Combining highly efficient spiral sampling with dynamic compressed sensing results in major acceleration for four-dimensional flow MR imaging and allows comprehensive assessment of abdominal vessel hemodynamics in a single breath hold.
Abstract
Purpose
To develop a highly accelerated phase-contrast cardiac-gated volume flow measurement (four-dimensional [4D] flow) magnetic resonance (MR) imaging technique based on spiral sampling and dynamic compressed sensing and to compare this technique with established phase-contrast imaging techniques for the quantification of blood flow in abdominal vessels.
Materials and Methods
This single-center prospective study was compliant with HIPAA and approved by the institutional review board. Ten subjects (nine men, one woman; mean age, 51 years; age range, 30–70 years) were enrolled. Seven patients had liver disease. Written informed consent was obtained from all participants. Two 4D flow acquisitions were performed in each subject, one with use of Cartesian sampling with respiratory tracking and the other with use of spiral sampling and a breath hold. Cartesian two-dimensional (2D) cine phase-contrast images were also acquired in the portal vein. Two observers independently assessed vessel conspicuity on phase-contrast three-dimensional angiograms. Quantitative flow parameters were measured by two independent observers in major abdominal vessels. Intertechnique concordance was quantified by using Bland-Altman and logistic regression analyses.
Results
There was moderate to substantial agreement in vessel conspicuity between 4D flow acquisitions in arteries and veins (κ = 0.71 and 0.61, respectively, for observer 1; κ = 0.71 and 0.44 for observer 2), whereas more artifacts were observed with spiral 4D flow (κ = 0.30 and 0.20). Quantitative measurements in abdominal vessels showed good equivalence between spiral and Cartesian 4D flow techniques (lower bound of the 95% confidence interval: 63%, 77%, 60%, and 64% for flow, area, average velocity, and peak velocity, respectively). For portal venous flow, spiral 4D flow was in better agreement with 2D cine phase-contrast flow (95% limits of agreement: −8.8 and 9.3 mL/sec, respectively) than was Cartesian 4D flow (95% limits of agreement: −10.6 and 14.6 mL/sec).
Conclusion
The combination of highly efficient spiral sampling with dynamic compressed sensing results in major acceleration for 4D flow MR imaging, which allows comprehensive assessment of abdominal vessel hemodynamics in a single breath hold.
© RSNA, 2014
Introduction
Quantitative assessment of abdominal vessel hemodynamics has important clinical applications, including assessment of portal flow reserve and diagnosis and quantification of arterial stenosis. Although Doppler ultrasonography (US) is widely used, the resulting flow parameters are subject to limited reproducibility (1) owing to limited spatial window and variable probe orientation. Conversely, phase-contrast magnetic resonance (MR) imaging allows reliable flow measurement (2) with excellent anatomic localization. Because of the slow data acquisition rate in MR imaging, vessel coverage is often limited to a single cross-sectional plane with use of cardiac-triggered two-dimensional (2D) phase-contrast MR imaging, which may be achieved in a breath hold. Cine 2D phase-contrast imaging requires operator expertise to select the vessel of interest, which may decrease precision. Larger volumes can be measured with phase-contrast imaging by using cardiac-triggered velocity measurement with three-dimensional (3D) vessel coverage (four-dimensional [4D] flow) (3). The 4D flow technique has been recently validated against cine 2D phase-contrast imaging and Doppler US (4–9). However, for typical applications, slow data acquisition coupled with respiratory motion control for abdominal images (10) leads to imaging times on the order of 10–20 minutes, which limits clinical acceptance of 4D flow imaging. Various techniques such as parallel imaging (5), radial sampling (7,11,12), spiral acquisition without acceleration (13), and compressed sensing (14) have been proposed, resulting in an acquisition time on the order of 5–15 minutes.
The purpose of this study was to develop a highly accelerated phase-contrast 4D flow MR imaging technique based on spiral sampling and dynamic compressed sensing and to compare this technique with established phase-contrast imaging techniques for the quantification of blood flow in abdominal vessels.
Materials and Methods
Subjects
This single-center prospective study complied with the Health Insurance Portability and Accountability Act and was approved by the institutional review board at Icahn School of Medicine at Mount Sinai. Ten subjects (nine men, one woman; mean age, 51 years; age range, 30–70 years) were enrolled in a prospective research study between April 2013 and January 2014. Written informed consent was obtained from all participants. Three healthy volunteers were recruited internally. None of the volunteers had a known history of liver disease or substantial alcohol consumption. Seven subjects had chronic liver disease (secondary to chronic hepatitis C virus infection [n = 3], chronic hepatitis B virus infection [n = 3], and nonalcoholic steatohepatitis [n = 1]). Liver cirrhosis was diagnosed at histopathologic examination in three of the seven subjects. All subjects had successful 4D flow images and were included in the study. The total examination time was 45–60 minutes and included, in addition to flow imaging, T2-weighted half-Fourier rapid acquisition with relaxation enhancement, diffusion-weighted imaging with 16 b values, and dynamic contrast material–enhanced imaging (not performed in healthy subjects). Subjects were asked to fast for 6 hours before the examination to avoid hyperdynamic flow effects owing to caloric intake.
MR Imaging
MR imaging was performed with a 1.5-T system (Magnetom Aera; Siemens Healthcare, Erlangen, Germany) equipped with a 30-channel body and spine coil array. Phase-contrast imaging was performed before the injection of gadolinium-based contrast material (in patients who underwent contrast-enhanced imaging) and consisted of cine 2D phase-contrast, Cartesian 4D flow, and spiral 4D flow imaging performed in chronological order (acquisition parameters in Table 1). Although Cartesian 4D flow imaging was selected to allow direct comparison with spiral 4D flow imaging, the standard cine 2D phase-contrast technique was selected because of its wide use for single-vessel measurement. Both prototype 4D flow sequences used four-point velocity encoding (15) of 60 cm/sec and were performed in the same coronal oblique orientation by using a 60-mm slab covering hepatic vessels as well as aortic branches and inferior vena cava, with approximately matched spatial and temporal resolutions (spatial resolution: 2.5 × 3.9 × 5 and 2.5 × 2.5 × 5 mm2; temporal resolution: 68.4 and 66.2 msec for Cartesian and spiral 4D flow imaging, respectively). Subjects were asked to keep their arms up to avoid aliasing artifacts. For Cartesian 4D flow imaging, a crossed-pair navigator was placed on the dome of the spleen to track breathing motion. Cine 2D phase-contrast imaging was performed in the portal vein by using a velocity encoding of 60 cm/sec, spatial resolution of 1.6 × 3.3 × 7 mm2, and temporal resolution of 41.8 msec. A plane was selected perpendicular to the main extrahepatic portal vein by using coronal, axial, and sagittal half-Fourier rapid acquisition with relaxation enhancement to localize the vessel. Parallel imaging (GRAPPA, generalized autocalibrated partially parallel acquisitions [16]) was used to accelerate both cine 2D phase-contrast and Cartesian 4D flow with a reduction factor of 2. Average acquisition time was 15 seconds, 22 seconds, and 11 minutes 21 seconds for 2D phase-contrast, spiral 4D flow, and Cartesian 4D flow imaging, respectively.
Table 1.
Imaging Parameters for Cartesian 4D Flow, Spiral 4D Flow, and 2D Cine Phase-Contrast Imaging
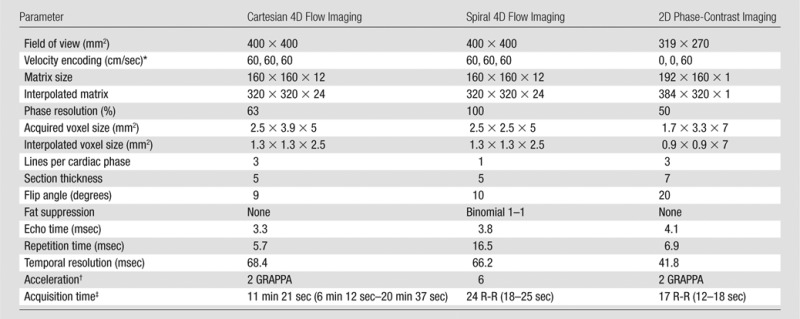
*Data are given for x, y, and z directions, respectively.
†Data are reduction factors. GRAPPA = generalized autocalibrated partially parallel acquisitions.
‡Numbers in parentheses are ranges.
Spiral 4D flow acquisition and reconstruction methods are depicted in Figure 1 and detailed in Appendix E1 (online). Briefly, a 3D stack of spirals was acquired. Sub-Nyquist sampling was performed by using spirals of variable density and an acceleration factor of six, resulting in two acquired shots per 3D phase-encoding step. Therefore, the whole volume (12 sections) was acquired in only 24 heartbeats. A dynamic compressed sensing framework was used for reconstruction. This framework has previously been validated for Cartesian imaging with an acceleration factor up to eight (17–20). Reconstruction routines were implemented by using Matlab (Matlab, R2012b; Mathworks, Natick, Mass) and took about 3 hours per subject with use of a desktop computer (12-core Xeon processor with 64 GB of RAM and no algorithm parallelization; Intel, Santa Clara, Calif). After compressed sensing reconstruction, phase-difference images (Fig 2) were computed and residual phase offsets were eliminated by fitting a third-order polynomial to static tissue (21) for each of the three velocity-encoding directions by using the Matlab fit function. A static tissue mask was generated by discarding the voxels with large temporal fluctuations on the phase image. An example of spiral datasets before and after reconstruction is given in Movie 1 (online).
Figure 1:

Sampling and reconstruction strategy for accelerated spiral 4D flow phase-contrast imaging. A, Undersampled variable-density spiral trajectory, which performs eight k-space revolutions per readout. V0 = reference velocity; VX, VY, and VZ are encoded velocity in x, y, and z directions; θ = random rotation angle for trajectory. B, Cardiac-triggered acquisition. Random rotations were applied to trajectory for each dynamic frame (velocity encodings and cardiac phases). ECG = echocardiography. C, Compressed sensing reconstruction pipeline. The coil sensitivity map was derived from acquired data itself and inserted in the compressed sensing reconstruction framework. A = encoding matrix, including fast Fourier transform (FFT) and coil profiles, ψ = sparsifying transform, x = image, y = k-space, and λ = regularization factor.
Figure 2:

Example of datasets obtained with Cartesian (A–D, I) and spiral (E–H, J) 4D flow techniques. A, E, magnitude images; B–D, F–H, phase-difference images (VX, VY, and VZ correspond to velocity measured with motion-encoding gradients in right-left, anterior-posterior, and foot-head directions, respectively); I, J, 3D angiograms for Cartesian and spiral acquisitions, respectively (velocity encoding = 60 cm/sec). Dark lines proximal to spleen on Cartesian series (arrow) show cross-beam navigator used for respiratory gating. Phase aliasing present in aorta and vena cava was corrected for during postprocessing. Three-dimensional angiogram shows segmented view of portal, splenic, and superior mesenteric veins with comparable quality and conspicuity.
Image Analysis
A prototype 4D flow software developed by the Siemens MR Imaging Research Group (A.S.) was used to analyze data. The software was obtained by means of a master research agreement with Siemens. All data information was controlled by study investigators who were not employees or consultants of Siemens (H.D., A.K., G.J., C.B., Y.C., M.M., and B.T.). In arteries, the average flow rate, average velocity, peak velocity, and average vessel area were extracted for the abdominal aorta (above celiac axis and below renal arteries), celiac axis, and hepatic, splenic, superior mesenteric, and main renal arteries. In veins, the average flow rate, average velocity, peak velocity, and average vessel area were extracted for the right, middle, and left hepatic veins, inferior vena cava (below and above renal veins), and portal, splenic, superior mesenteric, and renal veins.
Phase antialiasing present in high-velocity vessels was performed by examining voxel velocities over time. For each voxel, the algorithm corrected for pairs of opposite large jumps (larger than 2 × velocity encoding) in the velocity-time curves.
The quality of 4D flow images was evaluated by two independent observers (C.B. and Y.C., radiologists with 3 and 10 years of experience, respectively) by using the time-averaged 3D angiogram. Vessel conspicuity and sharpness was graded as follows: 0, vessel not seen; 1, severely to moderately blurred; 2, mildly blurred; and 3, well delineated. The degree of background artifacts was graded as follows: 1, severe; 2, moderate; and 3, minimal or none. Observers were not blinded to the type of acquisition but analyzed all Cartesian data and then all spiral data consecutively to avoid bias resulting from direct comparison.
Quantitative flow analysis was performed by two additional independent observers (H.D., a postdoctoral fellow, and A.K., a 4th year medical student, with 4 years and 1 year of experience in image analysis) who measured time-averaged flow and through-plane velocity, vessel area, and peak through-plane velocity for each vessel. Before the analysis, a radiologist (C.B.) identified all vessels of interest. For 4D flow datasets, segmentation was performed by using a centerline detection algorithm (22) by selecting at least two seeds in the vessel lumen. A planar region of interest was automatically placed perpendicular to the segmented vessel to quantify the cross-sectional blood flow. To test internal consistency of the flow measurement (12), conservation of flow was evaluated at two sites: the portal vein–splenic vein–superior mesenteric vein confluence and the celiac artery–hepatic artery–splenic artery bifurcation. Four-dimensional flow processing took 10–20 minutes per case, depending on the number of vessels analyzed. Cine 2D phase-contrast images were analyzed by using software locally developed on Matlab (R2012b). The magnitude image was used to segment the high-signal-intensity portal vein from darker background tissue, and flow parameters were extracted from the segmented phase image.
Statistical Analysis
Agreement between 4D flow sequences and between readers in terms of image quality was evaluated by using the weighted κ test (slight agreement, κ < 0.2; fair agreement, 0.2 < κ < 0.4; moderate agreement, 0.4 < κ < 0.6; substantial agreement, 0.6 < κ < 0.8; and almost-perfect agreement, 0.8 < κ < 1). Quantitative flow parameters were reported as medians and interquartile ranges over the population. Comparison between Cartesian 4D flow and spiral 4D flow in all vessels was performed as follows: For each parameter, a binary indicator variable was considered such that it takes the value 1 when the two measurements on the same vessel differ by a magnitude no greater than a threshold D and the value 0 otherwise. D was set as 30% of the respective average parameter value on the basis of previous reports on phase-contrast technique variability (2,23). A binary logistic regression for correlated data (24) was used to derive the 95% confidence interval for the percentage of times the methods provide measurements within threshold D for the same vessel. Equivalence between techniques was deemed negligible, low, acceptable, good, and almost perfect for values greater than 0%, greater than 20%, greater than 40%, greater than 60%, and greater than 80% of the lower bound of the 95% confidence interval. Differences in flow parameter distributions between Cartesian and spiral 4D flow were evaluated by using the paired Wilcoxon test. In the portal vein, literal agreement between Cartesian, spiral 4D flow, and 2D phase-contrast imaging was characterized in terms of the Bland-Altman limits of agreement. Conservation of flow was assessed by computing the coefficient of variation between afferent and efferent flow. Statistical analysis was performed with software (SAS 9.3; SAS Institute, Cary, NC).
Results
Image Quality
Moderate to substantial agreement was observed in vessel conspicuity and/or sharpness between spiral and Cartesian 4D flow images in arteries (κ = 0.71 for observer 1 and observer 2) or veins (κ = 0.61 and 0.44 for observer 1 and observer 2, respectively) (Fig 2). However, we observed increased background artifacts on spiral images compared with Cartesian 4D flow images (κ = 0.30 and 0.20 for observer 1 and observer 2, respectively). Substantial interobserver agreement was observed in terms of image quality assessment (κ = 0.65). Examples of flow visualization in the portal, superior mesenteric, and splenic veins are shown in Movies 2 and 3 (online).
Flow Parameters
A total of 132 visible abdominal vessels were evaluated during 4D flow processing (five to 18 vessels per subject, depending on 3D volume orientation and vessel anatomy). Only vessels visible on both Cartesian and spiral 4D flow images were included in the analysis. Per-vessel parameters from 4D flow and cine 2D phase-contrast acquisitions are given in Table 2. Binary logistic regression results and Bland-Altman limits of agreement are given in Tables 3 and 4. Good equivalence was observed between 4D flow techniques assessed in all abdominal vessels, with a lower bound of the 95% confidence interval of 63%, 77%, 60%, and 64% of vessels showing a difference less than 30% of the average parameter value for flow, area, average, and peak velocities, respectively. Good to almost-perfect equivalence was observed between readers. Compared with Cartesian 4D flow imaging (performed in all upper abdominal vessels), spiral 4D flow imaging resulted in significantly lower vessel area (P < .001) and lower flow (P < .001), whereas weakly significant differences were noted for average and peak velocity (P = .028 and P = .024, respectively). In the portal vein, spiral 4D flow was in better agreement with cine 2D phase-contrast flow than was Cartesian 4D flow, for which the average flow was higher. Scatterplots are shown in Figure 3 for all vessels, and Bland-Altman plots are shown in Figure 4 for the portal vein only. Interobserver agreement was similar for Cartesian 4D flow, spiral 4D flow, and cine 2D phase-contrast flow (Table 4).
Table 2.
Flow Parameters for Each Major Abdominal Vessel Measured at Cartesian 4D Flow, Spiral 4D Flow, and Cine 2D Phase-Contrast Imaging
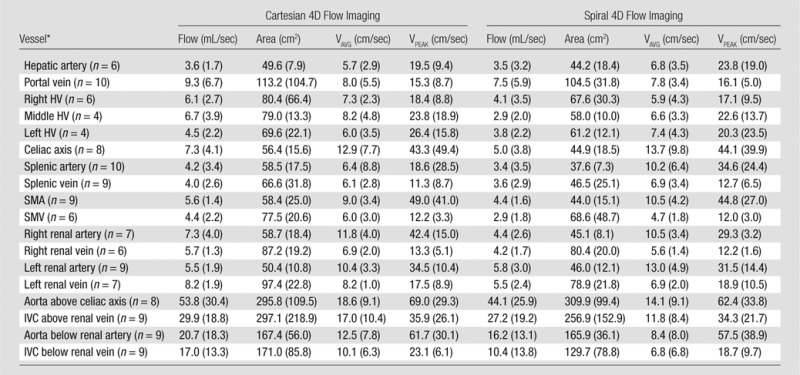
Note.—Flow parameters are given as medians, with interquartile range in parenthesis. Area = time-averaged vessel area, flow = time-averaged total flow. HV = hepatic vein, IVC = inferior vena cava, SMA = superior mesenteric artery, SMV = superior mesenteric vein, VAVG = time-averaged through-plane velocity, VPEAK = maximum through-plane velocity. Cine 2D phase-contrast imaging was performed only in the portal vein (n = 10). The flow was 8.4 mL/sec (interquartile range, 2.4 mL/sec), area was 184.3 cm2 (interquartile range, 41.5 cm2), time-averaged through-plane velocity was 4.7 cm/sec (interquartile range, 1.7 cm/sec), and maximum through-plane velocity was 7.0 cm/sec (interquartile range, 2.4 cm/sec).
*Numbers in parentheses are numbers of measured vessels.
Table 3.
Result of Binary Logistic Regression
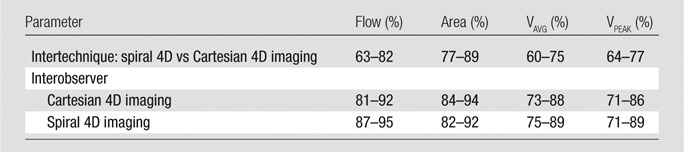
Note.—Data are for all vessels; 95% limits of agreement are given for the percentage of times the comparison yields flow parameters within 30% difference. Flow = time-averaged total flow, area = time-averaged vessel area, VAVG = time-averaged through-plane velocity, VPEAK = maximum through-plane velocity.
Table 4.
Summary of Bland-Altman Limits of Agreement
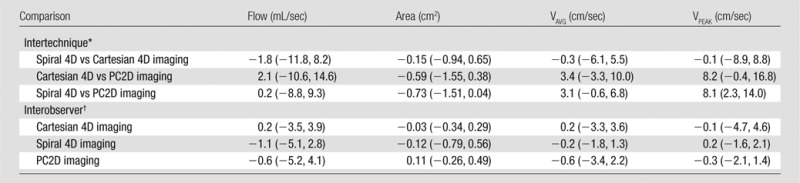
Note.—Data were obtained for comparison of spiral 4D flow imaging, Cartesian 4D flow imaging (both assessed in upper abdominal vessels), and cine 2D phase-contrast imaging (PC2D, assessed in the portal vein) and for interobserver reproducibility. Data are mean Bland-Altman bias. Flow = time-averaged total flow, area = time-averaged vessel area, VAVG = time-averaged through-plane velocity, VPEAK = peak through-plane velocity.
*Numbers in parentheses are 95% limits of agreement for each method.
†Numbers in parentheses are 95% limits of agreement for readers 1 and 2, respectively.
Figure 3:

Scatterplots show parameters for spiral 4D flow versus Cartesian 4D flow imaging in 132 abdominal vessels measured in 10 subjects. For each subject, all abdominal vessels were included in analysis. Results of logistic regression are shown in Table 3.
Figure 4:

Bland-Altman plots show comparison of parameters obtained for (a) spiral 4D flow versus Cartesian 4D flow imaging, (b) Cartesian 4D flow versus cine 2D phase-contrast imaging, and (c) spiral 4D flow versus cine 2D phase-contrast imaging in portal vein in 10 subjects. Bland-Altman limits of agreement are shown in Table 4. The velocity and area bias observed for cine 2D phase-contrast versus 4D flow techniques may be due to imperfect plane alignment (which does not affect total flow). Average portal venous flow was 10.6, 8.8, and 8.6 mL/sec with Cartesian 4D flow, spiral 4D flow, and cine 2D phase-contrast imaging, respectively.
Conservation of flow (evaluated in five subjects in whom the celiac artery bifurcation and superior mesenteric–splenic vein confluence were clearly identified) yielded similar coefficients of variation for Cartesian and spiral 4D flow: 1.7 and 2.0 mL/sec, respectively, for the portal–splenic vein confluence and 2.1 and 1.8 mL/sec for the celiac axis bifurcation.
Discussion
We have demonstrated that combining efficient spiral sampling with dynamic compressed sensing reconstruction enables substantial acceleration of 4D flow acquisition (from an average of approximately 11 minutes down to a single breath hold) while providing similar performance for flow parameter estimation when compared with standard Cartesian 4D flow and cine 2D phase-contrast measurements in vivo.
The primary goal of phase-contrast imaging in the abdomen is to quantify blood flow in abnormalities such as portal hypertension or to help diagnose vascular obstruction or stenosis. Cartesian 4D flow and cine 2D phase-contrast imaging have been previously validated against Doppler US and were thus selected to assess the performance of the novel spiral acquisition technique. When comparing spiral and Cartesian 4D flow quantification in abdominal vessels, we found good equivalence between the two techniques. When estimating the accuracy of flow conservation at two different sites (splenic–superior mesenteric vein confluence and celiac axis bifurcation), we found similar variability for the flow at Cartesian 4D imaging and spiral 4D imaging. Furthermore, in our small series, flow at spiral 4D imaging was in better agreement with that at cine 2D phase-contrast imaging than was flow at Cartesian 4D imaging for portal venous flow measurement. This must be verified in a larger series. This could be due to the fact that both cine 2D phase-contrast and spiral 4D flow were acquired in a breath hold, thereby limiting motion-related blurring, whereas acquisition of Cartesian 4D flow necessitated respiratory triggering. Increased blurring may also explain the significantly higher flow and vessel area measured with Cartesian 4D flow imaging compared with spiral 4D flow imaging. Of note, cine 2D phase-contrast imaging resulted in lower velocity and higher area when compared with both 4D flow techniques in the portal vein, which may be a result of imperfect alignment of the measurement plane at imaging. However, such an error negligibly affects total flow rate measurement, for which cine 2D phase-contrast imaging had comparable values to 4D imaging.
Robust analysis is an important condition for reliable quantitative flow measurement, which should yield low interobserver variability. For all abdominal vessels, interobserver agreement of spiral 4D flow was similar to or better than that of Cartesian 4D flow. For portal venous flow measurement, similar interobserver agreement was found for spiral 4D flow, Cartesian 4D flow, and cine 2D phase-contrast flow, which indicates equivalent performance of the novel spiral acquisition compared with standard methods.
Acquisition times for both 4D flow techniques were significantly different. The required number of cardiac cycles was more than 10 times lower for the spiral technique (24 heartbeats) than for twofold accelerated Cartesian sampling (250 heartbeats). Furthermore, dual triggering in Cartesian 4D flow led to poor efficiency (about 35%) and a longer imaging time. Conversely, spiral acquisition collected all necessary data within a breath hold without the need for a respiratory navigator. Such a fast acquisition could be exploited to increase spatiotemporal resolution or to acquire multiple velocity encoding to assess arterial and venous flow in separate acquisitions.
Sub-Nyquist sampling as performed in our study with an acceleration factor of six requires advanced reconstruction techniques, otherwise undesirable artifacts may result. Although good performance was reached with respect to flow quantification, image quality was found to be worse for spiral 4D flow. There are multiple ways to improve the image quality. First, spiral reconstruction may benefit from correction techniques (25,26). Second, compressed sensing reconstruction may use extra regularization terms that promote angiogram (27,28) or phase characteristic (29) properties. This could be evaluated in future studies.
There are limitations to this study. First, a breath-hold acquisition with sufficient coverage resulted in moderate spatial resolution, which would need to be increased to more accurately measure the hepatic arterial tree and arterial stenosis. This could be achieved by using concatenated breath holds or by exploring higher acceleration rates. Our technique could also be adapted to provide increased velocity dynamic range by using the five-point velocity encoding method (30). Second, the small numbers in our validation cohort did not enable us to compare healthy subjects and patients with liver disease. Finally, the reconstruction algorithm efficiency should be improved to provide images at imaging time. This could be addressed by exploiting recent advances in parallel computing for MR imaging (31).
In conclusion, we have demonstrated that combining highly efficient spiral sampling with dynamic compressed sensing results in major acceleration for 4D flow MR imaging, which allows comprehensive assessment of abdominal vessel hemodynamics in a single breath hold. Good vascular conspicuity was observed in abdominal vessels, although with decreased image quality, and quantitative parameters derived from the novel technique were in strong agreement with those from established phase-contrast techniques such as cine 2D phase-contrast and Cartesian 4D flow imaging.
Advances in Knowledge
■ Efficient data acquisition for four-dimensional (4D) flow MR imaging in the abdomen can be achieved in a single breath hold by using a combination of accelerated spiral sampling and dynamic compressed sensing reconstruction.
■ Flow parameters measured with spiral 4D flow imaging were in strong agreement with those measured with Cartesian 4D flow and cine two-dimensional phase-contrast MR imaging techniques (limits of agreement for portal venous flow: −11.8 and 8.2 mL/sec and −8.8 and −9.3 mL/sec, respectively) and reduced the acquisition time from 10 minutes down to a breath hold.
Implication for Patient Care
■ The proposed technique allows integration of a fast 4D flow protocol in a clinical setup, thereby providing a comprehensive hemodynamic assessment of multiple abdominal vessels with minimal effect on imaging time.
APPENDIX E1
A 3D stack of spirals was implemented with Fourier sampling in the section direction. The in-plane spiral trajectory was accelerated in two ways: by using variable-density sampling (linearly decreasing from fully sampled at the center of k-space to 0.2 of Nyquist condition at the edge) and by acquiring only two interleaves out of six. This resulted in a reduction factor of 6 compared with a fully sampled spiral. Each 3D partition could be acquired in only two spiral shots, resulting in 12 partitions acquired in 24 heartbeats, which can be performed in a breath hold. To mitigate spiral blurring artifacts, fat suppression was achieved by using water-selective excitation (13), and the readout duration was kept small (7.43 msec). We selected dynamic compressed sensing to perform the reconstruction of undersampled spiral data. Such methods have previously been applied to successfully accelerate Cartesian cine 2D up to a reduction factor of 6 (17,18). A variable-density spiral was chosen for its relatively flat point spread function (32). Dynamic variations in aliasing artifacts were generated by rotating the spiral trajectory by a random angle uniformly distributed between 0 and 2π for each dynamic frame (see Fig 1). Reconstruction routines were implemented by using Matlab (Matlab, R2012b; Mathworks, Natick, Mass) and took about 3 hours on a desktop computer (12-core Intel Xeon, 64 GB of RAM, no algorithm parallelization) to complete for each subject. Multiple coil information was included in the compressed sensing framework, as previously described (19). Individual coil sensitivity maps were computed from the acquired series without the need for extra calibration imaging by combining all dynamic volumes acquired with different random rotation angles. Temporal principal component analysis was selected to improve sparsity of the 4D flow data (17,18). After optimizing reconstruction parameters on a test dataset, the weight between data sparsity and consistency (33) was set to 0.1, which was found to eliminate residual artifacts while providing negligible temporal filtering of the flow waveforms. After compressed sensing reconstruction, phase difference images (Fig 2) were computed and residual phase offsets were eliminated by fitting a third-order polynomial to static tissue (21) for each of the three velocity-encoding directions by using the Matlab fit function.
MOVIES
Acknowledgments
Acknowledgments
The authors thank Ricardo Otazo, PhD, and Daniel Sodickson, MD, PhD, for providing the SPARSE-SENSE reconstruction algorithm and James Babb, PhD, for useful suggestions on statistical methods.
Received May 7, 2014; revision requested June 17; revision received August 19; accepted August 26; final version accepted September 15.
Funding: This research was supported by the National Institutes of Health (grant 1R01DK087877). G.J. was supported by National Institutes of Health grant 5T32CA78207-14.
Abbreviations:
- 4D
- four-dimensional
- 3D
- three-dimensional
- 2D
- two-dimensional
Disclosures of Conflicts of Interest: H.D. disclosed no relevant relationships. A.K. disclosed no relevant relationships. G.J. disclosed no relevant relationships. C.B. disclosed no relevant relationships. Y.C. disclosed no relevant relationships. A.S. Activities related to the present article: disclosed no relevant relationships. Activities not related to the present article: is employed by Siemens Healthcare; has patents with Siemens Healthcare; institution has patents with Siemens Healthcare. Other relationships: disclosed no relevant relationships. M.M. disclosed no relevant relationships. B.T. disclosed no relevant relationships.
References
- 1.Paulson EK, Kliewer MA, Frederick MG, Keogan MT, DeLong DM, Nelson RC. Doppler US measurement of portal venous flow: variability in healthy fasting volunteers. Radiology 1997;202(3):721–724. [DOI] [PubMed] [Google Scholar]
- 2.Hara AK, Burkart DJ, Johnson CD, et al. Variability of consecutive in vivo MR flow measurements in the main portal vein. AJR Am J Roentgenol 1996;166(6):1311–1315. [DOI] [PubMed] [Google Scholar]
- 3.Markl M, Chan FP, Alley MT, et al. Time-resolved three-dimensional phase-contrast MRI. J Magn Reson Imaging 2003;17(4):499–506. [DOI] [PubMed] [Google Scholar]
- 4.Stankovic Z, Csatari Z, Deibert P, et al. Normal and altered three-dimensional portal venous hemodynamics in patients with liver cirrhosis. Radiology 2012;262(3):862–873. [DOI] [PubMed] [Google Scholar]
- 5.Stankovic Z, Frydrychowicz A, Csatari Z, et al. MR-based visualization and quantification of three-dimensional flow characteristics in the portal venous system. J Magn Reson Imaging 2010;32(2):466–475. [DOI] [PubMed] [Google Scholar]
- 6.Eriksson J, Carlhäll CJ, Dyverfeldt P, Engvall J, Bolger AF, Ebbers T. Semi-automatic quantification of 4D left ventricular blood flow. J Cardiovasc Magn Reson 2010;12:9. [DOI] [PMC free article] [PubMed] [Google Scholar]
- 7.Frydrychowicz A, Wieben O, Niespodzany E, Reeder SB, Johnson KM, François CJ. Quantification of thoracic blood flow using volumetric magnetic resonance imaging with radial velocity encoding: in vivo validation. Invest Radiol 2013;48(12):819–825. [DOI] [PMC free article] [PubMed] [Google Scholar]
- 8.Nordmeyer S, Riesenkampff E, Crelier G, et al. Flow-sensitive four-dimensional cine magnetic resonance imaging for offline blood flow quantification in multiple vessels: a validation study. J Magn Reson Imaging 2010;32(3):677–683. [DOI] [PubMed] [Google Scholar]
- 9.Valverde I, Nordmeyer S, Uribe S, et al. Systemic-to-pulmonary collateral flow in patients with palliated univentricular heart physiology: measurement using cardiovascular magnetic resonance 4D velocity acquisition. J Cardiovasc Magn Reson 2012;14:25. [DOI] [PMC free article] [PubMed] [Google Scholar]
- 10.Markl M, Harloff A, Bley TA, et al. Time-resolved 3D MR velocity mapping at 3T: improved navigator-gated assessment of vascular anatomy and blood flow. J Magn Reson Imaging 2007;25(4):824–831. [DOI] [PubMed] [Google Scholar]
- 11.Johnson KM, Lum DP, Turski PA, Block WF, Mistretta CA, Wieben O. Improved 3D phase contrast MRI with off-resonance corrected dual echo VIPR. Magn Reson Med 2008;60(6):1329–1336. [DOI] [PMC free article] [PubMed] [Google Scholar]
- 12.Roldán-Alzate A, Frydrychowicz A, Niespodzany E, et al. In vivo validation of 4D flow MRI for assessing the hemodynamics of portal hypertension. J Magn Reson Imaging 2013;37(5):1100–1108. [DOI] [PMC free article] [PubMed] [Google Scholar]
- 13.Sigfridsson A, Petersson S, Carlhäll CJ, Ebbers T. Four-dimensional flow MRI using spiral acquisition. Magn Reson Med 2012;68(4):1065–1073. [DOI] [PubMed] [Google Scholar]
- 14.Hsiao A, Lustig M, Alley MT, Murphy MJ, Vasanawala SS. Evaluation of valvular insufficiency and shunts with parallel-imaging compressed-sensing 4D phase-contrast MR imaging with stereoscopic 3D velocity-fusion volume-rendered visualization. Radiology 2012;265(1):87–95. [DOI] [PMC free article] [PubMed] [Google Scholar]
- 15.Pelc NJ, Bernstein MA, Shimakawa A, Glover GH. Encoding strategies for three-direction phase-contrast MR imaging of flow. J Magn Reson Imaging 1991;1(4):405–413. [DOI] [PubMed] [Google Scholar]
- 16.Griswold MA, Jakob PM, Heidemann RM, et al. Generalized autocalibrating partially parallel acquisitions (GRAPPA). Magn Reson Med 2002;47(6):1202–1210. [DOI] [PubMed] [Google Scholar]
- 17.Feng L, Otazo R, Jung H, et al. Accelerated cardiac T2 mapping using breath-hold multiecho fast spin-echo pulse sequence with k-t FOCUSS. Magn Reson Med 2011;65(6):1661–1669. [DOI] [PMC free article] [PubMed] [Google Scholar]
- 18.Kim D, Dyvorne HA, Otazo R, Feng L, Sodickson DK, Lee VS. Accelerated phase-contrast cine MRI using k-t SPARSE-SENSE. Magn Reson Med 2012;67(4):1054–1064. [DOI] [PMC free article] [PubMed] [Google Scholar]
- 19.Otazo R, Kim D, Axel L, Sodickson DK. Combination of compressed sensing and parallel imaging for highly accelerated first-pass cardiac perfusion MRI. Magn Reson Med 2010;64(3):767–776. [DOI] [PMC free article] [PubMed] [Google Scholar]
- 20.Center for Advanced Imaging Innovation and Research . k-t SPARSE-SENSE Matlab Code. http://cai2r.net/resources/software/k-t-sparse-sense-matlab-code. Updated March 18, 2004. Accessed November 26, 2013.
- 21.Walker PG, Cranney GB, Scheidegger MB, Waseleski G, Pohost GM, Yoganathan AP. Semiautomated method for noise reduction and background phase error correction in MR phase velocity data. J Magn Reson Imaging 1993;3(3):521–530. [DOI] [PubMed] [Google Scholar]
- 22.Gülsün MA, Tek H. Segmentation of carotid arteries by graph-cuts publications using centerline models. In: Wong KH, Miga MI, eds. Proceedings of SPIE: medical imaging 2010—visualization, image-guided procedures, and modeling. Vol 7625. Bellingham, Wash: SPIE–The International Society for Optical Engineering, 2010; 762530. [Google Scholar]
- 23.Jajamovich GH, Dyvorne H, Donnerhack C, Taouli B. Quantitative liver MRI combining phase contrast imaging, elastography, and DWI: assessment of reproducibility and postprandial effect at 3.0 T. PLoS ONE 2014;9(5):e97355. [DOI] [PMC free article] [PubMed] [Google Scholar]
- 24.Kuss O. How to use SAS for logistic regression with correlated data. Proceedings of the 27th Annual SAS Users Group International Conference, 2002. [Google Scholar]
- 25.Chen W, Meyer CH. Semiautomatic off-resonance correction in spiral imaging. Magn Reson Med 2008;59(5):1212–1219. [DOI] [PubMed] [Google Scholar]
- 26.Robison RK, Devaraj A, Pipe JG. Fast, simple gradient delay estimation for spiral MRI. Magn Reson Med 2010;63(6):1683–1690. [DOI] [PubMed] [Google Scholar]
- 27.Thompson RB, McVeigh ER. Real-time volumetric flow measurements with complex-difference MRI. Magn Reson Med 2003;50(6):1248–1255. [DOI] [PMC free article] [PubMed] [Google Scholar]
- 28.Kwak Y, Nam S, Akçakaya M, et al. Accelerated aortic flow assessment with compressed sensing with and without use of the sparsity of the complex difference image. Magn Reson Med doi: 10.1002/mrm.24514. Published online October 12, 2012. Accessed October 20, 2012. [DOI] [PMC free article] [PubMed]
- 29.Zhao F, Noll DC, Nielsen JF, Fessler JA. Separate magnitude and phase regularization via compressed sensing. IEEE Trans Med Imaging 2012;31(9):1713–1723. [DOI] [PMC free article] [PubMed] [Google Scholar]
- 30.Johnson KM, Markl M. Improved SNR in phase contrast velocimetry with five-point balanced flow encoding. Magn Reson Med 2010;63(2):349–355. [DOI] [PMC free article] [PubMed] [Google Scholar]
- 31.Hansen MS, Sørensen TS. Gadgetron: an open source framework for medical image reconstruction. Magn Reson Med 2013;69(6):1768–1776. [DOI] [PubMed] [Google Scholar]
Associated Data
This section collects any data citations, data availability statements, or supplementary materials included in this article.
Supplementary Materials
A 3D stack of spirals was implemented with Fourier sampling in the section direction. The in-plane spiral trajectory was accelerated in two ways: by using variable-density sampling (linearly decreasing from fully sampled at the center of k-space to 0.2 of Nyquist condition at the edge) and by acquiring only two interleaves out of six. This resulted in a reduction factor of 6 compared with a fully sampled spiral. Each 3D partition could be acquired in only two spiral shots, resulting in 12 partitions acquired in 24 heartbeats, which can be performed in a breath hold. To mitigate spiral blurring artifacts, fat suppression was achieved by using water-selective excitation (13), and the readout duration was kept small (7.43 msec). We selected dynamic compressed sensing to perform the reconstruction of undersampled spiral data. Such methods have previously been applied to successfully accelerate Cartesian cine 2D up to a reduction factor of 6 (17,18). A variable-density spiral was chosen for its relatively flat point spread function (32). Dynamic variations in aliasing artifacts were generated by rotating the spiral trajectory by a random angle uniformly distributed between 0 and 2π for each dynamic frame (see Fig 1). Reconstruction routines were implemented by using Matlab (Matlab, R2012b; Mathworks, Natick, Mass) and took about 3 hours on a desktop computer (12-core Intel Xeon, 64 GB of RAM, no algorithm parallelization) to complete for each subject. Multiple coil information was included in the compressed sensing framework, as previously described (19). Individual coil sensitivity maps were computed from the acquired series without the need for extra calibration imaging by combining all dynamic volumes acquired with different random rotation angles. Temporal principal component analysis was selected to improve sparsity of the 4D flow data (17,18). After optimizing reconstruction parameters on a test dataset, the weight between data sparsity and consistency (33) was set to 0.1, which was found to eliminate residual artifacts while providing negligible temporal filtering of the flow waveforms. After compressed sensing reconstruction, phase difference images (Fig 2) were computed and residual phase offsets were eliminated by fitting a third-order polynomial to static tissue (21) for each of the three velocity-encoding directions by using the Matlab fit function.