

Abstract
The generation of tissue-like structures in vitro is of major interest for various fields of research including in vitro toxicology, regenerative therapies and tissue engineering. Usually 3D matrices are used to engineer tissue-like structures in vitro, and for the generation of kidney tubules, 3D gels are employed. Kidney tubules embedded within 3D gels are difficult to access for manipulations and imaging. Here we show how large and functional human kidney tubules can be generated in vitro on 2D surfaces, without the use of 3D matrices. The mechanism used by human primary renal proximal tubule cells for tubulogenesis on 2D surfaces appears to be distinct from the mechanism employed in 3D gels, and tubulogenesis on 2D surfaces involves interactions between epithelial and mesenchymal cells. The process is induced by transforming growth factor-β1, and enhanced by a 3D substrate architecture. However, after triggering the process, the formation of renal tubules occurs with remarkable independence from the substrate architecture. Human proximal tubules generated on 2D surfaces typically have a length of several millimetres, and are easily accessible for manipulations and imaging, which makes them attractive for basic research and in vitro nephrotoxicology. The experimental system described also allows for in vitro studies on how primary human kidney cells regenerate renal structures after organ disruption. The finding that human kidney cells organize tissue-like structures independently from the substrate architecture has important consequences for kidney tissue engineering, and it will be important, for instance, to inhibit the process of tubulogenesis on 2D surfaces in bioartificial kidneys.
Keywords: primary human renal proximal tubule cells, renal tubules, kidney tissue engineering, tissue-like structures
Introduction
Tubule formation in the developing mammalian kidney is initiated by outgrowth of the ureteric bud from the Wolffian duct (early kidney development is reviewed in [1, 2]). The outgrowing ureteric bud invades the metanephric mesenchyme and undergoes branching morphogenesis, which gives rise to a network of epithelial tubes. This tubular system develops into the collective duct network. Inductive processes lead to the condensation of the metanephric mesenchyme around the tips of the ureteric bud-derived tubules. The condensed mesenchyme polarizes, and the cells transdifferentiate into epithelial cells by a mesenchyme-to-epithelial transition process. In the course of these processes, new epithelial tubules are formed, which give rise to the nephrons.
The formation of kidney tubules in vitro is studied by using 3D gels [3–12]. The most widely used in vitro system consists of Madin–Darby canine kidney (MDCK) cells grown in 3D gels consisting of collagen I and/or matrigel [5–8, 12]. A general drawback of such 3D gel-based systems is that high-resolution imaging of intact functional tubules within gels is difficult. In addition, tubules embedded in 3D gels are difficult to access, and manipulations or applications of drugs cannot be performed in a well-controlled manner. These challenges limit the usefulness of in vitro generated kidney tubules in functional studies and applications. One major area of interest for applications of in vitro generated kidney tubules lies in in vitro nephrotoxicity studies.
The proximal tubule, which has a length of ∼13 mm in the adult human kidney, is one of the major target sites of nephrotoxic agents. Animal- or human-derived proximal tubule cells are widely applied for in vitro nephrotoxicology [13–20]. Monolayer cultures are predominantly used in such studies, which give only limited insights into drug-induced effects on tubular functions and integrity.
Proximal tubule cells are also applied in kidney tissue engineering, particularly for the development of bioartificial kidneys (BAKs) [21–29]. BAKs take advantage of hollow fibre cartridges, where proximal tubule cells grow on the insides of the hollow fibre membranes. Here they should form and maintain a well-differentiated epithelium, in order to mimic the architecture and replace the functions of the proximal renal tubule.
Herein we show that primary human renal proximal tubule cells (HPTCs) do not remain organized as a flat epithelium on 2D surfaces and in tubular substrates, but form large (lengths of up to several millimetres) and functional renal tubules. The process of tubule formation and the properties of the resulting tubules are described. The consequences of the findings for BAK development, as well as potential applications of the in vitro system described here, are discussed.
Materials and methods
Cell culture
Different batches of HPTCs were obtained from ScienCell Research Laboratories (Carlsbad, CA, USA). They were cultured in basal epithelial cell medium supplemented with 2% foetal bovine serum and 1% epithelial cell growth supplement (ScienCell Research Laboratories). In some experiments, transforming growth factor (TGF)-β1 (R&D Systems, Minneapolis, MN, USA) was added at a concentration of 10 ng/ml after monolayer formation. Cells were cultured on uncoated multiwell plates (Nunc, Naperville, IL, USA) or plates coated with human laminin or other extracellular matrix (ECM) coatings as described in [30] (see also Fig. S1). The seeding density was 5 × 10⁴ cells/cm2, unless otherwise indicated.
The wells of diagnostic printed slides have a diameter of 2 mm and a glass bottom. No ECM coating was applied in these experiments. Cells were seeded at a density of 2.65 × 10⁵ cells/cm2 into glass capillaries (inner diameter = 0.58 mm; Sutter Instrument, Novato, CA, USA), and kept in static culture. Only the ends of the capillaries were examined.
Matrigel (BD, Franklin Lakes, NJ, USA) was applied according to the manufacturer’s instructions.
Tubules were treated (if necessary for the experiment) and fixed (3.7% formaldehyde in phosphate buffered saline, 10 min. at room temperature) after their appearance. Most tubules appeared during week 2 after cell seeding (Fig. S1). Tubules were imaged immediately or during the following days after fixation and were stored in phosphate buffered saline or mounting medium.
Sectioning of tubules
HPTCs were grown on polyester Transwell® membranes (Corning, Lowell, MA, USA) (pore size = 0.4 μm). The membranes with the tubules were embedded in TissueTek© O.C.T. (Sakura Finetek, Tokyo, Japan) and sectioned.
Immunostaining, histochemistry and transport assays
Histochemical detection of γ-glutamyl transpeptidase (γGTP) activity, formaldehyde fixation and immunostaining were performed as outlined previously [30]. Transport assays were performed as described in [3], and more details are provided in the Supporting Information.
Reverse transcription and quantitative real-time PCR
Details of RNA isolation, reverse transcription procedures and primer sequences (Table S1) are provided in the Supporting Information. Quantitative real-time polymerase chain reaction (qRT-PCR) was performed by using the iCycler system and software (BioRad, Hercules, CA, USA). Gene expression levels were calculated relative to the expression levels of the house keeping gene glyceraldehyde 3-phosphate dehydrogenase (GAPDH) using the BioRad software.
Imaging, statistics and software
Imaging was performed with a Zeiss AxioObserver Z1 microscope (Carl Zeiss, Jena, Germany) using the Zeiss AxioVision imaging software. Calculations and statistics (unpaired t-test) were performed with Excel 2003. Figures were arranged with AdobePhotoshop CS3 and ImageJ.
Results
Human renal tubule formation on 2D surfaces
In a previous study, we investigated the impact of ECM coatings on the formation and maintenance of differentiated epithelia by HPTCs in vitro[30]. After the initial formation of well-differentiated epithelia, subsequent disruption of the epithelia was consistently observed. α-smooth muscle actin (SMA)-expressing myofibroblasts, which appeared in increasing amounts during the culture period, seemed to play a crucial role. Herein we analysed these processes in further detail.
In accordance with our previous results, we observed initial formation of a flat and well-differentiated epithelial monolayer when HPTCs were cultured in multiwell plates (Fig. 1A). Subsequently, increasing amounts of α-SMA-expressing myofibroblasts appeared. These myofibroblasts formed large aggregates (Fig. 1B). In the surroundings of such aggregates, the epithelium became reorganized. Firstly, highly coordinated and simultaneously directed movements of large numbers of cells led to retraction of the monolayer on one side of myofibroblast aggregates, leaving behind the largely empty surface of the well (Fig. 1C, E). Subsequently, the monolayer retracted on the other side of the myofibroblast aggregates (Fig. 1D, F). These highly coordinated cell movements led to the formation of stripes of cells, with a length of up to several millimetres or even centimetres (Fig. 1F). The stripes included the myofibroblast aggregates.
Fig 1.

The process of tubule formation on 2D surfaces. (A)–(D) and (H) show images obtained by epifluorescence microscopy after immunodetection of zonula occludens-1 (ZO-1) (green) and α-SMA (red). Nuclei were counterstained with 4′,6′-diamidino-2′-phenylindole (DAPI) (blue). The other panels show images obtained by (E, F) differential interference contrast microscopy and (G) bright-field microscopy. In all cases, the HPTCs were cultured on the bottom of the wells of 24-well plates. (A) First, a well-differentiated epithelial monolayer is formed. (B) Subsequently, myofibroblast aggregates that are strongly positive for α-SMA appear. (C, E) The monolayer then retracts on the one side of the myofibroblast aggregates, leaving a surface devoid of cells (left half in C). (D, F) The monolayer subsequently retracts on the other side of the myofibroblast aggregates. This leads to the formation of cell stripes, which include myofibroblast aggregates (note: myofibroblast aggregates are labelled with arrowheads in E, F and G). (G, H) Finally, large renal tubules are formed on the 2D surface. Several images were stitched together in order to cover the entire tubule shown in (G). Scale bars: (A) 100 μm, (B–F, H) 200 μm, and (G) 1 mm.
The cells that have organized into a stripe then performed additional dynamic reorganizations, which gave rise to tubule formation (Fig. 1G, H). The human renal tubules formed in this way on 2D surfaces were straight and not branched, and typically have a length of several millimetres (Fig. 1G). The tubules always remained attached to myofibroblast aggregates, which could be associated with one (Fig. 1G) or both ends of a tubule, but could also be found at mid-tubular regions. When an end of a tubule was not attached to a myofibroblast aggregate, the tubular epithelium was continuous with the remainder of the monolayer (Fig. 1G, H). The finally formed tubular epithelium and attached epithelia were well differentiated (Figs 1H and 3C, D).
Fig 3.

Tubules have a lumen lined by a differentiated epithelium. (A) Cross-section and (B) longitudinal section of a tubule. Tubules were stained with DAPI (white). (C) The surface of a tubule is imaged by epifluorescence microscopy (the upper right areas are out of focus). ZO-1 (white) is detected by immunofluorescence. The tubular epithelium shows extensive formation of tight junctions, as indicated by the chicken wire-like ZO-1 patterns. (D) γGTP activity is detected histochemically. Higher levels of γGTP activity result in the darker staining of cells. The image shows high levels of γGTP activity in a tubule, whereas the monolayer cells below display lower levels of activity of this brush border enzyme. Scale bars: (A–C) 100 μm and (D) 200 μm.
Cell movements involved in monolayer reorganization and tubule formation were not only highly coordinated, but also rapid. Figure 2 shows that condensation and folding up of the cell stripe, which ultimately led to tubule formation, occurred within minutes. We were not able to determine definitively how the tubule was folded from the stripe. This would require extensive live cell tracking and detailed analyses of fast movements of large numbers of cells. Such extensive live cell analyses would be performed in a separate study.
Fig 2.
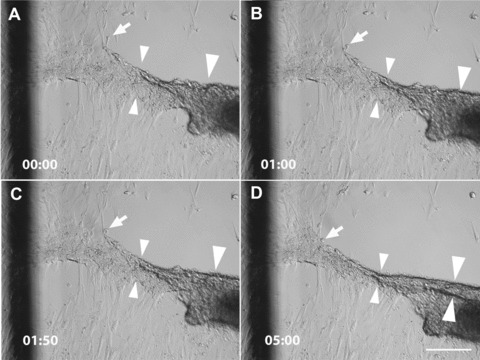
Tubule formation is associated with rapid cell movements. The panels show the same area imaged by differential interference contrast microscopy at consecutive time-points (minutes and seconds are indicated in the lower left corner). The images show living HPTCs in cell culture medium on the bottom of a well of a 24-well plate. The imaged area contains part of a myofibroblast aggregate (right edge). The monolayer has already retracted on one side of the myofibroblast aggregate (note that the upper right area is devoid of cells). Cells are in the process of retracting from the other side and folding up the cell stripe into a tubule. The cell stripe is substantially narrowed over the period of 5 min., as indicated for one region marked by the small arrowheads. A tubule-like structure with two clear borders (large arrowheads) is visible at the end of the observation period, but not at the previous time-points. Thus, this structure and its lower border (marked by the lower large arrowhead) are formed in ∼5 min. Cells at the borders of the stripe (marked by arrow) are quickly integrated into the tubule that is being formed. The dark line on the left side of the panels belongs to a grid, which has been drawn on the outer surface of the well bottom to facilitate spatial orientation during the imaging of cell movements. Scale bar: 200 μm.
After tubule formation, the structures remained dynamic. Myofibroblast aggregates and attached tubules further rearranged, and eventually large cell aggregates developed, which detached and floated away. Most of the tubules disappeared within a period of three days (Fig. S1D), and the duration for which tubules remained stable was ∼2–9 days.
Tubules have a lumen lined by a differentiated epithelium and display transport functions
Sectioning of the tubules formed by the processes described above confirmed that the tubules enclosed a lumen (Fig. 3A, B). The lumen was lined by a well-differentiated epithelium displaying extensive tight junction formation (Fig. 3C). Usually, some α-SMA-expressing cells were associated with the tubular structures. These could be located on the outside of the tubule or within the lumen. The brush border marker γGTP was expressed within the tubules (Fig. 3D), confirming cell type-specific differentiation and apical–basal polarity of the epithelial cells.
In order to test whether the tubular epithelium displayed typical transport functions, we incubated tubules with the fluorescent organic anions lucifer yellow, rhodamine 123, 5,6-carboxyfluorescein and 4,4-difluoro-5,7-dimethyl-4-bora-3a,4a-diaza-s-indacene-3-propionic acid (BODIPY FL) verapamil. Lucifer yellow and 5,6-carboxyfluorescein are substrates of the p-aminohippurate transport system [31, 32]. Stronger fluorescence was observed within the tubular lumen, as compared to the surrounding medium and the epithelial cells lining the lumen. Thus, these organic anions became enriched in the tubular lumen (Fig. 4), providing evidence for transport across the tubular epithelium. Also, rhodamine 123, which is a substrate of the multidrug resistance-1-encoded P-glycoprotein (P-gp) transport system, became enriched in the tubular lumen (Fig. 4). Rhodamine 123 is actively transported, whereas BODIPY FL verapamil is transported by the P-gp system via electrodiffusive anion transport [33, 34]. BODIPY FL verapamil became enriched within the cells (Fig. 4), suggesting transport of this substrate at the basolateral sites into the cells, but slower or no transport at their apical sites. Whether this reflected impairment of the P-gp mediated electrodiffusive anion transport at the apical sites of the cells was not clear, as the kinetics and exact routes of BODIPY FL verapamil transport in the native human proximal tubule were not characterized. Together, the results showed that various organic anions were transported across the tubular epithelium, and suggested that at least two different major transport pathways were functional.
Fig 4.
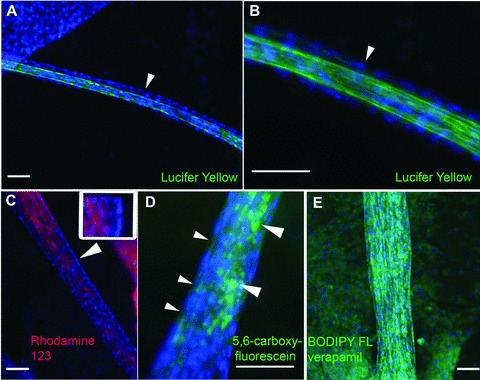
Organic anion transport. Human proximal tubules formed on 2D surfaces are incubated for 20 hrs with the organic anions lucifer yellow (A, B; green), rhodamine 123 (C; red), 5,6-carboxyfluorescein (D; green) and BODIPY FL verapamil (E; green). Tubules are fixed before imaging, and the cell nuclei are counterstained with DAPI (blue). Part (B) shows an enlarged sector of the tubule displayed in (A). The arrowhead points to the outer layer of cells lining the tubular lumen, which displays only faint lucifer yellow fluorescence. By contrast, the lumen is strongly labelled. (C) Rhodamine 123 is enriched in the tubular lumen, as compared to the outer layer of cells. The arrowhead points to a region that is enlarged in the inset. The DAPI-stained nuclei of the outer cell layer are on the right in the inset. The cytoplasm displays only very faint rhodamine 123 fluorescence, which is enriched in the tubular lumen (on the left in the inset). (D) The small arrowheads point to the cytoplasm between the DAPI-stained nuclei of the outer cell layer. The cytoplasm displays only faint 5,6-carboxyfluorescein fluorescence. 5,6-carboxyfluorescein is enriched in the tubular interior (large arrowheads). (E) BODIPY FL verapamil is enriched in the cytoplasm of tubular and monolayer cells. Scale bars: 100 μm.
Tubule formation by HPTCs on 2D surfaces and in 3D gels
In order to address tubule formation by HPTCs in 3D gels, we cultured the cells in matrigel. Tubule formation in matrigel (Fig. 5E–H) involved branching of cells at the initial stages of tubule formation and outgrowth of branched cells. Outgrowing branches then formed tubules, and budding from these tubules could occur, giving rise to branched tubular structures (Fig. 5H). It was important to note that formation of epithelial monolayers and coordinated movements of large numbers of cells were not involved in tubule formation in 3D gels. The resulting human proximal tubules obtained in 3D gels were relatively small, displayed multiple branches (Fig. 5H), could be convoluted (Fig. S2), and were never attached to myofibroblast aggregates, in contrast to the tubules obtained on 2D surfaces.
Fig 5.
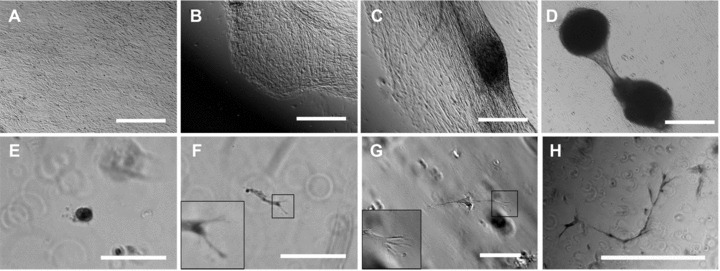
Tubule formation by HPTCs on 2D surfaces and in 3D gels. (A)–(D) show tubule formation by HPTCs growing on matrigel-coated bottoms of 24-well plate wells. (A) First, a confluent monolayer is formed. (B) Subsequently, the monolayer retracts on one side. (C) Then the monolayer retracts on both sides of a myofibroblast aggregate. (D) Finally, a tubule attached to myofibroblast aggregates is formed. The process is similar to that shown in Figure 1. (E)–(H) show tubule formation by HPTCs suspended in matrigel. (E) Initially, single cells or small groups of cells are present. Note that most of these structures distributed in the 3D gel are out of focus, if a given field is imaged and appear as blurred rings on the images. (F, G) Cell outgrowth occurs (no cyst formation before cell outgrowth), leading to the formation of elongated cords or tubules. The tip cells are typically branched and display multiple filopodia (shown as enlarged in the insets; the branched cell shown in (F) appears blurred due to problems with imaging these structures within the gel). (H) Finally, thin tubules displaying multiple branches are formed. The size of tubules formed in matrigel is typically less than 1 mm, and the tubules are not attached to myofibroblast aggregates (note the different morphology of the structures shown in D and H). Scale bars: (A–D) 1 mm, (E–G) 100 μm and (H) 500 μm.
In order to test whether matrigel had an influence on the process of tubulogenesis, we have investigated tubule formation in matrigel-coated multiwell plates, where HPTCs grew on top of the matrigel coating. Under these conditions, tubule formation occurred in a similar way as observed before on 2D surfaces (Fig. 5A–D). Generally, we found that different ECM coatings consisting of laminin, collagen IV, a mixture of these components or other components could influence the timing of monolayer reorganization [30], and the extent of myofibroblast aggregation and tubule formation (Fig. S1). However, when tubules were formed on 2D surfaces, they always occurred by the same process as illustrated in Figures 1 and 5A–D, regardless of the ECM coating used (data not shown). Tubulogenesis occurred also on uncoated 2D surfaces (Fig. S1), when HPTCs from a given donor grew and survived under such conditions (growth and survival of HPTCs on uncoated surfaces shows interdonor variability).
Together, the results showed that HPTCs form small and branched tubules in 3D gels by a process of budding and branching morphogenesis, whereas large and straight tubules are formed on 2D surfaces by a process involving large-scale reorganizations of epithelial monolayers and interactions between epithelial cells and myofibroblasts. These findings suggest that the different morphologies of the tubules observed depend on the different processes of tubule formation involved.
Tubule formation on 2D surfaces is enhanced by a 3D architecture
Although renal tubule formation occurred on 2D surfaces, several observations suggested that formation of 3D tissue-like structures by HPTCs was enhanced by a 3D substrate architecture. Most striking was the finding that a closed circle formed by several tubules with attached myofibroblast aggregates could be formed within a well close to its edge, with all tubules displaying a similar distance to the edge (Fig. 6A, B). By contrast to the centre of the well, the edge of the well has a 3D architecture. Another observation suggesting a crucial role for a 3D architecture in enhancing tubule formation was that initial retraction of the epithelial monolayer started in most cases first at the edge of the well (Fig. 6C, D).
Fig 6.

Sensing of a 3D edge triggers tubulogenesis. (A and B) show two wells of 24-well plates with HPTCs. Multiple tubules with attached myofibroblast aggregates (two of these structures are marked by arrows) are present within these wells (well diameter = 15 mm). The tubules always display a similar distance from the edge, which leads to the generation of ring-like structures consisting of tubules. (C and D) show initial retraction of the monolayer starting at the edge the wells. Uneven illumination is due to optical effects at the edge. The direction where the edge is located is indicated by large arrowheads, and part of the edge is visible in the upper right corner in (C). A part of the monolayer is visible in the lower left corner in (C). All cells of the monolayer moved simultaneously from the edge towards the centre, leaving an almost void surface behind. (D) shows a cell layer that retracted from the edge. Here, coordinated retraction from the opposite side has started, which breaks up the cell layer (marked by small arrowheads) at defined distances from the outer rim. Scale bars: (A, B) 3 mm and (C, D) 500 μm.
In order to determine whether the presence of a 3D edge indeed enhanced the initiation of tubule formation, we seeded cells in parallel on 18 mm cover slips (no 3D edge), 24-well cell culture plates (with 3D edge) and diagnostic printed slides (with 3D edge). Figure 7 shows that initial retraction of the epithelium first occurred at the edges of the wells of the 24-well plates (well diameter = 15 mm) and diagnostic printed slides (well diameter = 2 mm). Subsequently, monolayer reorganization as well as cell aggregate and tubule formation were observed within the wells of these devices. By contrast, the epithelial monolayer was not reorganized on cover slips during the monitoring period of 8 days, and no retraction of the monolayer occurred at the edges of the cover slips (Fig. 7).
Fig 7.

Triggering of tubulogenesis in the presence of a 3D substrate architecture. HPTCs were grown to confluency on glass cover slips (A, D and G), in the wells of 24-well plates consisting of tissue culture plastic (B, E and H), and in the wells of diagnostic printed slides (C, F and I). Cover slips with a side length of 18 mm are used. The wells of 24-well plates and diagnostic printed slides are 15 mm and 2 mm in diameter, respectively. Cells on the different devices are monitored over a time period of 8 days. (A)–(C) show the confluent monolayers at day 2. The edges of the different substrates used are indicated by large arrowheads. (E, F) Monolayer retraction starts at day 3 at the edges of the wells (marked by large arrowheads) of 24-well plates and diagnostic printed slides. This leads to areas devoid of cells (marked by a small arrowhead in F). No rearrangements are observed at (D) day 3 and (G) day 8 at the edges of cover slips (marked by large arrowheads), which do not have a 3D structure. The monolayer is still intact on cover slips. By contrast, major rearrangements are noted at day 8 in the wells of (H) 24-well plates and (I) diagnostic printed slides. Formation of tubules (marked by small arrowhead in H) and myofibroblast aggregates (marked by small arrowhead in I) is observed. The wells of 24-well plates and diagnostic printed slides provide different surface chemistries and surface areas. However, in both cases, the edge is a 3D structure, in contrast to the edge of cover slips. Scale bar: 500 μm.
The surface material was glass in the case of cover slips and diagnostic printed slides, whereas 24-well plates consisted of tissue culture plastic. Furthermore, these items are different in sizes, and thus the numbers of cells that could be involved in the reorganization processes on the different surfaces were also different. The results suggested that tubule formation was not dependent on the material, surface area and cell numbers involved, but was only dependent on the presence of a 3D edge.
It is currently unclear how HPTCs sense the edge. An important parameter could be lateral attachment of the outermost cells to the rigid wall of the well. In order to find out whether cells might sense the rigid wall, we seeded HPTCs into glass capillaries. In glass capillaries, HPTCs could only attach with their basal sides to the rigid substrate, but not with their lateral sides. Furthermore, it was important to find out whether the process of tubule formation might be inhibited if the cells were already arranged into a tubular architecture. This question is of major practical importance, because HPTCs are applied in BAKs, where they grow within hollow fibre membranes. Tubule formation within such hollow fibre membranes would be a major challenge in BAKs.
Figure 8 shows that HPTCs formed tubules within capillaries. These results demonstrated that tubule formation was not inhibited by arranging HPTCs into a pre-formed tubular architecture. Tubule formation within capillaries was accomplished by the same process as employed on 2D surfaces, involving monolayer formation and subsequent appearance of myofibroblast aggregates. Obviously, this process would lead to hollow fibre clogging in BAKs. The results also revealed that lateral attachment to a rigid substrate was not important for the sensing of a 3D environment. Three-dimensional edges were probably sensed indirectly through the impact of the substrate architecture on surface tension and fluid dynamics of the medium [35].
Fig 8.
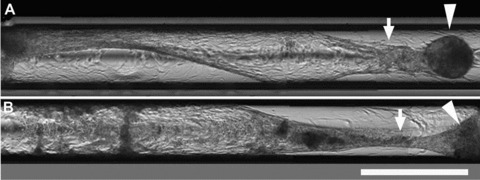
Tubulogenesis in capillaries. HPTCs are seeded into glass capillaries with an inner diameter of 580 μm. (A) and (B) show two different capillaries containing HPTCs imaged ∼2 weeks after seeding. Several images were stitched together in order to cover a larger area. Initially after seeding, monolayers covering the inner walls of the capillaries are formed. The monolayer is still intact in the left half of the lower capillary (B). Myofibroblast aggregates appear after monolayer formation. The monolayer is then rearranged and detached from the capillary walls, and tubules are formed within the capillaries (marked by arrows), which are attached to myofibroblast aggregates (marked by arrowheads). Scale bar: 1 mm.
TGF-1 induces the initial steps of human renal tubule formation on 2D surfaces
Besides substrate architecture, interactions between epithelial cells and myofibroblasts appeared to be important for tubule formation. Unresolved questions included where the myofibroblasts were derived from, whether their presence was due to contaminations of the epithelial cells and what role they played in tubule formation. Figure 9C shows that α-SMA-expressing cells were not detectable by immunostaining in the initial cultures of HPTCs. The expression levels of α-SMA, as determined by qRT-PCR, were very low in such initial cultures, and were not higher than the expression levels in HeLa cells or human embryonic kidney (HEK) 293 cells (Fig. 9A). HeLa cells are negative for α-SMA [36], and HeLa as well HEK293 cells are well-established epithelial cell lines free of contaminations with other cell types.
Fig 9.
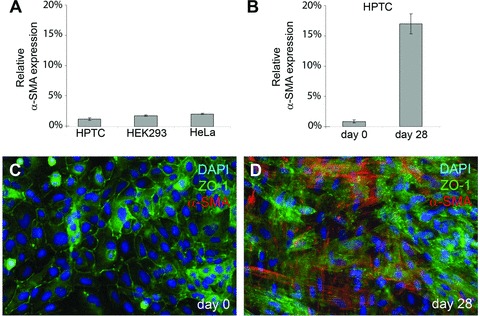
α-SMA expression in initial and 4-week-old cultures of HPTCs. (A) The expression levels of α-SMA (relative to GAPDH, average ± S.D.) were determined by qRT-PCR in initial cultures of HPTCs. These initial cultures contained cells freshly seeded from the vial obtained from the vendor, and the cells had not been passaged before analysis. The analysis was performed as soon as an epithelial sheet had been formed. For comparison, similar qRT-PCR analyses were also performed with confluent monolayer cultures of HEK293 and HeLa cells, and the results are shown. (B) α-SMA expression (relative to GAPDH, average ± S.D.) was determined by qRT-PCR in initial cultures of HPTCs (day 0) and 28 days later in cultures that were seeded in parallel. The cultures were not passaged during this time period, but the medium was regularly exchanged. (C) The image shows an initial culture of HPTCs (day 0) after co-immunostaining (ZO-1: green, α-SMA: red, DAPI: blue). α-SMA was not detectable. (D) The same co-immunostaining procedure was performed after 28 days with cultures seeded in parallel. Many α-SMA-expressing cells are present.
By contrast, large amounts of α-SMA-expressing cells could be detected by immunostaining after maintaining such initially myofibroblast-free HPTC cultures for 4 weeks under in vitro conditions (Fig. 9D). Accordingly, the expression levels, as detected by qRT-PCR, increased (Fig. 9B). As kidney epithelial cells can transdifferentiate into myofibroblasts under in vitro conditions by an epithelial-to-mesenchymal transition process [37], the most likely explanation for the appearance of myofibroblasts in the initially myofibroblast-free HPTC cultures is transdifferentiation of epithelial cells into myofibroblasts by an epithelial-to-mesenchymal transition process. The data also indicate that the initial cultures of HPTCs were not contaminated with α-SMA-expressing myofibroblasts. As tubulogenesis was initiated in the vicinity of myofibroblast aggregates, we examined which types of myofibroblast-derived signalling molecules were expressed in our in vitro cultures (Fig. 10A). The expression levels of myofibroblast-derived growth factors were determined by qRT-PCR in parallel with the expression levels of the myofibroblast marker α-SMA. In vitro cultures were monitored over a time period 4 weeks. Typically, myofibroblast aggregates appeared after 1–2 weeks of in vitro culture (Fig. S1). Cell loss could occur in the course of reorganization events due to detachment of huge cell aggregates and epithelial sheets.
Fig 10.

Growth factor expression and effects of TGF-β1. (A) The expression levels of TGF-β1, α-SMA, leukaemia inhibitory factor, fibroblast growth factor 2, keratinocyte growth factor and hepatocyte growth factor are monitored over a period of 4 weeks. The expression levels are determined by quantitative RT-PCR, and displayed as percentages of GAPDH expression. The five different bars displayed for each factor show the relative expression levels (average ± S.D.) at day 1 (week 0) and at weeks 1–4 after seeding. Results that are significantly different (P < 0.05) from the data obtained at day 1 are marked with an asterisk. Results that are significantly different (P < 0.05) from the data obtained at day 1 and at week 1 are marked with two asterisks. (B)–(D) show the cells treated for 3 days with 10 ng/ml of TGF-β1 after monolayer formation. TGF-β1 treatment induced rearrangements leading to the formation of condensed stripes of cells and areas devoid of cells (B, D). (C) shows a cell aggregate. (E) displays the untreated control cells, whereby the intact monolayer is maintained. Scale bar: 500 μm.
The results revealed that keratinocyte growth factor and hepatocyte growth factor were not expressed or were expressed at very low levels. In contrast, substantial expressions of TGF-β1, leukaemia inhibitory factor and fibroblast growth factor 2 were observed, along with the expression of α-SMA. In all of these cases, a massive increase in expression levels was observed after 1 week of in vitro culture. This was in accordance with the observation that myofibroblasts appeared after 1–2 weeks of in vitro culture, and the expression levels of α-SMA and TGF-β1 remained high until the second week. The expression levels of leukaemia inhibitory factor and fibroblast growth factor 2 dropped after week 1, suggesting down regulation. The levels of TGF-β1 and α-SMA expression were significantly lower at week 3 (as compared to week 2), and this might reflect down regulation and/or cell loss. The expression levels of TGF-β1 significantly increased again at the end of the monitoring period (week 4).
It has been described before that TGF-β1 triggers the initial steps of tubule formation on 2D surfaces, namely the formation of a condensed stripe or cord of cells from a monolayer [38]. As these previous experiments were performed with rabbit cells, we tested here whether primary human cells reacted in a similar way. Indeed, treatment with TGF-β1 led to rearrangement of the monolayer into a condensed stripe of cells and to the formation of cell aggregates (Fig. 10B–D). This result showed that TFG-β1 induced the initial steps of human renal tubule formation on 2D surfaces.
Discussion
Herein we showed that HPTCs form large and functional human renal tubules on 2D surfaces. Tubulogenesis on 2D surfaces involved large-scale reorganizations of epithelial sheets around myofibroblast aggregates. Budding and branching morphogenesis, typically occurring in 3D gels [3–12], did not play a role, and these processes are also not involved in proximal tubule formation in vivo[1, 2, 39]. Tubulogenesis on 2D surfaces was induced by TGF-β1, which was probably released in the in vitro system by myofibroblast aggregates. It is well documented that myofibroblasts release TGF-β1[40], but a possible contribution of epithelial cells to the increased levels of TGF-β1 expression observed must be carefully addressed in future studies.
Increased expression of TGF-β1 and appearance of myofibroblasts are a normal response to kidney injury [41–45], and might reflect in the cell culture system described here a response of HPTCs to organ disruption and artificial in vitro conditions. Remarkably, functional tissue-like structures were reorganized in this in vitro system after the appearance of myofibroblasts and increased TGF-β1 expression. It is thought that myofibroblasts and TGF-β1 have important roles in tissue regeneration after injury [41, 42], apart from their prominent roles in fibrosis, which is difficult to study in vivo. The in vitro system described here allows us to study in detail the roles of TGF-β1, myofibroblasts and other factors in proximal tubule regeneration. It might also be interesting for the screening of anti-fibrotic drugs, which should inhibit accumulation of myofibroblasts and down regulate TGF-β1. Furthermore, this in vitro system allows us to investigate in vitro how tissue-like structures are generated by different interacting cell types in the absence of an organizing matrix.
Our finding that the addition of TGF-β1 induced the initial steps of tubulogenesis on 2D surfaces is in accordance with the results of a previous study performed with rabbit cells [38]. Although the role of TGF-β1 in tubulogenesis on 2D surfaces would be further underlined by showing that anti-TGF-β1 antibodies inhibit tubule formation, we were not able to perform such experiments, simply because the cells consistently died after antibody application (antibodies from three different companies were tested). The reasons for cell death are unclear, but probably the HPTCs used require low amounts of TGF-β1 for survival. Nevertheless, we found that tubule formation on 2D surfaces is inhibited by bone morphogenetic protein 7, which is another growth factor from the TGF-β superfamily that counteracts TGF-β1-induced effects [46, 47]. Due to space limitations, the factors and conditions inhibiting the processes described here are outlined in detail elsewhere (Farah Tasnim, Jackie Y. Ying and Daniele Zink, unpublished data).
Inhibition of tubule formation would be particularly important in BAKs using hollow fibre membranes seeded with proximal tubule cells [21–29]. So far, this problem has not been addressed in studies on BAK development. One article published in 1992 describes tubule formation on 2D surfaces [38]. However, that study, which uses rabbit proximal tubule cells, only outlined that tubule formation on 2D surfaces depends on exogenously added TGF-β1, epidermal growth factor and retinoic acid. Spontaneous occurrence of this phenomenon, which is the major cell-related problem in BAK development in our experience ([30] and data not shown) and is likely induced by TGF-β1 released by the cells, was not described. This might be one of the reasons why spontaneous tubule formation has not been recognized, so far, as a problem in BAK development.
Proximal tubules generated on 2D surfaces are interesting for a variety of applications. In contrast to renal tubules generated in 3D gels, the tubules generated on 2D surfaces were easily accessible for manipulations, and drugs could be applied in a highly controlled manner. In addition, renal tubules exposed on 2D surfaces could be easily imaged by high-resolution light microscopy. These properties make this in vitro model interesting, for instance, for applications in tubular transport studies and in vitro nephrotoxicology. In vitro generated human proximal tubules might be a physiologically more relevant test system than monolayers of animal or human renal tubule cells, which are currently widely used for in vitro nephrotoxicology [13–20].
Acknowledgments
The authors thank Dr. Pei-Yong Chow, Dr. Sean Liour, Dr. Karthikeyan Kandasamy, Joscha Muck and Yong Yeow Lee for valuable help and discussions, and for providing materials. This work is supported by the Institute of Bioengineering and Nanotechnology (Biomedical Research Council, Agency for Science, Technology and Research, Singapore).
Conflict of interest
The authors confirm that there are no conflicts of interest.
Supporting Information
Primers used to determine expression levels of the genes indicated.
Formation of multicellular structures ondifferent ECM coatings and interdonor variability. (A)Illustration of the procedure used to quantify multicellularstructures (myofibroblast aggregates and tubules). The left-handpanel shows an image of a well (diameter: 15 mm), which had beencoated with human collagen IV. HPTCs had been cultured in the wellfor a period of 4 weeks and were fixed and stained with toluidineblue before imaging. Note that after a culture period of 4 weeks,many myofibroblast aggregates but no tubules are present. Theoriginal grey scale image (left) was converted into a binary image(middle). A mask and a 'zoning procedure' were applied to the imageto exclude the edges of the well from the analysis. Due to opticaleffects, these regions always appeared dark on the binary imagesand would have been falsely counted as multicellular structures.The percentage of the surface of the well covered by structuresappearing dark on the binary image was then determined. The imageanalysis was performed with Adobe Photoshop CS3 Extended software.(B) Percentages of the wells' surfaces covered bymulticellular structures formed by HPTCs (scale on y-axis,average ± S.D., n = 3). The wells were coated withhuman collagen IV (Col IV), a mixture of human collagen IV (150μg/ml) and laminin (100 μg/ml) (Col IV + Lam) or matrigel,respectively. Measurements were performed after 1 week, 2 weeks, 3weeks and 4 weeks of culture (left to right in each group of fourbars; mean ± S.D., n = 3). No extensive formation ofmulticellular structures occurred during the first week on allcoatings tested. The first wave of myofibroblast aggregate andtubule formation then occurred during week 2 on all coatings. Aftera couple of days, the multicellular structures typicallyrearranged, increased in size and detached. This explained thedecrease in the extent of these structures after week 2 (collagen +laminin and matrigel coatings) or week 3 (collagen IV coating),respectively. Compared to the other coatings tested, the formationof multicellular structures and their detachment was delayed oncollagen IV coatings. After the first round of formation ofmulticellular structures and their detachment, a dynamic andongoing process of new formation and detachment of myofibroblastaggregates occurred. This was the reason why a relatively highpercentage of the surface remained covered by multicellularstructures during the entire observation period of 4 weeks.Nevertheless, after the epithelium was disrupted during the firstround of myofibroblast aggregate and tubule formation, theepithelium remained disrupted and no more tubules were formed.Thus, the multicellular structures detected after the first roundof detachment were only myofibroblast aggregates, but not tubules(see also A of this figure). (C) Primary humanumbilical vein endothelial cells (HUVECs) were used as control. Theexperiment was performed in the same way as with HPTCs (B).HUVECs could form tiny capillary-like structures on 2D surfaces,which were much smaller than the large tubules formed by HPTCs.HUVECs did not form myofibroblast aggregates. (D) Interdonorvariability. Three different batches of HPTCs (batches #3571, #3592and #3599, each batch of cells derived from a different donor) wereused. Cells were seeded into wells (no ECM coating; growth andsurvival on uncoated tissue-culture plastic also showed interdonorvariability), and were cultured for up to 15 days. Formation ofmulticellular structures was determined at the indicatedtime-points (average ± S.D., n = 3) as described inthe legends of (A) and (B). The extent of formationof multicellular structures showed interdonor variability, and washighest in batch #3599. The data also indicated that most of thetubules and myofibroblast aggregates, which were formed initially,detached within a period of three days (batches #3592 and #3599:between day 10 and day 13). (E) Images of wells containingHPTCs derived from different batches as indicated. The wells(diameters: 15 mm) were imaged at day 10 after seeding, and thecells were fixed and stained with toluidine blue. The blackarrowhead in the right-hand panel (batch #3599) pointed to amyofibroblast aggregate attached to a tubule that was beingformed.
Morphology of tubules formed by HPTCs inmatrigel. The panels show different focal planes of a branchedtubular structure. The branched structure comprised of convolutedtubules (marked by arrowheads) and straight tubules. The thinnertubules are continuous with wider lacunae in the middle of thestructure. Intersections between tubules and lacunae are markedwith arrows. Scale bar: 100 μm.
References
- 1.Dressler G. Tubulogenesis in the developing mammalian kidney. Trends Cell Biol. 2002;12:390–5. doi: 10.1016/s0962-8924(02)02334-6. [DOI] [PubMed] [Google Scholar]
- 2.Vainio S, Lin Y. Coordinating early kidney development: lessons from gene targeting. Nat Rev Genet. 2002;3:533–43. doi: 10.1038/nrg842. [DOI] [PubMed] [Google Scholar]
- 3.Han HJ, Sigurdson WJ, Nickerson PA, et al. Both mitogen activated protein kinase and the mammalian target of rapamycin modulate the development of functional renal proximal tubules in matrigel. J Cell Sci. 2004;117:1821–33. doi: 10.1242/jcs.01020. [DOI] [PubMed] [Google Scholar]
- 4.Humes HD, Krauss JC, Cieslinski DA, et al. Tubulogenesis from isolated single cells of adult mammalian kidney: clonal analysis with a recombinant retrovirus. Am J Physiol. 1996;271:F42–9. doi: 10.1152/ajprenal.1996.271.1.F42. [DOI] [PubMed] [Google Scholar]
- 5.Karihaloo A, Nickel C, Cantley LG. Signals which build a tubule. Nephron Exp Nephrol. 2005;100:e40–5. doi: 10.1159/000084111. [DOI] [PubMed] [Google Scholar]
- 6.Lubarsky B, Krasnow MA. Tube morphogenesis: making and shaping biological tubes. Cell. 2003;112:19–28. doi: 10.1016/s0092-8674(02)01283-7. [DOI] [PubMed] [Google Scholar]
- 7.Montesano R, Matsumoto K, Nakamura T, et al. Identification of a fibroblast-derived epithelial morphogen as hepatocyte growth factor. Cell. 1991;67:901–8. doi: 10.1016/0092-8674(91)90363-4. [DOI] [PubMed] [Google Scholar]
- 8.Montesano R, Schaller G, Orci L. Induction of epithelial tubular morphogenesis in vitro by fibroblast-derived soluble factors. Cell. 1991;66:697–711. doi: 10.1016/0092-8674(91)90115-f. [DOI] [PubMed] [Google Scholar]
- 9.Nickel C, Benzing T, Sellin L, et al. The polycystin-1 C-terminal fragment triggers branching morphogenesis and migration of tubular kidney epithelial cells. J Clin Invest. 2002;109:481–9. doi: 10.1172/JCI12867. [DOI] [PMC free article] [PubMed] [Google Scholar]
- 10.Sakurai H, Barros EJ, Tsukamoto T, et al. An in vitro tubulogenesis system using cell lines derived from the embryonic kidney shows dependence on multiple soluble growth factors. Proc Natl Acad Sci USA. 1997;94:6279–84. doi: 10.1073/pnas.94.12.6279. [DOI] [PMC free article] [PubMed] [Google Scholar]
- 11.Taub M, Wang Y, Szczesny TM, et al. Epidermal growth factor or transforming growth factor alpha is required for kidney tubulogenesis in matrigel cultures in serum-free medium. Proc Natl Acad Sci USA. 1990;87:4002–6. doi: 10.1073/pnas.87.10.4002. [DOI] [PMC free article] [PubMed] [Google Scholar]
- 12.Zegers MM, O’Brien LE, Yu W, et al. Epithelial polarity and tubulogenesis in vitro. Trends Cell Biol. 2003;13:169–76. doi: 10.1016/s0962-8924(03)00036-9. [DOI] [PubMed] [Google Scholar]
- 13.Chen N, Aleksa K, Woodland C, et al. The effect of N-acetylcysteine on ifosfamide-induced nephrotoxicity: in vitro studies in renal tubular cells. Transl Res. 2007;150:51–7. doi: 10.1016/j.trsl.2007.02.001. [DOI] [PubMed] [Google Scholar]
- 14.Copeland JW, Beaumont BW, Merrilees MJ, et al. Epithelial-to-mesenchymal transition of human proximal tubular epithelial cells: effects of rapamycin, mycophenolate, cyclosporin, azathioprine, and methylprednisolone. Transplantation. 2007;83:809–14. doi: 10.1097/01.tp.0000255680.71816.aa. [DOI] [PubMed] [Google Scholar]
- 15.Li W, Lam M, Choy D, et al. Human primary renal cells as a model for toxicity assessment of chemo-therapeutic drugs. Toxicol In Vitro. 2006;20:669–76. doi: 10.1016/j.tiv.2005.09.016. [DOI] [PubMed] [Google Scholar]
- 16.Luhe A, Kunkele KP, Haiker M, et al. Preclinical evidence for nitrogen-containing bisphosphonate inhibition of farnesyl diphosphate (FPP) synthase in the kidney: implications for renal safety. Toxicol In Vitro. 2008;22:899–909. doi: 10.1016/j.tiv.2008.01.006. [DOI] [PubMed] [Google Scholar]
- 17.McMorrow T, Gaffney MM, Slattery C, et al. Cyclosporine A induced epithelial-mesenchymal transition in human renal proximal tubular epithelial cells. Nephrol Dial Transplant. 2005;20:2215–25. doi: 10.1093/ndt/gfh967. [DOI] [PubMed] [Google Scholar]
- 18.Pallet N, Rabant M, Xu-Dubois YC, et al. Response of human renal tubular cells to cyclosporine and sirolimus: a toxicogenomic study. Toxicol Appl Pharmacol. 2008;229:184–96. doi: 10.1016/j.taap.2008.01.019. [DOI] [PubMed] [Google Scholar]
- 19.Pfaller W, Gstraunthaler G. Nephrotoxicity testing in vitro–what we know and what we need to know. Environ Health Perspect. 1998;106:559–69. doi: 10.1289/ehp.98106559. [DOI] [PMC free article] [PubMed] [Google Scholar]
- 20.Rached E, Hoffmann D, Blumbach K, et al. Evaluation of putative biomarkers of nephrotoxicity after exposure to ochratoxin A in vivo and in vitro. Toxicol Sci. 2008;103:371–81. doi: 10.1093/toxsci/kfn040. [DOI] [PubMed] [Google Scholar]
- 21.Fissell WH, Dyke DB, Weitzel WF, et al. Bioartificial kidney alters cytokine response and hemodynamics in endotoxin-challenged uremic animals. Blood Purif. 2002;20:55–60. doi: 10.1159/000046986. [DOI] [PubMed] [Google Scholar]
- 22.Huijuan M, Xiaoyun W, Xumin Y, et al. Effect of continuous bioartificial kidney therapy on porcine multiple organ dysfunction syndrome with acute renal failure. Asaio J. 2007;53:329–34. doi: 10.1097/MAT.0b013e3180590be5. [DOI] [PubMed] [Google Scholar]
- 23.Humes HD, Buffington DA, MacKay SM, et al. Replacement of renal function in uremic animals with a tissue-engineered kidney. Nat Biotechnol. 1999;17:451–5. doi: 10.1038/8626. [DOI] [PubMed] [Google Scholar]
- 24.Humes HD, Fissell WH, Weitzel WF, et al. Metabolic replacement of kidney function in uremic animals with a bioartificial kidney containing human cells. Am J Kidney Dis. 2002;39:1078–87. doi: 10.1053/ajkd.2002.32792. [DOI] [PubMed] [Google Scholar]
- 25.Humes HD, Weitzel WF, Bartlett RH, et al. Initial clinical results of the bioartificial kidney containing human cells in ICU patients with acute renal failure. Kidney Int. 2004;66:1578–88. doi: 10.1111/j.1523-1755.2004.00923.x. [DOI] [PubMed] [Google Scholar]
- 26.Inagaki M, Yokoyama TA, Sawada K, et al. Prevention of LLC-PK(1) cell overgrowth in a bioartificial renal tubule device using a MEK inhibitor, U0126. J Biotechnol. 2007;132:57–64. doi: 10.1016/j.jbiotec.2007.08.025. [DOI] [PubMed] [Google Scholar]
- 27.MacKay SM, Funke AJ, Buffington DA, et al. Tissue engineering of a bioartificial renal tubule. Asaio J. 1998;44:179–83. doi: 10.1097/00002480-199805000-00011. [DOI] [PubMed] [Google Scholar]
- 28.Saito A, Aung T, Sekiguchi K, et al. Present status and perspectives of bioartificial kidneys. J Artif Organs. 2006;9:130–5. doi: 10.1007/s10047-006-0336-1. [DOI] [PubMed] [Google Scholar]
- 29.Tumlin J, Wali R, Williams W, et al. Efficacy and safety of renal tubule cell therapy for acute renal failure. J Am Soc Nephrol. 2008;19:1034–40. doi: 10.1681/ASN.2007080895. [DOI] [PMC free article] [PubMed] [Google Scholar]
- 30.Zhang H, Tasnim F, Ying JY, et al. The impact of extracellular matrix coatings on the performance of human renal cells applied in bioartificial kidneys. Biomaterials. 2009;30:2899–911. doi: 10.1016/j.biomaterials.2009.01.046. [DOI] [PubMed] [Google Scholar]
- 31.Masereeuw R, Moons MM, Toomey BH, et al. Active lucifer yellow secretion in renal proximal tubule: evidence for organic anion transport system crossover. J Pharmacol Exp Ther. 1999;289:1104–11. [PubMed] [Google Scholar]
- 32.Miller DS, Letcher S, Barnes DM. Fluorescence imaging study of organic anion transport from renal proximal tubule cell to lumen. Am J Physiol. 1996;271:F508–20. doi: 10.1152/ajprenal.1996.271.3.F508. [DOI] [PubMed] [Google Scholar]
- 33.Altenberg GA, Vanoye CG, Han ES, et al. Relationships between rhodamine 123 transport, cell volume, and ion-channel function of P-glycoprotein. J Biol Chem. 1994;269:7145–9. [PubMed] [Google Scholar]
- 34.Lelong IH, Guzikowski AP, Haugland RP, et al. Fluorescent verapamil derivative for monitoring activity of the multidrug transporter. Mol Pharmacol. 1991;40:490–4. [PubMed] [Google Scholar]
- 35.Cottingham MG, Bain CD, Vaux DJ. Rapid method for measurement of surface tension in multiwell plates. Lab Invest. 2004;84:523–9. doi: 10.1038/labinvest.3700054. [DOI] [PubMed] [Google Scholar]
- 36.Kelynack KJ, Hewitson TD, Nicholls KM, et al. Human renal fibroblast contraction of collagen I lattices is an integrin-mediated process. Nephrol Dial Transplant. 2000;15:1766–72. doi: 10.1093/ndt/15.11.1766. [DOI] [PubMed] [Google Scholar]
- 37.Fan JM, Ng YY, Hill PA, et al. Transforming growth factor-beta regulates tubular epithelial-myofibroblast transdifferentiation in vitro. Kidney Int. 1999;56:1455–67. doi: 10.1046/j.1523-1755.1999.00656.x. [DOI] [PubMed] [Google Scholar]
- 38.Humes HD, Cieslinski DA. Interaction between growth factors and retinoic acid in the induction of kidney tubulogenesis in tissue culture. Exp Cell Res. 1992;201:8–15. doi: 10.1016/0014-4827(92)90342-6. [DOI] [PubMed] [Google Scholar]
- 39.Bard JB, Gordon A, Sharp L, et al. Early nephron formation in the developing mouse kidney. J Anat. 2001;199:385–92. doi: 10.1046/j.1469-7580.2001.19940385.x. [DOI] [PMC free article] [PubMed] [Google Scholar]
- 40.Powell DW, Mifflin RC, Valentich JD, et al. Myofibroblasts. I. Paracrine cells important in health and disease. Am J Physiol. 1999;277:C1–9. doi: 10.1152/ajpcell.1999.277.1.C1. [DOI] [PubMed] [Google Scholar]
- 41.Badid C, Mounier N, Costa AM, et al. Role of myofibroblasts during normal tissue repair and excessive scarring: interest of their assessment in nephropathies. Histol Histopathol. 2000;15:269–80. doi: 10.14670/HH-15.269. [DOI] [PubMed] [Google Scholar]
- 42.Ishibe S, Cantley LG. Epithelial-mesenchymal-epithelial cycling in kidney repair. Curr Opin Nephrol Hypertens. 2008;17:379–85. doi: 10.1097/MNH.0b013e3283046507. [DOI] [PubMed] [Google Scholar]
- 43.Qi W, Chen X, Poronnik P, et al. The renal cortical fibroblast in renal tubulointerstitial fibrosis. Int J Biochem Cell Biol. 2006;38:1–5. doi: 10.1016/j.biocel.2005.09.005. [DOI] [PubMed] [Google Scholar]
- 44.Simic P, Vukicevic S. Bone morphogenetic proteins in development and homeostasis of kidney. Cytokine Growth Factor Rev. 2005;16:299–308. doi: 10.1016/j.cytogfr.2005.02.010. [DOI] [PubMed] [Google Scholar]
- 45.Yang J, Liu Y. Dissection of key events in tubular epithelial to myofibroblast transition and its implications in renal interstitial fibrosis. Am J Pathol. 2001;159:1465–75. doi: 10.1016/S0002-9440(10)62533-3. [DOI] [PMC free article] [PubMed] [Google Scholar]
- 46.Zeisberg M, Hanai J, Sugimoto H, et al. BMP-7 counteracts TGF-beta1-induced epithelial-to-mesenchymal transition and reverses chronic renal injury. Nat Med. 2003;9:964–8. doi: 10.1038/nm888. [DOI] [PubMed] [Google Scholar]
- 47.Wang S, Hirschberg R. BMP7 antagonizes TGF-beta-dependent fibrogenesis in mesangial cells. Am J Physiol Renal Physiol. 2003;284:F1006–13. doi: 10.1152/ajprenal.00382.2002. [DOI] [PubMed] [Google Scholar]
Associated Data
This section collects any data citations, data availability statements, or supplementary materials included in this article.
Supplementary Materials
Primers used to determine expression levels of the genes indicated.
Formation of multicellular structures ondifferent ECM coatings and interdonor variability. (A)Illustration of the procedure used to quantify multicellularstructures (myofibroblast aggregates and tubules). The left-handpanel shows an image of a well (diameter: 15 mm), which had beencoated with human collagen IV. HPTCs had been cultured in the wellfor a period of 4 weeks and were fixed and stained with toluidineblue before imaging. Note that after a culture period of 4 weeks,many myofibroblast aggregates but no tubules are present. Theoriginal grey scale image (left) was converted into a binary image(middle). A mask and a 'zoning procedure' were applied to the imageto exclude the edges of the well from the analysis. Due to opticaleffects, these regions always appeared dark on the binary imagesand would have been falsely counted as multicellular structures.The percentage of the surface of the well covered by structuresappearing dark on the binary image was then determined. The imageanalysis was performed with Adobe Photoshop CS3 Extended software.(B) Percentages of the wells' surfaces covered bymulticellular structures formed by HPTCs (scale on y-axis,average ± S.D., n = 3). The wells were coated withhuman collagen IV (Col IV), a mixture of human collagen IV (150μg/ml) and laminin (100 μg/ml) (Col IV + Lam) or matrigel,respectively. Measurements were performed after 1 week, 2 weeks, 3weeks and 4 weeks of culture (left to right in each group of fourbars; mean ± S.D., n = 3). No extensive formation ofmulticellular structures occurred during the first week on allcoatings tested. The first wave of myofibroblast aggregate andtubule formation then occurred during week 2 on all coatings. Aftera couple of days, the multicellular structures typicallyrearranged, increased in size and detached. This explained thedecrease in the extent of these structures after week 2 (collagen +laminin and matrigel coatings) or week 3 (collagen IV coating),respectively. Compared to the other coatings tested, the formationof multicellular structures and their detachment was delayed oncollagen IV coatings. After the first round of formation ofmulticellular structures and their detachment, a dynamic andongoing process of new formation and detachment of myofibroblastaggregates occurred. This was the reason why a relatively highpercentage of the surface remained covered by multicellularstructures during the entire observation period of 4 weeks.Nevertheless, after the epithelium was disrupted during the firstround of myofibroblast aggregate and tubule formation, theepithelium remained disrupted and no more tubules were formed.Thus, the multicellular structures detected after the first roundof detachment were only myofibroblast aggregates, but not tubules(see also A of this figure). (C) Primary humanumbilical vein endothelial cells (HUVECs) were used as control. Theexperiment was performed in the same way as with HPTCs (B).HUVECs could form tiny capillary-like structures on 2D surfaces,which were much smaller than the large tubules formed by HPTCs.HUVECs did not form myofibroblast aggregates. (D) Interdonorvariability. Three different batches of HPTCs (batches #3571, #3592and #3599, each batch of cells derived from a different donor) wereused. Cells were seeded into wells (no ECM coating; growth andsurvival on uncoated tissue-culture plastic also showed interdonorvariability), and were cultured for up to 15 days. Formation ofmulticellular structures was determined at the indicatedtime-points (average ± S.D., n = 3) as described inthe legends of (A) and (B). The extent of formationof multicellular structures showed interdonor variability, and washighest in batch #3599. The data also indicated that most of thetubules and myofibroblast aggregates, which were formed initially,detached within a period of three days (batches #3592 and #3599:between day 10 and day 13). (E) Images of wells containingHPTCs derived from different batches as indicated. The wells(diameters: 15 mm) were imaged at day 10 after seeding, and thecells were fixed and stained with toluidine blue. The blackarrowhead in the right-hand panel (batch #3599) pointed to amyofibroblast aggregate attached to a tubule that was beingformed.
Morphology of tubules formed by HPTCs inmatrigel. The panels show different focal planes of a branchedtubular structure. The branched structure comprised of convolutedtubules (marked by arrowheads) and straight tubules. The thinnertubules are continuous with wider lacunae in the middle of thestructure. Intersections between tubules and lacunae are markedwith arrows. Scale bar: 100 μm.