Abstract
Sestrin proteins have been implicated in multiple biological processes including resistance to oxidative and genotoxic stresses, protection against aging-related pathologies, and promotion of metabolic homeostasis; however, the underlying mechanisms are incompletely understood. Some evidence suggests that sestrins may inhibit mTORC1 (mechanistic target of rapamycin complex 1) through inhibition of RagA/B GTPases or activation of AMPK; however, whether sestrins are also involved in mTORC2 regulation and function is unclear. To investigate the functions and mechanisms of Sestrin 3 (Sesn3), we generated Sesn3 liver-specific transgenic and knockout mice. Our data show that Sesn3 liver-specific knockout mice exhibit insulin resistance and glucose intolerance, and Sesn3 transgenic mice were protected against insulin resistance induced by a high-fat diet. Using AMPK liver-specific knockout mice, we demonstrate that the Sesn3 insulin-sensitizing effect is largely independent of AMPK. Biochemical analysis reveals that Sesn3 interacts with and activates mTORC2 and subsequently stimulates Akt phosphorylation at Ser473. These findings suggest that Sesn3 can activate Akt via mTORC2 to regulate hepatic insulin sensitivity and glucose metabolism.
Introduction
Sestrins belong to a small family of evolutionally conserved proteins that are distinct from any other characterized eukaryotic protein families because they do not have any previously identified domain structures. Nevertheless, these proteins have been reported to play critical roles in protection against oxidative and genotoxic stresses, antiaging, and metabolic homeostasis (1). Mammals have three sestrin (Sesn) genes—Sesn1/2/3—which are regulated differently. For instance, Sesn2 can be induced by hydrogen peroxide, genotoxic agents, endoplasmic reticulum stressors, starvation, and a high-fat diet (HFD) (2–7). By contrast, Sesn3 is not induced by an HFD in mouse liver or by hydrogen peroxide in human primary myotubes (6,8). Interestingly, Sesn3 gene expression is increased in samples from leg muscle biopsies from patients with type 2 diabetes (8), and it is decreased in ethanol-treated hepatocytes and mouse liver (9).
Regarding molecular mechanisms, recent data suggest a critical role of AMPK in the mediation of sestrin functions, especially through inhibition of mechanistic target of rapamycin complex 1 (mTORC1). Sesn1 and Sesn2 can interact with the α-subunits of AMPK (AMPKα) and subsequently stimulate the enzyme activity (4). AMPK can suppress the mTORC1 activity through phosphorylation of tuberous sclerosis 2 (TSC2) and regulatory associated protein of mTORC1 (Raptor) (10,11). Recent reports also suggest that sestrins can modulate amino acid–stimulated mTORC1 activation through direct interaction with RagA/B GTPases or GATOR2 complex (12,13). Under overnutrition conditions, hyperactivation of mTORC1 may lead to a feedback inhibition of insulin receptor substrate 1 (IRS1) and consequently insulin resistance (14–18). With regard to antioxidative stress, sestrins can activate Nrf2 (also named Nfe2l2 for nuclear factor erythroid derived 2–like 2) through a p62 (also named Sqstm1 for sequestosome 1)–dependent autophagic degradation of kelch-like ECH-associated protein 1 (2).
Normal insulin action plays an essential role in metabolic homeostasis. In the insulin signaling pathway, Akt (thymoma viral proto-oncogene) kinases have been shown to be indispensable (19–21). Akt can be activated by at least two upstream kinases—Pdpk1 (also called Pdk1 for 3-phosphoinositide-dependent protein kinase 1) and mTORC2—through phosphorylation of Thr308 and Ser473 residues, respectively (22). The mTORC2 complex has several subunits: mTOR, Deptor, mLST8, Tti1/Tel2, Rictor, Sin1, and Protor1/2; the first four subunits are shared with the mTORC1 complex, which also has two unique subunits, Raptor and Pras40 (22). In recent years, significant progress toward understanding of the regulation of mTORC1 signaling and function has been made; however, regulation of mTORC2 is less understood (22,23). Several proteins have been reported to specifically interact with mTORC2 but not mTORC1 (24–29); however, whether they might be involved in the regulation of hepatic insulin sensitivity is not yet clear. In this study, we address the role of Sesn3 in the regulation of mTORC2 activity in the context of hepatic insulin sensitivity and glucose metabolism.
Research Design and Methods
Mouse Models
Sesn3 floxed mice were purchased from the European Conditional Mouse Mutagenesis Program (EUCOMM Consortium). To generate liver-specific Sesn3 knockout mice (Sesn3-LKO), the floxed mice were crossed with albumin-Cre transgenic mice (from The Jackson Laboratory) (30). Sesn3 conditional transgenic mice were developed in our laboratory using the CTV vector (CAG-STOP-eGFP-ROSA26TV; Addgene, Inc.) (31). The mouse Sesn3 gene coding sequence was first cloned into a pcDNA3 plasmid vector with a 3× hemagglutinin (HA) tag at the COOH terminus and then subcloned into the CTV targeting vector using PCR. The targeting constructs were transfected into mouse 129/SvJ embryonic stem cells, and positive clones were screened using PCR genotyping. Two positive clones were microinjected into mouse blastocysts to generate chimeric animals in the Transgenic and Knock-out Mouse Core at the Indiana University School of Medicine. The founder Sesn3 transgenic mice were crossed with albumin-Cre to generate mice with liver-specific Sesn3 overexpression (TgSesn3). The genetic background of Sesn3-LKO and TgSesn3 mice was mixed, including parental contributions from C57BL/6 and 129/Sv strains. We were aware that mouse genetic background may play a role in metabolic phenotypes (32,33). To reduce the contribution of different genetic backgrounds to the overall results, we used age- and sex-matched littermates as controls. AMPK α1 and α2 liver-specific double knockout (AMPK-LDKO) mice were generated by crossing albumin-Cre transgenic mice (C57BL/6J background) and α1 (Prkaa1) and α2 (Prkaa2) floxed mice (C57BL/6J background; from The Jackson Laboratory) (34). Some groups of mice were challenged with an HFD (TD.06414, 60% calories from fat; Harlan Laboratories). Mouse genotyping was performed by PCR using specific primers (Supplementary Table 1). Mice were housed in groups in standard mouse cages in a pathogen-free facility. All animal procedures were performed in accordance with the National Institutes of Health Guide for the Care and Use of Laboratory Animals and were approved by the Indiana University School of Medicine Institutional Animal Care and Use Committee.
Metabolic Analysis
Blood glucose was measured from the tail vein using a glucometer (Bayer Contour). Glucose tolerance tests were performed by intraperitoneally injecting 2 g/kg body weight d-glucose (dissolved in saline), as previously described (35), since body weights were comparable in most experiments. Insulin tolerance tests were performed by an intraperitoneal injection of regular human insulin (Humulin; Eli Lilly) at a dose of 0.5 or 1 unit/kg body weight after food withdrawal for 4 h (36).
DNA Construct Preparation and Recombinant Protein Purification
Mouse gene coding sequences for Sesn3, Akt1, Akt2, Sin1, Pras40, Protor1, and Pdpk1 were cloned by PCR using gene-specific primers (Supplementary Table 1) and inserted into a pcDNA3 mammalian expression vector that has an N-terminal FLAG or 3× HA tag. For imaging analysis, mouse Sesn3 was subcloned into a pLP-mCherry vector by PCR, and human RICTOR coding sequence (plasmid 11367; Addgene, Inc.) (37) was subcloned into a pEGFP vector using SalI and XmaI restriction enzyme sites. Mouse Sin1 and Protor1 coding sequences were also subcloned into a pEGFP vector by PCR. For recombinant protein preparation, mouse Sesn3, Sin1, Protor1, Rictor (COOH-terminal, 900 amino acids), and Akt1 coding sequences were subcloned into a pET-24 bacterial expression vector by PCR. To purify the recombinant proteins, BL21 bacteria were transformed with those plasmids and positive clones were selected for recombinant protein expression, with an overnight induction by isopropyl β-D-1-thiogalactopyranoside at 16°C. Bacteria were pelleted and homogenized in a lysis buffer (50 mmol/L NaH2PO4 [pH 7.4], 300 mmol/L NaCl, 10 mmol/L imidazole, 1 mmol/L phenylmethylsulfonyl fluoride), and the lysate was sonicated on ice. Since the recombinant protein has a 6× His tag, protein purification was performed using a HisPur Ni-NTA Purification Kit (Thermo Scientific).
Adenoviral Vector Preparation
To make Sesn3, Sin1, and GFP overexpression adenoviruses, mouse Sesn3, Sin1, and GFP coding sequences were first subcloned into a pShuttle-IRES-hrGFP-2 vector (Agilent) and then transferred to pAdEasy vector (Agilent). The constructs were transfected into human embryonic kidney (HEK)293A cells for adenoviral production. To make short hairpin RNA (shRNA) adenoviruses, gene-specific target shRNAs were designed using an online tool: BLOCK-iT (Life Technologies). The corresponding DNA oligonucleotides were synthesized (Integrated DNA Technologies) and cloned in a pENTR/U6 vector (Life Technologies). The pENTR/U6 constructs were recombined with pAd/BLOCK-iT vectors. The positive clones were used for transfection of HEK293A cells to make adenoviruses, as previously described (38). The sequences for the oligonucleotides used are included in Supplementary Table 1.
Primary Hepatocyte Isolation and Tissue Culture
Mouse primary hepatocytes were isolated using previously described methods (39). Hepatocytes were cultured in DMEM containing 4.5 g/L glucose, 10% FBS, and penicillin/streptomycin. HEK293A cells were cultured in the same media.
Cell Signaling Analysis
In vivo cell signaling was analyzed under conditions of refeeding (4 h) or 3-min insulin stimulation by an injection of 0.5 units regular human insulin into the vena cava under anesthesia after mice were starved overnight for 16 h. After the animals were killed, liver tissue was immediately frozen in liquid nitrogen. The liver samples were homogenized in the lysis buffer (50 mmol/L HEPES [pH 7.5], 150 mmol/L NaCl, 10% glycerol, 1% Triton X-100, 1.5 mmol/L MgCl2, 1 mmol/L EGTA, 10 mmol/L sodium pyrophosphate, 100 mmol/L sodium fluoride and freshly added 100 μmol/L sodium vanadate, 1 mmol/L phenylmethylsulfonyl fluoride, and cOmplete proteinase inhibitor cocktail [Roche]). Proteins were resolved on an SDS-PAGE gel and transferred to a nitrocellulose membrane. Immunoblot analysis was performed using the following primary antibodies: Actinin (Santa Cruz Biotechnology), Sesn1/2 (Proteintech Group), Sesn3 (Abcam), Sin1 (Bethyl Laboratories), Akt, Akt-pS473, Akt-pT308, S6K1, S6K-pT389, S6, S6-pS235/236, 4E-BP1-pT37/46, mTOR, Rictor, Raptor, AMPKα, and AMPKα-pT172 (Cell Signaling Technology), as previously described (36). For quantitative analysis, immunoblot band intensity was analyzed using Quantity One software (Bio-Rad). For each phosphorylation event, phosphorylation data were first normalized to total protein loading, and relative phosphorylation was compared with wild-type (WT) samples for fold-change analysis.
Protein-Protein Interaction Analysis
Immunoprecipitation (IP) and coimmunoprecipitation (co-IP) were used to analyze potential protein-protein interactions. These experiments were performed in either HEK293A cells (transfection) or mouse primary hepatocytes (adenoviral transduction). For general IP reactions, lysis buffer containing 1% Triton X-100 (40 mmol/L HEPES [pH 7.5], 120 mmol/L NaCl, 1 mmol/L EDTA, 10 mmol/L sodium pyrophosphate, 10 mmol/L sodium glycerophosphate, 50 mmol/L NaF, 1% Triton X-100, and cOmplete proteinase inhibitor cocktail [Roche]) was used. To immunoprecipitate mTORCs, a lysis buffer containing 0.3% CHAPS (40 mmol/L HEPES [pH 7.5], 120 mmol/L NaCl, 1 mmol/L EDTA, 10 mmol/L sodium pyrophosphate, 10 mmol/L sodium glycerophosphate, 50 mmol/L NaF, 0.3% CHAPS, and cOmplete proteinase inhibitor cocktail [Roche]) was used as previously reported (40). For co-IP reactions, the related DNA constructs were cotransfected into HEK293A cells. Two days after transfection, the cells were washed with PBS and lysed in the lysis buffer containing 1% Triton X-100. The co-IP reactions were incubated at 4°C overnight. The immunocomplexes were enriched by FLAG or HA agarose beads. The complexes were further analyzed by immunoblotting with a tag or specific antibodies.
In Vitro Akt Phosphorylation Analysis
To purify mTORC2 complexes, mouse primary hepatocytes were transduced with FLAG-Sin1 adenoviruses. Two days later, the cells were washed with cold PBS buffer, and homogenized in the lysis buffer containing 0.3% CHAPS. mTORC2 complexes were purified from hepatocyte lysates using FLAG-agarose beads (Sigma). Kinase assays were performed as previously described (40). Briefly, mTORC2 complexes were incubated with recombinant Akt1 in the presence or absence of recombinant Sesn3 in the kinase reaction buffer (25 mmol/L HEPES [pH 7.5], 100 mmol/L potassium acetate, 2 mmol/L MgCl2, 1 mmol/L ATP) for 30 min at 37°C. The reactions were stopped by adding the SDS gel sample buffer. Proteins were resolved using SDS-PAGE and further analyzed by immunoblotting with Akt-pS473 and total Akt antibodies.
Statistical Analysis
Multiple groups were compared using one-way ANOVA and Tukey post hoc test. Two-tailed unpaired Student t tests were used to assess statistical significance between two groups. Data were presented as mean ± SEM. P < 0.05 was considered statistically significant.
Results
Hepatic Sesn3 Regulates Insulin Sensitivity and Glucose Homeostasis
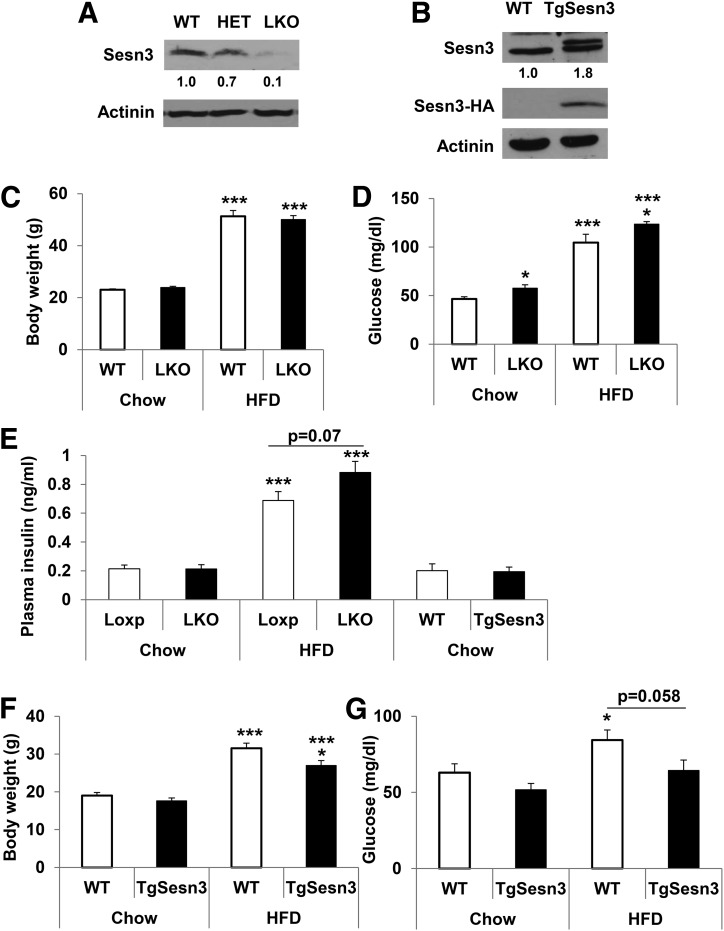
To investigate hepatic functions of Sesn3 in metabolism, we generated Sesn3-LKO and transgenic (TgSesn3) mice (Fig. 1A and B). Knockout of the Sesn3 gene did not cause any compensatory increase in Sesn1 and Sesn2 gene expression (Supplementary Fig. 1). To examine the effects of diet, animals were studied on either a diet of regular chow (18% calories from fat) or an HFD (60% calories from fat). While there was no significant difference in body weight between control WT and Sesn3-LKO mice on the same diet, fasting blood glucose concentrations were consistently higher in the Sesn3-LKO mice compared with the WT mice, regardless of diet (Fig. 1C and D). Plasma insulin concentrations had a trend of elevation in the Sesn3-LKO mice after an HFD for 6 weeks (Fig. 1E). In contrast, TgSesn3 mice had significantly lower body weight and exhibited a tendency of lower blood glucose on an HFD compared with the WT mice (Fig. 1F and G).
Figure 1.
Generation and phenotyping of Sesn3-LKO and TgSesn3 mice. A: Western blot analysis of hepatic Sesn3 in WT, heterozygous (HET), and homozygous Sesn3-LKO mice. B: Western blot analysis of hepatic Sesn3 in WT and Sesn3 liver-specific transgenic (TgSesn3) mice. C: Body weight measurements in WT (n = 10) and Sesn3-LKO mice (n = 14) fed regular chow and an 8-week HFD. Data are presented as mean ± SEM. ***P < 0.001 for HFD vs. chow. D: Blood glucose measurements after an overnight 16-h fast in WT (n = 10) and Sesn3-LKO mice (n = 14) fed regular chow and an 8-week HFD. Data are presented as mean ± SEM. *P < 0.05 for Sesn3-LKO vs. WT; ***P < 0.001 for HFD vs. chow. E: Plasma insulin was measured in WT, Sesn3-LKO, and TgSesn3 mice that were starved overnight (n = 8). Data are presented as mean ± SEM. ***P < 0.001 for HFD vs. chow. F: Body weight measurements in WT and Sesn3 transgenic mice (n = 5) fed regular chow and a 6-week HFD. Data are presented as mean ± SEM. *P < 0.05 for TgSesn3 vs. WT and ***P < 0.001 for HFD vs. chow. G: Blood glucose measurements after an overnight 16-h starvation in WT and Sesn3 transgenic mice (n = 5) fed regular chow and a 6-week HFD. Data are presented as mean ± SEM. *P < 0.05 for HFD vs. chow.
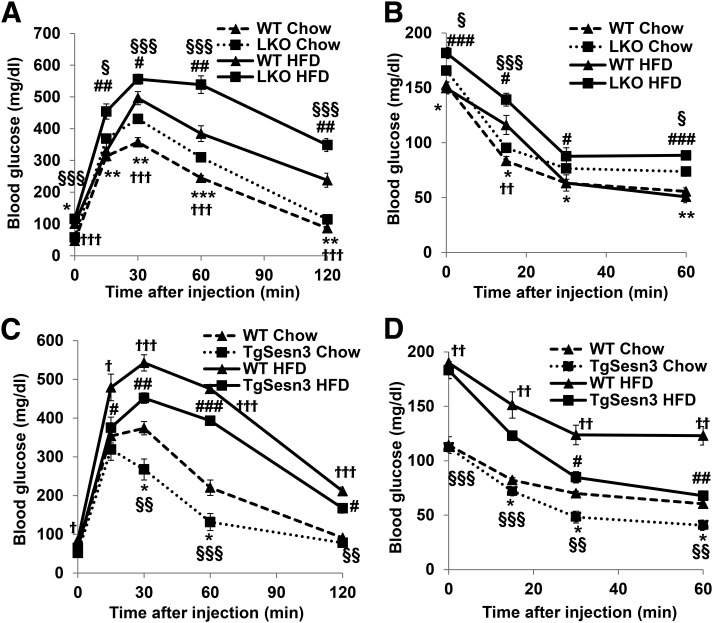
The elevated blood glucose in the Sesn3-LKO mice could be attributed to impaired hepatic insulin sensitivity and/or dysregulated glucose metabolism; glucose and insulin tolerance tests all indicated a worsening phenotype in the Sesn3-LKO mice compared with the control WT mice under both chow and HFD conditions (Fig. 2A and B and Supplementary Fig. 2A and B). In addition, both insulin and glucose tolerance tests were significantly better in the TgSesn3 mice than that in the control WT mice (Fig. 2C and D and Supplementary Figure 2C and D). These data suggest that hepatic Sesn3 plays a critical role in metabolic regulation.
Figure 2.
Hepatic Sesn3 regulates glucose homeostasis and insulin sensitivity. A: Glucose tolerance tests in WT and Sesn3-LKO mice fed regular chow (n = 10; 2 months of age) or a 6-week HFD (n = 8; 14 weeks of age). Data are presented as mean ± SEM. *P < 0.05, **P < 0.01, and ***P < 0.001 for Sesn3-LKO vs. WT fed regular chow; #P < 0.05 and ##P < 0.01 for Sesn3-LKO vs. WT fed an HFD. †††P < 0.001 for WT mice fed an HFD vs. chow. §P < 0.05 and §§§P < 0.001 for Sesn3-LKO fed an HFD vs. chow. B: Insulin tolerance tests in WT and Sesn3-LKO mice fed regular chow (n = 10; 2 months of age) or a 7-week HFD (n = 8; 15 weeks of age). Data are presented as mean ± SEM. *P < 0.05 and **P < 0.01 for Sesn3-LKO vs. WT fed chow; #P < 0.05 and ###P < 0.001 for Sesn3-LKO vs. WT fed an HFD; ††P < 0.01 for WT fed an HFD vs. chow; §P < 0.05 and §§§P < 0.001 for Sesn3-LKO fed an HFD vs. chow. C: Glucose tolerance tests in WT and TgSesn3 mice fed regular chow (n = 5; 2 months of age) or a 6-week HFD (n = 5; 10 weeks of age). Data are presented as mean ± SEM. *P < 0.05 for TgSesn3 vs. WT fed chow; #P < 0.05, ##P < 0.01, and ###P < 0.001 for TgSesn3 vs. WT fed an HFD; †P < 0.05 and †††P < 0.001 for WT fed an HFD vs. chow; §§P < 0.01 and §§§P < 0.001 for TgSesn3 fed an HFD vs. chow. D: Insulin tolerance tests in WT and TgSesn3 mice fed regular chow (n = 5; 2 months of age) or a 3-month HFD (n = 5; 4 months of age). Data are presented as mean ± SEM. *P < 0.05 for TgSesn3 vs. WT fed chow; #P < 0.05 and ##P < 0.01 for TgSesn3 vs. WT fed an HFD; ††P < 0.01 for WT fed an HFD vs. chow; §§P < 0.01 and §§§P < 0.001 for TgSesn3 fed an HFD vs. chow.
Sesn3 Plays a Critical Role in Signal Transduction During Fasting and Refeeding
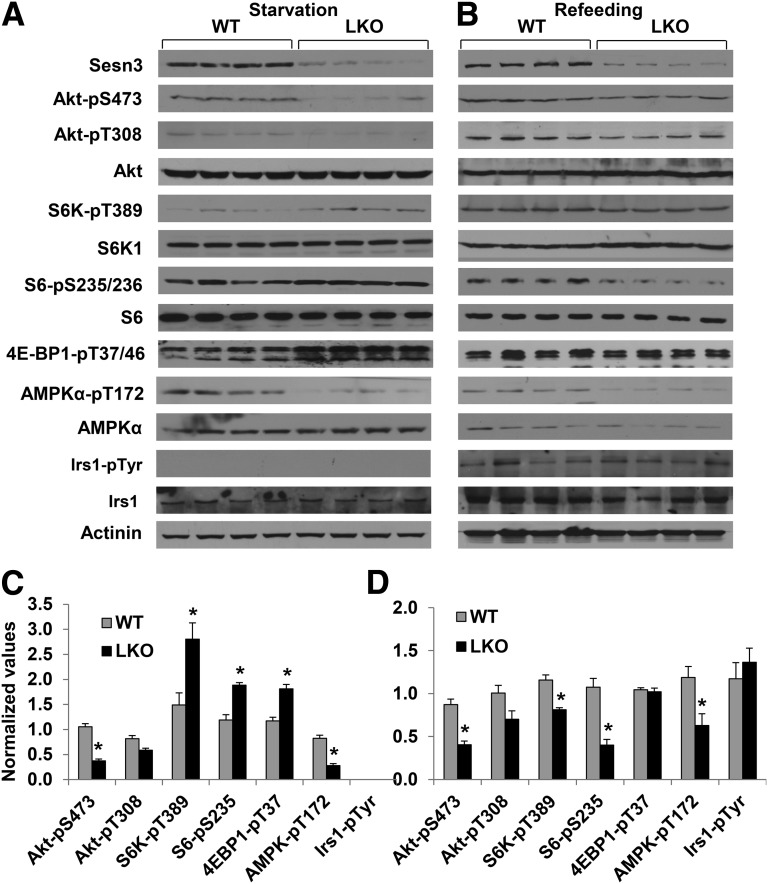
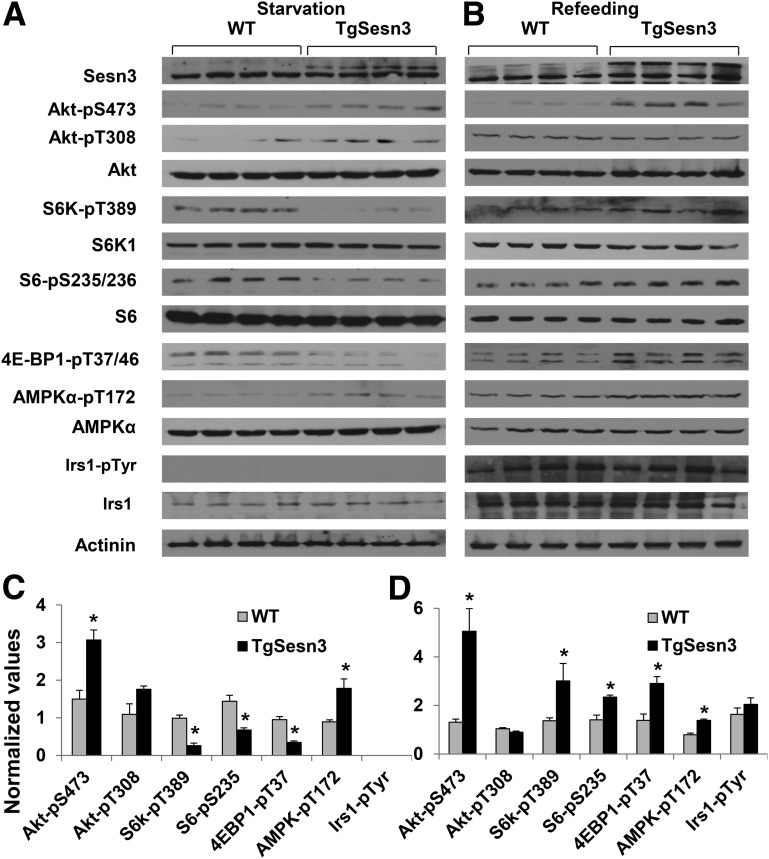
To explore the underlying mechanisms of Sesn3-regulated liver metabolism, we performed fasting and refeeding experiments in WT, Sesn3-LKO, and TgSesn3 mice fed a diet of regular chow. Interestingly, whereas phosphorylation of Akt at Ser473 was decreased, the signaling cascade downstream of mTORC1, including phosphorylation of S6K1, S6, and 4E-BP1, was elevated in the liver of Sesn3-LKO mice after overnight fasting (Fig. 3A and C). Consistent with the previous reports (4,6,41), AMPK phosphorylation (T172) was also decreased in the Sesn3-LKO mouse livers. After a 4-h refeeding, phosphorylation of Akt-S473, S6K-T389, and S6-S235/236 was significantly lower in the Sesn3-LKO livers than in the control WT livers (Fig. 3B and D). In contrast, Sesn3 overexpression induced Akt-S473 phosphorylation under both fasting and refeeding conditions, whereas mTORC1 signaling was suppressed under fasting but increased after refeeding in the livers of TgSesn3 mice (Fig. 4A–D). It is worth noting that Irs1 tyrosine phosphorylation was not changed regardless of Sesn3 deficiency or overexpression, suggesting that modulation of Akt and mTORC1 activity by Sesn3 occurs downstream of Irs1. To assess whether there is any systemic effect, we also analyzed Akt and GSK3 phosphorylation in skeletal muscle and white adipose tissue of chow-fed mice under starvation and refeeding conditions. No significant difference was observed between WT and Sesn3-LKO or TgSesn3 mice (Supplementary Fig. 3A–H). To verify that insulin has effects similar to those of refeeding, we also performed acute insulin stimulation in chow-fed WT, Sesn3-LKO, and TgSesn3 mice. The data showed that phosphorylation of Akt-S473 and GSK3β-S9 had a positive correlation with hepatic Sesn3 levels (Supplementary Fig. 4A–D). In addition, we also examined insulin signaling in HFD-fed WT and TgSesn3 mice. Insulin-stimulated phosphorylation of Akt-S473, GSK3β-S9, and S6-S235/236 was significantly increased in the TgSesn3 livers compared with the WT livers (Supplementary Fig. 5A and B); however, the insulin signaling analysis did not reveal any significant difference between WT and TgSesn3 mice in skeletal muscle and white adipose tissue (Supplementary Fig. 5C and D). These data suggest that hepatic signaling changes largely contribute to the metabolic phenotypes in Sesn3-LKO and TgSesn3 mice.
Figure 3.
Hepatic Sesn3 deficiency affects the Akt signaling pathway. A: Signaling analysis of livers from WT and Sesn3-LKO mice after overnight starvation. B: Signaling analysis of WT and Sesn3-LKO livers after the animals were starved overnight and then fed for 4 h. C: Quantitative data from panel A. D: Quantitative data from panel B. Data were normalized by calculating the ratio of each signaling event in the Sesn3-LKO and comparing it to that in the WT mice. Data are presented as mean ± SEM. *P < 0.05, WT vs. Sesn3-LKO mice.
Figure 4.
Hepatic Sesn3 overexpression affects the Akt signaling pathway. A: Signaling analysis of liver extracts from WT and TgSesn3 mice after overnight starvation. B: Signaling analysis of WT and TgSesn3 livers after the animals were starved overnight and then fed for 4 h. C: Quantitative data from panel A. D: Quantitative data from panel B. Data were normalized by calculating the ratio of each signaling event in the TgSesn3 mice and comparing it with that in the WT mice. Data are presented as mean ± SEM. *P < 0.05, WT vs. TgSesn3 mice.
Hepatic Sesn3 Can Activate Akt and Insulin Signaling Independent of AMPK
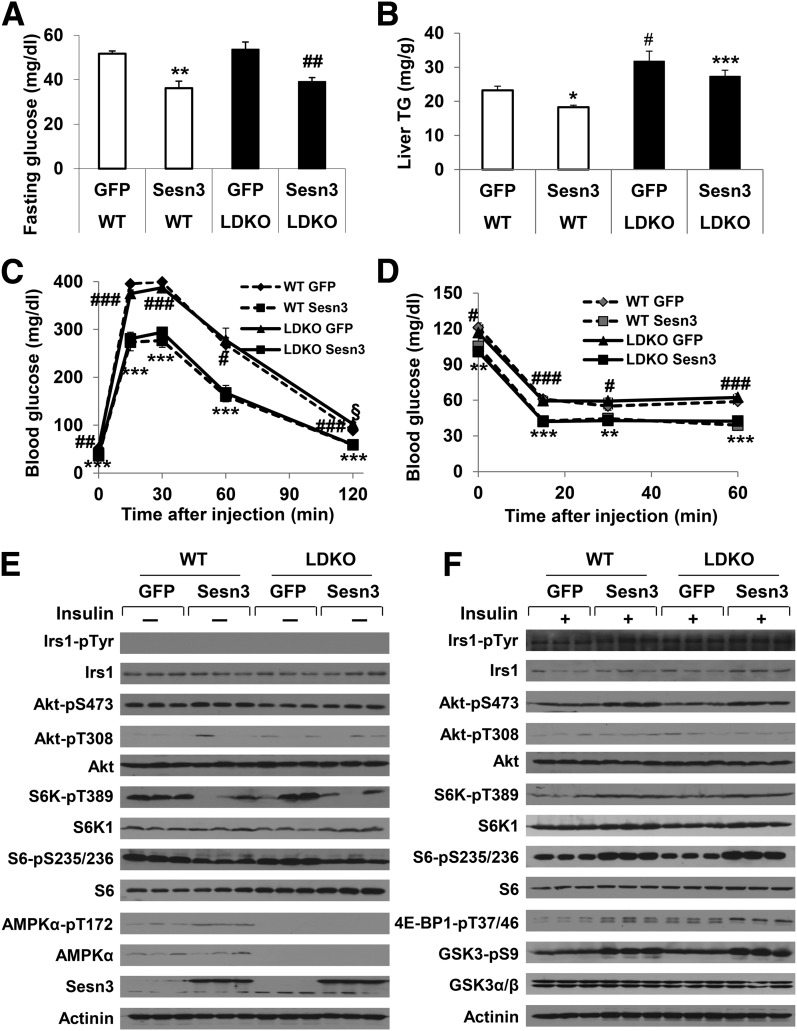
A few previous studies have linked sestrin suppression of mTORC1 signaling through AMPK (4,6,41). To verify whether Sesn3 requires AMPK to control hepatic insulin action and glucose metabolism, we generated AMPK-LDKO mice and delivered GFP- or Sesn3-expressing adenoviruses into the animals via a tail vein injection. Surprisingly, Sesn3 overexpression lowered fasting blood glucose concentrations in both WT and AMPK-LDKO mice, whereas hepatic triglyceride concentrations were reduced in only Sesn3-transduced WT mice (Fig. 5A and B). In addition, Sesn3 overexpression had the same effect on glucose tolerance in both WT and AMPK-LDKO mice, and those mice also showed similar insulin tolerance after Sesn3 adenoviral transduction (Fig. 5C and D and Supplementary Fig. 6A and B). Insulin signaling analysis also did not reveal any significant difference between WT and AMPK-LDKO livers (Fig. 5E and F and Supplementary Fig. 7A and B). Our data imply that Sesn3 also regulates insulin signaling through a distinct mechanism other than AMPK.
Figure 5.
The Sesn3 effects in AMPK-deficient mice. A: Fasting blood glucose measurements in WT and AMPKα1,2 liver-specific double knockout (AMPK-LDKO) mice (n = 6–8) infected with GFP- or Sesn3-expressing adenoviruses after overnight starvation with free access to water. Data are presented as mean ± SEM. **P < 0.01 for WT + Sesn3 vs. WT + GFP; ##P < 0.01 for LDKO + GFP vs. LDKO + Sesn3. B: Hepatic triglyceride (TG) measurements in GFP- or Sesn3-expressing adenovirus-infected WT or AMPK-LDKO mice (n = 6–8). Data are presented as mean ± SEM. *P < 0.05 for WT + Sesn3 vs. WT + GFP; #P < 0.05 for LDKO + GFP vs. WT + GFP; ***P < 0.001 for LDKO + Sesn3 vs. WT + Sesn3. C: Glucose tolerance tests in GFP- or Sesn3-expressing adenovirus-infected WT or AMPK-LDKO mice (n = 6–8). Data are presented as mean ± SEM. ***P < 0.001 for WT + Sesn3 vs. WT + GFP; #P < 0.05, ##P < 0.01, and ###P < 0.001 for LDKO + GFP vs. LDKO + Sesn3; §P < 0.05 for LDKO + GFP vs. WT + GFP. D: Insulin tolerance tests in GFP- or Sesn3-expressing adenovirus-infected WT or AMPK-LDKO mice (n = 6–8). Data are presented as mean ± SEM. **P < 0.01 and ***P < 0.001 for LDKO + Sesn3 vs. LDKO + GFP; #P < 0.05 and ###P < 0.001 for WT + Sesn3 vs. WT + GFP. E and F: Insulin signaling analysis in the livers of WT or AMPK-LDKO mice infected with GFP- or Sesn3-expressing adenoviruses without (E) or with (F) insulin stimulation.
Sesn3 Interacts With mTORC2
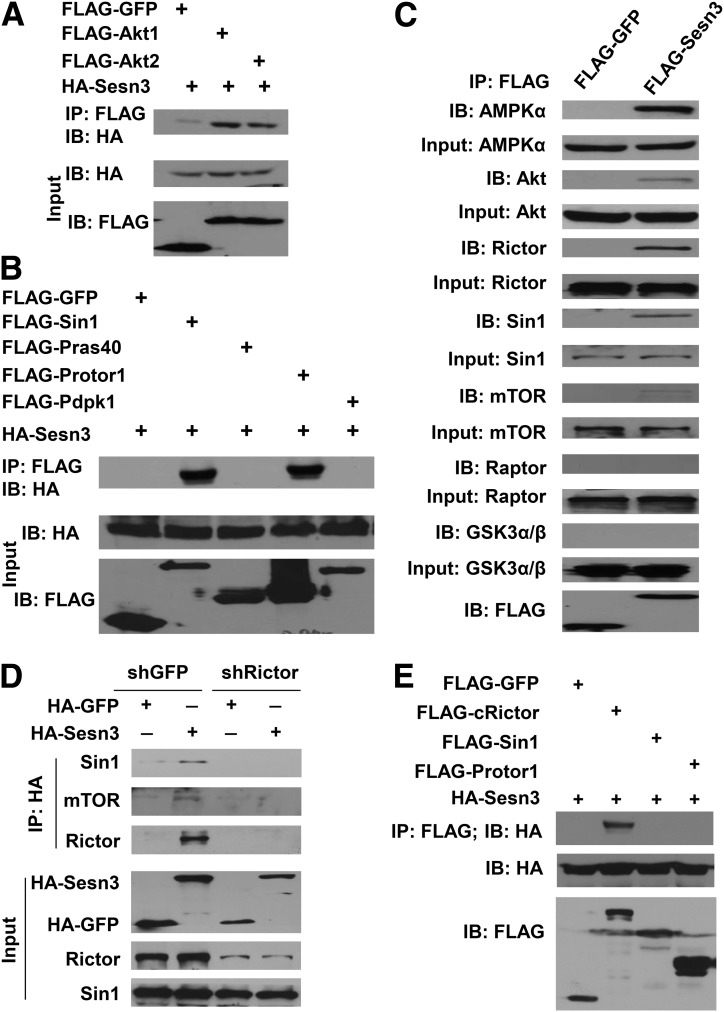
To investigate how Sesn3 activates Akt, we performed co-IP analysis by cotransfection of HA-Sesn3 and FLAG-Akt1 or FLAG-Akt2. The data showed a potential interaction between Sesn3 and Akt (Fig. 6A). As described above, Sesn3 seems to specifically increase Akt-S473 phosphorylation. To further explore whether Sesn3 might also interact with mTORC2, we performed additional co-IP analyses. Our data indicated that Sesn3 had interactions with at least two components of mTORC2—Sin1 and Protor1—but had no interaction with Pras40, a component of mTORC1, or Pdpk1, the kinase responsible for Akt-T308 phosphorylation (Fig. 6B). To further validate the co-IP data, we performed FLAG tag–based affinity purifications of mouse livers that were transduced with control FLAG-GFP or FLAG-Sesn3. As expected for our positive control, we observed that AMPKα was present only in the FLAG-Sesn3 IP. Consistent with our hypothesis, Sesn3 was also specifically copurified with Akt, Rictor, Sin1, and mTOR but not Raptor or GSK-3α/β (Fig. 6C). In addition, we also performed colocalization analysis by cotransfecting mCherry-Sesn3 and GFP-labeled Rictor, Sin1, and Protor1 in HEK293A cells. The fluorescent imaging data indicated that Sesn3 and those mTORC2 components had significant overlaps in the cultured cells (Supplementary Fig. 8A–C). These data suggest that Sesn3 might activate Akt through an interaction with mTORC2.
Figure 6.
Sesn3 interacts with mTORC2 via Rictor. A: Co-IP analysis of Sesn3-Akt interactions by cotransfection of FLAG-GFP, FLAG-Akt1, or FLAG-Akt2 with HA-Sesn3 in HEK293 cells. B: Co-IP analysis of possible interactions between Sesn3 and Sin1, Pras40, Protor1, or Pdpk1 by cotransfection of the corresponding plasmids in HEK293 cells. C: IP analysis of Sesn3-interacting proteins in FLAG-GFP- or FLAG-Sesn3-overexpressing mouse livers using anti-FLAG agarose beads. D: IP analysis of Sesn3-mTORC2 interaction in mouse primary hepatocytes transduced with short hairpin GFP (shGFP) or short hairpin Rictor (shRictor) (Rictor shRNA) adenoviruses together with GFP- or Sesn3-expressing adenoviruses. E: Sesn3-Rictor interaction analysis by IP using recombinant proteins for GFP, COOH-terminal fragment of Rictor (cRictor), Sin1, Protor1, and Sesn3.
Sesn3 Interacts With mTORC2 via Rictor
To further elucidate the molecular interactions between Sesn3 and mTORC2, we performed IP analyses when one of the key components of mTORC2 (Sin1, Rictor, or mTOR) was knocked down by adenoviral vector-mediated shRNAs in mouse primary hepatocytes. When Sin1 was knocked down, Sesn3 pulled down less Rictor because the stability of Sin1 and Rictor are interdependent (42,43) (Supplementary Fig. 9A). However, Sesn3 could not pull down Sin1 or mTOR when Rictor was knocked down (Fig. 6D). When mTOR was knocked down, Sesn3 could still pull down Sin1/Rictor but not Akt (Supplementary Fig. 9B). These data suggest that Sesn3 might interact directly with Rictor and indirectly with Akt through mTOR. To verify this hypothesis, we performed in vitro co-IP analysis using recombinant proteins for Sesn3, Sin1, Protor1, and the COOH-terminal 900 amino acids of Rictor (we could not get the full-length Rictor recombinant protein for technical reasons). Our data again indicate a positive interaction between Sesn3 and Rictor (Fig. 6E). In addition, we confirmed that both Sesn2 and Sesn3 interacted with mTORC2 endogenously in mouse primary hepatocytes by IP using sestrin-specific antibodies (Supplementary Fig. 10).
Sesn3 Promotes Akt-S473 Phosphorylation Directly Through mTORC2
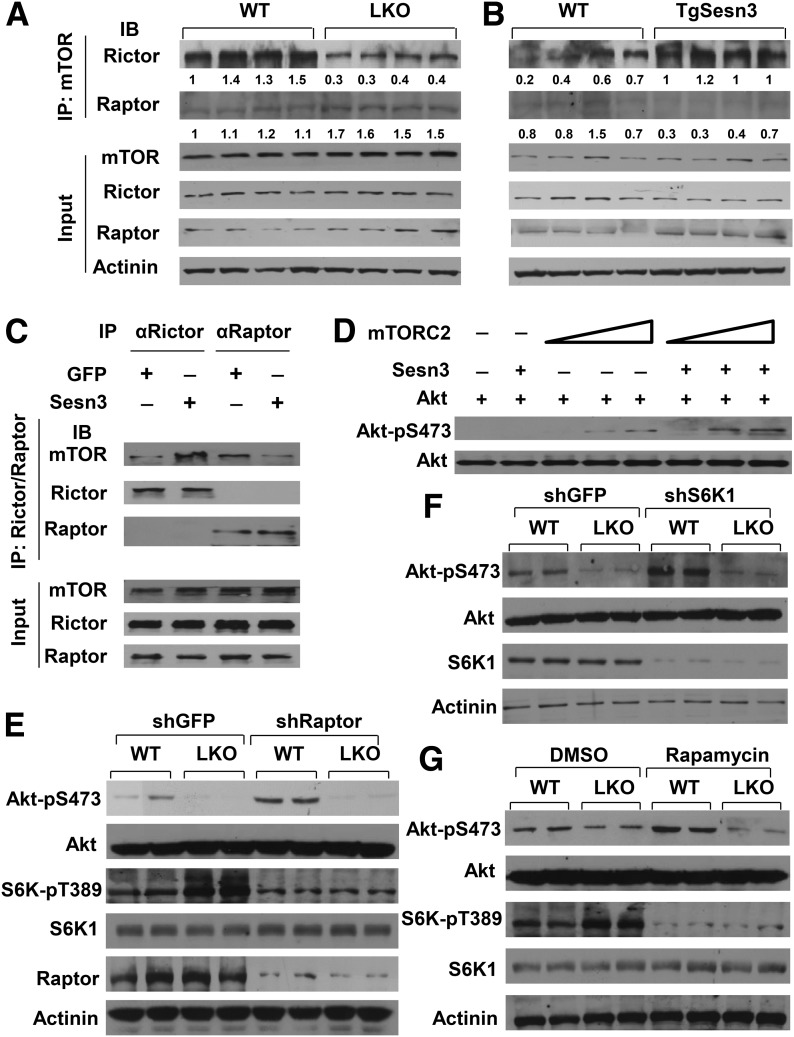
As we observed earlier in this work, Sesn3 can activate Akt and suppress mTORC1 signaling during starvation (Fig. 4A), and we attempted to further investigate these two distinctive effects. First, we performed IP analysis of liver extracts from control, Sesn3-LKO, and TgSesn3 mice using mTOR antibodies. The data revealed that Rictor-associated mTORC2 complexes were decreased in the Sesn3-LKO livers and increased in the TgSesn3 livers; however, Raptor-associated mTORC1 complexes were in an inverse relationship with Sesn3 gene expression (Fig. 7A and B). Then we overexpressed GFP or Sesn3 in mouse primary hepatocytes and performed IP analyses using Rictor or Raptor antibodies. Interestingly, Sesn3 overexpression increased Rictor-associated mTOR but decreased Raptor-associated mTOR (Fig. 7C). To address whether Sesn3 promotes mTORC2 activity toward Akt, we conducted in vitro kinase assays using affinity-purified mTORC2 from mouse primary hepatocytes and purified recombinant Sesn3 and Akt1 from bacteria. In the absence of Sesn3, an increase in mTORC2 complexes moderately increased Akt-S473 phosphorylation, whereas in the presence of Sesn3 such an elevation of the Akt phosphorylation was remarkable (Fig. 7D). To examine whether the mTORC1-S6K signaling cascade is involved in the effect of Sesn3 on Akt, we performed gene-specific knockdown and mTORC1 inhibition by rapamycin in primary hepatocytes from WT and Sesn3-LKO mice. Knockdown of Raptor or S6K1 increased phosphorylation of only Akt-S473 in WT mouse hepatocytes, which is consistent with previous reports (18,44); however, it did not affect Akt in Sesn3-LKO hepatocytes (Fig. 7E and F). Similarly, the inhibition of mTORC1 activity by rapamycin did not increase Akt-S473 phosphorylation in the Sesn3-LKO hepatocytes compared with their WT counterparts (Fig. 7G). These data suggest that Sesn3 activates Akt directly through mTORC2 rather than indirectly by suppressing mTORC1 signaling.
Figure 7.
Sesn3 promotes the mTOR-Rictor interaction and Akt activation. A: Analysis of mTOR complexes in WT and Sesn3-LKO livers by IP using mTOR antibodies. B: Analysis of mTOR complexes in WT and TgSesn3 livers by IP using mTOR antibodies. C: Analysis of mTORC1 and mTORC2 complexes from GFP- or Sesn3-overexpressing mouse primary hepatocytes by IP using antibodies against Raptor or Rictor. D: In vitro analysis of Akt activation by Sesn3 using recombinant Sesn3 and Akt1 plus mTORC2 complexes isolated from mouse primary hepatocytes transduced with FLAG-Sin1 adenoviruses. E: Akt phosphorylation in WT and Sesn3-LKO mouse primary hepatocytes transduced with short hairpin GFP (shGFP) or short hairpin Raptor (shRaptor) adenoviruses. F: Akt phosphorylation in WT and Sesn3-LKO mouse primary hepatocytes transduced with shGFP or shS6K1 adenoviruses. G: Akt phosphorylation in WT and Sesn3-LKO mouse primary hepatocytes in the absence or presence of 100 nmol/L rapamycin for 1 h.
Discussion
Sestrins are rather enigmatic proteins in the way that they function beyond the barely homologous catalytic domain to bacterial AhpD protein, a component of the bacterial antioxidant defense system that regenerates AhpC, a bacterial peroxiredoxin (1). Whether sestrins have similar enzymatic activities is still controversial (45–47). Nevertheless, sestrins are indeed involved in protection against oxidative stress. One potential mechanism might be through regulation of a key transcription factor, Nrf2 (2). Intriguingly, an oxidoreductase-dead dSesn can largely rescue the aging phenotype in dSesn-null fruit flies (41). Further studies identified AMPK as a critical mediator of the broad effects of sestrins, from protection against genotoxic stress and DNA damage to metabolic functions (4,6,41). AMPK is a key energy sensor that plays a crucial role in energy and nutrient homeostasis (48). For instance, AMPK can suppress hepatic gluconeogenesis and lipogenesis, promote glucose uptake in skeletal muscle, and trigger organismal feeding. Numerous factors have been identified as AMPK substrates, including ACC1, SREBP-1c, HMGCR, Raptor, and TSC2 (48). Through phosphorylation of Raptor and TSC2, AMPK negatively regulates mTORC1 signaling (10,11,49). Normally, TSC2 forms heterodimers with TSC1; together, they regulate the activity of Rheb, a GTPase for mTORC1. mTORC1 is a master regulator of biosynthesis and cell growth (22,23). Under conditions of overnutrition and obesity, however, the overactivated mTORC1 signaling also contributes to the development of insulin resistance by phosphorylation of IRS1 and promotion of its degradation (15–18,22). This has been proposed as a major mechanism to explain the metabolic dysregulation in Sesn2/3 null mice (6). Interestingly, a recent report suggests that sestrins can also attenuate amino acid–induced mTORC1 signaling through inhibition of RagA/B, components of the GTPase complex that controls mTORC1 translocation to lysosomes (12,13). Overall, those data suggest a critical role for sestrins in the regulation of mTORC1 signaling and function.
Before this work, however, whether sestrins are directly involved in the regulation of the second mTOR complex, mTORC2, was unclear. The identification of mTORC2 as part of the sestrin pathway in this work strongly suggests that multiple mechanisms are involved in the biological functions of sestrin proteins, particularly under physiological conditions. During fasting, when Sesn2/3 are also induced (2,6), sestrins can activate both AMPK and Akt. Subsequently, AMPK suppresses the mTORC1 pathway, attenuating protein and lipid biosynthesis (22,23); in the meantime, Akt also keeps hepatic gluconeogenesis in check (50). In the postprandial state, sestrins may enhance mTORC1 activity through an activation of the mTORC2-Akt branch of the insulin signaling pathway, orchestrated with insulin and nutrient signals. As a result, macromolecule biosynthesis proceeds, in addition to suppression of hepatic gluconeogenesis. Our data suggest that the metabolic phenotypes in Sesn3-LKO and TgSesn3 mice are largely attributable to hepatic Sesn3 functions, since the Akt activity is not significantly changed in peripheral tissues of those mice. More comprehensive analysis may be required to assess the contribution of other tissues/organs to the overall metabolic phenotypes in Sesn3-LKO and TgSesn3 mice.
There are some weaknesses in this study. First, the animals are on a mixed genetic background, and previous studies suggested a significant influence of genetic background on metabolic phenotypes. Second, glucose tolerance tests performed on animals starved overnight, with an intraperitoneal injection of glucose, might reveal different results than those following best practices recommended by the National Institutes of Health Mouse Metabolic Phenotyping Centers.
Since Akt kinases are essential components of the insulin signaling pathway, proper regulation of the Akt activity is critical to maintaining hepatic insulin sensitivity. This has been clearly demonstrated by liver-specific knockout of Akt1/2 and Rictor (21,51,52). Biochemically, Rictor is a crucial factor in the assembly of mTORC2. In fact, several proteins regulate mTORC2 activity through an interaction with Rictor (26–29,53–56). Although how Sesn3 activates mTORC2 is not completely understood, our data suggest that the Sesn3-Rictor interaction may facilitate or stabilize mTORC2, especially when the catalytic subunit mTOR is limiting. This notion is consistent with our IP data that Sesn3 overexpression leads to an increase in the Rictor-mTOR complexes and a decrease in Raptor-mTOR complexes. Our data also suggest that Sesn3 can directly activate mTORC2-Akt independent of the mTORC1-S6K feedback regulation because IRS1 tyrosine phosphorylation is not changed in the liver of Sesn3-LKO or TgSesn3 mice and inhibition of mTORC1 signaling by rapamycin or gene knockdown does not increase Akt-S473 phosphorylation in Sesn3-LKO hepatocytes.
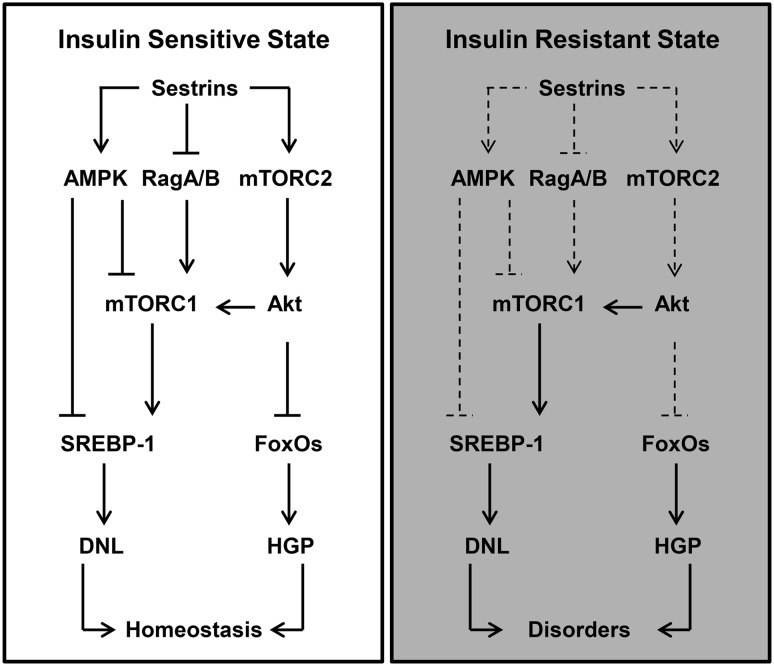
Under physiological conditions, this newly identified mechanism (Sesn3-mTORC2-Akt) may play an important role in maintaining hepatic insulin sensitivity and glucose homeostasis. Nevertheless, sestrins can also regulate metabolism, particularly lipid metabolism, through AMPK, mTORC1, and possibly other unknown mechanisms. By contrast, the molecular underpinnings are much more complicated under conditions of overnutrition and obesity. First, whether AMPK can function normally under those conditions is not clear (48). Second, mTORC1 and S6K1 can dampen insulin sensitivity through the Ser/Thr phosphorylation of IRS1 and its degradation (15–18). Third, multiple metabolic defects are caused by overnutrition or obesity (57). During the development of obesity-induced insulin resistance, a paradoxical phenotype is often noticed: Insulin continues to promote lipogenesis but fails to suppress glucose production in the liver, which is also called selective hepatic insulin resistance (58,59). The impairment or deficiency of hepatic sestrin functions may be partly attributable to that paradox. On the one hand, obesity/overnutrition may impair the capability of sestrins to control mTORC1. Therefore, mTORC1 persistently drives hepatic lipogenesis in the face of an increased flux of lipogenic metabolites. On the other hand, obesity/overnutrition may also attenuate the effect of sestrins on the activation of mTORC2 and Akt. As a result, Foxo transcription factors are unsuppressed and thus promote hepatic gluconeogenesis (Fig. 8). The data from the Sesn2 and Sesn3 double knockout mice seem to support this model because Sesn2/3 deficiency leads to hyperactive mTORC1 signaling, diminishing Akt activity and spontaneous insulin resistance (6). Regardless of the underlying mechanisms, our Sesn3 transgenic mice showed the salutary effects of Sesn3 on hepatic insulin sensitivity and glucose homeostasis, suggesting that Sesn3 play a critical role in hepatic metabolic regulation.
Figure 8.
Proposed model for hepatic sestrin actions in the insulin-sensitive and insulin-resistant states. The schematic diagrams depict the role of hepatic sestrins in glucose and lipid homeostasis in insulin-sensitive (left panel) and insulin-resistant states (right panel). DNL, de novo lipogenesis; FoxO, forkhead box O transcription factor; HGP, hepatic glucose production; SREBP-1, sterol regulatory element binding protein 1.
Overall, the findings from this work have significant implications in the prevention and treatment of diabetes, especially type 2 diabetes. First, since they have multifaceted functions, including activation of AMPK and mTORC2 and inhibition of mTORC1, sestrins can be very useful targets for the modulation of insulin sensitivity and nutrient homeostasis. Second, approaches and molecules that boost endogenous sestrin gene expression and function may be effective for the prevention of diabetes. Third, pharmacological sestrin mimetics might be useful for the treatment of diabetes and metabolic syndrome. Certainly, more basic and translational research on sestrins needs to be done to assess this potential.
Supplementary Material
Article Information
Acknowledgments. The authors thank Dr. Clark Wells (Department of Biochemistry and Molecular Biology, Indiana University School of Medicine) for providing eGFP and mCherry fluorescent reporters and imaging assistance.
Funding. S.L. received National Institutes of Health/National Institute on Alcohol Abuse and Alcoholism grant K08-AA-016570 and Veterans Affairs Administration grant 1-I01-CX-000361-01. X.C.D. received National Institute of Diabetes and Digestive and Kidney Diseases grant R01-DK-091592.
Duality of Interest. No potential conflicts of interest relevant to this article were reported.
Author Contributions. R.T. carried out the studies, interpreted and analyzed data, and edited the manuscript. X.X. assisted with the studies. S.L. designed the experiments and edited the manuscript. X.C.D. conceived the hypothesis, designed the experiments, analyzed the results, and wrote the manuscript. X.C.D. is the guarantor of this work and, as such, had full access to all the data in the study and takes responsibility for the integrity of the data and the accuracy of the data analysis.
Footnotes
This article contains Supplementary Data online at http://diabetes.diabetesjournals.org/lookup/suppl/doi:10.2337/db14-0539/-/DC1.
References
- 1.Lee JH, Budanov AV, Karin M. Sestrins orchestrate cellular metabolism to attenuate aging. Cell Metab 2013;18:792–801 [DOI] [PMC free article] [PubMed] [Google Scholar]
- 2.Bae SH, Sung SH, Oh SY, et al. Sestrins activate Nrf2 by promoting p62-dependent autophagic degradation of Keap1 and prevent oxidative liver damage. Cell Metab 2013;17:73–84 [DOI] [PubMed] [Google Scholar]
- 3.Brüning A, Rahmeh M, Friese K. Nelfinavir and bortezomib inhibit mTOR activity via ATF4-mediated sestrin-2 regulation. Mol Oncol 2013;7:1012–1018 [DOI] [PMC free article] [PubMed] [Google Scholar]
- 4.Budanov AV, Karin M. p53 target genes sestrin1 and sestrin2 connect genotoxic stress and mTOR signaling. Cell 2008;134:451–460 [DOI] [PMC free article] [PubMed] [Google Scholar]
- 5.Budanov AV, Shoshani T, Faerman A, et al. Identification of a novel stress-responsive gene Hi95 involved in regulation of cell viability. Oncogene 2002;21:6017–6031 [DOI] [PubMed] [Google Scholar]
- 6.Lee JH, Budanov AV, Talukdar S, et al. Maintenance of metabolic homeostasis by Sestrin2 and Sestrin3. Cell Metab 2012;16:311–321 [DOI] [PMC free article] [PubMed] [Google Scholar]
- 7.Park HW, Park H, Ro SH, et al. Hepatoprotective role of Sestrin2 against chronic ER stress. Nat Commun 2014;5:4233. [DOI] [PMC free article] [PubMed] [Google Scholar]
- 8.Nascimento EB, Osler ME, Zierath JR. Sestrin 3 regulation in type 2 diabetic patients and its influence on metabolism and differentiation in skeletal muscle. Am J Physiol Endocrinol Metab 2013;305:E1408–E1414 [DOI] [PMC free article] [PubMed] [Google Scholar]
- 9.Kang X, Petyaykina K, Tao R, Xiong X, Dong XC, Liangpunsakul S. The inhibitory effect of ethanol on Sestrin3 in the pathogenesis of ethanol-induced liver injury. Am J Physiol Gastrointest Liver Physiol 2014;307:G58–G65 [DOI] [PMC free article] [PubMed] [Google Scholar]
- 10.Inoki K, Zhu T, Guan KL. TSC2 mediates cellular energy response to control cell growth and survival. Cell 2003;115:577–590 [DOI] [PubMed] [Google Scholar]
- 11.Gwinn DM, Shackelford DB, Egan DF, et al. AMPK phosphorylation of raptor mediates a metabolic checkpoint. Mol Cell 2008;30:214–226 [DOI] [PMC free article] [PubMed] [Google Scholar]
- 12.Peng M, Yin N, Li MO. Sestrins function as guanine nucleotide dissociation inhibitors for Rag GTPases to control mTORC1 signaling. Cell 2014;159:122–133 [DOI] [PMC free article] [PubMed] [Google Scholar]
- 13.Chantranupong L, Wolfson RL, Orozco JM, et al. The sestrins interact with GATOR2 to negatively regulate the amino-acid-sensing pathway upstream of mTORC1. Cell Rep 2014;9:1–8 [DOI] [PMC free article] [PubMed] [Google Scholar]
- 14.Copps KD, White MF. Regulation of insulin sensitivity by serine/threonine phosphorylation of insulin receptor substrate proteins IRS1 and IRS2. Diabetologia 2012;55:2565–2582 [DOI] [PMC free article] [PubMed] [Google Scholar]
- 15.Tzatsos A, Kandror KV. Nutrients suppress phosphatidylinositol 3-kinase/Akt signaling via raptor-dependent mTOR-mediated insulin receptor substrate 1 phosphorylation. Mol Cell Biol 2006;26:63–76 [DOI] [PMC free article] [PubMed] [Google Scholar]
- 16.Ueno M, Carvalheira JB, Tambascia RC, et al. Regulation of insulin signalling by hyperinsulinaemia: role of IRS-1/2 serine phosphorylation and the mTOR/p70 S6K pathway. Diabetologia 2005;48:506–518 [DOI] [PubMed] [Google Scholar]
- 17.Shah OJ, Wang Z, Hunter T. Inappropriate activation of the TSC/Rheb/mTOR/S6K cassette induces IRS1/2 depletion, insulin resistance, and cell survival deficiencies. Curr Biol 2004;14:1650–1656 [DOI] [PubMed] [Google Scholar]
- 18.Um SH, Frigerio F, Watanabe M, et al. Absence of S6K1 protects against age- and diet-induced obesity while enhancing insulin sensitivity. Nature 2004;431:200–205 [DOI] [PubMed] [Google Scholar]
- 19.Cho H, Mu J, Kim JK, et al. Insulin resistance and a diabetes mellitus-like syndrome in mice lacking the protein kinase Akt2 (PKB beta). Science 2001;292:1728–1731 [DOI] [PubMed] [Google Scholar]
- 20.George S, Rochford JJ, Wolfrum C, et al. A family with severe insulin resistance and diabetes due to a mutation in AKT2. Science 2004;304:1325–1328 [DOI] [PMC free article] [PubMed] [Google Scholar]
- 21.Lu M, Wan M, Leavens KF, et al. Insulin regulates liver metabolism in vivo in the absence of hepatic Akt and Foxo1. Nat Med 2012;18:388–395 [DOI] [PMC free article] [PubMed] [Google Scholar]
- 22.Laplante M, Sabatini DM. mTOR signaling in growth control and disease. Cell 2012;149:274–293 [DOI] [PMC free article] [PubMed] [Google Scholar]
- 23.Jewell JL, Guan KL. Nutrient signaling to mTOR and cell growth. Trends Biochem Sci 2013;38:233–242 [DOI] [PMC free article] [PubMed] [Google Scholar]
- 24.Cardenas-Rodriguez M, Irigoín F, Osborn DP, et al. The Bardet-Biedl syndrome-related protein CCDC28B modulates mTORC2 function and interacts with SIN1 to control cilia length independently of the mTOR complex. Hum Mol Genet 2013;22:4031–4042 [DOI] [PMC free article] [PubMed] [Google Scholar]
- 25.Huang J, Dibble CC, Matsuzaki M, Manning BD. The TSC1-TSC2 complex is required for proper activation of mTOR complex 2. Mol Cell Biol 2008;28:4104–4115 [DOI] [PMC free article] [PubMed] [Google Scholar]
- 26.Jeon YH, Park YH, Kwon JH, Lee JH, Kim IY. Inhibition of 14-3-3 binding to Rictor of mTORC2 for Akt phosphorylation at Ser473 is regulated by selenoprotein W. Biochim Biophys Acta 2013;1833:2135–2142 [DOI] [PubMed] [Google Scholar]
- 27.Joha S, Nugues AL, Hétuin D, et al. GILZ inhibits the mTORC2/AKT pathway in BCR-ABL(+) cells. Oncogene 2012;31:1419–1430 [DOI] [PMC free article] [PubMed] [Google Scholar]
- 28.Khanna N, Fang Y, Yoon MS, Chen J. XPLN is an endogenous inhibitor of mTORC2. Proc Natl Acad Sci U S A 2013;110:15979–15984 [DOI] [PMC free article] [PubMed] [Google Scholar]
- 29.Xu Y, Lai E, Liu J, et al. IKK interacts with rictor and regulates mTORC2. Cell Signal 2013;25:2239–2245 [DOI] [PubMed] [Google Scholar]
- 30.Postic C, Shiota M, Niswender KD, et al. Dual roles for glucokinase in glucose homeostasis as determined by liver and pancreatic beta cell-specific gene knock-outs using Cre recombinase. J Biol Chem 1999;274:305–315 [DOI] [PubMed] [Google Scholar]
- 31.Xiao C, Calado DP, Galler G, et al. MiR-150 controls B cell differentiation by targeting the transcription factor c-Myb. Cell 2007;131:146–159 [DOI] [PubMed] [Google Scholar]
- 32.Koza RA, Nikonova L, Hogan J, et al. Changes in gene expression foreshadow diet-induced obesity in genetically identical mice. PLoS Genet 2006;2:e81. [DOI] [PMC free article] [PubMed] [Google Scholar]
- 33.Biddinger SB, Almind K, Miyazaki M, Kokkotou E, Ntambi JM, Kahn CR. Effects of diet and genetic background on sterol regulatory element-binding protein-1c, stearoyl-CoA desaturase 1, and the development of the metabolic syndrome. Diabetes 2005;54:1314–1323 [DOI] [PubMed] [Google Scholar]
- 34.Nakada D, Saunders TL, Morrison SJ. Lkb1 regulates cell cycle and energy metabolism in haematopoietic stem cells. Nature 2010;468:653–658 [DOI] [PMC free article] [PubMed] [Google Scholar]
- 35.Xiong X, Tao R, DePinho RA, Dong XC. Deletion of hepatic FoxO1/3/4 genes in mice significantly impacts on glucose metabolism through downregulation of gluconeogenesis and upregulation of glycolysis. PLoS One 2013;8:e74340. [DOI] [PMC free article] [PubMed] [Google Scholar]
- 36.Tao R, Xiong X, Harris RA, White MF, Dong XC. Genetic inactivation of pyruvate dehydrogenase kinases improves hepatic insulin resistance induced diabetes. PLoS One 2013;8:e71997. [DOI] [PMC free article] [PubMed] [Google Scholar]
- 37.Sarbassov DD, Ali SM, Kim DH, et al. Rictor, a novel binding partner of mTOR, defines a rapamycin-insensitive and raptor-independent pathway that regulates the cytoskeleton. Curr Biol 2004;14:1296–1302 [DOI] [PubMed] [Google Scholar]
- 38.Tao R, Xiong X, DePinho RA, Deng CX, Dong XC. Hepatic SREBP-2 and cholesterol biosynthesis are regulated by FoxO3 and Sirt6. J Lipid Res 2013;54:2745–2753 [DOI] [PMC free article] [PubMed] [Google Scholar]
- 39.Tao R, Xiong X, DePinho RA, Deng CX, Dong XC. FoxO3 transcription factor and Sirt6 deacetylase regulate low density lipoprotein (LDL)-cholesterol homeostasis via control of the proprotein convertase subtilisin/kexin type 9 (Pcsk9) gene expression. J Biol Chem 2013;288:29252–29259 [DOI] [PMC free article] [PubMed] [Google Scholar]
- 40.Chen CH, Sarbassov D. The mTOR (mammalian target of rapamycin) kinase maintains integrity of mTOR complex 2. J Biol Chem 2011;286:40386–40394 [DOI] [PMC free article] [PubMed] [Google Scholar]
- 41.Lee JH, Budanov AV, Park EJ, et al. Sestrin as a feedback inhibitor of TOR that prevents age-related pathologies. Science 2010;327:1223–1228 [DOI] [PMC free article] [PubMed] [Google Scholar]
- 42.Frias MA, Thoreen CC, Jaffe JD, et al. mSin1 is necessary for Akt/PKB phosphorylation, and its isoforms define three distinct mTORC2s. Curr Biol 2006;16:1865–1870 [DOI] [PubMed] [Google Scholar]
- 43.Jacinto E, Facchinetti V, Liu D, et al. SIN1/MIP1 maintains rictor-mTOR complex integrity and regulates Akt phosphorylation and substrate specificity. Cell 2006;127:125–137 [DOI] [PubMed] [Google Scholar]
- 44.Sengupta S, Peterson TR, Laplante M, Oh S, Sabatini DM. mTORC1 controls fasting-induced ketogenesis and its modulation by ageing. Nature 2010;468:1100–1104 [DOI] [PubMed] [Google Scholar]
- 45.Budanov AV, Sablina AA, Feinstein E, Koonin EV, Chumakov PM. Regeneration of peroxiredoxins by p53-regulated sestrins, homologs of bacterial AhpD. Science 2004;304:596–600 [DOI] [PubMed] [Google Scholar]
- 46.Woo HA, Bae SH, Park S, Rhee SG. Sestrin 2 is not a reductase for cysteine sulfinic acid of peroxiredoxins. Antioxid Redox Signal 2009;11:739–745 [DOI] [PubMed] [Google Scholar]
- 47.Ro SH, Nam M, Jang I, et al. Sestrin2 inhibits uncoupling protein 1 expression through suppressing reactive oxygen species. Proc Natl Acad Sci U S A 2014;111:7849–7854 [DOI] [PMC free article] [PubMed] [Google Scholar]
- 48.Hardie DG, Ross FA, Hawley SA. AMPK: a nutrient and energy sensor that maintains energy homeostasis. Nat Rev Mol Cell Biol 2012;13:251–262 [DOI] [PMC free article] [PubMed] [Google Scholar]
- 49.Shaw RJ, Bardeesy N, Manning BD, et al. The LKB1 tumor suppressor negatively regulates mTOR signaling. Cancer Cell 2004;6:91–99 [DOI] [PubMed] [Google Scholar]
- 50.Whiteman EL, Cho H, Birnbaum MJ. Role of Akt/protein kinase B in metabolism. Trends Endocrinol Metab 2002;13:444–451 [DOI] [PubMed] [Google Scholar]
- 51.Hagiwara A, Cornu M, Cybulski N, et al. Hepatic mTORC2 activates glycolysis and lipogenesis through Akt, glucokinase, and SREBP1c. Cell Metab 2012;15:725–738 [DOI] [PubMed] [Google Scholar]
- 52.Lamming DW, Demirkan G, Boylan JM, et al. Hepatic signaling by the mechanistic target of rapamycin complex 2 (mTORC2). FASEB J 2014;28:300–315 [DOI] [PMC free article] [PubMed] [Google Scholar]
- 53.Dibble CC, Asara JM, Manning BD. Characterization of Rictor phosphorylation sites reveals direct regulation of mTOR complex 2 by S6K1. Mol Cell Biol 2009;29:5657–5670 [DOI] [PMC free article] [PubMed] [Google Scholar]
- 54.Chen CH, Shaikenov T, Peterson TR, et al. ER stress inhibits mTORC2 and Akt signaling through GSK-3β-mediated phosphorylation of rictor. Sci Signal 2011;4:ra10. [DOI] [PubMed] [Google Scholar]
- 55.Glidden EJ, Gray LG, Vemuru S, Li D, Harris TE, Mayo MW. Multiple site acetylation of Rictor stimulates mammalian target of rapamycin complex 2 (mTORC2)-dependent phosphorylation of Akt protein. J Biol Chem 2012;287:581–588 [DOI] [PMC free article] [PubMed] [Google Scholar]
- 56.McDonald PC, Oloumi A, Mills J, et al. Rictor and integrin-linked kinase interact and regulate Akt phosphorylation and cancer cell survival. Cancer Res 2008;68:1618–1624 [DOI] [PubMed] [Google Scholar]
- 57.Lusis AJ, Attie AD, Reue K. Metabolic syndrome: from epidemiology to systems biology. Nat Rev Genet 2008;9:819–830 [DOI] [PMC free article] [PubMed] [Google Scholar]
- 58.Laplante M, Sabatini DM. mTORC1 activates SREBP-1c and uncouples lipogenesis from gluconeogenesis. Proc Natl Acad Sci U S A 2010;107:3281–3282 [DOI] [PMC free article] [PubMed] [Google Scholar]
- 59.Li S, Brown MS, Goldstein JL. Bifurcation of insulin signaling pathway in rat liver: mTORC1 required for stimulation of lipogenesis, but not inhibition of gluconeogenesis. Proc Natl Acad Sci U S A 2010;107:3441–3446 [DOI] [PMC free article] [PubMed] [Google Scholar]
Associated Data
This section collects any data citations, data availability statements, or supplementary materials included in this article.


