

Abstract
Biofilm formation and host-pathogen interactions are frequently studied using multiwell plates; however, these closed systems lack shear force, which is present at several sites in the host, such as the intestinal and urinary tracts. Recently, microfluidic systems that incorporate shear force and very small volumes have been developed to provide cell biology models that resemble in vivo conditions. Therefore, the objective of this study was to determine if the BioFlux 200 microfluidic system could be used to study host-pathogen interactions and biofilm formation by pathogenic Escherichia coli. Strains of various pathotypes were selected to establish the growth conditions for the formation of biofilms in the BioFlux 200 system on abiotic (glass) or biotic (eukaryotic-cell) surfaces. Biofilm formation on glass was observed for the majority of strains when they were grown in M9 medium at 30°C but not in RPMI medium at 37°C. In contrast, HRT-18 cell monolayers enhanced binding and, in most cases, biofilm formation by pathogenic E. coli in RPMI medium at 37°C. As a proof of principle, the biofilm-forming ability of a diffusely adherent E. coli mutant strain lacking AIDA-I, a known mediator of attachment, was assessed in our models. In contrast to the parental strain, which formed a strong biofilm, the mutant formed a thin biofilm on glass or isolated clusters on HRT-18 monolayers. In conclusion, we describe a microfluidic method for high-throughput screening that could be used to identify novel factors involved in E. coli biofilm formation and host-pathogen interactions under shear force.
INTRODUCTION
Biofilms are defined as bacterial communities encased in a self-produced polymeric matrix that is attached to a surface (1). The ability to form a biofilm is virtually a universal trait of bacteria and other microorganisms. Growth as a biofilm offers protection against hostile environments, the immune response, and bactericidal concentrations of antibiotics or disinfectants (1). Biofilms have frequently been studied using the 96-microtiter plate model because it is a platform that requires small volumes and is suited for high-throughput screening (1). The major flaws of the microtiter model are that it is a closed system and does not incorporate shear force. It is generally accepted that biofilms will develop in the presence of shear force in the environment (1). The MBEC assay, formerly known as the Calgary Biofilm Device, was developed to incorporate shear force into high-throughput screens (2); however, this model is a closed system. In a closed system, dispersing signals and metabolic waste accumulate, and nutrients become depleted. These events are not always favorable for biofilm studies and may lead to the rapid dispersal of the biofilm before it is quantified.
Open systems, which have both a continuous flow of fresh medium and shear force, have been developed and are frequently used in the laboratory (1). These include the drip-flow reactor, flow cells, perfused biofilm fermenters, the CDC biofilm reactor, the rotating-disc reactor, the modified Robbins device, and the annular reactor (reviewed in reference 3). Some disadvantages of these systems are that they often require large volumes, are prone to contamination, and are not suited for high-throughput screens. In an effort to combine small volumes, high-throughput ability, and shear force in an open system, researchers have proposed the use of microfluidic models to study biofilms (4–7). Some models have yet to demonstrate their high-throughput potential (5, 7), while others require the system to be fabricated in the laboratory, which may not be feasible for all biofilm researchers (4-7). The platform proposed by Benoit et al. (4) has high-throughput capability and uses a specialized instrument, the BioFlux device, that is commercially available. One plate model contains 24 channels (6 mm long, 350 μm wide, 70 μm high) connecting 48 wells, and the BioFlux system can control four plates simultaneously. This system allows for the study of 96 independent biofilms in an experiment. Additionally, two different shear force settings per plate can be tested simultaneously. Furthermore, 50 μl is the minimum volume required for seeding or coating, and wells can contain as much as 1.25 ml of liquid, resulting in 11 to 20 h of continuous flow without replenishment at commonly used flow rates (4). The BioFlux device has also been used for the study of dental plaque biofilms (8) and for real-time monitoring of promoter activity during biofilm formation by Staphylococcus aureus (9).
The BioFlux device was initially developed to provide a cell biology model that resembles in vivo conditions. Currently, host-pathogen interactions are often studied using cell line monolayers cultured in flasks or on tissue culture plates. As with microtiter plates used in biofilm formation assays, these dishes are closed systems, which often leads to the accumulation of bacterial products, such as metabolites and toxins, that are cytotoxic. Furthermore, there is a lack of shear force in these models, and shear force is present at several sites in the host, such as the intestinal and urinary tracts (10). To overcome these limitations, several open systems have been proposed (10–13), but most systems still share some of the limitations described above (11, 12). Therefore, the BioFlux device would provide a new high-throughput tool for the study of host-pathogen interactions under conditions that resemble in vivo conditions.
Escherichia coli is a Gram-negative bacterium that can be part of the normal intestinal microbiota of animals and humans but can also be a pathogen of veterinary and human health importance (14). Pathogenic E. coli strains are typically divided into two major groups based on their infection sites: intestinal/diarrheagenic pathogenic E. coli (InPEC) and extraintestinal pathogenic E. coli (ExPEC). Among ExPEC strains, uropathogenic E. coli (UPEC) infects the urinary tract, whereas neonatal meningitis-associated E. coli (NMEC) infects the meninges. For InPEC strains associated with diarrheal infections, several pathotypes have been well characterized, including enteropathogenic E. coli (EPEC), enterotoxigenic E. coli (ETEC), enterohemorrhagic E. coli (EHEC), enteroaggregative E. coli (EAEC), enteroinvasive E. coli (EIEC), diffusely adherent E. coli (DAEC), and adherent-invasive E. coli (AIEC) (14). Given their diverse genetic makeups, which are responsible for diverse infectious processes, pathogenic E. coli strains are good models with which to test the potential of the BioFlux system as a tool for the study of host-pathogen interactions. Furthermore, biofilm formation in the BioFlux system by pathogenic E. coli has yet to be fully investigated.
In this study, we describe the conditions required to grow biofilms of different E. coli pathotypes and monolayers of HRT-18 cells in the BioFlux system. Additionally, we present a new application for the BioFlux system, which describes the development of microcolonies or biofilms in real time by pathogenic E. coli on an HRT-18 monolayer in the presence of shear force. This new tool provides an improved platform for the study of host interactions with pathogenic E. coli.
MATERIALS AND METHODS
Bacterial strains and growth conditions.
The bacterial strains used in this study are described in Table 1. Bacteria were routinely cultured on lysogeny broth (LB) agar (1% [wt/vol] tryptone, 0.5% [wt/vol] yeast extract, 1% [wt/vol] NaCl, 1.5% [wt/vol] agar) or in LB. To introduce pmCherry (Clontech, Mountain View, CA) into the desired bacterial strains, bacteria were transformed by electroporation as described elsewhere (15), and positive transformants were selected on LB agar with the appropriate ampicillin concentration (Table 1).
TABLE 1.
List of strains and plasmid used in this study
| Species, E. coli pathotype, or plasmid | Strain identification | Origin or description | Ampicillin concn (μg/ml)a | Source or reference |
|---|---|---|---|---|
| Bacteria | ||||
| Commensal E. coli K-12 | MG1655 | Human | NA | 31 |
| MG1655 mCherry | MG1655 expressing mCherry | 100 | This study | |
| Intestinal E. coli (InPEC) | ||||
| Adherent invasive (AIEC) | LF82 | Human | NA | 32 |
| Enterohemorrhagic (EHEC) | EDL933 | Human | NA | 33 |
| Sakai | Human | NA | 34 | |
| EDL933 mCherry | EDL933 expressing mCherry | 200 | This study | |
| Sakai mCherry | Sakai expressing mCherry | 200 | This study | |
| Enteropathogenic (EPEC) | E2348/69 | Human | NA | 35 |
| E2348/69 mCherry | E2348/69 expressing mCherry | 200 | This study | |
| Atypical EPEC (aEPEC) | ECL1001 | Pig | NA | 36 |
| ECL1001 mCherry | ECL1001 expressing mCherry | 200 | This study | |
| Diffusely adherent (DAEC) | 2787 | Human | NA | 37 |
| 2787 mCherry | 2787 expressing mCherry | 200 | This study | |
| 2787 ΔaidA | Human | NA | 38 | |
| 2787 ΔaidA mCherry | 2787 ΔaidA expressing mCherry | 200 | This study | |
| Enteroaggregative (EAEC) | 17.2 | Human | NA | 39 |
| 17.2 mCherry | 17.2 expressing mCherry | 400 | This study | |
| Citrobacter rodentium | DBS100 | Mouse | 400 | 40 |
| DBS100 mCherry | C. rodentium expressing mCherry | This study | ||
| Extraintestinal E. coli (ExPEC) | ||||
| Septicemic (SEPEC) | 31A | Human | NA | 41 |
| 31A mCherry | 31A expressing mCherry | 400 | This study | |
| Uropathogenic (UPEC) | CFT073 | Human | NA | 42 |
| CFT073 mCherry | CFT073 expressing mCherry | 200 | This study | |
| J96 | Human | NA | 43 | |
| F11 | Human | NA | 44 | |
| 536 | Human | NA | 45 | |
| Avian pathogenic (APEC) | χ7122 | Poultry | NA | 46 |
| Plasmid, pmCherry | pUC-based plasmid encoding mCherry | Clontech |
NA, not applicable.
Biofilms in microtiter plates.
The assay of biofilm formation in microtiter plates was adapted from the work of Wu et al. (16) and is summarized in Fig. 1. Briefly, colonies of E. coli from LB agar were resuspended in 5 ml of fresh LB and were incubated at 37°C with shaking (180 rpm) for 16 h. These cultures were then diluted (1:100) in 5 ml of M9 medium with glucose (0.4%, wt/vol) and minerals (1.16 mM MgSO4, 2 μM FeCl3, 8 µM CaCl2, and 16 µM MnCl2) and were incubated at 37°C with shaking (180 rpm) for 24 h. Dilutions (1:100 in M9 medium with glucose and minerals or Roswell Park Memorial Institute [RPMI] medium [Gibco, Burlington, ON, Canada] supplemented with 10% fetal bovine serum [Gibco]) of these cultures were deposited in triplicate in the wells of 96-well microtiter plates (150 μl; Costar 3370; Corning, Corning, NY, USA) or in the Lab-Tek chamber slide system (300 μl; Nunc 177402; Thermo Scientific, Ottawa, ON, Canada). The plates and the Lab-Tek chambers were incubated for 24 h at 30°C and 37°C, respectively. The liquid medium was then removed using a multichannel pipette, and unattached cells were removed by washing three times with phosphate-buffered saline (PBS) (1.76 mM KH2PO4, 10 mM Na2HPO4, 137 mM NaCl, 2.7 mM KCl [pH 7.4]). Plates were dried at 37°C for 15 min, and the biofilms were stained with crystal violet (0.1%, wt/vol) for 2 min at room temperature. The crystal violet solution was removed, and the biofilms were washed three times with distilled water and were then dried at 37°C for 15 min. The stain was then released with 70% (vol/vol) ethanol, and the amount of released stain was quantified by measuring the absorbance at 590 nm with a microplate reader (PowerWave; Bio-Tek Instruments, Winooski, VT, USA).
FIG 1.

Flow chart of the protocol used to grow biofilms in microtiter and BioFlux plates and to investigate host-pathogen interactions using the BioFlux 200 system.
Biofilms in the BioFlux flowthrough device.
The method for growing biofilms in the BioFlux 200 device (Fluxion Biosciences, South San Francisco, CA, USA) was adapted from the work of Benoit et al. (4) and from the manufacturer's recommendations; the protocol is summarized in Fig. 1. Briefly, colonies of E. coli on LB agar were resuspended in 5 ml of fresh LB and were incubated at 37°C with shaking (180 rpm) for 16 h. These cultures were then diluted (1:100) in 5 ml of M9 medium with glucose (0.4%, wt/vol) and were incubated at 37°C with shaking (180 rpm) for 24 h. A 1-ml volume was transferred to a 1.5-ml Eppendorf tube, and the bacteria were collected by centrifugation (14,000 × g, 2 min). The pellets were resuspended in fresh prewarmed (30°C) M9 medium with glucose (0.4%, wt/vol) or fresh prewarmed (37°C) RPMI medium with fetal bovine serum to an optical density at 600 nm (OD600) of ≈1. The microfluidic channels were wetted with prewarmed (30°C) M9 medium with glucose (0.4%, wt/vol) and were inoculated by injecting the bacterial suspension into the output reservoir for 20 s at 0.5 dyne/cm2. The microfluidic plate was incubated for 2 h at 30°C to allow bacteria to bind to the surface. Fresh prewarmed (30°C) M9 medium with glucose (0.4%, wt/vol) was added to the input reservoir, and the flow of fresh medium was initiated at 1.0 dyne/cm2 for 5 h. The spent medium was then removed from the output reservoir; fresh prewarmed (30°C) medium was added to the input reservoir; and the flow was lowered to 0.5 dyne/cm2 for an additional 17 h. Once the incubation was completed, biofilms were washed by injecting PBS from the input reservoir for 20 min at 0.5 dyne/cm2, stained by injecting crystal violet or FM1-43 dye (Life Technologies, Inc., Burlington, ON, Canada) from the input reservoir for 20 min, and washed by injecting PBS from the input reservoir for 20 min at 0.5 dyne/cm2. Images of crystal violet-stained BioFlux biofilms were obtained using an inverted fluorescence microscope equipped with a 40× objective (CKX41; Olympus, Markham, ON, Canada), a digital camera (Retiga EX; QImaging, Surrey, BC, Canada), and the software provided with the BioFlux 200 device. The FM1-43-stained biofilms were visualized with a confocal microscope with a 40× objective (FV1000 IX81; Olympus, Markham, ON, Canada). The fluorophore was excited (λem, 488 nm) and detected (λem, 525 nm ± 25 nm) as recommended by the manufacturer. The laser was set between 666 V and 795 V with a 1% gain, which minimized saturation and autofluorescence, as determined with nonstained samples. The images were acquired using FluoView software (Olympus).
Enzymatic treatment of preformed biofilms.
Biofilms were prepared either in a microtiter plate or in the BioFlux device as described above. For the microtiter plate biofilms, enzymatic treatments were performed as described previously (17). Briefly, enzyme solutions (proteinase K [500 μg/ml] in 50 mM Tris-HCl [pH 7.5], 1 mM CaCl2, or DNase I [500 μg/ml] in 150 mM NaCl, 1 mM CaCl2) were added to the wells and were incubated at 37°C for 1 h. The biofilms were then washed, stained, and quantified as described above.
For the BioFlux biofilms, fresh and spent media were removed from the wells, and an enzyme solution (proteinase K [125 μg/ml] or DNase I [125 μg/ml] in M9 medium) or fresh medium (untreated control) was added to the input wells. The solutions were injected into the channel for 1 h at 0.5 dyne/cm2. The biofilms were then washed with PBS and were stained as described above. Images of the biofilms were captured as described above.
Cell culture.
The HRT-18 cell line, a human colorectal adenocarcinoma cell line, was grown in RPMI medium supplemented with 10% fetal bovine serum (Gibco), 1% penicillin-streptomycin (100×; Gibco), and 1% amphotericin B (Fungizone; 250 μg/ml; Gibco). The HEp-2 cell line, derived from human larynx carcinoma, and the SJPL cell line, of monkey origin (18), were grown in Dulbecco's modified Eagle medium (DMEM) supplemented with 10% fetal bovine serum (Gibco), 1% penicillin-streptomycin (100×; Gibco), and 1% amphotericin B (250 μg/ml; Gibco). Cells were grown in T175 flasks (Sarstedt, Nümbrecht, Germany) at 37°C under an atmosphere enriched with 5% CO2.
Growth of cell lines in the BioFlux flowthrough device.
The method for growing cell lines in the BioFlux 200 device (Fluxion Biosciences) was adapted from the manufacturer's recommendations. The microfluidic channels were wetted with prewarmed (37°C) RPMI medium or DMEM, and HEp-2, SJPL, or HRT-18 cells at a concentration of 5 × 10⁶, 5 × 10⁶, or 2 × 10⁷ per ml, respectively, were injected from the output reservoir into the channel for 30 s at 0.5 dyne/cm2. The microfluidic plate was incubated for 4 to 8 h, 16 to 24 h, or 8 to 16 h at 37°C under an atmosphere enriched with 5% CO2 to allow the SJPL, HEp-2, or HRT-18 cells, respectively, to attach to the surface. Once the cells were attached, 1.2 ml or 0.3 ml of fresh prewarmed (37°C) RPMI medium or DMEM supplemented with fetal bovine serum was added to the input or output reservoir, respectively. This created a flow between the input and output reservoirs equivalent to gravity (gravity flow), which was required for optimal growth of the monolayer. The cells were incubated at 37°C under an atmosphere enriched with 5% CO2 for approximately 48 to 72 h, until the cells reached 95% to 100% confluence in the channel.
Adhesion of pathogenic E. coli to HRT-18 cells in the BioFlux flowthrough device.
An overview of the protocol is shown in Fig. 1. Colonies of E. coli strains carrying pmCherry on LB agar with ampicillin (concentrations listed in Table 1) were resuspended in 5 ml M9 medium with glucose (0.4%, wt/vol) and ampicillin (concentrations listed in Table 1) and were incubated at 37°C with shaking (180 rpm) for 24 h. A 250-μl volume was transferred to a 1.5-ml Eppendorf tube, and the bacteria were collected by centrifugation (14,000 × g, 2 min). The pellets were resuspended in fresh prewarmed (37°C) complete RPMI medium or DMEM supplemented with fetal calf serum to an OD600 of ≈0.5. The microfluidic channels containing the 95% to 100% confluent cell monolayers were inoculated by injecting the bacterial suspension from the output reservoir for 20 s at 0.5 dyne/cm2. The microfluidic plate was incubated for 1.5 h at 37°C to allow the bacteria to bind to the cells. Fresh prewarmed (37°C) complete RPMI medium or DMEM supplemented with fetal calf serum was added to the input reservoir, and the flow of fresh medium was initiated at 0.5 dyne/cm2 for 16 h. Once the incubation was completed, weakly attached or unattached bacteria were removed by injecting PBS from the input reservoir for 20 min at 0.5 dyne/cm2, and eukaryotic cells and attached bacteria were fixed by injecting the fixing solution (50% [vol/vol] methanol, 50% [vol/vol] acetone) from the input reservoir for 20 min at 0.5 dyne/cm2 and were washed by injecting PBS from the input reservoir for 20 min at 0.5 dyne/cm2. Cells and bacteria were stained with 4′,6-diamidino-2-phenylindole (DAPI; Life Technologies) by injecting the dye from the input reservoir for 20 min at 0.5 dyne/cm2, and excess dye was removed by injecting PBS from the input reservoir for 20 min at 0.5 dyne/cm2. The plate was then observed with a confocal microscope equipped with a 20× objective (Olympus FV1000 IX81). The fluorophores were excited (λex, 405 nm for DAPI or 543 nm for mCherry) and detected (λem, 450 nm ± 25 nm for DAPI or 605 nm ± 100 nm for mCherry) as recommended by the manufacturers. The laser was set between 404 and 458 V with a 1% gain for DAPI and between 672 and 830 V with a 54% gain for mCherry. These settings minimized saturation and autofluorescence, as determined with nonstained samples. Images were acquired using FluoView software (Olympus).
To measure the viability of the cell lines, weakly attached or unattached bacteria were washed by injecting Dulbecco's PBS (DPBS; Gibco) from the input reservoir for 20 min at 0.5 dyne/cm2, stained with trypan blue (0.4% solution; Life Technologies, Inc.) for 20 min at 0.5 dyne/cm2, and washed by injecting DPBS from the input reservoir for 20 min at 0.5 dyne/cm2. Cells stained with trypan blue in the channel were counted using an inverted fluorescence microscope equipped with a 20× objective (Olympus CKX41).
The growth of the bacteria was also monitored by taking a picture every 10 min using an inverted fluorescence microscope equipped with a 10× objective (Olympus CKX41), a digital camera (Retiga EX; QImaging), and the software provided with the BioFlux 200 device. Pictures were assembled to create a time lapse video using the software provided with the BioFlux 200 device.
Image analysis.
Images of biofilms and cell attachment were analyzed using ImageJ (National Institutes of Health, Bethesda, MD, USA). The 16-bit grayscale images were adjusted with the threshold function to fit the bacterial structure and were analyzed using the “Analyze Particles” function.
Confocal images were analyzed using Image-Pro software (version 9.0; Media Cybernetics, Inc., Bethesda, MD, USA) as described previously (19). Briefly, a 3-dimensional (3D) image of cell attachment for each strain was generated using a minimum of 15 image layers, and the Z-distance was kept within the same range between samples. An isoimage was then created from the reconstructed 3D image. This isoimage was used to measure the volume and height of the bacterial cluster. Biomass was calculated by dividing the total volume by the surface area of the field of view.
Statistical analysis.
The results for the static biofilms were analyzed using two-way analysis of variance (ANOVA) followed by a Bonferroni post hoc comparison using GraphPad Prism, version 4.02 (GraphPad Software, San Diego, CA, USA). The results of the enzymatic digestions and the comparisons of the DAEC 2787 parental and mutant strains were analyzed using a Mann-Whitney U test with two-tailed distribution.
RESULTS
Static biofilms.
We first sought to establish if strains belonging to different E. coli pathotypes had the ability to form biofilms under similar conditions. Combinations of two abiotic surfaces (polystyrene versus glass) and growth conditions (M9 medium with 0.4% [wt/vol] glucose versus RPMI medium with fetal bovine serum) were tested. Only atypical EPEC (aEPEC) ECL1001 was unable to form a biofilm (OD590, ≤0.110) under any of the conditions tested (Fig. 2A). AIEC LF82 formed biofilms that yielded similar OD590 values regardless of the growth condition and surface. For most strains, there was no significant difference between the surfaces tested; however, on a glass surface with M9 medium with 0.4% (wt/vol) glucose, EHEC Sakai formed more biofilm, whereas UPEC CFT073 formed less biofilm, than on a polystyrene surface (Fig. 2). M9 medium with 0.4% (wt/vol) glucose significantly increased biofilm formation over that with RPMI medium with fetal bovine serum for EHEC Sakai and the ExPEC strains, with the exception of avian-pathogenic E. coli (APEC) strain χ7122. Although there was no significant difference between M9 medium with 0.4% (wt/vol) glucose and RPMI medium with fetal bovine serum for the other strains, the average level of biofilm formation in RPMI medium with fetal bovine serum was never above an OD590 of 0.3, except for AIEC LF82 (Fig. 2). Furthermore, microscopy images of the biofilms indicated that most strains formed no or limited biofilms with RPMI medium compared to biofilm formation with M9 medium with 0.4% (wt/vol) glucose (see Fig. S1 in the supplemental material). Therefore, M9 medium with 0.4% (wt/vol) glucose at 30°C is the growth condition that supports consistent formation of biofilms regardless of the surface.
FIG 2.
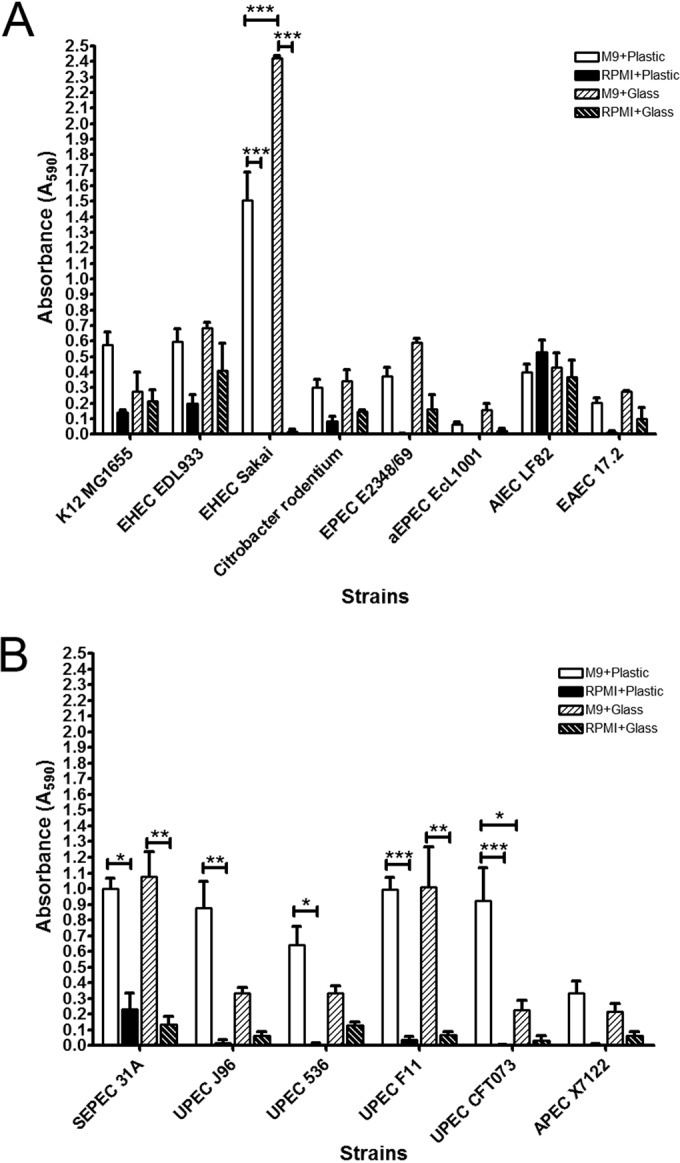
Biofilm formation by representative strains of different pathotypes on polystyrene (microtiter plate) or glass (Lab-Tek chambers). InPEC (A) or ExPEC (B) biofilms were formed in M9 medium plus glucose (0.4%, wt/vol) at 30°C or in RPMI medium at 37°C for 24 h and were stained with crystal violet, and the absorbance at 590 nm was measured. Results are averages for at least 3 biological replicates. Error bars represent standard error. *, P < 0.05; **, P < 0.01; ***, P < 0.001.
In M9 medium with 0.4% (wt/vol) glucose at 30°C on microtiter plates, the E. coli K-12 strain MG1655 had a moderate (0.400 ≤OD590 ≤1.000) ability to form biofilms. EPEC E2348/69, AIEC LF82, and EAEC 17.2 had weak (0.110 ≤OD590 ≤0.400) to moderate biofilm-forming ability, whereas EHEC EDL933, EHEC Sakai, and Citrobacter rodentium DBS100 had a moderate to strong (OD590, ≥1.000) ability to form biofilms (Fig. 2). Among ExPEC strains, the four UPEC isolates and septicemic E. coli (SEPEC) 31A were strong biofilm formers, whereas APEC χ7122 was a moderate biofilm former (Fig. 2).
BioFlux biofilms.
Given that most pathotypes formed biofilms at 30°C in M9 medium with 0.4% (wt/vol) glucose, it was decided that these conditions would be used to optimize the microfluidic assay. The variable parameters were first tested with EHEC strains EDL933 and Sakai, and these parameters included the inoculum density (OD600, 0.125, 0.25, 0.5, or 1.0), the incubation time for the initial adhesion (1, 2, or 4 h), and the shear force (0.5 to 2.0 dynes/cm2) during biofilm formation. The minimum inoculum density that yielded a biofilm was an OD600 of 0.5, but an OD600 of 1.0 gave more consistent results and therefore was selected for further testing. The best incubation time for the initial adhesion was 2 h, because a 1-h adhesion time gave inconsistent results and a 4-h adhesion time often resulted in overgrowth 12 h after the flow was initiated. This overgrowth blocked the channel or contaminated the input reservoir. The two EHEC strains were able to form biofilms with a shear force as high as 1.0 dyne/cm2. Unfortunately, the input reservoir was sometimes contaminated when the shear force was set to the lower setting. Both strains are motile, and it was hypothesized that these strains could travel upstream in the presence of shear force. Upstream motility has been observed for E. coli previously (20). In an effort to fix this problem, the shear force was set to 1.0 dyne/cm2 for the first 5 h and was then decreased to 0.5 dyne/cm2. Biofilm formation was more consistent, and the input reservoir was never contaminated, with these settings. Surprisingly, this appeared to stimulate biofilm formation. Overall, it was decided that biofilm formation would be tested using an initial inoculum at an OD600 of 1.0, with 2 h of incubation for the initial attachment, and with the shear force set at 1.0 dyne/cm2 for the first 5 h, followed by a decrease to 0.5 dyne/cm2 for the next 17 h. This final protocol is summarized in Fig. 1. Once the protocol was optimized, biofilm formation was tested at 37°C in RPMI medium with 10% fetal bovine serum. Although initial adhesion was observed, the majority of the strains were not able to remain attached and form a biofilm; only UPEC J96 was able to form a biofilm (see Fig. S2 in the supplemental material).
Quantification of BioFlux biofilms.
Benoit et al. (4) used green fluorescent protein (GFP) and a plate reader to quantify the effects of antibiotics on biofilms; however, we could not use a plate reader, because E. coli poorly expressed the mCherry fluorescent protein in M9 medium at 30°C (data not shown). Quantification of CFU is difficult, because the output well containing the planktonic cells will often contaminate the samples during sample collection. Additionally, larger volumes were required to release crystal violet from the strong biofilm formers, which diluted the stain, in some cases, below the detection level of the microplate reader. Furthermore, releasing the stain did not allow for differentiation between weak and moderate biofilms. Therefore, stain release was not sensitive enough for appropriate analysis. Thus, image analysis of the field of view provided the best option for quantifying biofilm formation.
The “Analyze Particles” function of ImageJ allows the measurement of biofilm structures such as microcolonies or single cells (average particle size), the number of structures measured (number of particles), and the percentage of the area covered by these structures (Table 2). Furthermore, 3D reconstruction of confocal images allows for the measurement of biomass and maximum height (Table 2). Overall, these measurements can help classify strains based on their ability to form biofilms. For example, a weak biofilm former (e.g., EHEC EDL933, EHEC Sakai, aEPEC ECL1001, and C. rodentium DBS100) has >1,000 particles of 10 to 30 pixels that occupy less than 50% of the field of view (Fig. 3 and Table 2). These strains also have biomass that is less than 5 μm3/μm2. On the other hand, strong biofilm formers (e.g., K-12 MG1655, APEC χ7122, EPEC E2348/69, UPEC 536, UPEC F11, and UPEC J96) had fewer particles (<200) that were larger (>500 pixels) and covered >70% of the field of view (Fig. 3 and 4 and Table 2). Their biomasses were also greater than 6 μm3/μm2. The only strain that fell between the two categories was AIEC LF82. Its biofilms covered a large part of the surface and formed few but large particles; however, its biomass was smaller than 5 μm3/μm2. This lower biomass was mostly due to the fact that AIEC LF82 formed mushroom-shaped biofilms, defined by a large projection sitting on a stalk. This was not observed for the other strains. Biomass could not be measured for EAEC 17.2 and SEPEC 31A, because both strains frequently formed structures that reduced the flow of the medium inside the channel after 20 h of growth with continuous flow (Fig. 3 and 4). This blockage did not allow for effective penetration of the fluorescent dye and thus did not allow for confocal microscopy analysis.
TABLE 2.
Quantification of biofilm formation and cell attachment of E. coli pathotypes using a microfluidic systema
| Assay, strain, and treatment | No. of particles | Avg particle size (pixels)b | % of area covered | Biomass (μm3/μm2)c | Height (μm) |
|---|---|---|---|---|---|
| Biofilm formation | |||||
| EHEC EDL933 | 1,828 (±250) | 10.5 (±5) | 18 (±5) | 3.88 (±1.06) | 31 (±3) |
| EHEC Sakai | 1,430 (±127) | 30.0 (±7.4) | 41 (±12) | 2.64 (±0.86) | 35 (±4) |
| C. rodentium DBS100 | 1,517 (±148) | 21.5 (±8.3) | 31 (±6) | 2.06 (±0.42) | 23 (±5 |
| AIEC LF82 | 14 (±7) | 7,132.1 (±258.9) | 95 (±14) | 2.44 (±1.85) | 37 (±5) |
| EPEC | 123 (±22) | 623.7 (±250.6) | 73 (±17) | 8.43 (±1.23) | 38 (±3) |
| aEPEC ECL1001 | 2,644 (±311) | 13.0 (±4.8) | 33 (±9) | 3.05 (±0.65) | 22 (±6) |
| K-12 MG1655 | 45 (±8) | 1,967.4 (±127.2) | 84 (±15) | 7.85 (±0.92) | 27 (±4) |
| EAEC 17.2 | 23 (±6) | 3,876.7 (±289.6) | 85 (±17) | NDd | NDd |
| SEPEC 31A | 144 (±24) | 541.4 (±114.9) | 74 (±8) | NDd | NDd |
| APEC | 14 (±4) | 7,148.6 (±356.8) | 95 (±6) | 8.08 (±1.04) | 26 (±2) |
| UPEC 536 | 97 (±17) | 917.1 (±95.8) | 85 (±13) | 10.39 (±0.76) | 31 (±4) |
| UPEC F11 | 78 (±13) | 1,120.9 (±108.3) | 83 (±12) | 17.28 (3.02) | 50 (±7) |
| UPEC CFT073 | 1,100 (±206) | 45.9 (±35.1) | 36 (±21) | 2.54 (±1.56) | 22(±14) |
| UPEC J96 | 12 (±5) | 8,197.8 (±312.9) | 93 (±7) | 9.53 (±1.03) | 29 (±4) |
| Enzymatic treatment | |||||
| K-12 MG1655 | |||||
| Control | 102 (±21) | 575.3 (±148.2) | 70 (±8) | NAe | NA |
| Proteinase K | 383(±25) | 30.6 (±14.9) | 14 (±3) | NA | NA |
| DNase | 124 (±19) | 405.4 (±74.9) | 64 (±9) | NA | NA |
| EPEC | |||||
| Control | 285 (±34) | 165.9 (±30.8) | 58 (±16) | NA | NA |
| Proteinase K | 331 (±14) | 22.8 (±11.6) | 9 (±2) | NA | NA |
| DNase | 198 (±11) | 247.9 (±21.6) | 64 (±14) | NA | NA |
| AIEC LF82 | |||||
| Control | 100 (±5) | 580.7 (±210.6) | 71 (±17) | NA | NA |
| Proteinase K | 385 (±37) | 83.3 (±34.5) | 39 (±11) | NA | NA |
| DNase | 178 (±16) | 270.8 (±97.3) | 61 (±10) | NA | NA |
| Cell attachment | |||||
| Negative control | 5 (±3) | 1.4 (±0.5) | 0.07 (±0.05) | NDf | NDf |
| K12 MG1655 | 41 (±10) | 2.9 (±0.6) | 1 (±0.6) | NDf | NDf |
| EHEC EDL933 | 200 (±16) | 6.5 (±0.9) | 13 (±2) | 2.17 (±0.31) | 25 (±2) |
| EHEC Sakai | 61 (±11) | 39.4 (±5.6) | 24 (±4) | 1.99 (±0.21) | 20 (±1) |
| C. rodentium DBS100 | 32 (±5) | 230.7 (±50.9) | 73 (±9) | 1.36 (±0.12) | 8 (±1) |
| EPEC | 78 (±19) | 64.7 (±14.3) | 48 (±5) | 3.18 (±0.32) | 28 (±3) |
| aEPEC ECL1001 | 111 (±23) | 11.1 (±3.8) | 12 (±2) | 0.31 (±0.09) | 19 (±2) |
| EAEC 17.2 | 70 (±9) | 48.6 (±6.5) | 34 (±5) | 5.23 (±0.83) | 33 (±4) |
| SEPEC 31A | 276 (±31) | 7.0 (±1.2) | 19 (±2) | 1.82 (±0.43) | 39 (±3) |
| UPEC CFT073 | 83 (±16) | 11.3 (±1.6) | 9 (±3) | 0.25 (±0.07) | 13 (±2) |
Values are averages (standard errors) for 3 independent biological replicates.
Two pixels are approximately equivalent to 1 bacterial cell.
ND, not determined; NA, not applicable.
The microfluidic channel was blocked and did not allow effective penetration of the dye.
NA, images were not captured with a confocal microscope.
The absence of fluorescence in the mCherry channel did not allow for the detection of measureable biofilms.
FIG 3.

Biofilm formation by representative InPEC strains in the presence of shear force in a microfluidic system. Biofilms were formed in M9 medium plus glucose (0.4%, wt/vol) at 30°C in the presence of shear force (1.0 dyne/cm2 for 5 h, followed by 0.5 dyne/cm2 for 17 h) and were stained with crystal violet or FM1-43. Biofilms formed in a microtiter plate are shown for reference purposes. A field of view representative of 3 biological replicates is shown for each strain, and images were captured using either an inverted microscope and a digital camera (crystal violet-stained biofilms) or a confocal microscope (FM1-43-stained biofilms). The fluorescent image for EAEC 17.2 is missing because the microfluidic channel was blocked and did not allow for effective penetration of the dye.
FIG 4.

Biofilm formation by representative ExPEC strains in the presence of shear force in a microfluidic system. Biofilms were formed in M9 medium plus glucose (0.4%, wt/vol) at 30°C in the presence of shear force (1.0 dyne/cm2 for 5 h, followed by 0.5 dyne/cm2 for 17 h) and were stained with crystal violet or FM1-43. Biofilms formed in a microtiter plate are shown for reference purposes. A field of view representative of 3 biological replicates is shown for each strain, and images were captured using either an inverted microscope and a digital camera (crystal violet-stained biofilms) or a confocal microscope (FM1-43-stained biofilms). The fluorescent image for ExPEC 31A is missing because the microfluidic channel was blocked and did not allow for effective penetration of the dye.
All strains tested were able to remain attached under shear force in the BioFlux system, and this did not always correlate with their abilities to form biofilms in microtiter plates (Fig. 2, 3, and 4). For example, EHEC EDL933, EHEC Sakai, C. rodentium DBS100, and UPEC CFT073 were considered to be moderate to strong biofilm formers in microtiter plates but formed small, thin biofilms in the BioFlux system. Conversely, K-12 MG1655, APEC χ7122, AIEC LF82, EPEC E2348/69, and EAEC 17.2 were weak to moderate biofilm formers in microtiter plates but appeared to thrive in the BioFlux system, where they formed strong, structured biofilms. On the other hand, SEPEC 31A and the UPEC strains, except for CFT073, were strong biofilm formers in microtiter plates and formed strong biofilms in the BioFlux system, whereas the aEPEC strain did not form biofilms in microtiter plates and formed a thin biofilm-like structure in the BioFlux system.
Enzymatic treatment.
Enzymatic treatments are often used to characterize the composition of the biofilm matrix. Thus, we first treated the biofilms formed in microtiter plates in order to identify strains that were sensitive to DNase or proteinase K. Strains were selected based on their abilities to form moderate to strong biofilms in both microtiter and BioFlux 200 plates. Therefore, the K-12 strain MG1655, EPEC E2348/69, AIEC LF82, SEPEC 31A, and the four UPEC isolates were used for our test in the microtiter plate assay (Fig. 2 and 3 and Table 2). In this assay, all biofilms, except for AIEC LF82 biofilms, were significantly sensitive to proteinase K treatment (Fig. 5A), and all isolates were resistant to DNase treatment (Fig. 5B).
FIG 5.

Enzymatic treatment of preformed biofilms of selected pathotypes. (A and B) Biofilms formed in microtiter plates were treated with protease (A) or DNase (B) for 1 h. Absorbance was read at 590 nm. Results are averages for 3 independent biological replicates; error bars represent standard error. *, P < 0.05; **, P < 0.01. (C) Biofilms formed in the BioFlux 200 system were also treated with protease or DNase for 1 h. The remaining biofilms were then stained with crystal violet. A field of view representative of 3 independent replicates is shown for each test. Images were captured using an inverted microscope and a digital camera.
E. coli K-12 MG1655, EPEC E2348/69, and AIEC LF82 were selected for further tests in the BioFlux 200 system to ensure that the enzymatic treatment assay could be used with the microfluidic system. As with the microtiter plate assay, the biofilms of K-12 MG1655 and EPEC E2348/69 were significantly sensitive to proteinase K treatment and resistant to DNase digestion (Fig. 5C and Table 2). Biofilms of AIEC LF82 was resistant to proteinase K digestion and DNase treatment (Fig. 5C and Table 2). Therefore, enzymatic treatment can be used to characterize the matrix composition of biofilms formed using the BioFlux 200 system.
Adhesion of pathogenic E. coli to HRT-18 monolayers.
To determine the seeding concentrations for cell lines, cells at a concentration of 5 × 10⁵, 1 × 10⁶, 5 × 10⁶, 1 × 10⁷, 5 × 10⁷, or 1 × 10⁸ per ml were injected into the channel. Cells were first grown without flow for as long as 72 h. The cells never reached confluence, and most appeared to be dead or unhealthy (data not shown). To improve cell viability and confluence, cells at the concentrations given above were injected and were then incubated without any flow for 4 h, 8 h, 16 h, or 24 h in order to measure the time required for initial attachment. Gravity flow, which is achieved by adding 1.2 ml of medium to the input well and 0.3 ml of medium to the output well, was then initiated, and cells were monitored for as long as 96 h. The minimum incubation times for the initial attachment of SJPL, HRT-18, and HEp-2 cells were 4, 8, and 16 h, respectively. When the incubation time was too short, the cells detached as soon as the flow was initiated. Incubations for longer than 24 h without flow resulted in cell death and the inability to develop a confluent monolayer. SJPL and HEp-2 cells at concentrations between 1 × 10⁶ and 5 × 10⁶ per ml and HRT-18 cells at concentrations between 1 × 10⁷ and 5 × 10⁷ per ml were able to reach 95% to 100% confluence between 36 h and 96 h. A larger number of HRT-18 cells were required for seeding, because they are smaller than SJPL or HEp-2 cells. Seeding the wells with 10-fold fewer cells than the optimal seeding concentration resulted in a maximum of 50% confluence. Conversely, when wells were seeded with 10-fold more cells than the optimal seeding concentration, cells and debris blocked the microfluidic channels. Furthermore, HEp-2 cells occasionally grew as stacks that blocked the channel and, as a result, did not always reach 95% to 100% confluence (see Fig. S3 in the supplemental material). These cells were not used for any of our assays because of the inconsistent results. Overall, it was decided that HRT-18 cells would be seeded at an initial inoculum of 5 × 10⁷ per ml, incubated for 8 h to 16 h for the initial attachment, and grown with a gravity flow until the cells reached 95% to 100% confluence. SJPL cells were seeded at 5 × 10⁶ per ml and were incubated for 4 h to 8 h for the initial attachment; they were able to reach 95% to 100% confluence after 36 h (see Fig. S3). Using these parameters, cell monolayers were subjected to different shear forces (0.5 to 1.0 dyne/cm2) for as long as 48 h. The monolayers were able to remain attached with shear forces as high as 1.0 dyne/cm2 for 48 h. Furthermore, 30 (±15) HRT-18 cells in the channel, which contained ∼5 × 10⁵ cells, were stained with trypan blue, indicating that >99% of the cells had intact membranes (see Table S1 in the supplemental material). Additionally, cell death can be assessed by looking at the integrity of the monolayer, because dead cells will usually detach and be removed by the flow of medium.
In contrast to its behavior under biofilm growth conditions (M9 medium and 30°C), E. coli readily produced mCherry in RPMI medium at 37°C, allowing the use of strains carrying pmCherry for microscopy analysis. Initial tests with HRT-18 or SJPL monolayers were then performed with EHEC EDL933 carrying the pmCherry plasmid. Different inoculum densities (OD600, 0.125, 0.25, 0.5, or 1.0) were tested to establish the optimal conditions, but shear force was fixed at 0.5 dyne/cm2. It was also noted that the medium acidified, as indicated by a change in the color of the medium, within 1.5 h. Therefore, an incubation time of 1.5 h for the early adhesion of E. coli to HRT-18 monolayers was selected instead of the 2 h used in the BioFlux biofilm assay. Tests were also performed with monolayers at 100% and 50% confluence. EHEC EDL933 was not able to attach to or remain on SJPL monolayers in the presence of shear force; therefore, SJPL monolayers were not used for further tests. At 50% confluence, EHEC EDL933 bound specifically to HRT-18 monolayers and did not attach to the glass surface (see Fig. S4 in the supplemental material). At 100% confluence, after 17 h, EHEC EDL933 was attached to cell monolayers and was able to form microcolonies (Fig. 6). The best initial inoculum density was an OD600 of 0.5; at lower densities (OD600, 0.125 or 0.25), very few cells were observed, and at an OD600 of 1.0, the channel was blocked after 12 h (see Video S1 in the supplemental material). At higher densities, the growth of EHEC EDL933 on HRT-18 monolayers could be monitored visually in real time using phase-contrast microscopy, which confirmed the presence of bacteria in the growth chamber (see Video S1). On average, 120 (±21) cells incubated with EHEC EDL933 were stained with trypan blue (approximately 4 times more cells than those incubated with the negative control and stained with trypan blue) (see Table S1 in the supplemental material). However, more than 99% of the cells within the monolayer had intact membranes. Furthermore, the monolayer remained intact, indicating that attachment and growth of EHEC EDL933 did not cause detachment of the HRT-18 monolayer.
FIG 6.
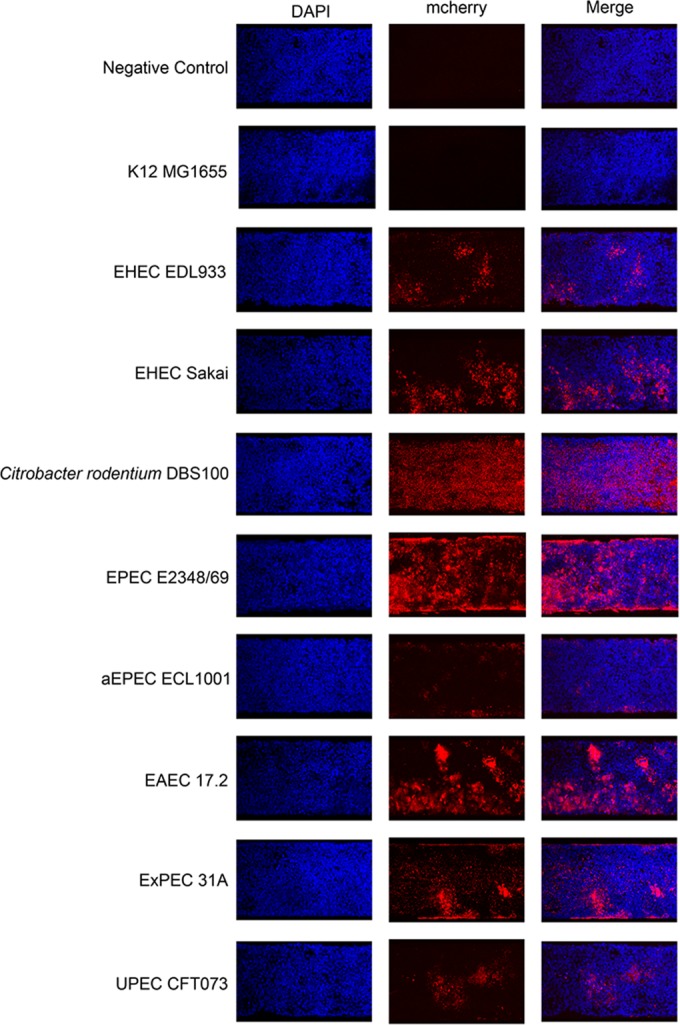
Attachment and growth of representative strains of different pathotypes on HRT-18 monolayers in the presence of shear force in a microfluidic system. Strains were incubated for 1.5 h in the presence of a preformed cell monolayer to allow initial attachment; they were then subjected to shear force (0.5 dyne/cm2) for 16 h. Cells and bacteria were then washed, fixed, and stained with DAPI. The attachment and growth of bacteria on HRT-18 monolayers were observed with a confocal microscope by exciting and detecting the fluorophore (DAPI or mCherry). A field of view representative of 3 independent replicates for each strain is shown.
To see if this assay could be used for strains belonging to other pathotypes, representative strains were selected based on their biofilm-forming abilities and were transformed with pmCherry. UPEC J96 was not selected, because it was able to form a biofilm in the BioFlux system when grown in RPMI medium (see Fig. S2 in the supplemental material). The introduction of pmCherry into the strains did not affect their biofilm-forming ability in the microtiter plate assay in M9 medium with 0.4% (wt/vol) glucose. The next step was to ensure that the pathogenic E. coli strains did not form biofilms under the conditions used to grow the HRT-18 monolayer (37°C in RPMI medium). This was important in order to ensure that the E. coli strains specifically bound the cells and not the glass of the BioFlux plate. The same parameters described for the BioFlux biofilm assay were used, except that instead of being grown in M9 medium at 30°C, the bacteria were grown in RPMI medium at 37°C. As observed above, none of the strains stayed attached to the glass surface in the absence of cells under the conditions used to grow the HRT-18 cell monolayer. Except for the K-12 strain MG1655, all strains were able to bind to HRT-18 monolayers, and most strains were able to form some aggregates. The abilities of some strains to grow on HRT-18 monolayers were similar to their abilities to form biofilms in the BioFlux system. For example, EPEC E2348/69, a strong BioFlux biofilm former, had the best ability to attach to the cell monolayer and form a biofilm-like structure, whereas aEPEC ECL1001, a weak BioFlux biofilm former, only bound and formed small aggregates (Fig. 6). This finding is also supported by image analysis; EPEC E2348/69 had fewer particles (78 particles) but larger aggregates (64 pixels), with a biomass of 3.18 μm3/μm2 covering 48% of the surface, whereas aEPEC ECL1001 had more particles (111 particles) but smaller aggregates (11 pixels), with a biomass of 0.31 μm3/μm2 covering 12% of the surface (Table 2). Furthermore, both EHEC EDL933 and EHEC Sakai were able to form microcolonies on HRT-18 monolayers, but EHEC Sakai formed larger particles (6.5 versus 39 pixels) and more numerous microcolonies (13% versus 24% surface coverage) than EHEC EDL933, as observed with their BioFlux biofilms (Fig. 3 and 6 and Table 2). However, these differences did not result in significant differences in biomass between the two EHEC strains (Table 2). Additionally, C. rodentium DBS100, an EHEC surrogate and a natural mouse pathogen, could only attach and did not form any large aggregates or microcolonies (Fig. 6). It also formed a thinner layer (up to 8 μm thick) with a smaller biomass (1.36 μm3/μm2) than most strains, for which cluster heights ranged from 13 to 39 μm (Table 2). In contrast to their BioFlux biofilm formation, EAEC 17.2, SEPEC 31A, and UPEC CFT073 did not form extensive biofilm structures on HRT-18 monolayers (Fig. 3, 4, and 6). EAEC 17.2 formed large, tall microcolonies (as high as 33 μm) that had the largest biomass (5.23 μm3/μm2) of the strains, whereas SEPEC 31A and UPEC CFT073 only formed scattered aggregates and had some of the smallest biomasses (Fig. 6 and Table 2). However, the SEPEC 31A strain formed the tallest microcolonies, measuring as much as 39 μm (Table 2).
Cell death was assessed by trypan blue staining, and the number of trypan blue-positive cells per channel ranged from 105 to 1,044 for infected cells (see Table S1 in the supplemental material). The number of trypan blue-positive cells was pathotype dependent, and the standard deviation between biological replicates was less than 22 cells. EAEC 17.2 had the greatest number of trypan blue-positive cells (see Table S1). Cell death was also assessed by ensuring that the HRT-18 monolayers remained intact and that no gaps were present. Except for those infected with EAEC 17.2, the monolayers remained intact during infection. With EAEC 17.2, small gaps appeared after 17 h of incubation, suggesting that cells had died and detached from the substrate and had been carried out of the channel by the flow of medium.
As observed with EHEC EDL933, the SEPEC 31A, EAEC 17.2, EPEC E2348/69, aEPEC ECL1001, and EHEC Sakai strains were able to attach to, and form microcolonies on, HRT-18 monolayers when confluence was less than 90% (data not shown). Again, none of the strains attached to the glass surface of the BioFlux plate, confirming that the attachment was specific for the HRT-18 monolayers. On the other hand, C. rodentium DS100 and UPEC CFT073 required the cell monolayer to be at 95% to 100% confluence for any attachment to be observable.
Evaluation of the effect of a deletion of the aidA gene, which encodes a protein involved in adhesion and biofilm formation.
One of the purposes of developing our application was to provide a high-throughput platform for the testing and screening of mutants. As a proof of concept, we selected an aidA deletion mutant of diffusely adherent E. coli (DAEC) strain 2787, because the autotransporter adhesin AIDA-I plays a role in biofilm formation, and deletion of aidA results in decreased cell adhesion (21). DAEC 2787 and DAEC 2787 ΔaidA were first tested in the microtiter plate assay. There was a significant decrease (P < 0.01) in biofilm formation by the ΔaidA strain (Fig. 7A). The parental strain is a weak biofilm former, and based on our biofilm threshold (A595, ≥0.110), the ΔaidA strain did not form a biofilm (Fig. 7A). The biofilm-forming ability of the ΔaidA strain was then assessed in our BioFlux biofilm assay. Again, there was a significant decrease (P < 0.01) in biofilm formation by the ΔaidA strain (Fig. 7B and Table 3). Although the ΔaidA strain remained attached to the glass surface and formed a thin layer of biofilm, the parental strain formed a stronger biofilm than the mutant, with a larger biomass (Fig. 7B and Table 3). This finding was further supported by image analysis, which indicated that the parental strain covered more surface and formed larger structures than the ΔaidA strain (Table 3). These results indicate that the parameters of our BioFlux biofilm assay can be used to screen biofilm mutants.
FIG 7.

Decreased biofilm formation and cell attachment by a DAEC ΔaidA strain. Biofilm formation by a DAEC ΔaidA mutant and its parental strain was evaluated in microtiter plates (A) or in the BioFlux system on an abiotic (B) or a biotic (C) surface. For microtiter plates, absorbance was measured at 590 nm, and results are averages for 3 independent biological replicates; error bars represent standard error. **, P < 0.01.
TABLE 3.
Quantification of biofilm formation and cell attachment by DAEC 2787 and DAEC 2787 ΔaidA using a microfluidic systema
| Assay and strain | No. of particles | Avg particle size (pixels)b | % of area covered | Biomass (μm3/μm2) | Height (μm) |
|---|---|---|---|---|---|
| Biofilm formation | |||||
| DAEC 2787 | 43 (±11) | 835.3 (±142.4) | 75 (±8) | 7.60 (±1.21) | 20 (±2) |
| DAEC 2787 ΔaidA | 617 (±97) | 6.4 (±1.3) | 9 (±3) | 2.49 (±0.89) | 24 (±3) |
| Cell attachment | |||||
| DAEC 2787 | 92 (±31) | 404.0 (±44.3) | 80 (±11) | 3.84 (±1.11) | 11 (±2) |
| DAEC 2787 ΔaidA | 288 (±77) | 29.1 (±13.3) | 18 (±5) | 0.59 (±0.18) | 23 (±4) |
Values are averages (standard errors) for 3 independent biological replicates.
Two pixels are approximately equivalent to 1 bacterial cell.
Both strains were then transformed with pmCherry, and these transformants were used in our BioFlux cell adhesion assay. In the presence of shear force, the parental strain remained attached and was able to grow and form a biofilm (Fig. 7C). The ΔaidA strain was able to remain attached to the monolayers, but it was able to form only small microcolonies (Fig. 7C). The biomass of the structure formed by the ΔaidA strain was significantly smaller (P < 0.01) than that of the parental strain (Table 3). Furthermore, the mutant formed smaller particles and covered less surface than the parental strain but formed taller clusters (Table 3). Again, these results indicate that the cell adhesion assay in the BioFlux system can be used to screen mutants that have decreased cell adhesion. Furthermore, there was no difference in cell death as assessed by trypan blue staining. A total of 39 (±14) cells infected with the parental strain and 45 (±5) cells infected with the ΔaidA strain were stained with trypan blue (see Table S1 in the supplemental material).
DISCUSSION
Biofilm formation and host-pathogen interactions are often studied in systems that do not incorporate physiologically relevant conditions, such as shear force created by the flow of bodily fluids. For example, shear force can range from 4 to 50 dynes/cm2 in blood vessels (22) and from 4 to 35 dynes/cm2 in the intestinal epithelium during peristalsis (23), while it can be less than 1 dyne/cm2 in utero (24) and between the brush border microvilli of epithelial cells (25). Furthermore, it is very difficult to culture eukaryotic cells in the presence of bacteria for the extended periods that would allow biofilm formation. Microfluidic systems could provide a means to overcome the limitations of commonly used models. The BioFlux device was developed to provide models that resemble in vivo conditions and allows for the formation of biofilms on both biotic and abiotic surfaces in the presence of shear force. Using pathogenic E. coli strains as model bacteria and the human colorectal adenocarcinoma cell line HRT-18, we demonstrate that the BioFlux 200 system can be used to study biofilm formation on biotic and abiotic surfaces in the presence of shear force. Furthermore, our model allows host-pathogen interactions to be studied over long periods without significant cell death.
Interestingly, pathogenic E. coli strains did not form biofilms on the glass surface of the BioFlux plate when cell line growth conditions were used (37°C in RPMI medium); they required the presence of an HRT-18 monolayer to form biofilm-like structures. However, pathogenic E. coli strains were able to form biofilms on a glass surface at a lower temperature (30°C) and in minimal medium (M9 medium with glucose). These differences could provide a good basis for investigating factors associated with biofilms under environmental conditions (e.g., on the surfaces found in food-processing plants) or in the context of host-pathogen interactions (by use of cell monolayers). Furthermore, we demonstrated that our model could distinguish between a parental strain that formed strong biofilms and an isogenic mutant that failed to form an extensive biofilm on either a biotic or an abiotic surface. This would permit the use of the high-throughput capability of the system to screen for mutants so as to identify novel factors involved in host-pathogen interactions.
In addition to screening mutants so as to identify new factors, our model could be used to revisit mutants of known virulence factors. For example, EPEC E2348/69 formed strong biofilms, whereas aEPEC ECL1001 formed weak biofilms. One of the major differences between EPEC and aEPEC is the absence of the bundle-forming pili (BFP) in aEPEC (26). BFP are located on the large EPEC adherence factor (EAF) plasmid, and this plasmid and the BFP have been associated with increased efficiency of attaching and effacing (A/E) lesions (27). Furthermore, BFP have been associated with biofilm formation on abiotic surfaces by the EPEC reference strain in the absence or presence of shear force (26). Therefore, it would be interesting to investigate the role of BFP during attachment and biofilm formation on HRT-18 monolayers using our model. Other fimbriae of interest would be the aggregative adherence fimbriae (AAF) of EAEC. AAF have been implicated in biofilm formation (28), and biofilm formation by EAEC 17.2 in the BioFlux device was enhanced over that in the microtiter plate assay. Shear force has been shown to enhance binding by the type 1 fimbriae of certain E. coli strains (29), and it would interesting to see if this is also the case for AAF.
Like EPEC and aEPEC, EHEC and C. rodentium are pathogens that cause A/E lesions (14, 30). These are associated with a type III secretion system (T3SS) that secretes the bacterial receptor Tir into the host cells and allows intimate attachment of the bacteria via the adhesin intimin (14). Therefore, future investigations could focus on the role of intimate attachment during the formation of biofilms on HRT-18 monolayers under shear force. Furthermore, the expression and injection of effectors could potentially be monitored in real time to further assess the role of the T3SS during attachment and infection.
Our model is also a potential tool for screening compounds and probiotic bacteria that effectively inhibit biofilm formation by pathogenic E. coli on mammalian cells. Furthermore, cell lines of diverse origins (different organs or different animal species) could be grown in our model. We were able to grow the SJPL cell line, which is of monkey origin, and the HEp-2 cell line, which is derived from human larynx carcinoma, as monolayers using conditions similar to those described for HRT-18 cells (data not shown). However, not every cell line grew consistently well in the BioFlux plate (HEp-2 cells), and EHEC strains demonstrated a certain specificity toward human cells; they were not able to attach to, or remain on, SJPL cells in the presence of shear force.
In conclusion, we established the conditions required to grow biofilms of different E. coli pathotypes on HRT-18 monolayers in the BioFlux system. Furthermore, we developed a BioFlux protocol (Fig. 1) that allows for the development of microcolonies or biofilms by pathogenic E. coli on HRT-18 monolayers in the presence of shear force. This new tool will likely help investigators study the interactions of pathogenic E. coli strains with their hosts in a model that could reflect certain in vivo conditions.
Supplementary Material
ACKNOWLEDGMENTS
This research was supported by a Team grant from the Fonds de Recherche du Québec, Nature et Technologies (FRQ-NT PT165375), to J.H. and M.J. and by discovery grants from the Natural Sciences and Engineering Research Council of Canada to J.H. and M.J. P.V. is also a recipient of a scholarship from the CRIPA (FRQNT Regroupements stratégiques 111946).
We thank Michael Mourez for generously providing the ΔaidA strain and Samantha Gruenheid for providing Citrobacter rodentium DBS100. Jenny-Lee Thomassin is also acknowledged for proofreading the manuscript.
Footnotes
Supplemental material for this article may be found at http://dx.doi.org/10.1128/AEM.04208-14.
REFERENCES
- 1.Jacques M, Aragon V, Tremblay YDN. 2010. Biofilm formation in bacterial pathogens of veterinary importance. Anim Health Res Rev 11:97–121. doi: 10.1017/S1466252310000149. [DOI] [PubMed] [Google Scholar]
- 2.Ceri H, Olson ME, Stremick C, Read RR, Morck D, Buret A. 1999. The Calgary Biofilm Device: new technology for rapid determination of antibiotic susceptibilities of bacterial biofilms. J Clin Microbiol 37:1771–1776. [DOI] [PMC free article] [PubMed] [Google Scholar]
- 3.McBain AJ. 2009. In vitro biofilm models: an overview. Adv Appl Microbiol 69:99–132. doi: 10.1016/S0065-2164(09)69004-3. [DOI] [PubMed] [Google Scholar]
- 4.Benoit MR, Conant CG, Ionescu-Zanetti C, Schwartz M, Matin A. 2010. New device for high-throughput viability screening of flow biofilms. Appl Environ Microbiol 76:4136–4142. doi: 10.1128/AEM.03065-09. [DOI] [PMC free article] [PubMed] [Google Scholar]
- 5.Kim KP, Kim YG, Choi CH, Kim HE, Lee SH, Chang WS, Lee CS. 2010. In situ monitoring of antibiotic susceptibility of bacterial biofilms in a microfluidic device. Lab Chip 10:3296–3299. doi: 10.1039/c0lc00154f. [DOI] [PubMed] [Google Scholar]
- 6.Kim J, Hegde M, Kim SH, Wood TK, Jayaraman A. 2012. A microfluidic device for high throughput bacterial biofilm studies. Lab Chip 12:1157–1163. doi: 10.1039/c2lc20800h. [DOI] [PubMed] [Google Scholar]
- 7.Lee JH, Kaplan JB, Lee WY. 2008. Microfluidic devices for studying growth and detachment of Staphylococcus epidermidis biofilms. Biomed Microdevices 10:489–498. doi: 10.1007/s10544-007-9157-0. [DOI] [PubMed] [Google Scholar]
- 8.Nance WC, Dowd SE, Samarian D, Chludzinski J, Delli J, Battista J, Rickard AH. 2013. A high-throughput microfluidic dental plaque biofilm system to visualize and quantify the effect of antimicrobials. J Antimicrob Chemother 68:2550–2560. doi: 10.1093/jac/dkt211. [DOI] [PMC free article] [PubMed] [Google Scholar]
- 9.Moormeier DE, Endres JL, Mann EE, Sadykov MR, Horswill AR, Rice KC, Fey PD, Bayles KW. 2013. Use of microfluidic technology to analyze gene expression during Staphylococcus aureus biofilm formation reveals distinct physiological niches. Appl Environ Microbiol 79:3413–3424. doi: 10.1128/AEM.00395-13. [DOI] [PMC free article] [PubMed] [Google Scholar]
- 10.Soyer M, Duménil G. 2011. Introducing shear stress in the study of bacterial adhesion. J Vis Exp 55:e3241. doi: 10.3791/3241. [DOI] [PMC free article] [PubMed] [Google Scholar]
- 11.Kim J, Hegde M, Jayaraman A. 2010. Co-culture of epithelial cells and bacteria for investigating host-pathogen interactions. Lab Chip 10:43–50. doi: 10.1039/b911367c. [DOI] [PubMed] [Google Scholar]
- 12.Kim J, Hegde M, Jayaraman A. 2010. Microfluidic co-culture of epithelial cells and bacteria for investigating soluble signal-mediated interactions. J Vis Exp 38:1749. doi: 10.3791/1749. [DOI] [PMC free article] [PubMed] [Google Scholar]
- 13.Soyer M, Duménil G. 2012. A laminar-flow chamber assay for measuring bacterial adhesion under shear stress. Methods Mol Biol 799:185–195. doi: 10.1007/978-1-61779-346-2_12. [DOI] [PubMed] [Google Scholar]
- 14.Croxen MA, Finlay BB. 2010. Molecular mechanisms of Escherichia coli pathogenicity. Nat Rev Microbiol 8:26–38. doi: 10.1038/nrmicro2265. [DOI] [PubMed] [Google Scholar]
- 15.Sambrook J, Fritsch EF, Maniatis T. 1989. Molecular cloning: a laboratory manual, 2nd ed Cold Spring Harbor Laboratory Press, Cold Spring Harbor, NY. [Google Scholar]
- 16.Wu C, Labrie J, Tremblay YDN, Haine D, Mourez M, Jacques M. 2013. Zinc as an agent for the prevention of biofilm formation by pathogenic bacteria. J Appl Microbiol 115:30–40. doi: 10.1111/jam.12197. [DOI] [PubMed] [Google Scholar]
- 17.Tremblay YDN, Lamarche D, Chever P, Haine D, Messier S, Jacques M. 2013. Characterization of the ability of coagulase-negative staphylococci isolated from the milk of Canadian farms to form biofilms. J Dairy Sci 96:234–246. doi: 10.3168/jds.2012-5795. [DOI] [PubMed] [Google Scholar]
- 18.Silversides DW, Music N, Jacques M, Gagnon CA, Webby R. 2010. Investigation of the species origin of the St. Jude porcine lung epithelial cell line (SJPL) made available to researchers. J Virol 84:5454–5455. doi: 10.1128/JVI.00042-10. [DOI] [PMC free article] [PubMed] [Google Scholar]
- 19.Tremblay YDN, Deslandes V, Jacques M. 2013. Actinobacillus pleuropneumoniae genes expression in biofilms cultured under static conditions and in a drip-flow apparatus. BMC Genomics 14:364. doi: 10.1186/1471-2164-14-364. [DOI] [PMC free article] [PubMed] [Google Scholar]
- 20.Kaya T, Koser H. 2012. Direct upstream motility in Escherichia coli. Biophys J 102:1514–1523. doi: 10.1016/j.bpj.2012.03.001. [DOI] [PMC free article] [PubMed] [Google Scholar]
- 21.Charbonneau ME, Mourez M. 2007. Functional organization of the autotransporter adhesin involved in diffuse adherence. J Bacteriol 189:9020–9029. doi: 10.1128/JB.01238-07. [DOI] [PMC free article] [PubMed] [Google Scholar]
- 22.Davies PF. 1995. Flow-mediated endothelial mechanotransduction. Physiol Rev 75:519–560. [DOI] [PMC free article] [PubMed] [Google Scholar]
- 23.Jeffrey B, Udaykumar HS, Schulze KS. 2003. Flow fields generated by peristaltic reflex in isolated guinea pig ileum: impact of contraction depth and shoulders. Am J Physiol Gastrointest Liver Physiol 285:G907–G918. doi: 10.1152/ajpgi.00062.2003. [DOI] [PubMed] [Google Scholar]
- 24.Stock UA, Vacanti JP. 2001. Cardiovascular physiology during fetal development and implications for tissue engineering. Tissue Eng 7:1–7. doi: 10.1089/107632701300003241. [DOI] [PubMed] [Google Scholar]
- 25.Guo P, Weinstein AM, Weinbaum S. 2000. A hydrodynamic mechanosensory hypothesis for brush border microvilli. Am J Physiol Renal Physiol 279:F698–F712. [DOI] [PubMed] [Google Scholar]
- 26.Trabulsi LR, Keller R, Tardelli Gomes TA. 2002. Typical and atypical enteropathogenic Escherichia coli. Emerg Infect Dis 8:508–513. doi: 10.3201/eid0805.010385. [DOI] [PMC free article] [PubMed] [Google Scholar]
- 27.Moreira CG, Palmer K, Whiteley M, Sircili MP, Trabulsi LR, Castro AF, Sperandio V. 2006. Bundle-forming pili and EspA are involved in biofilm formation by enteropathogenic Escherichia coli. J Bacteriol 188:3952–3961. doi: 10.1128/JB.00177-06. [DOI] [PMC free article] [PubMed] [Google Scholar]
- 28.Sheikh J, Hicks S, Dall'Agnol M, Phillips AD, Nataro JP. 2001. Roles for Fis and YafK in biofilm formation by enteroaggregative Escherichia coli. Mol Microbiol 41:983–997. doi: 10.1046/j.1365-2958.2001.02512.x. [DOI] [PubMed] [Google Scholar]
- 29.Thomas WE, Trintchina E, Forero M, Vogel V, Sokurenko EV. 2002. Bacterial adhesion to target cells enhanced by shear force. Cell 109:913–923. doi: 10.1016/S0092-8674(02)00796-1. [DOI] [PubMed] [Google Scholar]
- 30.Mundy R, Girard F, FitzGerald AJ, Frankel G. 2006. Comparison of colonization dynamics and pathology of mice infected with enteropathogenic Escherichia coli, enterohaemorrhagic E. coli and Citrobacter rodentium. FEMS Microbiol Lett 265:126–132. doi: 10.1111/j.1574-6968.2006.00481.x. [DOI] [PubMed] [Google Scholar]
- 31.Blattner FR, Plunkett G III, Bloch CA, Perna NT, Burland V, Riley M, Collado-Vides J, Glasner JD, Rode CK, Mayhew GF, Gregor J, Davis NW, Kirkpatrick HA, Goeden MA, Rose DJ, Mau B, Shao Y. 1997. The complete genome sequence of Escherichia coli K-12. Science 277:1453–1462. doi: 10.1126/science.277.5331.1453. [DOI] [PubMed] [Google Scholar]
- 32.Darfeuille-Michaud A, Boudeau J, Bulois P, Neut C, Glasser AL, Barnich N, Bringer MA, Swidsinski A, Beaugerie L, Colombel JF. 2004. High prevalence of adherent-invasive Escherichia coli associated with ileal mucosa in Crohn's disease. Gastroenterology 127:412–421. doi: 10.1053/j.gastro.2004.04.061. [DOI] [PubMed] [Google Scholar]
- 33.Perna NT, Plunkett G III, Burland V, Mau B, Glasner JD, Rose DJ, Mayhew GF, Evans PS, Gregor J, Kirkpatrick HA, Pósfai G, Hackett J, Klink S, Boutin A, Shao Y, Miller L, Grotbeck EJ, Davis NW, Lim A, Dimalanta ET, Potamousis KD, Apodaca J, Anantharaman TS, Lin J, Yen G, Schwartz DC, Welch RA, Blattner FR. 2001. Genome sequence of enterohaemorrhagic Escherichia coli O157:H7. Nature 409:529–533. doi: 10.1038/35054089. [DOI] [PubMed] [Google Scholar]
- 34.Hayashi T, Makino K, Ohnishi M, Kurokawa K, Ishii K, Yokoyama K, Han CG, Ohtsubo E, Nakayama K, Murata T, Tanaka M, Tobe T, Iida T, Takami H, Honda T, Sasakawa C, Ogasawara N, Yasunaga T, Kuhara S, Shiba T, Hattori M, Shinagawa H. 2001. Complete genome sequence of enterohemorrhagic Escherichia coli O157:H7 and genomic comparison with a laboratory strain K-12. DNA Res 8:11–22. doi: 10.1093/dnares/8.1.11. [DOI] [PubMed] [Google Scholar]
- 35.Elliott SJ, Wainwright LA, McDaniel TK, Jarvis KG, Deng YK, Lai LC, McNamara BP, Donnenberg MS, Kaper JB. 1998. The complete sequence of the locus of enterocyte effacement (LEE) from enteropathogenic Escherichia coli E2348/69. Mol Microbiol 28:1–4. [DOI] [PubMed] [Google Scholar]
- 36.Zhu C, Harel J, Jacques M, Desautels C, Donnenberg MS, Beaudry M, Fairbrother JM. 1994. Virulence properties and attaching-effacing activity of Escherichia coli O45 from swine postweaning diarrhea. Infect Immun 62:4153–4159. [DOI] [PMC free article] [PubMed] [Google Scholar]
- 37.Benz I, Schmidt MA. 1992. AIDA-I, the adhesin involved in diffuse adherence of the diarrhoeagenic Escherichia coli strain 2787 (O126:H27), is synthesized via a precursor molecule. Mol Microbiol 6:1539–1546. doi: 10.1111/j.1365-2958.1992.tb00875.x. [DOI] [PubMed] [Google Scholar]
- 38.Charbonneau MÈ, Côté JP, Haurat MF, Reiz B, Crépin S, Berthiaume F, Dozois CM, Feldman MF, Mourez M. 2012. A structural motif is the recognition site for a new family of bacterial protein O-glycosyltransferases. Mol Microbiol 83:894–907. doi: 10.1111/j.1365-2958.2012.07973.x. [DOI] [PubMed] [Google Scholar]
- 39.Rich C, Favre-Bonte S, Sapena F, Joly B, Forestier C. 1999. Characterization of enteroaggregative Escherichia coli isolates. FEMS Microbiol Lett 173:55–61. doi: 10.1111/j.1574-6968.1999.tb13484.x. [DOI] [PubMed] [Google Scholar]
- 40.Schauer DB, Falkow S. 1993. Attaching and effacing locus of a Citrobacter freundii biotype that causes transmissible murine colonic hyperplasia. Infect Immun 61:2486–2492. [DOI] [PMC free article] [PubMed] [Google Scholar]
- 41.Bertin Y, Martin C, Girardeau JP, Pohl P, Contrepois M. 1998. Association of genes encoding P fimbriae, CS31A antigen and EAST 1 toxin among CNF1-producing Escherichia coli strains from cattle with septicemia and diarrhea. FEMS Microbiol Lett 162:235–239. doi: 10.1111/j.1574-6968.1998.tb13004.x. [DOI] [PubMed] [Google Scholar]
- 42.Welch RA, Burland V, Plunkett G III, Redford P, Roesch P, Rasko D, Buckles EL, Liou SR, Boutin A, Hackett J, Stroud D, Mayhew GF, Rose DJ, Zhou S, Schwartz DC, Perna NT, Mobley HL, Donnenberg MS, Blattner FR. 2002. Extensive mosaic structure revealed by the complete genome sequence of uropathogenic Escherichia coli. Proc Natl Acad Sci U S A 99:17020–17024. doi: 10.1073/pnas.252529799. [DOI] [PMC free article] [PubMed] [Google Scholar]
- 43.Blum G, Falbo V, Caprioli A, Hacker J. 1995. Gene clusters encoding the cytotoxic necrotizing factor type 1, Prs-fimbriae and alpha-hemolysin form the pathogenicity island II of the uropathogenic Escherichia coli strain J96. FEMS Microbiol Lett 126:189–195. doi: 10.1111/j.1574-6968.1995.tb07415.x. [DOI] [PubMed] [Google Scholar]
- 44.Stapleton A, Moseley S, Stamm WE. 1991. Urovirulence determinants in Escherichia coli isolates causing first-episode and recurrent cystitis in women. J Infect Dis 163:773–779. doi: 10.1093/infdis/163.4.773. [DOI] [PubMed] [Google Scholar]
- 45.Hacker J, Knapp S, Goebel W. 1983. Spontaneous deletions and flanking regions of the chromosomally inherited hemolysin determinant of an Escherichia coli O6 strain. J Bacteriol 154:1145–1152. [DOI] [PMC free article] [PubMed] [Google Scholar]
- 46.Provence DL, Curtiss R III. 1992. Role of crl in avian pathogenic Escherichia coli: a knockout mutation of crl does not affect hemagglutination activity, fibronectin binding, or curli production. Infect Immun 60:4460–4467. [DOI] [PMC free article] [PubMed] [Google Scholar]
Associated Data
This section collects any data citations, data availability statements, or supplementary materials included in this article.