

Summary
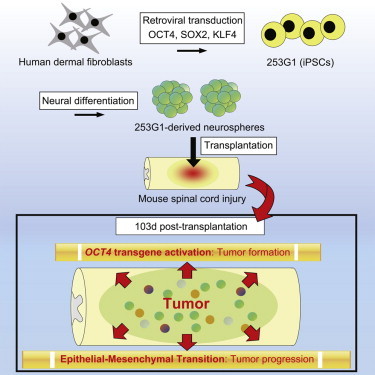
Previously, we described the safety and therapeutic potential of neurospheres (NSs) derived from a human induced pluripotent stem cell (iPSC) clone, 201B7, in a spinal cord injury (SCI) mouse model. However, several safety issues concerning iPSC-based cell therapy remain unresolved. Here, we investigated another iPSC clone, 253G1, that we established by transducing OCT4, SOX2, and KLF4 into adult human dermal fibroblasts collected from the same donor who provided the 201B7 clone. The grafted 253G1-NSs survived, differentiated into three neural lineages, and promoted functional recovery accompanied by stimulated synapse formation 47 days after transplantation. However, long-term observation (for up to 103 days) revealed deteriorated motor function accompanied by tumor formation. The tumors consisted of Nestin+ undifferentiated neural cells and exhibited activation of the OCT4 transgene. Transcriptome analysis revealed that a heightened mesenchymal transition may have contributed to the progression of tumors derived from grafted cells.
Graphical Abstract
Highlights
-
•
Grafted iPSC (253G1)-derived neurospheres formed tumors after long-term observation
-
•
Activation of the OCT4 transgene is potentially related to tumor formation
-
•
Tumor progression may have been caused by mesenchymal transition of grafted cells
-
•
Integration-free iPSCs should be chosen to avoid transgene-induced tumorigenesis
Previously, Okano and colleagues reported the therapeutic potential of induced pluripotent stem cell (iPSC)-derived neurospheres for spinal cord injury. However, safety issues concerning iPSC-based therapy remain unresolved. In this article, they show that grafted human iPSC (253G1)-derived neurospheres formed undifferentiated neural tumors after long-term observation. The tumors exhibited activation of the OCT4 transgene and a heightened mesenchymal transition. Integration-free iPSCs should be chosen to avoid transgene-induced tumorigenesis.
Introduction
Advances in stem-cell-based therapies may help overcome CNS disorders such as spinal cord injury (SCI). Transplantation of neural stem/progenitor cells (NS/PCs) has yielded beneficial effects and improved functional recovery in SCI animal models (Cummings et al., 2005; Hofstetter et al., 2005; Iwanami et al., 2005; Ogawa et al., 2002; Okada et al., 2005; Salazar et al., 2010; Yasuda et al., 2011). Pluripotent stem cells (PSCs), including embryonic stem cells (ESCs) and induced PSCs (iPSCs), can differentiate into NS/PCs (Falk et al., 2012; Fujimoto et al., 2012a; Kumagai et al., 2009; Miura et al., 2009; Nori et al., 2011; Okada et al., 2004, 2008; Tsuji et al., 2010), oligodendrocyte precursor cells (OPCs) (Keirstead et al., 2005; Wang et al., 2013), and motoneuron progenitors (Erceg et al., 2010; Lukovic et al., 2014) in vitro. Previous studies demonstrated the therapeutic potential of mouse and human iPSC-derived NS/PCs for SCI in mice and non-human primates (Fujimoto et al., 2012b; Kobayashi et al., 2012; Nori et al., 2011; Tsuji et al., 2010). However, tumorigenicity remains a major concern for clinical applications of iPSCs.
Previously, we reported the safety and therapeutic potential of human iPSC-derived neurospheres (iPSC-NSs) for SCI in non-obese diabetic–severe combined immunodeficient (NOD-SCID) mice (Nori et al., 2011) using the iPSC clone 201B7 (Nori et al., 2011; Takahashi et al., 2007). Here, we aimed to characterize novel NS/PCs derived from a different iPSC clone, 253G1. We established this clone from the same adult human dermal fibroblasts used for 201B7 by transducing three reprogramming factors: OCT4, SOX2, and KLF4 (Nakagawa et al., 2008). Grafted 253G1-derived neurospheres (253G1-NSs) survived and differentiated into three neural lineages in the injured spinal cord, and some of the resultant cells formed synapses with host neurons. Motor function in grafted mice initially recovered but then gradually declined, and tumors emerged during long-term observation. These tumors consisted of undifferentiated Nestin+ cells, but not NANOG+ pluripotent cells. Late-onset activation of the OCT4 transgene (Tg) may be associated with tumor formation. Transcriptome analysis revealed altered expression of genes involved in the epithelial-mesenchymal transition (EMT), which is related to tumor invasion and progression. Moreover, canonical pathway analysis revealed upregulation of the Wnt/β-catenin signaling pathway after 253G1-NS transplantation, which played a critical role in tumor development. Thus, although 253G1-NSs conferred temporary functional recovery in mice with SCI, they later developed into tumors and worsened the overall outcome.
Results
Grafted 253G1-NSs Survive in Injured Spinal Cord and Differentiate into Three Neural Lineages
Immunodeficient (NOD-SCID) mice were used for xenograft experiments. After laminectomy, contusive SCI was induced at the Th10 level. Nine days after injury, 5 × 10⁵ 253G1-NS-derived cells, which were lentivirally transduced with the fluorescent protein Venus (an altered yellow fluorescent protein; Nagai et al., 2002) or ffLuc (Venus fused to firefly luciferase; Hara-Miyauchi et al., 2012), were injected into the lesion epicenter. Histological analyses were performed 47 days (d) after transplantation. The grafted 253G1-NSs survived, migrated into the host spinal cord (Figures 1A and 1B), and differentiated into neuronal nuclei (NeuN)+ (17.2% ± 2.6%) and β-tubulin isotype III (βIII tubulin)+ (42.2% ± 3.1%) neurons, glial fibrillary acidic protein (GFAP)+ astrocytes (15.0% ± 0.7%), and adenomatous polyposis coli CC-1 (APC)+ oligodendrocytes (2.7% ± 0.3%; Figures 1C–1G). Quantitative analysis revealed that 67% of NeuN+ mature neurons were GAD67+ GABAergic neurons (Figure 1H). Small numbers of grafted cells differentiated into tyrosine hydroxylase (TH)+ and choline acetyltransferase (ChAT)+ cholinergic neurons (Figures 1I and 1J).
Figure 1.

Grafted 253G1-NSs Mainly Differentiate into Neurons and Form Synapses with Host Spinal Cord Neurons
(A and B) Venus+ 253G1-NSs integrated into the mouse spinal cord. Arrowheads indicate the lesion epicenter.
(C–F) Representative images of Venus+ grafted cells immunostained for the markers NeuN (mature neurons) (C), βIII tubulin (all neurons) (D), GFAP (astrocytes) (E), and APC (oligodendrocytes) (F).
(G) Percentages of cell-type-specific marker-positive cells among Venus+ grafted cells at 47 days post-transplantation. Values are expressed as the mean ± SEM (n = 4 mice).
(H) Most 253G1-derived neurons differentiated into GAD67+ (GABAergic) neurons.
(I and J) TH+/HNu+ neurons and ChAT+/HNu+ neurons were observed, but were rare.
(K) Sections were triple stained for HNu (green), βIII tubulin (red), and the presynaptic marker Bassoon (Bsn, white). The Bsn antibody recognized the mouse, but not the human, protein.
(L) Sections triple stained for HNu (green), βIII tubulin (red), and the human-specific presynaptic marker hSyn (white). βIII tubulin+/HNu− neurons represented host mouse neurons. The hSyn antibody recognized the human, but not the mouse, protein.
(M) Large numbers of somatic and dendritic terminals from graft-derived nerve cells were present on host ChAT+ motor neurons at the ventral horns.
(N) Electron microscopy (EM) images show synapse formation between host mouse neurons and graft-derived Venus+ (black) human neurons. Pre- and post-synaptic structures indicate transmission from a graft-derived neuron to a host neuron, and from a host neuron to a graft-derived neuron. H, host neuron; G, graft-derived neuron; arrowheads, post-synaptic density.
(O) Motor function in the hind limbs was assessed weekly using the BMS score until 47 days post-transplantation. Values are expressed as the mean ± SEM (n = 32 mice).
(P) Rotarod test 47 days after transplantation. Graph shows total run time. Values are expressed as the means ± SEM (n = 10 mice).
(Q) Treadmill gait analysis using the DigiGait system 47 days post-transplantation. Graph shows stride length. Values are expressed as the means ± SEM (n = 19 mice). Behavioral analyses were performed by two observers who were blinded to the treatment conditions.
Scale bars, 1,000 μm in (A); 100 μm in (B); 50 μm in (J-1); 20 μm in (F-3), (F-4), (H-1), (J-2), (K-1), (L-1), and (M-1); 10 μm in (H-2), (J-3), (K-2), (L-2), and (M-2); 0.5 μm in (N). See also Figure S1.
Grafted 253G1-NS-Derived Neurons Form Synaptic Connections with Host Neurons
We performed triple immunostaining for human nuclear protein (HNu) and two neuronal markers, βIII tubulin and the presynaptic protein Bassoon (Bsn). Because the anti-Bsn antibody selectively recognized the mouse and rat epitopes, but not the human epitopes (Figure S1), we were able to evaluate the ability of 253G1-NS-derived neurons to integrate with the host neural circuitry using this approach. Grafted βIII tubulin+/HNu+ cells in parenchymal locations were contacted by synaptic boutons of host neurons (Figure 1K). Moreover, triple immunostaining for HNu, βIII tubulin, and human-specific synaptophysin (hSyn) revealed dense terminal fields of human-derived boutons apposed to host neurons (Figure 1L). Host ChAT+ neurons in the ventral gray matter were contacted by the hSyn+ graft-specific terminals (Figure 1M). Immuno-electron microscopy also revealed Venus+ human pre- and post-synaptic structures, as well as synapse formation between host neurons and Venus+ 253G1-NS-derived neurons (Figure 1N).
Grafted 253G1-NSs Promote Motor Function Recovery after SCI
We assessed motor function recovery using the Basso mouse scale (BMS) score, Rotarod test, and DigiGait system. According to the BMS score, the 253G1-NS-grafted group exhibited significantly better functional recovery than the PBS-injected control group ≥12 days after transplantation (BMS score = 3.2 ± 0.1 at 12 days post-transplantation and 3.3 ± 0.2 at 47 days post-transplantation; Nori et al., 2011; Figure 1O). In the Rotarod test, 253G1-NS-grafted mice remained on the rod significantly longer (61.1 ± 7.1 s) than the control group (33.0 ± 7.3 s; Nori et al., 2011) at 47 days post-transplantation (Figure 1P). Gait performance was evaluated using the DigiGait image analysis system. All 253G1-NS-grafted mice could walk on the treadmill at 8 cm/s, whereas some control mice (4/16) could not. Stride length was significantly longer in the 253G1-NS-grafted group (4.2 ± 0.1 cm) than in the control group (2.2 ± 0.1 cm; Nori et al., 2011; Figure 1Q).
Tumors Form after 253G1-NS Transplantation, Resulting in Deteriorated Motor Function
We extended the follow-up period to 103 days post-transplantation to investigate the long-term safety of the grafted 253G1-NSs. Although recovery of motor function persisted for up to 47 days post-transplantation, 253G1-NS-grafted mice exhibited gradual deterioration of hind limb motor function thereafter (Figure 2A). To monitor the survival and growth of the grafted cells in the mouse spinal cord, we lentivirally transduced 253G1-NSs with ffLuc, which allowed us to identify grafted cells by their bioluminescent luciferase signals and fluorescent Venus signals. The photon count of grafted 253G1-NSs decreased within the first week post-transplantation, but gradually increased at 14 days post-transplantation and thereafter, demonstrating the survival and growth of the grafted cells. Between 42 and 70 days post-transplantation, the photon counts sharply increased (Figures 2B and 2C), consistent with the deterioration of the BMS score shown in Figure 2A. At 103 days post-transplantation, the photon count of the grafted 253G1-NSs increased more than 10-fold from its initial value (Figure 2C).
Figure 2.
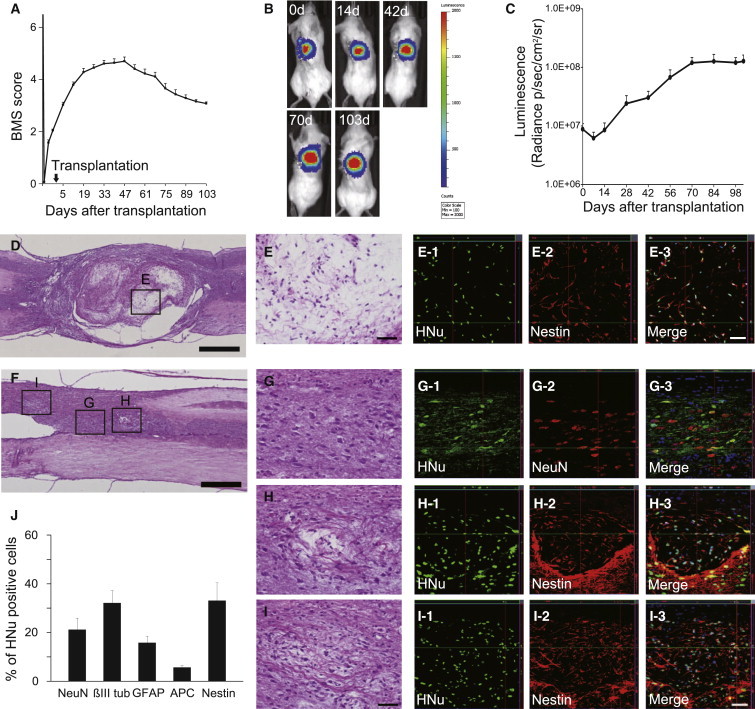
Tumor Formation during Long-Term Observation after 253G1-NS Transplantation
(A) Up to 103 days post-transplantation, motor function in the hind limbs was assessed weekly using the BMS score. Values are expressed as the means ± SEM (n = 32 mice up to 47 days post-transplantation; thereafter, n = 22 mice until 103 days post-transplantation).
(B) Representative in vivo images of mice at 0, 14, 42, 70, and 103 days after 253G1-NS transplantation.
(C) Quantitative analysis of photon counts derived from grafted cells. Values are expressed as the means ± SEM (n = 20 mice up to 42 days post-transplantation; thereafter, n = 14 mice until 103 days post-transplantation).
(D) Representative hematoxylin and eosin (H&E) image of a large tumor (700 μm < ϕ).
(E) Boxed area in (D).
(E1–E3) Immunohistochemistry showing that most grafted cells in the microcystic area were Nestin+.
(F) Representative H&E image of a medium tumor (200 < ϕ < 700 μm).
(G) Boxed area in (F). Immunohistochemistry shows that some grafted cells exhibited normal neural differentiation.
(H and I) Boxed area in (F). Some grafted cells formed microcystic masses that were positive for Nestin.
(J) Percentages of cell-type-specific, marker-positive cells among HNu+ grafted cells at 103 days post-transplantation. Values represent the means ± SEM (n = 4 and 10 mice for 47 and 103 days post-transplantation, respectively). ∗p < 0.05, ∗∗p < 0.01.
Scale bars, 500 μm in (D) and (F), 50 μm in (E) and (G–I). See also Figure S2.
Histological analyses revealed tumors in 253G1-NS-grafted spinal cords. These tumors were divided into three groups based on the diameter of the lesion (small-tumor group, ϕ < 200 μm; medium-tumor group, 200 < ϕ < 700 μm; large-tumor group, 700 μm < ϕ). Some of the tumors (12/22) exhibited microcystic masses consisting of HNu/Nestin double-positive human-derived bipolar cells with hair-like processes. These masses were observed in all tumors from the large-tumor group (7/7; Figures 2D and 2E show representative images of microcystic masses from the large-tumor group). Such masses were also present in the majority of the medium tumors (5/7), whereas none were found in the small-tumor group (0/8). In medium tumors that exhibited microcystic masses, some grafted cells underwent normal neural differentiation (Figures 2F and 2G). However, a portion of the grafted cells formed microcystic masses positive for Nestin (Figures 2H and 2I), and Nestin+ cells were also observed outside the microcystic mass. Significantly higher percentages of Nestin+ cells (34.2% ± 7.3%) and APC+ oligodendrocytes (5.4% ± 0.7%), as well as significantly lower percentages of βIII tubulin+ neurons (32.1% ± 5.1%), were observed at 103 days relative to 47 days (Figure 2J). In addition, 15.8% ± 2.7% of grafted cells had differentiated into astrocytes at 103 days. Taken together, these data indicate that approximately 87.5% of grafted cells differentiated toward neural lineages. We observed no NANOG+ pluripotent cells in grafted 253G1-NSs at 103 days post-transplantation (Figure S2).
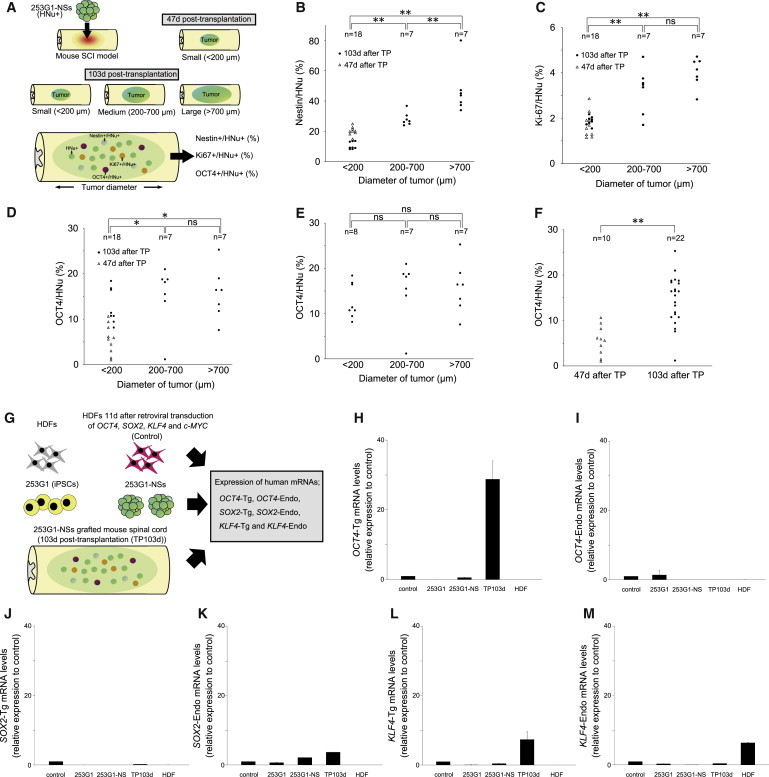
Next, we examined the correlation between tumor diameter and the percentages of Nestin+, Ki-67+, or OCT4+ cells among HNu+ grafted cells (Figure 3A). Statistical analysis revealed a significant correlation between tumor diameter and the percentage of Nestin+/HNu+ cells (Figure 3B). Compared with the small-tumor group, the large- and medium-tumor groups contained significantly higher percentages of Ki-67+/HNu+ cells and OCT4+/HNu+ cells (Figures 3C and 3D). However, there was no significant correlation between tumor diameter and the percentage of OCT4+/HNu+ cells at 103 days post-transplantation (Figure 3E). Meanwhile, significantly more OCT4+/HNu+ cells were observed at 103 days than at 47 days (Figure 3F); thus, the percentage of OCT4+/HNu+ cells correlated positively with post-transplant duration.
Figure 3.
Histological and Gene-Expression Analyses of Tumors
(A) Schematic of histological analyses of tumors.
(B) Correlation between tumor diameter and the proportion of grafted cells that were Nestin+ at 47 and 103 days post-transplantation (TP).
(C) Correlation between tumor diameter and the proportion of grafted cells that were Ki-67+.
(D) Correlation between tumor diameter and the proportion of grafted cells that were OCT4+.
(E) Correlation between the tumor diameter and the proportion of grafted cells that were OCT4+/HNu+ at 103 days after TP.
(F) Correlation between the number of days after TP (47 or 103 days after TP) and the proportion of grafted cells that were OCT4+. In (B)–(F), n indicates the number of mice.
(G) Schematic of mRNA expression analyses of tumors.
(H–M) The expression of human OCT4-Tg, OCT4-Endo, SOX2-Tg, SOX2-Endo, KLF4-Tg, KLF4-Endo, c-MYC-Tg, and c-MYC-Endo mRNA in 253G1 cells, 253G1-NSs, 103-day post-transplant 253G1-NSs (TP 103d), and adult human dermal fibroblasts (HDFs) was analyzed by RT-PCR. Data are presented as expression levels relative to the control (HDFs) 11 days after retroviral transduction of OCT4, SOX2, KLF4, and c-MYC. Values represent the means ± SEM (n = 3 independent experiments).
The p values shown in (B)–(F) were calculated using Scheffe’s test, and p values to determine significance were calculated using the Kruskal-Wallis non-parametric test: (B) 5.00E-06, (C) 7.20E-06, (D) 0.01, and (F) 1.33E-04. ∗p < 0.05, ∗∗p < 0.01. ns, non-significant.
We also evaluated the expression of human OCT4-Tg, OCT4-endogenous (Endo), SOX2-Tg, SOX2-Endo, KLF4-Tg, and KLF4-Endo mRNAs in 253G1 cells, 253G1-NSs, and spinal cord tissues of the 253G1-NS-grafted group, which were harvested at 103 days post-transplantation (253G1-NS/transplantation [TP]-103d group; Figures 3G–3M). Compared with 253G1-NSs, OCT4-Tg expression was significantly higher in 253G1-NS/TP-103d spinal cords (Figure 3H), whereas OCT4-Endo expression was only observed in the 253G1 iPSCs (Figure 3I). SOX2-Endo was expressed in both 253G1-NSs and the 253G1-NS/TP-103d group, and levels of SOX2-Endo slightly increased after transplantation (Figure 3K). KLF4-Tg expression was also elevated in 253G1-NSs and the 253G1-NS/TP-103d group (Figure 3L).
Transcriptomic Differences between 253G1-NSs and 201B7-NSs Post-Transplantation
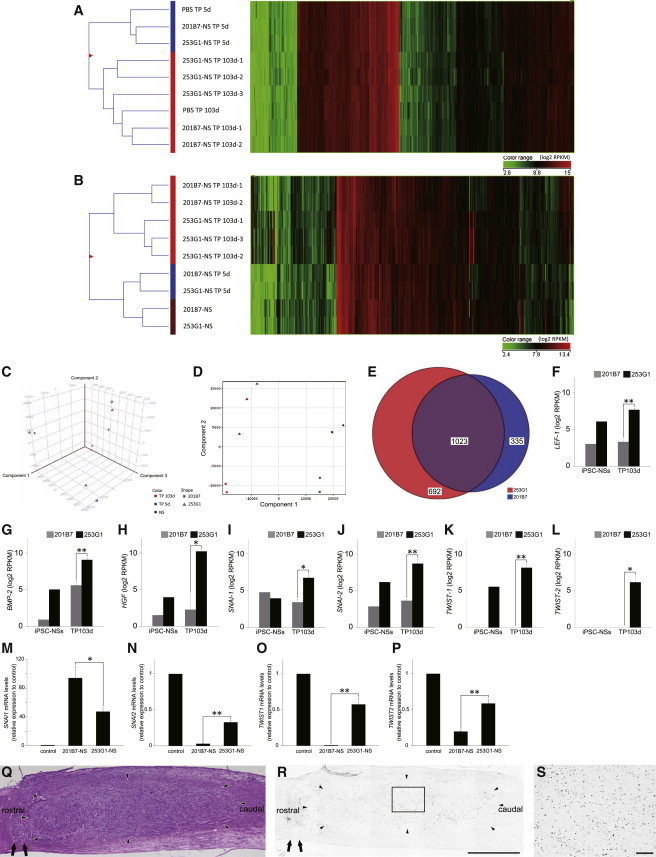
Comparative transcriptome analyses of grafted cells and surrounding host cells can reveal information regarding the differentiation status of the grafted cells and the effects of the graft on the host tissue. mRNA sequencing (mRNA-seq) enables one to analyze the global expression of individual human and mouse genes from a mixture of human and mouse cells (Bradford et al., 2013). Here, we sought to measure expression in mouse spinal cord tissue containing human cells derived from grafted human iPSC-NSs. To analyze mRNA expression in both grafted human iPSC-NSs and host spinal cord tissue, we analyzed the mRNA from NSs of 253G1 and 201B7 cells, as well as mouse spinal cord tissues containing grafted 253G1-NSs and 201B7-NSs, which were harvested at 5 and 103 days post-transplantation (PBS-5d and 103d, 253G1-NS/TP-5d and 103d, and 201B7-NS/TP-5d and 103d). The ratio of human and mouse mRNA-seq reads derived from epicenter segments (8 mm in length) of iPSC-NS-grafted spinal cord tissue was considered to reflect the ratio of human and mouse cells (Table S1). The global gene-expression patterns of these tissues were hierarchically clustered into 5-day (PBS-5d, 253G1-NS/TP-5d, and 201B7-NS/TP-5d) and 103-day groups (PBS-103d, 253G1-NS/TP-103d, and 201B7-NS/TP-103d), which may reflect time-dependent changes in the spinal cord microenvironment following SCI (Figure 4A). Similarly, the gene-expression profiles of the grafted iPSC-NSs clustered on the basis of time post-transplantation (NS, 5 and 103 days) rather than clonal (253G1 and 201B7) origin (Figure 4B). However, the profiles of the two clones diverged at 103 days post-transplantation. Furthermore, the gene-expression profiles of 253G1-NS/TP-103d and 201B7-NS/TP-103d differed significantly (Figures 4C and 4D).
Figure 4.
Global Human Gene-Expression Analysis
(A) Hierarchical clustering analysis of mouse gene-expression data from spinal cord tissues of the PBS-5d and -103d, 253G1-NS/TP-5d and -103d, and 201B7-NS/TP-5d and -103d groups.
(B) Hierarchical clustering analysis of human gene-expression data: 253G1-NSs and 201B7-NSs, as well as spinal cord tissues of the 253G1-NS/TP-5d and -103d, and 201B7-NS/TP-5d and -103d groups. In (A) and (B), the signal intensity of each gene is displayed as a heatmap colored according to the expression level.
(C) Principal-component analysis (PCA) of human gene-expression data. x axis, component 1 (41.03%); y axis, component 2 (24.21%); z axis, component 3 (13.88%).
(D) Two-dimensional PCA of human gene expression data. x axis, component 1 (41.03%); y axis, component 2 (24.21%).
(E) Venn diagram of human genes whose expression increased in the 253G1-NS/TP-103d and 201B7-NS/TP-103d groups relative to 253G1-NSs and 201B7-NSs. Color key: red, 692 genes highly expressed in the 253G1-NS/TP-103d group; blue, 335 genes highly expressed in the 201B7-NS/TP-103d group; purple, 1,023 genes highly expressed in both the 253G1- and 201B7-NS/TP-103d groups.
(F–L) EMT-related human gene expression in 253G1- and 201B7-NSs and the 253G1- and 201B7-NS/TP-103d groups. Values represent the means ± SEM (n = 1 each in the human iPSC-NS, n = 2 for 201B7-NS/TP-103d, and n = 3 for 253G1-NS/TP-103d; n indicates the number of independent experiments).
(M–P) The expression of SNAI1, SNAI2, TWIST1, and TWIST2 mRNA in 201B7-NSs and 253G1-NSs was analyzed by RT-PCR. Data are presented as expression levels relative to the control (the U87 human glioblastoma cell line). Values represent the means ± SEM (n = 3 independent experiments).
(Q) Representative H&E image of the mid-sagittal section 103 days after transplantation.
(R) p-STAT3-stained image of the adjacent section of (Q). Arrow, lesion epicenter; arrowhead, distribution of grafted 253G1-NSs.
(S) Boxed area in (R).
Scale bar, 1,000 μm in (Q) and (R), 100 μm in (S). ∗p < 0.05, ∗∗p < 0.01. See also the mRNA-seq read distribution in Table S1.
Next, we identified human genes that were upregulated in the mouse spinal cord at 103 days post-transplantation relative to iPSC-NSs before transplantation (fold change > 5.0). As shown in the Venn diagram in Figure 4E, we identified 692 genes in the 253G1-NS/TP-103d group, 335 genes in the 201B7-NS/TP-103d group, and 1,023 genes in both the 253G1-NS/TP-103d and 201B7-NS/TP-103d groups that were expressed at higher levels than in 253G1-NSs and 201B7-NSs. Gene Ontology (GO) analysis of the 335- and 1,023-gene groups indicated that synaptogenesis was occurring in both the 253G1- and 201B7-NS/TP-103d groups (Tables 1 and S2). GO analysis of the 692 genes that were exclusively activated in 253G1-derived cells at 103 days post-transplantation identified a number of mesenchyme-associated terms, including “mesenchymal cell differentiation,” “mesenchymal cell development,” and “epithelial to mesenchymal transition” (Table 2). These terms were also identified in a comparison of 253G1 and 201B7 NS cells, suggesting that 253G1-NS cells were more prone to undergo EMT (Table S3). Furthermore, the mRNA-seq data revealed that EMT-related genes such as LEF1, BMP2, HGF, SNAI1, SNAI2, TWIST1, and TWIST2 (as suggested by GO analysis and previous reports [Moody et al., 2005; Yang et al., 2004]) were significantly upregulated in the 253G1-NS/TP-103d group relative to the 201B7-NS/TP-103d group (Figures 4F–4L). We also evaluated the expression of SNAI1, SNAI2, TWIST1, and TWIST2 mRNAs in 201B7-NSs and 253G1-NSs prior to transplantation (Figures 4M–4P). Expression of SNAI2, TWIST1, and TWIST2 was significantly higher in 253G1-NSs than in 201B7-NSs (Figures 4N–4P), whereas SNAI1 expression was significantly lower in 253G1-NSs than in 201B7-NSs (Figure 4M). Furthermore, we evaluated the signal transducer and activator of transcription 3 (STAT3), extracellular-signal-regulated kinase (ERK) and v-akt murine thymoma viral oncogene (AKT) pathways, which are involved in tumor maintenance. Specifically, we performed immunohistochemical analyses to monitor the levels of tyrosine 705-phosphorylated STAT3 (p-STAT3), tyrosine 202/204-phosphorylated ERK1/2 (p-ERK1/2), and serine 473-phosphorylated AKT (p-AKT). We observed p-STAT3+ cells (Figures 4Q–4S), but no p-ERK1/2+ or p-AKT+ cells, in the 253G1-NS/TP-103d group.
Table 1.
Gene Ontology Analysis of 335 Human Genes Upregulated in 201B7-NS-Grafted Spinal Cord
| GO Accession | GO Term | Corrected p Value |
|---|---|---|
| GO:0045202 | synapse | 7.05E-08 |
| GO:0007399 | nervous system development | 3.56E-06 |
| GO:0007267 | cell-cell signaling | 7.69E-06 |
| GO:0019226 | transmission of nerve impulse | 4.68E-04 |
| GO:0043005 | neuron projection | 1.76E-03 |
| GO:0030182 | neuron differentiation | 1.26E-02 |
| GO:0007154 | cell communication | 1.26E-02 |
| GO:0048699 | generation of neurons | 1.40E-02 |
| GO:0022008 | neurogenesis | 1.91E-02 |
| GO:0050806 | positive regulation of synaptic transmission | 3.52E-02 |
| GO:0050804 | regulation of synaptic transmission | 4.19E-02 |
| GO:0007417 | central nervous system development | 4.80E-02 |
| GO:0051971 | positive regulation of transmission of nerve impulse | 4.80E-02 |
See also Table S2.
Table 2.
Gene Ontology Analysis of 692 Human Genes Upregulated in 253G1-NS-Grafted Spinal Cord
| GO Accession | GO Term | Corrected p Value |
|---|---|---|
| GO:0030198 | extracellular matrix organization and biogenesis | 2.29E-16 |
| GO:0001501 | skeletal development | 1.29E-14 |
| GO:0043062 | extracellular structure organization and biogenesis | 2.67E-13 |
| GO:0001568 | blood vessel development | 1.88E-12 |
| GO:0001944 | vasculature development | 3.51E-12 |
| GO:0030199 | collagen fibril organization | 5.50E-08 |
| GO:0014031 | mesenchymal cell development | 2.78E-07 |
| GO:0048762 | mesenchymal cell differentiation | 4.84E-07 |
| GO:0001525 | Angiogenesis | 2.81E-06 |
| GO:0048514 | blood vessel morphogenesis | 3.02E-06 |
| GO:0001503 | ossification | 1.74E-05 |
| GO:0031214 | biomineral formation | 1.89E-05 |
| GO:0014032 | neural crest cell development | 5.94E-04 |
| GO:0014033 | neural crest cell differentiation | 7.55E-04 |
| GO:0007517 | muscle development | 3.04E-03 |
| GO:0042127 | regulation of cell proliferation | 4.84E-03 |
| GO:0001837 | epithelial to mesenchymal transition | 2.02E-02 |
See also Table S3.
Ingenuity Pathway Analysis Revealed Pathways that Differed Significantly between 253G1-NS and 201B7-NS Transplantation
We used Ingenuity Pathway Analysis (IPA) to identify pathways differentially expressed between the 253G1-NS/TP-103d and 201B7-NS/TP-103d groups. IPA detected a total of 56 significantly altered (p < 0.05) pathways. Figure 5 shows the ten most altered pathways, all of which were significantly upregulated in the 253G1-NS/TP-103d group relative to iPSC-NSs prior to transplantation.
Figure 5.
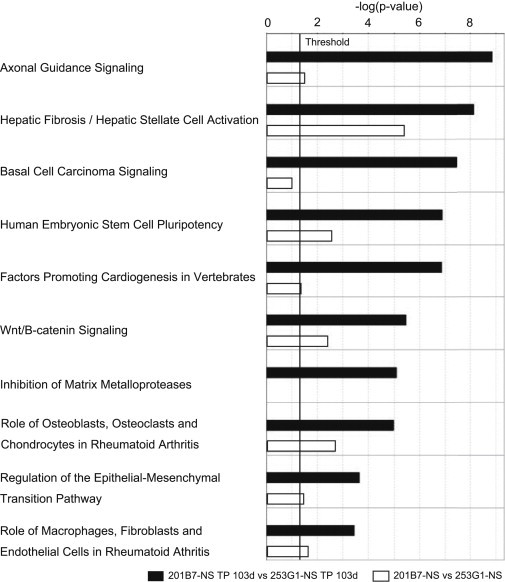
The Most Significantly Altered Common Pathways after Transplantation of 253G1- and 201B7-NSs, as Revealed by Ingenuity Pathway Analysis
Canonical pathway analysis identified the pathways from the Ingenuity Pathway Analysis library that were significantly enriched in the data set. Only genes that showed a fold change ≥ 3.0 were considered in this analysis. The black bars show the human gene set in the 253G1-NS/TP-103d group versus the 201B7-NS/TP-103d group. The white bars show the comparison of the human gene set in 253G1-NSs versus 201B7-NSs in the same pathway. Bars represent the logarithmic values (log10) of the significance level (p); the solid line corresponds to the threshold of p = 0.05.
Discussion
Because we generated the human iPSC clone 253G1 without introducing c-MYC, we initially speculated that 253G1-NSs would be less tumorigenic than 201B7-NSs. Therefore, we performed transplantation of 253G1-NSs to treat SCI in adult NOD-SCID mice. Like the 201B7-NSs, the grafted 253G1-NSs differentiated into three neural lineages, reconstructed local circuitry, and promoted angiogenesis as well as axonal regrowth (data not shown). Thus, 253G1-NS transplantation promoted motor function recovery after SCI in NOD-SCID mice.
When considering the clinical use of iPSC-NSs, it is important to address safety issues, especially with regard to tumorigenicity. To this end, we extended the observation period after transplantation. Previously, we reported that 201B7-NS-grafted mice maintained functional recovery until 103 days post-transplantation, and confirmed that 201B7-NSs were non-tumorigenic based on histological findings (Nori et al., 2011). Here, we found that 253G1-NS-grafted mice exhibited temporary motor function recovery for up to 47 days post-transplantation; however, this was followed by a gradual deterioration in motor function, along with grafted cell proliferation and tumor development. Bioluminescence imaging revealed that the photon count of the grafted cells increased more than 10-fold from the initial value by 103 days after transplantation. These tumors were negative for the pluripotency marker NANOG. Tumor size correlated with the proportion of Nestin+ cells in the graft at 103 days post-transplantation. Previously, we showed that after 201B7-NS transplantation, the proportion of grafted cells that were Nestin+ decreased from 10.7% ± 2.2% at 47 days to 7.5% ± 1.0% at 103 days post-transplantation, resulting in no evidence of tumorigenicity (Nori et al., 2011). By contrast, the proportion of Nestin+ cells increased from 19.6% ± 0.5% at 47 days to 33.1% ± 7.4% at 103 days after 253G1-NS transplantation, suggesting that differentiation-resistant Nestin+ cells proliferated over time and formed tumors. Consistent with this, the proportion of Ki-67+ cells significantly increased from 1.7% ± 0.17% at 47 days to 3.0% ± 0.2% at 103 days after 253G1-NS transplantation, which is significantly higher than what was observed after 201B7-NS transplantation. These findings suggest that the proportion of proliferating cells increased over time and induced tumor formation in 253G1-NS-grafted mice in the long term.
Tumor diameter exhibited no significant correlation with the proportion of OCT4+/HNu+ cells. Instead, the proportion of grafted cells that were OCT4+ was solely dependent on the post-transplantation observation period. In our previous study, we observed no evidence of OCT4+/HNu+ cells or tumor formation in 201B7-NS-grafted mice after long-term observation (Nori et al., 2011). It is likely that the chronologically increasing OCT4 expression in the grafted 253G1-NSs is related to tumor formation, consistent with the results of RT-PCR, which showed that the expression of OCT4-Tg at 103 days post-transplantation was significantly higher than that in untransplanted 253G1-NSs. OCT4 is a key regulator of self-renewal and plays a critical role in maintaining ESC pluripotency (Niwa, 2007). In addition, OCT4 is sometimes re-expressed in somatic cells during carcinogenesis (Monk and Holding, 2001). OCT4 is also highly expressed in human gliomas and glioma cell lines, and OCT4 overexpression in glioma cells induces Nestin expression by inhibiting glioma cell differentiation (Du et al., 2009; Ikushima et al., 2011). These findings are consistent with the results we describe here, even though the tumors observed in the present study were not pathologically identical to gliomas. We also observed that KLF4-Tg was activated in 253G1-NSs, and that its expression increased after transplantation. KLF4 is highly expressed in primary breast ductal carcinoma and oral squamous carcinoma (Foster et al., 2005; Pandya et al., 2004). Previous reports also showed that KLF4 overexpression promotes self-renewal in ESCs (Li et al., 2005), and KLF4 is an essential reprogramming factor that functions by binding at Oct4 loci to initiate Oct4 transcription and complete the reprogramming process (Wei et al., 2013). These results suggest that KLF4 plays an important role in maintaining PSCs, and that the tumor formation we observed could be related to KLF4-Tg activation.
In a previous study, the molecular properties of engrafted NS/PCs changed dramatically depending on the spinal cord microenvironment (Kumamaru et al., 2012). Here, we analyzed the changes in the microenvironment of mouse spinal cord tissues affected by iPSC-NS transplantation. We observed no significant differences in the mouse gene-expression profiles of spinal cord tissues among the 253G1-NS/TP, 201B7-NS/TP, and control groups, suggesting that mouse gene expression did not widely affect tumorigenesis in grafted iPSC-NSs. However, human gene-expression profiles from the 253G1- and 201B7-NS/TP groups differed in a time-dependent manner, which may have been related to tumor formation in the 253G1-NS/TP group. GO analysis revealed increased progression of EMT in the 253G1-NS and 253G1-NS/TP groups relative to the 201B7-NS and 201B7-NS/TP groups.
During EMT, epithelial cells lose their epithelial characteristics and acquire the properties of migratory mesenchymal cells. This process is associated with the early stages of carcinogenesis, cancer invasion, and recurrence (Hay, 1995; Thiery, 2002). Brain tumors, including some human gliomas, also contain stem-like cells with both neural and mesenchymal potential that are implicated in both tumor progression and invasiveness (Ricci-Vitiani et al., 2008). STAT3 is frequently overexpressed in cancers, including gliomas (Abou-Ghazal et al., 2008), and STAT3 phosphorylation leads to the transcriptional activation of genes involved in processes such as cell proliferation, apoptosis suppression, and angiogenesis (Bowman et al., 2001). Moreover, STAT3 regulates the EMT gene TWIST (Cheng et al., 2008), consistent with the more active EMT progression and elevated TWIST expression in the 253G1-NS/TP group observed in this study. Mesenchyme-like changes in 253G1-NSs following transplantation may contribute to the biological characteristics of tumor cells derived from parental 253G1-NSs.
IPA revealed upregulation of human ESC pluripotency pathways in post-transplantation 253G1-NSs. This phenomenon might be related to the population of differentiation-resistant Nestin+ cells that proliferated over time and formed tumors. Furthermore, the Wnt/β-catenin signaling pathway was significantly upregulated in the 253G1-NS/TP group. Previous studies showed that Wnt/β-catenin signaling is critical for regulating the self-renewal, proliferation, and differentiation of NS/PCs in the brain (Gong and Huang, 2012), and that this pathway leads to enhanced TERT expression in human cancers, resulting in the stabilization of telomeres, a hallmark of tumorigenesis (Hoffmeyer et al., 2012). In part, the tumorigenicity of 253G1-NSs could be related to upregulation of the Wnt/β-catenin signaling pathway. Moreover, consistent with GO analysis, regulation of the EMT pathway was significantly upregulated in the 253G1-NS/TP group relative to the 207B7-NS/TP group.
Recently, several clinical trials of stem-cell-based therapy for SCI using either human NS/PCs (Cummings et al., 2005; Salazar et al., 2010) or human ESC-derived OPCs (Strauss, 2010) have been initiated. Compared with these stem cells, iPSCs raise fewer ethical concerns in certain countries (Nori et al., 2011; Tsuji et al., 2010). On the other hand, the use of iPSC-derived cells risks tumorigenesis (Miura et al., 2009; Tsuji et al., 2010). The present study demonstrates that even unsafe iPSC-NSs can confer therapeutic benefits against SCI, at least in the short term. However, long-term observation is required to assess the safety of iPSC-NSs, because slow-growing tumors could cause motor function to deteriorate over longer periods of time. In the present study, we used retrovirally generated iPSCs (Nakagawa et al., 2008; Takahashi et al., 2007) and showed that activation of OCT4- and KLF4-Tg might be related to tumor formation. Thus, from a clinical-applications perspective, NS/PCs derived from integration-free iPSCs (Okita et al., 2008, 2011) should be chosen to avoid Tg-induced tumorigenesis. Recently, a pilot clinical study of integration-free iPSC-based therapy for age-related macular degeneration was approved following review by the Japanese government (Garber, 2013; Kamao et al., 2014). As a step toward clinical applications in the SCI field, we have already initiated integration-free iPSC-NS transplantation in the NOD-SCID mouse SCI model. At the same time, transplantation into immune-deficient animals, accompanied by subsequent long-term observation, should be used to determine the safety and effectiveness of these cells (Okano et al., 2013).
Experimental Procedures
Additional details regarding several of the protocols used in this work are provided in Supplemental Experimental Procedures.
Cell Culture, Neural Differentiation, and Lentiviral Transduction
Cell culture, neural differentiation of human iPSCs (253G1), and lentiviral transduction of neurospheres were performed as described previously (Nori et al., 2011; Okada et al., 2008). Briefly, 253G1-derived primary neurospheres were dissociated and infected with lentivirus expressing Venus or ffLuc under the control of the EF promoter. Primary neurospheres were passaged into secondary and tertiary neurospheres. The ffLuc vector enabled detection of grafted cells as strong bioluminescent ffLuc signals in live SCI mice, and as fluorescent Venus signals in fixed spinal cord sections.
Animal Model and Cell Transplantation
Adult female NOD-SCID mice (20–22 g) were anesthetized via intraperitoneal (i.p.) injection of ketamine (100 mg/kg) and xylazine (10 mg/kg). After laminectomy, contusive SCI was induced at the Th10 level using an IH impactor (60 kdyn; Precision Systems and Instrumentation) as described previously (Scheff et al., 2003). Nine days after SCI, 253G1-NSs (5 × 10⁵ cells) were transplanted into the lesion epicenter of each mouse (n = 37) using a glass micropipette and stereotaxic injector (KDS310; Muromachi Kikai). The 253G1-NSs were transplanted at approximately the same time as the PBS injection and 201B7-NS transplantation described in our previous report (Nori et al., 2011).
Bioluminescence Imaging
A Xenogen-IVIS spectrum-cooled, charge-coupled device optical macroscopic imaging system (Summit Pharmaceuticals International) was used for bioluminescence imaging to confirm the survival of the grafted cells as previously described (Itakura et al., 2014; Okada et al., 2005; Takahashi et al., 2011). Monitoring was performed for 103 days post-transplantation.
Motor Function and Histological Analyses
Motor function was evaluated using the BMS, Rotarod apparatus (Muromachi Kikai), and DigiGait system (Mouse Specifics). For histological analyses, the animals were anesthetized and transcardially perfused with 4% paraformaldehyde (pH 7.4). Spinal cords were removed and sectioned in the sagittal/axial plane on a cryostat. All motor function and histological analyses were conducted by observers blinded to the treatment conditions. All animal experiments (approval number 09169) were performed under the control of the Keio University Institutional Animal Care and Use Committee in accordance with the Institutional Guidelines on Animal Experimentation at Keio University, the Japanese Government Law Concerning the Protection and Control of Animals, and the Japanese Government Notification of Feeding and Safekeeping of Animals, and approved by the ethics committee of Keio University (IRB approval number 09091-8).
RT-PCR
RNA isolation and RT-PCR were performed as previously described (Nori et al., 2011; Okada et al., 2008).
Transcriptome Analysis
Total RNA from each sample was purified as previously described (Okada et al., 2008). mRNA libraries were prepared according to the TruSeq RNA sample prep kit protocol and sequenced using a Genome Analyzer IIx (Illumina). Mouse and human mRNA sequences were separated using Xenome software (Conway et al., 2012), and separated mRNA-seq data were mapped to the corresponding genomic DNA sequences (human [hg19] and mouse [mm9]) using TopHat software (Trapnell et al., 2009). The mapped sequences were normalized by trimmed mean of M values (TMM) and analyzed using Avadis NGS software (Agilent Technologies). All software used default parameters. For principal component analysis (PCA) and clustering analysis, the normalized data were narrowed down to 13,693 genes using a cutoff value for expression levels (reads per kilobase of exon per million mapped reads [RPKM] > 100). A Venn diagram was constructed to visualize the 1,715 genes that were upregulated in the 253G1-NS/TP-103d group and the 1,358 genes that were upregulated in the 201B7-NS/TP-103d group (RPKM > 100, fold change > 5.0 versus each NS group). GO analysis was performed using gene lists from the overlapping area, as well as from each separate area, in the Venn diagram. For GO analysis, p values were calculated using Fisher’s exact test. Subsequently corrected p values were applied for multiple testing corrections using the Benjamini-Yekutieli method with a cutoff at p = 0.05. Pathway analysis was performed via IPA (Ingenuity Systems) using genes that were up- or downregulated in the 253G1-NS/TP-103d group versus the 201B7-NS/TP-103d group, as well as in 253G1-NS versus 201B7-NS (RPKM > 100, fold-change > 3.0). The genes were overlaid on the Ingenuity Knowledge Database and networks were algorithmically generated based on their connectivity. The p values were determined using Fisher’s exact test and p = 0.05 was interpreted as indicating statistical significance.
Statistical Analyses
An unpaired, two-tailed Student’s t test was used to assess the 253G1-NS differentiation efficacy. One-way ANOVA followed by the Tukey-Kramer test for multiple comparisons was used for the Ki-67, Rotarod, and DigiGait analyses. Repeated-measures, two-way ANOVA followed by the Tukey-Kramer test was used for the BMS analysis. The Kruskal-Wallis non-parametric test and Scheffe’s test were used to analyze tumor diameter and the percentage of HNu+ grafted cells that were Nestin+, Ki-67+, or OCT4+. Statistical significance was determined as ∗p < 0.05, ∗∗p < 0.01.
Acknowledgments
We thank A. Iwanami, S. Kaneko, K. Fujiyoshi, O. Tsuji, A. Yasuda, Y. Takahashi, S. Kawabata, Y. Nishiyama, T. Iida, S. Shibata, T. Harada, S. Miyao, and H.J. Okano for technical assistance and scientific discussions, and H. Saya, M. Ko, M. Jakt, and K. Horiuchi for critical readings of the manuscript. We also thank S. Yamanaka and M. Nakagawa for the human iPSC clones (253G1 and 201B7). The p-STAT3, p-ERK1/2, and p-AKT antibodies were kindly provided by N. Onishi. This work was supported by grants from the JST-CIRM collaborative program; Grants-in-Aid for Scientific Research from JSPS and the Ministry of Education, Culture, Sports, Science, and Technology of Japan (MEXT); Research Center Network for Realization of Regenerative Medicine from by the Japan Science and Technology Agency (JST); the Kanrinmaru Project (Keio University); Research Fellowships for Young Scientists from the Japan Society for the Promotion of Science; Keio Gijuku Academic Development Funds; and a Grant-in-Aid for Scientific Research on Innovative Areas (Comprehensive Brain Science Network) from the MEXT.
Footnotes
This is an open access article under the CC BY-NC-ND license (http://creativecommons.org/licenses/by-nc-nd/4.0/).
Contributor Information
Masaya Nakamura, Email: masa@a8.keio.jp.
Hideyuki Okano, Email: hidokano@a2.keio.jp.
Supplemental Information
References
- Abou-Ghazal M., Yang D.S., Qiao W., Reina-Ortiz C., Wei J., Kong L.Y., Fuller G.N., Hiraoka N., Priebe W., Sawaya R., Heimberger A.B. The incidence, correlation with tumor-infiltrating inflammation, and prognosis of phosphorylated STAT3 expression in human gliomas. Clin. Cancer Res. 2008;14:8228–8235. doi: 10.1158/1078-0432.CCR-08-1329. [DOI] [PMC free article] [PubMed] [Google Scholar]
- Bowman T., Broome M.A., Sinibaldi D., Wharton W., Pledger W.J., Sedivy J.M., Irby R., Yeatman T., Courtneidge S.A., Jove R. Stat3-mediated Myc expression is required for Src transformation and PDGF-induced mitogenesis. Proc. Natl. Acad. Sci. USA. 2001;98:7319–7324. doi: 10.1073/pnas.131568898. [DOI] [PMC free article] [PubMed] [Google Scholar]
- Bradford J.R., Farren M., Powell S.J., Runswick S., Weston S.L., Brown H., Delpuech O., Wappett M., Smith N.R., Carr T.H. RNA-seq differentiates tumour and host mRNA expression changes induced by treatment of human tumour xenografts with the VEGFR tyrosine kinase inhibitor Cediranib. PLoS ONE. 2013;8:e66003. doi: 10.1371/journal.pone.0066003. [DOI] [PMC free article] [PubMed] [Google Scholar]
- Cheng G.Z., Zhang W.Z., Sun M., Wang Q., Coppola D., Mansour M., Xu L.M., Costanzo C., Cheng J.Q., Wang L.H. Twist is transcriptionally induced by activation of STAT3 and mediates STAT3 oncogenic function. J. Biol. Chem. 2008;283:14665–14673. doi: 10.1074/jbc.M707429200. [DOI] [PMC free article] [PubMed] [Google Scholar]
- Conway T., Wazny J., Bromage A., Tymms M., Sooraj D., Williams E.D., Beresford-Smith B. Xenome—a tool for classifying reads from xenograft samples. Bioinformatics. 2012;28:i172–i178. doi: 10.1093/bioinformatics/bts236. [DOI] [PMC free article] [PubMed] [Google Scholar]
- Cummings B.J., Uchida N., Tamaki S.J., Salazar D.L., Hooshmand M., Summers R., Gage F.H., Anderson A.J. Human neural stem cells differentiate and promote locomotor recovery in spinal cord-injured mice. Proc. Natl. Acad. Sci. USA. 2005;102:14069–14074. doi: 10.1073/pnas.0507063102. [DOI] [PMC free article] [PubMed] [Google Scholar]
- Du Z., Jia D., Liu S., Wang F., Li G., Zhang Y., Cao X., Ling E.A., Hao A. Oct4 is expressed in human gliomas and promotes colony formation in glioma cells. Glia. 2009;57:724–733. doi: 10.1002/glia.20800. [DOI] [PubMed] [Google Scholar]
- Erceg S., Ronaghi M., Oria M., Roselló M.G., Aragó M.A., Lopez M.G., Radojevic I., Moreno-Manzano V., Rodríguez-Jiménez F.J., Bhattacharya S.S. Transplanted oligodendrocytes and motoneuron progenitors generated from human embryonic stem cells promote locomotor recovery after spinal cord transection. Stem Cells. 2010;28:1541–1549. doi: 10.1002/stem.489. [DOI] [PMC free article] [PubMed] [Google Scholar]
- Falk A., Koch P., Kesavan J., Takashima Y., Ladewig J., Alexander M., Wiskow O., Tailor J., Trotter M., Pollard S. Capture of neuroepithelial-like stem cells from pluripotent stem cells provides a versatile system for in vitro production of human neurons. PLoS ONE. 2012;7:e29597. doi: 10.1371/journal.pone.0029597. [DOI] [PMC free article] [PubMed] [Google Scholar]
- Foster K.W., Liu Z., Nail C.D., Li X., Fitzgerald T.J., Bailey S.K., Frost A.R., Louro I.D., Townes T.M., Paterson A.J. Induction of KLF4 in basal keratinocytes blocks the proliferation-differentiation switch and initiates squamous epithelial dysplasia. Oncogene. 2005;24:1491–1500. doi: 10.1038/sj.onc.1208307. [DOI] [PMC free article] [PubMed] [Google Scholar]
- Fujimoto Y., Abematsu M., Falk A., Tsujimura K., Sanosaka T., Juliandi B., Semi K., Namihira M., Komiya S., Smith A., Nakashima K. Treatment of a mouse model of spinal cord injury by transplantation of human induced pluripotent stem cell-derived long-term self-renewing neuroepithelial-like stem cells. Stem Cells. 2012;30:1163–1173. doi: 10.1002/stem.1083. [DOI] [PubMed] [Google Scholar]
- Fujimoto Y., Abematsu M., Falk A., Tsujimura K., Sanosaka T., Juliandi B., Semi K., Namihira M., Komiya S., Smith A., Nakashima K. Treatment of a mouse model of spinal cord injury by transplantation of human iPS cell-derived long-term self-renewing neuroepithelial-like stem cells. Stem Cells. 2012;30:1163–1173. doi: 10.1002/stem.1083. [DOI] [PubMed] [Google Scholar]
- Garber K. Inducing translation. Nat. Biotechnol. 2013;31:483–486. doi: 10.1038/nbt.2602. [DOI] [PubMed] [Google Scholar]
- Gong A., Huang S. FoxM1 and Wnt/β-catenin signaling in glioma stem cells. Cancer Res. 2012;72:5658–5662. doi: 10.1158/0008-5472.CAN-12-0953. [DOI] [PMC free article] [PubMed] [Google Scholar]
- Hara-Miyauchi C., Tsuji O., Hanyu A., Okada S., Yasuda A., Fukano T., Akazawa C., Nakamura M., Imamura T., Matsuzaki Y. Bioluminescent system for dynamic imaging of cell and animal behavior. Biochem. Biophys. Res. Commun. 2012;419:188–193. doi: 10.1016/j.bbrc.2012.01.141. [DOI] [PubMed] [Google Scholar]
- Hay E.D. An overview of epithelio-mesenchymal transformation. Acta Anat. (Basel) 1995;154:8–20. doi: 10.1159/000147748. [DOI] [PubMed] [Google Scholar]
- Hoffmeyer K., Raggioli A., Rudloff S., Anton R., Hierholzer A., Del Valle I., Hein K., Vogt R., Kemler R. Wnt/β-catenin signaling regulates telomerase in stem cells and cancer cells. Science. 2012;336:1549–1554. doi: 10.1126/science.1218370. [DOI] [PubMed] [Google Scholar]
- Hofstetter C.P., Holmström N.A., Lilja J.A., Schweinhardt P., Hao J., Spenger C., Wiesenfeld-Hallin Z., Kurpad S.N., Frisén J., Olson L. Allodynia limits the usefulness of intraspinal neural stem cell grafts; directed differentiation improves outcome. Nat. Neurosci. 2005;8:346–353. doi: 10.1038/nn1405. [DOI] [PubMed] [Google Scholar]
- Ikushima H., Todo T., Ino Y., Takahashi M., Saito N., Miyazawa K., Miyazono K. Glioma-initiating cells retain their tumorigenicity through integration of the Sox axis and Oct4 protein. J. Biol. Chem. 2011;286:41434–41441. doi: 10.1074/jbc.M111.300863. [DOI] [PMC free article] [PubMed] [Google Scholar]
- Itakura G., Kobayashi Y., Nishimura S., Iwai H., Takano M., Iwanami A., Toyama Y., Okano H., Nakamura M. Control of the survival and growth of human glioblastoma grafted into the spinal cord of mice by taking advantage of immunorejection. Cell Transplant. 2014 doi: 10.3727/096368914X681711. Published online May 9, 2014. [DOI] [PubMed] [Google Scholar]
- Iwanami A., Kaneko S., Nakamura M., Kanemura Y., Mori H., Kobayashi S., Yamasaki M., Momoshima S., Ishii H., Ando K. Transplantation of human neural stem cells for spinal cord injury in primates. J. Neurosci. Res. 2005;80:182–190. doi: 10.1002/jnr.20436. [DOI] [PubMed] [Google Scholar]
- Kamao H., Mandai M., Okamoto S., Sakai N., Suga A., Sugita S., Kiryu J., Takahashi M. Characterization of human induced pluripotent stem cell-derived retinal pigment epithelium cell sheets aiming for clinical application. Stem Cell Reports. 2014;2:205–218. doi: 10.1016/j.stemcr.2013.12.007. [DOI] [PMC free article] [PubMed] [Google Scholar]
- Keirstead H.S., Nistor G., Bernal G., Totoiu M., Cloutier F., Sharp K., Steward O. Human embryonic stem cell-derived oligodendrocyte progenitor cell transplants remyelinate and restore locomotion after spinal cord injury. J. Neurosci. 2005;25:4694–4705. doi: 10.1523/JNEUROSCI.0311-05.2005. [DOI] [PMC free article] [PubMed] [Google Scholar]
- Kobayashi Y., Okada Y., Itakura G., Iwai H., Nishimura S., Yasuda A., Nori S., Hikishima K., Konomi T., Fujiyoshi K. Pre-evaluated safe human iPSC-derived neural stem cells promote functional recovery after spinal cord injury in common marmoset without tumorigenicity. PLoS ONE. 2012;7:e52787. doi: 10.1371/journal.pone.0052787. [DOI] [PMC free article] [PubMed] [Google Scholar]
- Kumagai G., Okada Y., Yamane J., Nagoshi N., Kitamura K., Mukaino M., Tsuji O., Fujiyoshi K., Katoh H., Okada S. Roles of ES cell-derived gliogenic neural stem/progenitor cells in functional recovery after spinal cord injury. PLoS ONE. 2009;4:e7706. doi: 10.1371/journal.pone.0007706. [DOI] [PMC free article] [PubMed] [Google Scholar]
- Kumamaru H., Ohkawa Y., Saiwai H., Yamada H., Kubota K., Kobayakawa K., Akashi K., Okano H., Iwamoto Y., Okada S. Direct isolation and RNA-seq reveal environment-dependent properties of engrafted neural stem/progenitor cells. Nat. Commun. 2012;3:1140. doi: 10.1038/ncomms2132. [DOI] [PubMed] [Google Scholar]
- Li Y., McClintick J., Zhong L., Edenberg H.J., Yoder M.C., Chan R.J. Murine embryonic stem cell differentiation is promoted by SOCS-3 and inhibited by the zinc finger transcription factor Klf4. Blood. 2005;105:635–637. doi: 10.1182/blood-2004-07-2681. [DOI] [PubMed] [Google Scholar]
- Lukovic D., Valdés-Sanchez L., Sanchez-Vera I., Moreno-Manzano V., Stojkovic M., Bhattacharya S.S., Erceg S. Brief report: astrogliosis promotes functional recovery of completely transected spinal cord following transplantation of hESC-derived oligodendrocyte and motoneuron progenitors. Stem Cells. 2014;32:594–599. doi: 10.1002/stem.1562. [DOI] [PubMed] [Google Scholar]
- Miura K., Okada Y., Aoi T., Okada A., Takahashi K., Okita K., Nakagawa M., Koyanagi M., Tanabe K., Ohnuki M. Variation in the safety of induced pluripotent stem cell lines. Nat. Biotechnol. 2009;27:743–745. doi: 10.1038/nbt.1554. [DOI] [PubMed] [Google Scholar]
- Monk M., Holding C. Human embryonic genes re-expressed in cancer cells. Oncogene. 2001;20:8085–8091. doi: 10.1038/sj.onc.1205088. [DOI] [PubMed] [Google Scholar]
- Moody S.E., Perez D., Pan T.C., Sarkisian C.J., Portocarrero C.P., Sterner C.J., Notorfrancesco K.L., Cardiff R.D., Chodosh L.A. The transcriptional repressor Snail promotes mammary tumor recurrence. Cancer Cell. 2005;8:197–209. doi: 10.1016/j.ccr.2005.07.009. [DOI] [PubMed] [Google Scholar]
- Nagai T., Ibata K., Park E.S., Kubota M., Mikoshiba K., Miyawaki A. A variant of yellow fluorescent protein with fast and efficient maturation for cell-biological applications. Nat. Biotechnol. 2002;20:87–90. doi: 10.1038/nbt0102-87. [DOI] [PubMed] [Google Scholar]
- Nakagawa M., Koyanagi M., Tanabe K., Takahashi K., Ichisaka T., Aoi T., Okita K., Mochiduki Y., Takizawa N., Yamanaka S. Generation of induced pluripotent stem cells without Myc from mouse and human fibroblasts. Nat. Biotechnol. 2008;26:101–106. doi: 10.1038/nbt1374. [DOI] [PubMed] [Google Scholar]
- Niwa H. How is pluripotency determined and maintained? Development. 2007;134:635–646. doi: 10.1242/dev.02787. [DOI] [PubMed] [Google Scholar]
- Nori S., Okada Y., Yasuda A., Tsuji O., Takahashi Y., Kobayashi Y., Fujiyoshi K., Koike M., Uchiyama Y., Ikeda E. Grafted human-induced pluripotent stem-cell-derived neurospheres promote motor functional recovery after spinal cord injury in mice. Proc. Natl. Acad. Sci. USA. 2011;108:16825–16830. doi: 10.1073/pnas.1108077108. [DOI] [PMC free article] [PubMed] [Google Scholar]
- Ogawa Y., Sawamoto K., Miyata T., Miyao S., Watanabe M., Nakamura M., Bregman B.S., Koike M., Uchiyama Y., Toyama Y., Okano H. Transplantation of in vitro-expanded fetal neural progenitor cells results in neurogenesis and functional recovery after spinal cord contusion injury in adult rats. J. Neurosci. Res. 2002;69:925–933. doi: 10.1002/jnr.10341. [DOI] [PubMed] [Google Scholar]
- Okada Y., Shimazaki T., Sobue G., Okano H. Retinoic-acid-concentration-dependent acquisition of neural cell identity during in vitro differentiation of mouse embryonic stem cells. Dev. Biol. 2004;275:124–142. doi: 10.1016/j.ydbio.2004.07.038. [DOI] [PubMed] [Google Scholar]
- Okada S., Ishii K., Yamane J., Iwanami A., Ikegami T., Katoh H., Iwamoto Y., Nakamura M., Miyoshi H., Okano H.J. In vivo imaging of engrafted neural stem cells: its application in evaluating the optimal timing of transplantation for spinal cord injury. FASEB J. 2005;19:1839–1841. doi: 10.1096/fj.05-4082fje. [DOI] [PubMed] [Google Scholar]
- Okada Y., Matsumoto A., Shimazaki T., Enoki R., Koizumi A., Ishii S., Itoyama Y., Sobue G., Okano H. Spatiotemporal recapitulation of central nervous system development by murine embryonic stem cell-derived neural stem/progenitor cells. Stem Cells. 2008;26:3086–3098. doi: 10.1634/stemcells.2008-0293. [DOI] [PubMed] [Google Scholar]
- Okano H., Nakamura M., Yoshida K., Okada Y., Tsuji O., Nori S., Ikeda E., Yamanaka S., Miura K. Steps toward safe cell therapy using induced pluripotent stem cells. Circ. Res. 2013;112:523–533. doi: 10.1161/CIRCRESAHA.111.256149. [DOI] [PubMed] [Google Scholar]
- Okita K., Nakagawa M., Hyenjong H., Ichisaka T., Yamanaka S. Generation of mouse induced pluripotent stem cells without viral vectors. Science. 2008;322:949–953. doi: 10.1126/science.1164270. [DOI] [PubMed] [Google Scholar]
- Okita K., Matsumura Y., Sato Y., Okada A., Morizane A., Okamoto S., Hong H., Nakagawa M., Tanabe K., Tezuka K. A more efficient method to generate integration-free human iPS cells. Nat. Methods. 2011;8:409–412. doi: 10.1038/nmeth.1591. [DOI] [PubMed] [Google Scholar]
- Pandya A.Y., Talley L.I., Frost A.R., Fitzgerald T.J., Trivedi V., Chakravarthy M., Chhieng D.C., Grizzle W.E., Engler J.A., Krontiras H. Nuclear localization of KLF4 is associated with an aggressive phenotype in early-stage breast cancer. Clin. Cancer Res. 2004;10:2709–2719. doi: 10.1158/1078-0432.ccr-03-0484. [DOI] [PubMed] [Google Scholar]
- Ricci-Vitiani L., Pallini R., Larocca L.M., Lombardi D.G., Signore M., Pierconti F., Petrucci G., Montano N., Maira G., De Maria R. Mesenchymal differentiation of glioblastoma stem cells. Cell Death Differ. 2008;15:1491–1498. doi: 10.1038/cdd.2008.72. [DOI] [PubMed] [Google Scholar]
- Salazar D.L., Uchida N., Hamers F.P., Cummings B.J., Anderson A.J. Human neural stem cells differentiate and promote locomotor recovery in an early chronic spinal cord injury NOD-scid mouse model. PLoS ONE. 2010;5:e12272. doi: 10.1371/journal.pone.0012272. [DOI] [PMC free article] [PubMed] [Google Scholar]
- Scheff S.W., Rabchevsky A.G., Fugaccia I., Main J.A., Lumpp J.E., Jr. Experimental modeling of spinal cord injury: characterization of a force-defined injury device. J. Neurotrauma. 2003;20:179–193. doi: 10.1089/08977150360547099. [DOI] [PubMed] [Google Scholar]
- Strauss S. Geron trial resumes, but standards for stem cell trials remain elusive. Nat. Biotechnol. 2010;28:989–990. doi: 10.1038/nbt1010-989. [DOI] [PubMed] [Google Scholar]
- Takahashi K., Tanabe K., Ohnuki M., Narita M., Ichisaka T., Tomoda K., Yamanaka S. Induction of pluripotent stem cells from adult human fibroblasts by defined factors. Cell. 2007;131:861–872. doi: 10.1016/j.cell.2007.11.019. [DOI] [PubMed] [Google Scholar]
- Takahashi Y., Tsuji O., Kumagai G., Hara C.M., Okano H.J., Miyawaki A., Toyama Y., Okano H., Nakamura M. Comparative study of methods for administering neural stem/progenitor cells to treat spinal cord injury in mice. Cell Transplant. 2011;20:727–739. doi: 10.3727/096368910X536554. [DOI] [PubMed] [Google Scholar]
- Thiery J.P. Epithelial-mesenchymal transitions in tumour progression. Nat. Rev. Cancer. 2002;2:442–454. doi: 10.1038/nrc822. [DOI] [PubMed] [Google Scholar]
- Trapnell C., Pachter L., Salzberg S.L. TopHat: discovering splice junctions with RNA-Seq. Bioinformatics. 2009;25:1105–1111. doi: 10.1093/bioinformatics/btp120. [DOI] [PMC free article] [PubMed] [Google Scholar]
- Tsuji O., Miura K., Okada Y., Fujiyoshi K., Mukaino M., Nagoshi N., Kitamura K., Kumagai G., Nishino M., Tomisato S. Therapeutic potential of appropriately evaluated safe-induced pluripotent stem cells for spinal cord injury. Proc. Natl. Acad. Sci. USA. 2010;107:12704–12709. doi: 10.1073/pnas.0910106107. [DOI] [PMC free article] [PubMed] [Google Scholar]
- Wang S., Bates J., Li X., Schanz S., Chandler-Militello D., Levine C., Maherali N., Studer L., Hochedlinger K., Windrem M., Goldman S.A. Human iPSC-derived oligodendrocyte progenitor cells can myelinate and rescue a mouse model of congenital hypomyelination. Cell Stem Cell. 2013;12:252–264. doi: 10.1016/j.stem.2012.12.002. [DOI] [PMC free article] [PubMed] [Google Scholar]
- Wei Z., Gao F., Kim S., Yang H., Lyu J., An W., Wang K., Lu W. Klf4 organizes long-range chromosomal interactions with the oct4 locus in reprogramming and pluripotency. Cell Stem Cell. 2013;13:36–47. doi: 10.1016/j.stem.2013.05.010. [DOI] [PubMed] [Google Scholar]
- Yang J., Mani S.A., Donaher J.L., Ramaswamy S., Itzykson R.A., Come C., Savagner P., Gitelman I., Richardson A., Weinberg R.A. Twist, a master regulator of morphogenesis, plays an essential role in tumor metastasis. Cell. 2004;117:927–939. doi: 10.1016/j.cell.2004.06.006. [DOI] [PubMed] [Google Scholar]
- Yasuda A., Tsuji O., Shibata S., Nori S., Takano M., Kobayashi Y., Takahashi Y., Fujiyoshi K., Hara C.M., Miyawaki A. Significance of remyelination by neural stem/progenitor cells transplanted into the injured spinal cord. Stem Cells. 2011;29:1983–1994. doi: 10.1002/stem.767. [DOI] [PubMed] [Google Scholar]
Associated Data
This section collects any data citations, data availability statements, or supplementary materials included in this article.