Abstract
Human melanoma is the most aggressive form of skin cancer and is extremely resistant to radiation and chemotherapy. One of the critical parameters of this resistance is down-regulation of Fas (CD95) cell-surface expression. Using TIG3 normal human fibro-blasts and human melanoma cell lines, we investigated transcriptional regulation of FAP-1, a regulator of Fas translocation in the cell. Protein-tyrosine phosphatase FAP-1 (PTPN13, PTP-BAS) interacts with human Fas protein and prevents its export from the cytoplasm to the cell surface. In contrast, dynamin-2 facilitates Fas protein translocation from the Golgi apparatus via the trans-Golgi network to the cell surface. Suppression of dynamin functions by dominant negative dynamin K44A blocks Fas export, whereas the down-regulation of FAP-1 expression by specific RNA interference restores Fas export (a phenomenon that could still be down-regulated in the presence of dominant-negative dynamin). Based on the FAP-1- and dynamin-dependent regulation of Fas translocation, we have created human melanoma lines with different levels of surface expression of Fas. Treatment of these melanoma lines with soluble Fas ligand resulted in programmed cell death that was proportional to the pre-existing levels of surface Fas. Taking into consideration the well known observations that FAP-1 expression is often up-regulated in metastatic tumors, we have established a causal connection between high basal NF-κB transcription factor activity (which is a hallmark of many types of metastatic tumors) and NF-κB-dependent transcriptional regulation of FAP-1 gene expression that finally restricts Fas protein trafficking, thereby, facilitating the survival of cancer cells.
The Fas receptor (synonyms: Apo-1, CD95, and TNFRSF6) is the member of the TNF2 receptor superfamily, which contains signaling molecules regulating programmed cell death. The interaction between the Fas receptor and its ligand (FasL) initiates a complex pattern of intracellular events involving the recruitment of specific adaptor protein and procaspase-8 to the receptor followed by activation of caspase 8, caspase 8-dependent stimulation of the downstream effector caspases, and development of apoptosis (1, 2). The level of surface expression of Fas is one of critical parameters in determining the ability of cells to undergo apoptosis. Expression of Fas on the cell surface is a multistage process that is regulated at different levels: (i) signaling pathways that target specific transcription factors are involved in the control of Fas gene expression; (ii) the transcription of the Fas gene driven by positive regulators (such as NF-κB (3–5)) and by negative regulators (such as AP-1 and Stat-3 (6)) in the context of general transcription regulators (7); (iii) the translation of the Fas mRNA, which is, by default, dependent on the phosphatidylinositol 3-kinase-AKT-mammalian target of rapamycin signaling pathway (8); (iv) post-translational modifications (protein folding, glycosylation, and phosphorylation) accompanying the maturation of Fas protein (9, 10); (v) Fas protein trafficking from the cytoplasm to the cell surface (regulated by protein-protein interactions, including FAP-1, a scaffolding protein (11–14); and (vi) Fas receptor internalization and degradation.
Somatic mutagenesis of the Fas gene (15) and epigenetic regulatory mechanisms may affect the regulation of Fas expression or Fas-dependent death signaling, both of which are suppressed in metastatic cancer cells, often partially or almost completely (2, 16, 17). The general role of the protein-tyrosine phosphatase FAP-1/PTP-Bas/PTPN13 in the negative regulation of Fas translocation among cancer cells has been previously described (11, 12). It is not surprising, however, that FAP-1 gene expression itself is tightly regulated at the transcriptional level. In the present study, based on the original observations demonstrating the presence of the putative NF-κB-binding elements in the promoter region of the FAP-1 gene (18, 19), we have established a role of NF-κB in this regulation. Conversely, NF-κB-dependent regulation of the Fas gene is well established (3, 5). Simultaneous NF-κB-dependent control of the transcription of both the Fas receptor and its inhibitor, FAP-1 likely contributes to the heightened flexibility of the regulation of Fas surface expression, thereby creating certain restrictions in its surface expression level.
Additionally, there is a highly important phase of Fas protein trafficking that occurs between the Golgi and the plasma membrane via the trans-Golgi network. Recent investigations in this area have established the critical role of dynamin-2 (Dyn-2) in the general regulation of post-Golgi trafficking (20, 21). The particular questions raised (which have been thoroughly investigated in the present study) are linked with dynamin-dependent functions of Fas protein trafficking, as well as with the functional interference between FAP-1 and dynamin in the regulation of the Fas protein export. Finally, based on the FAP-1- and dynamin-dependent regulation of the Fas export, we have established melanoma cell lines with the regulated surface expression of the Fas receptor. The next critical issue resolved by the present study is that the treatment of these Fas-positive melanomas with soluble Fas ligand resulted in the programmed death of cancer cells, which was proportional to the preexisting surface Fas levels.
EXPERIMENTAL PROCEDURES
Materials
Sodium arsenite, cycloheximide, Brefeldin A, and tunicamycin were obtained from Sigma; tumor necrosis factor-α (TNF-α) was purchased from Roche Applied Science. Human soluble Fas ligand (recombinant) and TRAIL (recombinant) were purchased from Alexis (San Diego, CA); BD Cytofix/Cytoperm kit was obtained BD Pharmingen; and pre-cast SDS-polyacrylamide gels were purchased from Bio-Rad. EZ-Link Sulfo-NHS-LC-Biotin was obtained from Pierce. Streptavidin-agarose was purchased from Invitrogen.
Cell Lines
Human melanoma cell lines LU1205 (also known as 1205lu), WM793, WM9 (22–25), and OM431 were maintained in a Dulbecco's modified Eagle's medium supplemented with 10% fetal bovine serum, l-glutamine, and antibiotics. FEMX and HHMSX human melanoma lines (26) were maintained in a RPMI1640 medium supplemented with 10% fetal calf serum and antibiotics. TIG3 human embryonic lung fibroblasts and HeLa human cervical carcinoma cells were maintained in a Dulbecco's modified Eagle's medium supplemented with 10% fetal bovine serum, l-glutamine, and antibiotics.
FACS Analysis of Fas Levels
Surface and total levels (“total” meaning after cell permeabilization with BD Cytofix/Cytoperm) of Fas were determined by staining with the correspondent phycoerythrin-conjugated anti-human mAb and subsequent flow cytometry. Phycoerythrinconjugated mouse IgG1 was used as a monoclonal immunoglobulin isotype control. A FACSCalibur flow cytometer (BD Biosciences) combined with the CellQuest program was used to perform flow cytometric analysis with 40,000 cells for single color staining and with 80,000 cells for double color staining. All experiments were independently repeated four to five times.
Transfection and Luciferase Assay
The NF-κB luciferase reporter containing two κB binding sites, Jun2-Luc reporter and empty vector tk-Luc (27), were used to determine NF-κB and AP-1 transactivation. Additional reporter constructs used included: −1.7-kb FASpr-Luc (5) and FAP1pr-Luc containing a 0.5-kb fragment of the proximal promoter (19). Transient transfection of different reporter constructs (1 μg) together with pCMV-βgal (0.25 μg) into 5 × 10⁵ melanoma cells was performed using Lipofectamine (Invitrogen). Proteins were prepared for β-galactosidase and luciferase analysis 16 h after transfection. Luciferase activity was determined using the Luciferase assay system (Promega, Madison, WI) and was normalized based on β-galactosidase levels.
In some experiments, using Lipofectamine (Invitrogen), melanoma cells were transfected with pEF-Fas-GFP expression constructs, either alone or in the presence of certain expression vectors, including: pCMV-FAP1 and pCMV-FAP1ΔCD (11); pcDNA3-Dyn-1 and pcDNA3-Dyn-1 K44A (28, 29); pCMV4-Dyn-2, pCMV4-Dyn-2 K44A, and pCMV4-Dyn-2 Y231F/Y597F (30); pcDNA3-IKKβS178E/S181E (31); and MEKK1Δ expression vector (32), as well as pCMV-βGal. 8 –30 h after transfection, GFP-positive cells were stained with phycoerythrin-anti Fas monoclonal antibody (mAb) (BD Pharmingen) to determine surface Fas expression by flow cytometry. Two parameters: 1) the percentage of Fas+ GFP+ cells among GFP+ cells and 2) the mean fluorescence intensity (MFI) of surface Fas levels were used to evaluate the efficiency of surface Fas-GFP translocation. Flow cytometry was performed using a FACSCalibur flow cytometer (BD Biosciences) in conjunction with the CellQuest program. The specific activity of β-galactosidase was used for the normalization of the efficiency of transfection. Tet-off HeLa system expressing mutant, dynamin-1 K44A (33), was kindly provided by Dr. S. L. Schmid (The Scripps Research Institute, La Jolla, CA).
Treatment and Apoptosis Studies
Cells were exposed to soluble FasL (50 ng/ml) in combination with cycloheximide (1 μg/ml). Apoptosis was then assessed by quantifying the percentage of hypodiploid nuclei undergoing DNA fragmentation (34). Flow cytometric analysis was performed on a FACSCalibur flow cytometer.
FAP-1 Suppression by RNAi
The pSUPER retro (pRS) RNA interference (RNAi) system (Oligoengine, Seattle, WA), which has been utilized for the production of small RNAi transcripts used to suppress FAP-1 expression, was previously described (11).
Western Blot Analysis and Immunoprecipitation
Total cell lysates (50–100 μg of protein) were resolved on 10% SDS-PAGE and processed according to standard protocols. The antibodies used for Western blotting included monoclonal anti-β-Actin (Sigma); monoclonal anti-dynamin-1 and anti-dynamin-2 (Upstate, Lake Placid, NY); monoclonal anti-human Fas (G254–274). Polyclonal anti-FAP-1 antibody was kindly provided by T. A. Sato (Columbia University, NY). Optimal dilutions of primary Abs were 1:1,000 to 1:10,000. The secondary Abs (anti-rabbit or anti-mouse) were conjugated to horseradish peroxidase (dilution 1:5,000 to 1:10,000); signals were detected using the ECL system (Amersham Biosciences).
Total levels of Fas were determined by using the immunoprecipitation of total cell extracts with anti-human Fas mAb and G-protein-Sepharose beads (Sigma) combined with subsequent Western analysis. Fas-GFP-fused protein was immunoprecipitated either with anti-Fas or anti-GFP Abs, with subsequent Western analysis using anti-Fas mAb.
Cell-surface Labeling with Biotin
Biotinylation of cell-surface proteins was performed using EZ-Link Sulfo-NHS-LC-Biotin (Pierce) according to the manufacturer's instruction. Cell proteins were dissolved using 1% Triton X-100, 0.14 m NaCl, 10 mm Tris-HCl (pH 7.5), 2 mm leupeptin, 2 mm aprotinin, 1 mm phenylmethylsulfonyl fluoride. Biotinylated proteins were precipitated using Streptavidin-agarose beads, dissolved in sample buffer, and subjected to SDS-gel electrophoresis followed by Western blot analysis with anti-Fas Ab.
Electrophoretic Mobility Shift Assay
Electrophoretic mobility shift assay was performed for the detection of NF-κB DNA-binding activity as previously described (35), using the labeled double strand oligonucleotide AGCTTGGGGACTTTCCAGCCG. (Binding sites are underlined.) Ubiquitous NF-Y DNA-binding activity was used as an internal control (35).
RESULTS
Fas Receptor Translocation to the Cell Surface
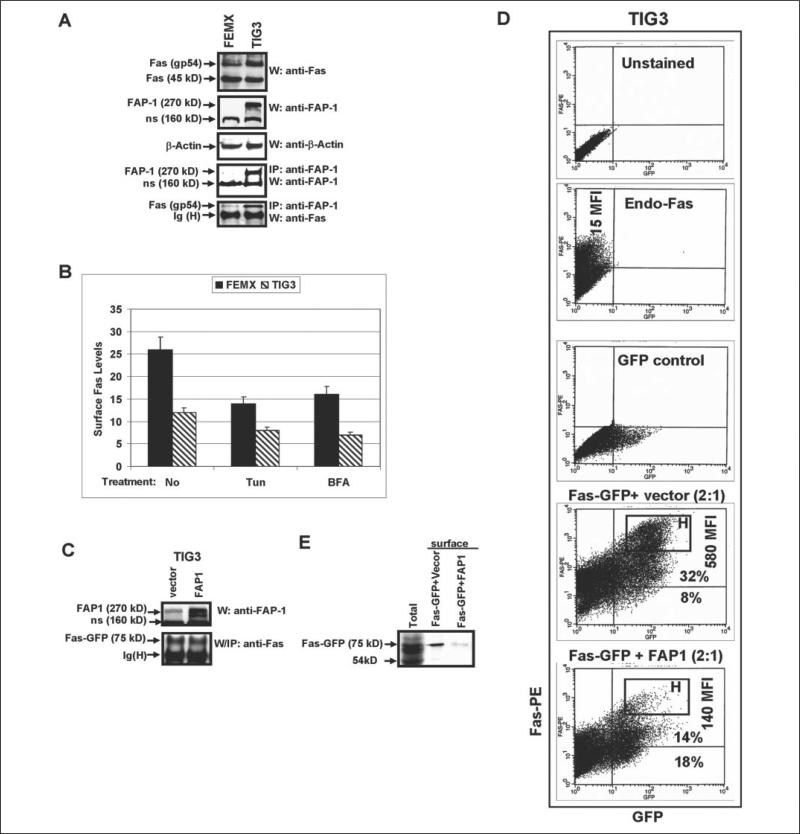
We and others have previously observed that some cancer cell lines, such as human ocular melanoma OM431 and human metastatic melanomas LU1205 and HHMSX, contained a substantial cytoplasmic pool of Fas in complex with a scatter protein FAP-1 (11, 12). TIG3 human embryonic lung fibroblasts express moderate levels of FAP-1, which interacts with endogenous cytoplasmic Fas, as shown by the coimmunoprecipitation of FAP-1 and Fas gp54 (Fig. 1A). Alternatively, most of the Fas receptor is located on the cell surface of FEMX cells (11) due to very low level of expression of the FAP-1 protein in these cells (Fig. 1A).
FIGURE 1. Fas translocation to the cell surface: the negative effects of tunicamycin, BFA, and FAP-1 overexpression.
A, Western blot analysis of protein levels of Fas (a mature glycoprotein of 54 kDa and partially glycosylated protein of 45 kDa) in FEMX human melanoma cells and in TIG3 human embryonic lung fibroblasts; β-actin was used as a protein downloading control; immunoprecipitation with anti-FAP-1 Ab and the subsequent Western analysis with anti-Fas mAb or anti-FAP-1 Ab demonstrate FAP-1/Fas protein association in TIG3 cells: FAP-1 (270 kDa), Fas (gp54); ns, nonspecific band. B, FEMX or TIG3 cells were non-treated or treated with tunicamycin (Tun) or Brefeldin A (BFA) for 16 h; surface Fas levels were determined using cell staining with anti-Fas-PE mAb and subsequent flow cytometry. Error bars represent mean ± S.D. from three independent experiments. C, direct Western analysis was performed for determination of FAP-1 levels after transfection of TIG3 cells with FAP-1 expression construct; immunoprecipitation with the subsequent Western analysis was performed to determine Fas-GFP levels in TIG3 cells, which were transiently transfected with pEF-Fas-GFP wt in the presence or in the absence of FAP-1 expression vector. D, TIG3 cells were transfected with pEF-Fas-GFP and the empty vector pCMV4 (1:1) or with pEF-Fas-GFP and FAP-1 expression constructs (1:1); 24 h after transfection, cells were stained with anti-Fas-PE mAb and analyzed for surface Fas expression by flow cytometry; MFI of surface Fas levels and percentage of the Fas+GFP+ and Fas−GFP+ cells are indicated; the brightest Fas+ cells were gated as the ‘H’ rectangular. Gating of unstained cells, single-stained with anti-Fas-PE mAb cells and GFP-positive cells is indicated. E, surface Fas expression was detected in transfected TIG3 cells by biotinylation of cell-surface proteins with subsequent precipitation of biotinylated proteins by Streptavidin-agarose beads and identification of surface proteins using immunoblotting and anti-Fas Ab. Fas-GFP fused protein (75 kDa) was detected on the cell surface after transfection of Fas-GFP; cotransfection with FAP-1 expression construct down-regulated Fas-GFP surface levels.
We decided to use TIG3 cells as a model to study Fas trafficking due to the high transfection efficiency of these cells compared with most melanomas. In general, Fas protein translocation occurs in the cells using the conventional rules of protein receptor export to cell surface, showing dependence of corresponding post-translational modifications (glycosylation and phosphorylation), protein-protein interactions, and the integrity of the Golgi apparatus and the trans-Golgi network (TGN). As expected, brefeldin A (BFA, 100 ng/ml), an inhibitor of protein trans-location from the endoplasmatic reticulum to the Golgi, and tunicamycin (5 μg/ml), a general inhibitor of protein N-glycosylation, notably suppressed endogenous surface expression of Fas in Fas-positive melanomas, including FEMX cells, 16 h after treatment (Fig. 1B). The effects of these agents on the surface expression of endogenous Fas in TIG3 cells were less pronounced due to the low basal levels of surface Fas expression on these cells.
Based on our previous observations (11), we transfected TIG3 cells with the pEF-Fas-GFP expression construct, which resulted in a high expression of surface Fas-GFP-fused protein. As expected, surface Fas expression was down-regulated after the cotransfection of Fas-GFP with FAP-1 expression vector (Fig. 1, C and D) due to a substantial deletion of the bright Fas-positive cells gated as the ‘H’ rectangular in Fig. 1D. MFI, which determines levels of surface Fas expression, has been dramatically decreased, whereas total percentage of GFP+ cells was similar following cotransfection either with the empty vector or FAP-1 expression vector (Fig. 1D). This reflects a substantial retardation of Fas-GFP translocation in cells with FAP-1 overexpression. These results obtained with TIG3 cells are very similar to our previous observations on several melanoma cell lines (11). Furthermore, biotinylation of the cell-surface proteins, their subsequent precipitation with Streptavidin-agarose, and immunoblotting with anti-Fas Ab detected Fas-GFP-fused protein on the cell surface. Cotransfection with FAP-1 expression vector substantially reduced Fas-GFP surface levels (Fig. 1E).
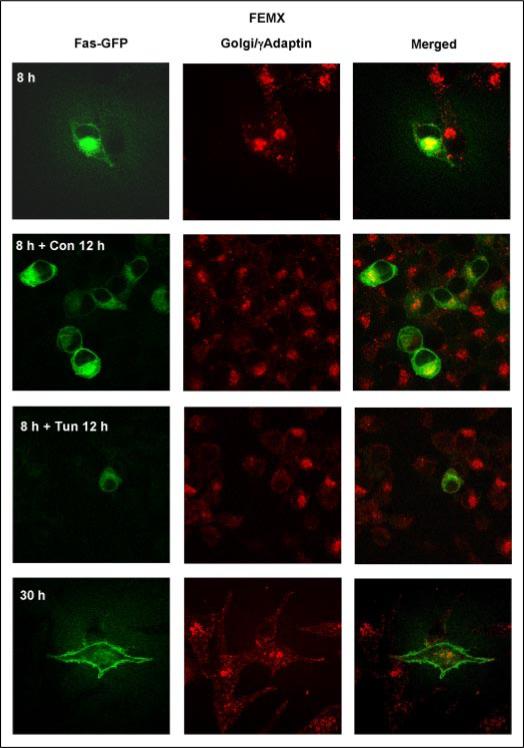
As we previously demonstrated, the transfection of FEMX melanoma cells with pEF-Fas-GFP expression construct resulted in an appearance of fused Fas-GFP protein in the Golgi 8 h after transfection, followed by translocation of Fas-GFP via TGN to the cell surface 30 h after transfection (11). Tunicamycin (Fig. 2) and BFA notably suppressed the trafficking of exogenous Fas-GFP protein in FEMX cells. Transfected FEMX cells with high levels of Fas-GFP expression on the cell surface acquired a high sensitivity to FasL-mediated death (11), whereas tunicamycin or BFA pretreatment partially suppressed this susceptibility. Conversely, N102P and N120P mutations in the glycosylation sites of Fas protein (36) have differentially affected Fas-GFP translocation to the cell surface: N102P mutation had strong negative effects on Fas-GFP export in all tested lines, whereas levels of surface expression of Fas N120P differed greatly in distinct lines (data not shown). In TIG3 cells, Fas (N120P)-GFP-mutated protein can be detected, although at low levels in total cell extracts following immunoprecipitation; surface expression of this protein was very low (data not shown). Equal efficiency of transfection was proofed in these experiments by co-transfection of Fas expression constructs with pCMV-β-gal and determination of β-galactosidase activity.
FIGURE 2. Fas-GFP-fused protein translocation to the cell surface in FEMX: the negative effects of tunicamycin.
FEMX melanoma cells were transiently transfected with a pEF-Fas-GFP expression construct and analyzed 8, 20, and 30 h after transfection; some cell cultures were treated with tunicamycin for 12 h. Confocal analysis of Fas-GFP (green) and a Golgi marker γ-adaptin (red; secondary Ab labeled with Texas Red) was performed for the determination of subcellular localization.
Transcriptional Regulation of FAP-1 Gene Expression: A Role of NF-κB
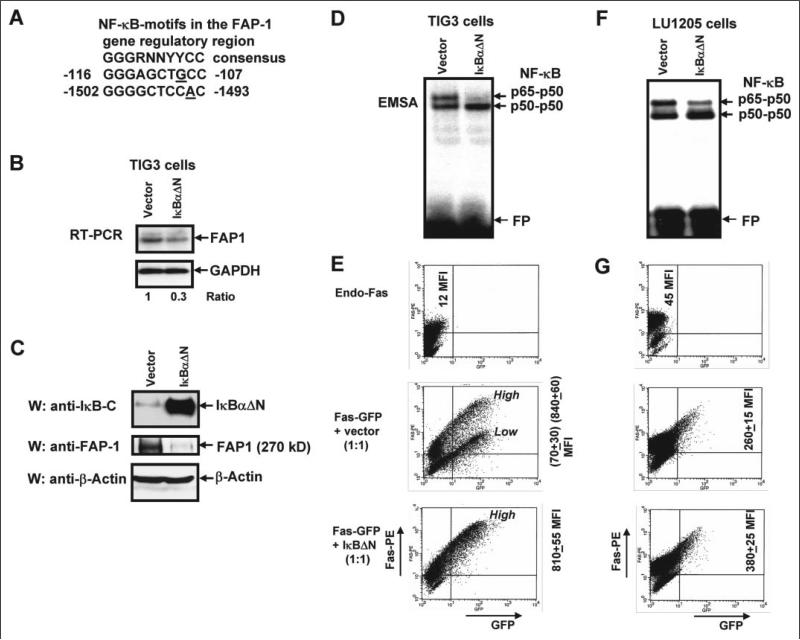
Because FAP-1 is a central negative regulator of Fas trafficking in human cells, it would be important to determine the mechanism behind the transcriptional control of endogenous FAP-1 gene expression. Furthermore, many human tumors possess high levels of expression of FAP-1 (synonyms: PTPN13, PTP-BAS, PTPL1, and hPTP1E) (37), including ovarian carcinomas (38), melanomas (11), pancreatic cancers (12), Ewing's sarcomas (39), and colon adenocarcinomas (40). Additionally, numerous metastatic tumors are characterized by high basal NF-κB activity (41–43), which is (in many cases) a hallmark of the advanced stages of the cancer development. NF-κB has potential binding sites in the FAP-1 promoters (Fig. 3A) (19). This was a reason to determine whether this transcription factor is involved directly or indirectly in the regulation of FAP-1 expression. To address this question, we used TIG3 human embryonic fibroblasts as a model in our initial experiments. We have transfected TIG3 cells either by the empty vector, pCMV4, or by an expression construct encoding super-stable IκBαΔN (44). 24 h after transfection, a dramatic accumulation of super-stable IκBαΔN was accompanied by a down-regulation of both NF-κB DNA-binding activity (p65-p50) and FAP-1 mRNA with protein levels (Fig. 3, B–D). A notable decrease in NF-κB activity (Fig. 3F), FAP-1 mRNA, and protein levels (data not shown) was also detected in LU1205 melanoma cells, following the transfection of super-stable IκBαΔN. Cotransfection of Fas-GFP expression construct together with IκBαΔN construct (which successfully blocked endogenous FAP-1 expression) resulted in both the substantial increase of Fas-GFP translocation to the cell surface in TIG3 fibroblasts (Fig. 3E) and a notable increase in LU1205 melanoma cells (Fig. 3G). These observations were based on FACS analysis of transfected cells, which were stained with anti-Fas-PE mAb for detection of surface Fas levels. A subpopulation of TIG3 cells with a low surface expression of Fas-GFP had nearly disappeared after transfection with IκBΔN (accompanied by the up-regulation of total MFI of surface Fas). Such changes were less pronounced in LU1205 cells due to a less effective transfection of these cells (compare levels of inhibition of p65-p50 DNA binding activity shown in Fig. 3 (D and F)). In general, these data have indicated that a negative regulation of the endogenous levels of FAP-1 by IκBαΔN was accompanied by positive effects on Fas-GFP translocation to the cell surface.
FIGURE 3. Super-stable inhibitor IκBαΔN down-regulates FAP-1 expression and up-regulates surface Fas-GFP expression.
A, putative NF-κB-binding elements in the FAP-1 gene regulatory region are indicated. B, TIG3 cells were transfected by the empty vector pCMV4 or by expression construct encoding super-stable IκBαΔN; corresponding changes in the endogenous FAP-1 mRNA levels following transfection of IκBαΔN were determined with RT-PCR; normalization was based on glyceraldehyde-3-phosphate dehydrogenase (GAPDH) levels. C, Western blot analysis of overexpressed IκBαΔN (detected with Ab against C-terminal IκB) and of endogenous FAP-1 levels has been performed 24 h after transfection; actin was used as a protein loading control. D, NF-κB p65-p50 DNA-binding activity (determined by electrophoretic mobility shift assay) was substantially suppressed in the presence of overexpressed IκBαΔN (FP, free oligonucleotide probe). E, cotransfection of Fas-GFP expression construct with IκBαΔN expression construct (which blocked FAP-1 expression) resulted in the notable increase of Fas-GFP translocation to the surface of TIG3 cells that was determined by staining TIG3 cells with anti-Fas-PE mAb and the subsequent flow cytometry; ‘High’ and ‘Low’ indicate positions of the cell subpopulations with high and low levels of surface expression of Fas receptor; MFI values (±S.D. of parallel repeats) are indicated. Results of typical experiment from three independent experiments are presented. F, NF-κB p65-p50 DNA-binding activity (determined by electrophoretic mobility shift assay) was partially suppressed in the presence of overexpressed IκBαΔN in LU1205 cells (FP, free oligonucleotide probe). G, cotransfection of Fas-GFP expression construct with IκBαΔN expression construct resulted in the notable increase of Fas-GFP translocation to the surface of LU1205 cells that was determined by staining LU1205 cells with anti-Fas-PE mAb and subsequent flow cytometry. Data of one typical experiment (from three independent experiments) are presented.
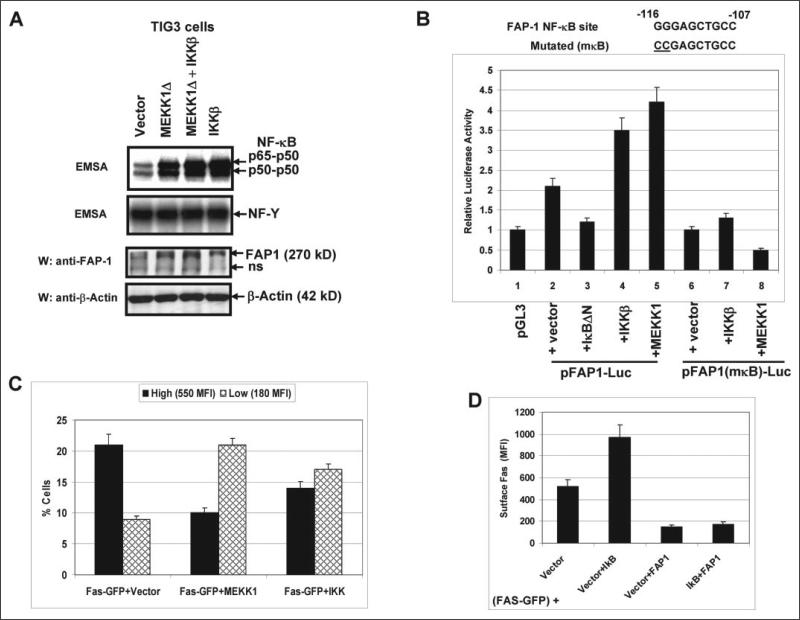
To further determine the role of NF-κB in the regulation of FAP-1 gene expression, we performed transfection and overexpression of permanently active IκB kinase, IKKβ S178E/S181E, or MEKK1Δ (both kinases are effective activators of NF-κB (31, 45), and MEKK1Δ, which is an upstream activator of the IKK complex, also activates the MAPK pathways) in TIG3 cells. This procedure induced the up-regulation of the NF-κB p65-p50 DNA-binding activity as well as endogenous FAP-1 levels (Fig. 4A). To determine whether NF-κB directly regulates FAP-1 promoter activity, the proximal promoter (a 0.5-kb fragment starting near ATG+1) was cloned in a pGL3-basic reporter (19). The promoter activity was analyzed using a standard luciferase assay, which showed a relatively small increase (2-fold) of the basic reporter activity driven by the cloned promoter; furthermore, the reporter activity was notably up-regulated by IKKβ or MEKK1Δ expression constructs (producing an additional 2-fold increase). However, this increase was abolished by the mutation of the NF-κB site in the FAP-1 region (Fig. 4B). Our data demonstrated that the NF-κB-dependent up-regulation of FAP-1 protein was primarily dependent on the promoter activity. This resulted in the down-regulation of Fas-GFP translocation (determined by FACS analysis), because the percentage of cells with high surface Fas levels notably decreased after transfection with the NF-κB activators (Fig. 4C). Taken together with the experiments on negative regulation of FAP-1 expression by IκBαΔN, these results undoubtedly demonstrate a role of NF-κB in the FAP-1 gene transcriptional regulation. Furthermore, NF-κB-mediated up-regulation of FAP-1 levels may quite possibly be a special mechanism that could restrict Fas surface levels in advanced cancers. To determine any additional FAP-1-independent NF-κB-dependent effects on signaling pathways controlling Fas trafficking, we transfected TIG3 cells with pEF-Fas-GFP in the presence of pCMVIκBΔN or pCMV-FAP-1 alone or both in combination. IκBΔN expression did not change the negative effects of FAP-1 on Fas-GFP translocation (Fig. 4D), excluding a role for an FAP-1-independent, NF-κB-dependent pathway in Fas trafficking.
FIGURE 4. NF-κB activation by IKKβ or MEKK1Δ up-regulates FAP-1 expression.
A, transfection and overexpression of IKKβ S178E/S181E or MEKK1Δ in TIG3 cells up-regulated the NF-κB DNA-binding activity and increased endogenous FAP-1 levels; non-inducible NF-Y DNA-binding activity served as loading control. B, regulation of pFAP1-Luc reporter activity by inhibitor and activators of the NF-κB activity; the FAP-1 gene intron 1 contains several putative binding sites for transcription factors, including SP-1, NF-κB, AP-1, and STATs; a 0.5-kb fragment of this region was cloned in the pGL3-basic reporter; a standard luciferase reporter assay was performed for wild-type or NF-κB-mutated reporter constructs in the presence of indicated regulators of NF-κB activity. C, NF-κB-dependent down-regulation of Fas-GFP translocation has been determined by FACS analysis; the percentages of gated cells in the regions with high and low Fas surface expression and their MFI are indicated. Error bars represent mean ± S.D. from three independent experiments. D, overexpression of IκBαΔN did not affect exogenous FAP1-dependent down-regulation of Fas-GFP translocation. TIG3 cells were transfected with pEF-Fas-GFP together with four different combinations of expression constructs: pCMV4 (vector), pCMV4-IκBΔN plus pCMV4, pCMV4-FAP1 plus pCMV4, and pCMV4-FAP1 plus pCMV4-IκBΔN. Surface Fas expression has been determined by FACS analysis using anti-Fas-PE mAb. Error bars represent mean ± S.D. from three independent experiments.
Opposite Roles of Dynamin and FAP-1 in the Regulation of Fas Translocation
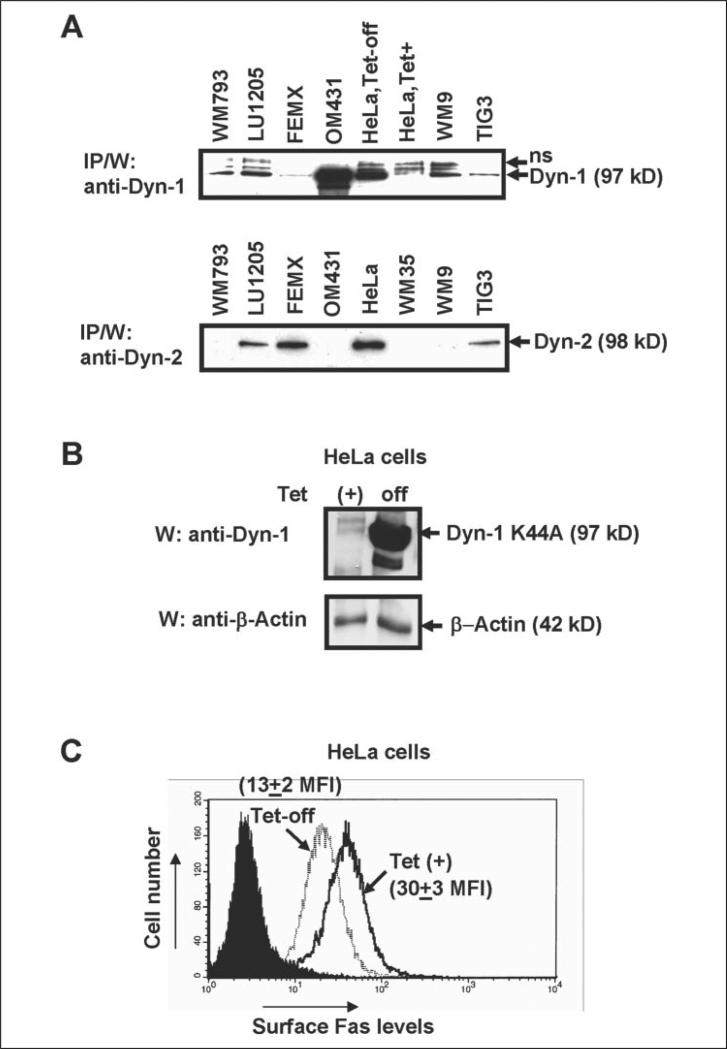
The subsequent events of Fas protein trafficking in the cell include translocation from the endoplasmic reticulum to the Golgi, and then to the plasma membrane via the TGN. The general role of the large GTPase dynamin-2 (Dyn-2) in the post-Golgi trafficking has been previously postulated (20, 21). Dynamin-2 is a ubiquitous protein, whereas dynamin-1 is more characteristic for cells of the nervous system; however, both dynamins are implicated in the regulation of clathrin-mediated endocytosis (46, 47). It was also shown that either Dyn-1 K44A- or Dyn-2 K44A-mutated proteins might serve as a dominant-negative regulator of functions for both dynamin-1 and dynamin-2 (48). Based on these general considerations, using immunoprecipitation and subsequent Western analysis, we have determined the expression levels of both forms of dynamin in TIG3 fibroblasts, as well as in several lines of human melanomas. HeLa Tet-off cell system (which produced Dyn-1) has been used as a positive control (48) (Fig. 5A). Interestingly, TIG3 cells contain both dynamins at relatively low levels. Some melanoma lines contain mostly Dyn-1 (WM793, WM9, and OM431 cells) or both Dyn-1 and Dyn-2 (LU1205 cells); finally FEMX cells contain, as a rule, only Dyn-2. We were unable to demonstrate a direct protein-protein interaction between dynamins and Fas, or dynamins and FAP-1 using immunoprecipitation followed by Western blot analysis, although we cannot exclude a possibility of such interactions.
FIGURE 5. Dominant-negative dynamin-1 K44A down-regulates Fas surface expression.
A, levels of endogenous dynamin-1 (Dyn-1) or dynamin-2 (Dyn-2) in the indicated cell lines were determined using immunoprecipitation with anti-Dyn-1 or anti-Dyn-2 mAbs followed by Western blot analysis with the same mAbs; human melanoma lines, TIG3 fibroblasts and HeLa cells with Tet-off control of Dyn-1 K44A expression were used. B and C, HeLa Tet-off system for controlled expression of Dyn-1 K44A has been used; overexpression of Dyn-1 K44A (24 h after tetracycline withdrawn) has resulted in down-regulation of endogenous surface Fas receptor expression, which was determined by FACS analysis. Results of typical experiment from four independent experiments are presented.
To investigate the effects of dominant-negative dynamin on the endogenous surface Fas levels, we first used the HeLa Tet-off system combined with the inducible production of dominant-negative Dyn-1 K44A (48) (Fig. 5B). Dyn-1 K44A induction by tetracycline withdrawal was accompanied by a pronounced down-regulation of the endogenous Fas expression on the cell surface (decrease in MFI from 30 to 13) (Fig. 5C). Hence, dynamin (probably, the ubiquitous dynamin-2, which is present at high levels in HeLa; see Fig. 5A) plays a positive regulatory role in Fas trafficking. Furthermore, transient transfection of TIG3 cells with Dyn-1 K44A was accompanied by decreasing endogenous levels of surface Fas expression (data not shown).
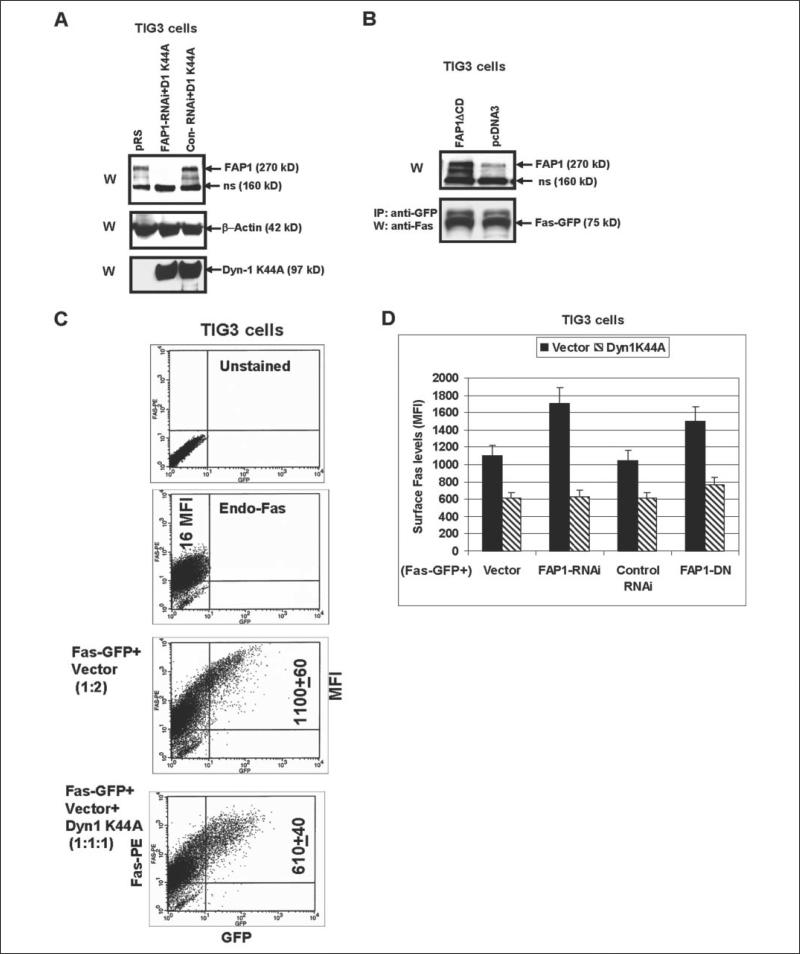
To successfully elucidate functional interference between FAP-1 and dynamins in the regulation of Fas export, TIG3 cells have been transfected by the Fas-GFP expression vector in combination with either dominant-negative Dyn-1K44A (which suppressed function of both dynamins) or FAP-1 RNAi expression construct. Some TIG3 cells were transfected by FAS-GFP and both Dyn1K44A and FAP-1 RNAi (Fig. 6A). Surface expression of Fas-GFP was determined by staining with anti-Fas-PE mAb and flow cytometry. Dyn-1 K44A effectively decreased levels of Fas surface expression (MFI dropped almost 2-fold after 48 h); in contrast, FAP-1 RNAi (by inhibiting FAP-1) increased these levels: from 1100 to 1700 MFI. Finally, a triple transfection of Fas-GFP together with Dyn-1 K44A and FAP-1 RNAi still caused the down-regulation of surface Fas levels, indicating that dynamin is critically important for the Fas export and operates downstream of FAP-1 (Fig. 6, C and D). Similar results have been obtained when we used FAP-1ΔCD dominant-negative construct (for the effective suppression of FAP-1 function) and dominant-negative Dyn-1K44A (Fig. 6, B and D). Once again, FAP-1ΔCD and Dyn-1 K44A had opposite effects on the Fas-GFP export; however, the combined treatment still resulted in the down-regulation of Fas translocation to the cell surface (Fig. 6D). Taken together, these data indicate that the suppression of the function of dynamin remains an effective method of blocking Fas export in the cell, despite releasing Fas from FAP-1 interaction.
FIGURE 6. Functional interaction of FAP-1 and dynamin regulates Fas-GFP surface levels in TIG3 cells.
A, TIG3 cells were transfected by empty vector pRS, combinations of pRS-FAP-1 RNAi with Dyn-1 K44A or control RNAi with Dyn-1 K44A; Western blot analysis was performed for detection FAP-1 and Dyn-1 K44A levels 48 h after transfection. B, TIG3 cells were transiently transfected with the empty vector pcDNA3 or with the expression construct encoding dominant-negative FAP-1ΔCD in the presence of Fas-GFP expression vector; levels of Fas-GFP were determined by IP/W, whereas levels of (FAP-1 plus FAP1ΔCD) were determined by direct Western analysis 48 h after transfection. C and D, TIG3 cells were transfected with Fas-GFP in the indicated combinations of the empty vector, FAP-1 RNAi, control RNAi, Dyn-1 K44A, and FAP1-DN (FAP-1ΔCD). FACS analysis of TIG3 cells was performed 48 h after transfection, and cells were stained with anti-Fas-PE mAb and analyzed by the flow cytometry. Results of one typical experiment (C) and of three independent experiments (D) are presented. Error bars represent mean ± S.D. from three independent experiments.
Regulation of Surface Fas Levels and FasL-mediated Apoptosis in Melanoma
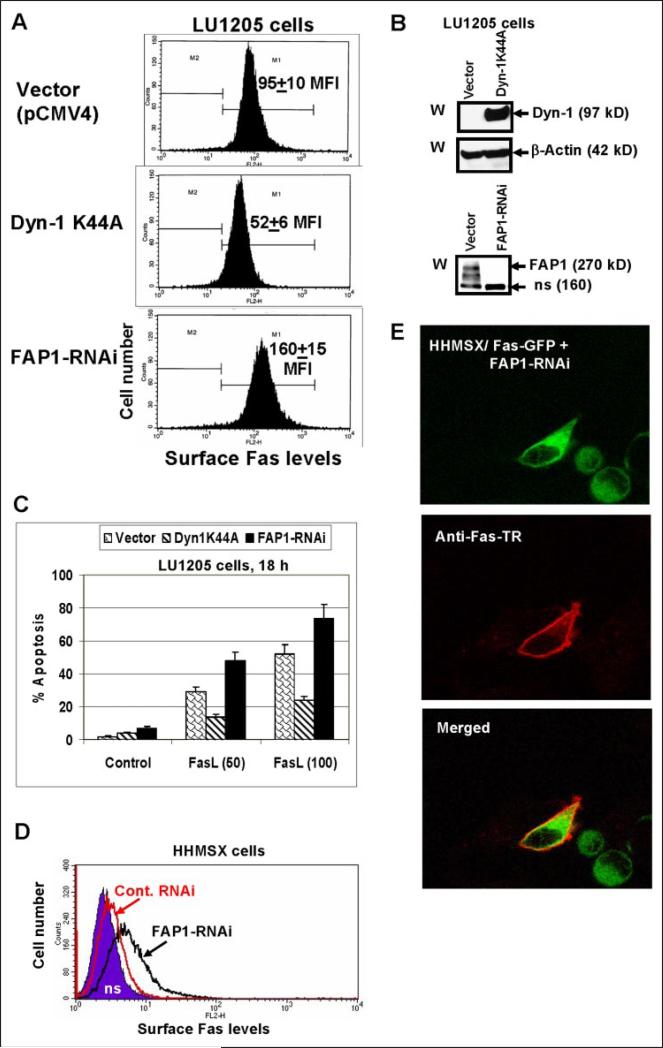
To find physiological consequences of the Fas export regulation by dynamin, we established LU1205 human melanoma cell lines (mass cultures) that have been stably transfected either with dominant-negative Dyn-1 K44A or Dyn-2 K44A; LU1205 cells stably transfected with the FAP-1 RNAi construct have been also generated. Melanoma cells transfected with Dyn-1 K44A showed a decrease, whereas those transfected with FAP1-RNAi (which effectively down-regulated FAP-1 levels) showed an up-regulation of endogenous surface Fas expression (Fig. 7, A and B). Established LU1205 melanoma lines responded to recombinant FasL (50 ng/ml and 100 ng/ml, respectively) and cycloheximide (1 μg/ml) treatment by the induction of apoptosis, which was proportional to pre-existing Fas levels (Fig. 7C).
FIGURE 7. Regulation of surface Fas expression and susceptibility to the Fas-mediated apoptosis by dynamin and FAP1 in melanoma cells.
A, LU1205 melanoma cells were stably transfected with either Dyn-1 K44A or FAP1 RNAi expression constructs; surface Fas expression in transfected cell lines was determined by FACS analysis; MFI is indicated. B, Western blot analysis of Dyn-1 and FAP1 levels in transfected LU1205 cells. C, apoptosis was induced by soluble FasL (50–100 ng/ml) and cycloheximide (1 μg/ml) treatment for 18 h; apoptosis levels were determined using propidium iodide staining of DNA and the flow cytometry. Error bars represent mean ± S.D. from three independent experiments. D and E, Fas-GFP-fused protein translocation to the cell surface in HHMSX cells. HHMSX melanoma cells were transiently transfected with a pEF-Fas-GFP and FAP-1 RNAi or pEF-Fas-GFP and control RNAi constructs and analyzed 40 h after transfection. Surface Fas expression was determined by using anti-Fas-PE mAb and FACS analysis (D). Confocal analysis of Fas-GFP-fused protein (green) and surface Fas expression (red; using primary anti-Fas mAb and secondary Ab labeled with Texas Red) was performed for the determination of subcellular localization (E).
Highly aggressive HHMSX human melanoma cells have very low Fas cell-surface expression and, consequently, were convenient for studying the regulation of Fas export. We observed previously that transfected Fas-GFP was maintained in the cytoplasm of HHMSX melanoma cells due to interaction with endogenous FAP-1. Transient cotransfection of these cells with Fas-GFP and FAP-1-RNAi (2:1) resulted in Fas translocation to the cell surface detected by FACS analysis 40 h after transfection (Fig. 7D). Furthermore, 20 –30% of GFP-positive cells became surface Fas-positive, as was demonstrated by microscopy using anti-Fas mAb and the secondary Ab labeled with Texas Red (Fig. 7E).
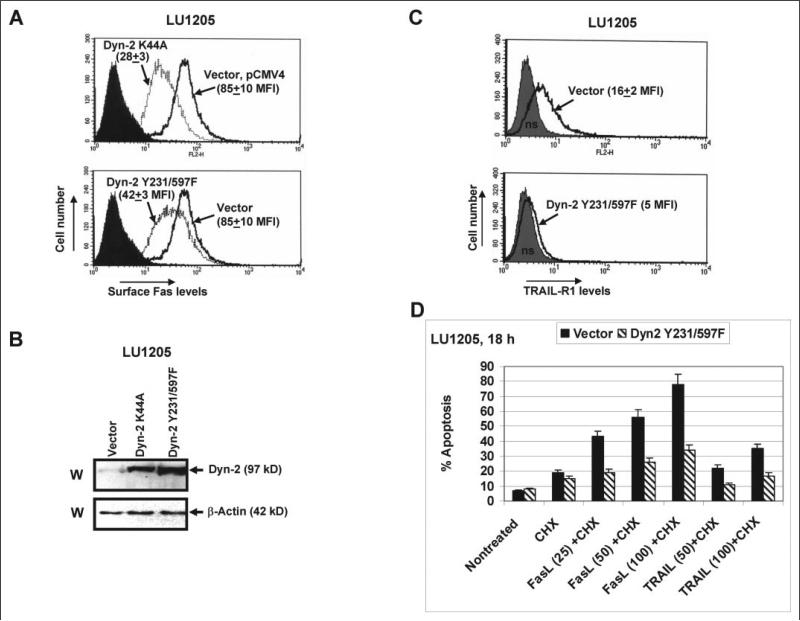
Dyn-2 K44A affects Fas expression in a way very similar to that of Dyn-1 K44A; double mutant Dyn-2 Y231F/Y597F was less effective for down-regulation of surface Fas expression (Fig. 8A). These results provide further evidence of a regulatory role of dynamins in the Golgi/TGN-mediated Fas export to the cell surface. As expected, dynamin-2 plays a more universal role in the regulation of death receptor translocation to the cell surface. Indeed, LU1205 cells stably transfected with either Dyn-2 K44A or Dyn-2 Y231F/Y597F demonstrated negative regulation of surface expression of both death receptors, Fas and TRAIL-R1, even when the basal levels of surface TRAIL-R1 were relatively low (Fig. 8 A-C). Treatment of established melanoma lines with recombinant FasL (25–100 ng/ml) or TRAIL (50 –100 ng/ml, in combination with cycloheximide, 1 μg/ml) induced apoptosis, which was proportional to the surface level of the correspondent receptor. Negative effects of dominant-negative Dyn-2 on apoptosis were observed for both types of treatments (Fig. 8D). Taken together, these data demonstrated a supplementary level of regulation in surface expression of Fas receptor by dynamin, which could change a susceptibility of cancer cells to apoptosis; and, therefore, may be critically important for a future development of effective anti-cancer treatment.
FIGURE 8. Regulation of surface Fas expression and susceptibility to the Fas- and TRAIL-R1-mediated apoptosis by dynamin-2 in melanoma cells.
A, LU1205 melanoma cells were stably transfected with either the empty vector pCMV4 or Dyn-2 K44A or Dyn-2 Y231F/Y597F expression constructs; surface Fas expression in transfected cell lines was determined by FACS analysis; MFI is indicated. B, Western blot analysis of Dyn-2 levels in indicated transfected cell lines using anti-Dyn-2 mAb. C, surface TRAIL-R1 expression in transfected cell lines was determined by FACS analysis; MFI is indicated. D, apoptosis levels were determined 18 h after treatments with recombinant FasL (25–100 ng/ml) and recombinant TRAIL (50–100 ng/ml) together with cycloheximide (CHX, 1 μg/ml) using propidium iodide-staining DNA and flow cytometry. Error bars represent mean ± S.D. from three independent experiments.
Note that we can exclude the possibility that effects of dominant-negative dynamin K44A on Fas surface expression are based on the inhibition of endocytosis (rather than post-Golgi trafficking). This can be derived from the observation that phenylarsine oxide, an inhibitor of endocytosis (49), has stabilized and up-regulated surface levels of Fas (data not shown) in contrast to the effects of dominant-negative dynamin that have effectively decreased these levels.
DISCUSSION
Suppressed apoptotic signaling is a characteristic feature of advanced stages of cancer development that are driven by specific genetic and epigenetic mechanisms, including the down-regulation of surface expression of Fas death receptor (2, 15–17). The ambitious purpose of the numerous studies of anti-cancer treatment is to specifically up-regulate the susceptibility of cancer cells for the induction of apoptosis via restoration of surface expression of Fas death receptor and/or Fas-mediated signaling. Alternatively, an important acquired feature of advanced tumors is either the production of active FasL or, at least, the sequestering FasL in the cytoplasmic pools (50), which, in general, may facilitate restriction of anti-tumor immune response (51). However, the positive aspect of this is that the simultaneous induction of expression of Fas receptor and its ligand may create conditions for programmed suicide of cancer cells (52, 53).
In our present study, we are currently engaged in the investigation of Fas receptor export to the cell surface. Opposite roles of FAP-1 as an inhibitor of Fas export, and dynamins as general activators, allow us to quite precisely regulate levels of Fas expression on the cell surface. Dominant negative Dyn-1 K44A was shown to effectively suppress functions of both main dynamins, Dyn-1 and Dyn-2 (48). Dyn-2 K44A has demonstrated very similar effects in transfected LU1205 melanoma cells, which express both Dyn-1 and Dyn-2 (see Fig. 5A). An additional study, which could precisely distinguish the effects of the particular dynamins in the regulation of Fas trafficking in human melanomas, would be necessary.
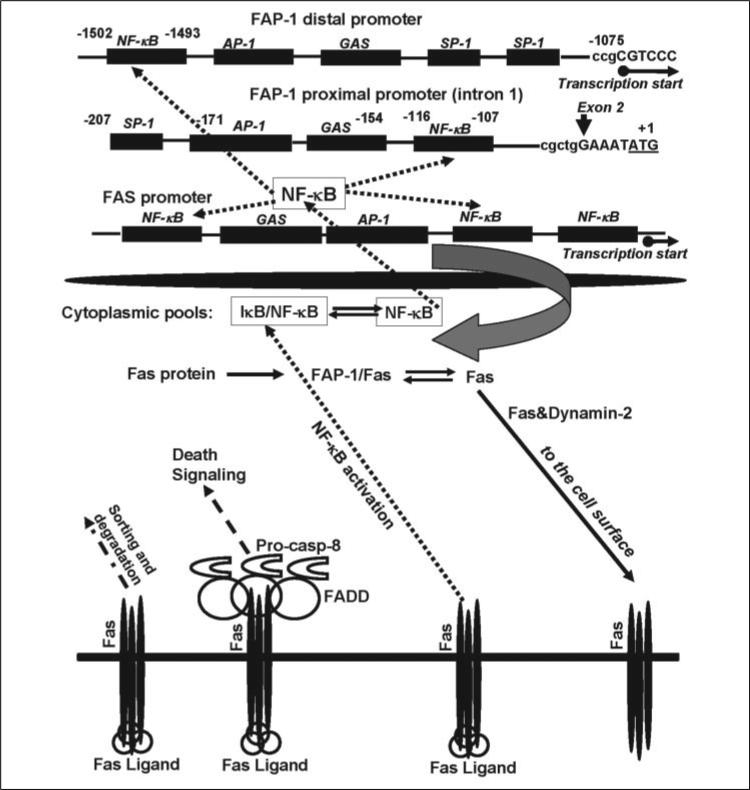
A specific known function of protein-tyrosine phosphatase FAP-1/PTPL1/PTP-BL is probably the regulation of insulin-induced signaling through the dephosphorylation of insulin growth factor receptor (54). Furthermore, FAP-1 may play the role of a scaffolding protein, at least, for two protein targets: Fas and the zyxin-related protein, TRIP6 (55). Note that the nuclear form of TRIP6 is a coactivator of NF-κB-dependent gene expression (56). Results of the current study demonstrate a critical role of transcription factor NF-κB in the regulation of FAP-1 gene expression. Taken together, these data indicate a potentially effective mechanism behind the regulation of the Fas export in the cells directed by the regulation of NF-κB signaling (Fig. 9). A critical feature of this regulation is the existence of, at least, two interfering processes: the NF-κB-dependent transcription of Fas gene and the NF-κB-dependent transcription of FAP-1 gene encoding a Fas-scaffolding protein. Both genes contain several NF-κB-binding sites in the gene promoters. NF-κB-mediated expression of FAP-1 protein may be a specific mechanism that could restrict Fas surface levels in advanced cancers. Both NF-κB and its coactivator, TRIP6, are present in their non-active forms within the cytoplasm, in the complexes with IκB (57) and FAP-1 (55), respectively. These factors (NF-κB and TRIP6) could be translocated into the nucleus upon signal-dependent activation. Conversely, FAP-1 can bind Fas protein with suppression of its trafficking to the cell surface, while dynamin-2, as a general regulator of post-Golgi trafficking (20), facilitates Fas translocation. The emerging picture of the regulation of surface Fas expression becomes even more complicated, because FasL/Fas interaction may cause, especially in cancer cells, the induction of the NF-κB-activating signals (15) additionally to the main TNFα/TNFR1,2-mediated NF-κB signaling pathway (57). This may provide a supplementary feedback mechanism for restriction of Fas protein export via FAP-1 expression. Finally, endocytosis, sorting, and degradation of the Fas receptor are also involved in the regulation of its surface expression (58, 59).
FIGURE 9. The Fas cycle in the cell: the role of NF-κB in the regulation of the total and surface Fas expression.
NF-κB plays a dual role in the regulation of the surface Fas expression by controlling transcription of both genes: Fas and a suppressor of Fas protein export, FAP-1. Both genes contain the NF-κB-binding sites in their promoters. Dynamin-2 facilitates Fas translocation from the Golgi and TGN to cell surface. Finally, FasL/Fas interaction, in addition to the canonical induction of death signaling, may induce the NF-κB signaling pathway, up-regulating FAP-1 gene expression with subsequent restriction of the Fas export to the cell surface. (See an additional description of this figure under “Discussion.”)
Furthermore, it was quite obvious that NF-κB was not the only transcription factor involved in FAP-1 regulation. For example, the oncogenic transcription factor, EWS-FL11, has been recently implicated in control of FAP-1 transcription in Erwing sarcoma (39). Our preliminary experiments have also indicated a negative role of c-Jun (but not of Stat3) in the regulation of the FAP-1 proximal promoter activity (data not shown).
One of the important results of the present study was the generation of melanoma cells with increased surface expression of the Fas receptor, based on the suppression of FAP-1 expression by a specific RNAi. A subsequent treatment of these cells with soluble FasL resulted in the induction of apoptosis of these cancer cells. Furthermore, induced surface expression of the endogenous Fas Ligand in these Fas-positive melanomas was also accompanied by massive cell death.3
Acknowledgments
We thank Dr. B. A. Osborne for discussion; Drs. M. Herlyn and O. Fodstad for the melanoma cell lines; Dr. S. L. Schmid for Tet-off HeLa cells expressing dynamin-1 K44A; Dr. T. A. Sato for anti-FAP1 antibody and plasmids; Drs. Y. Daaka and A. N. Shajahan for plasmid constructs; and Drs. S. Y. Fuchs and A. Chan for critical reading of the manuscript.
Footnotes
This work was supported by National Institutes of Health Grant ES 11804, Superfund Grant P42 ES 10349, and Environmental Center Grant P30 ES 09089. We have no financial conflicts of interest. The costs of publication of this article were defrayed in part by the payment of page charges. This article must therefore be hereby marked “advertisement” in accordance with 18 U.S.C. Section 1734 solely to indicate this fact.
The abbreviations used are: TNFα, tumor necrosis factor α; TNFR, tumor necrosis factor receptor; AP-1, activator protein 1; ATF2, activating transcription factor 2; ERK, extra-cellular signal-regulated kinase; FAP-1, Fas associated phosphatase 1; GFP, green fluorescent protein; IκB, inhibitor of NF-κB; IKK, inhibitor nuclear factor κB kinase; JNK, Jun N-terminal kinase; MAPK, mitogen-activated protein kinase; MEK, MAPK kinase; MFI, medium fluorescence intensity; NF-κB, nuclear factorκB; TRAIL, TNF-related apoptosis-inducing ligand; FasL, Fas ligand; Dyn-2, dynamin-2; FACS, fluorescence-activated cell sorting; mAb, monoclonal antibody; CMV, cytomegalovirus; RNAi, RNA interference; TGN, trans-Golgi network; BFA, Brefeldin A; STAT, signal transducers and activators of transcription.
V. N. Ivanov, Z. Ronai, and T. K. Hei, unpublished observations.
REFERENCES
- 1.Nagata S. Annu. Rev. Genet. 1999;33:29–55. doi: 10.1146/annurev.genet.33.1.29. [DOI] [PubMed] [Google Scholar]
- 2.Debatin KM, Krammer PH. Oncogene. 2004;23:2950–2966. doi: 10.1038/sj.onc.1207558. [DOI] [PubMed] [Google Scholar]
- 3.Zheng Y, Ouaaz F, Bruzzo P, Singh V, Gerondakis S, Beg AA. J. Immunol. 2001;166:4949–4957. doi: 10.4049/jimmunol.166.8.4949. [DOI] [PubMed] [Google Scholar]
- 4.Ivanov VN, Ronai Z. Oncogene. 2000;19:3003–3012. doi: 10.1038/sj.onc.1203602. [DOI] [PubMed] [Google Scholar]
- 5.Chan H, Bartos DP, Owen-Schaub LB. Mol. Cell. Biol. 1999;19:2098–2108. doi: 10.1128/mcb.19.3.2098. [DOI] [PMC free article] [PubMed] [Google Scholar]
- 6.Ivanov VN, Bhoumik A, Krasilnikov M, Raz R, Owen-Schaub LB, Levy D, Horvath CM, Ronai Z. Mol. Cell. 2001;7:517–528. doi: 10.1016/s1097-2765(01)00199-x. [DOI] [PubMed] [Google Scholar]
- 7.Maecker HL, Yun Z, Maecker HT, Giaccia AJ. Cancer Cell. 2002;2:139–148. doi: 10.1016/s1535-6108(02)00095-8. [DOI] [PubMed] [Google Scholar]
- 8.Gingras AC, Raught B, Sonenberg N. Genes Dev. 2001;15:807–826. doi: 10.1101/gad.887201. [DOI] [PubMed] [Google Scholar]
- 9.Reinehr R, Schliess F, Haussinger D. FASEB J. 2003;17:731–733. doi: 10.1096/fj.02-0915fje. [DOI] [PubMed] [Google Scholar]
- 10.Dorrie J, Sapala K, Zunino SJ. Cytokine. 2002;18:98–107. doi: 10.1006/cyto.2002.1030. [DOI] [PubMed] [Google Scholar]
- 11.Ivanov VN, Lopez Bergami P, Maulit G, Sato TA, Sassoon D, Ronai Z. Mol. Cell. Biol. 2003;23:3623–3635. doi: 10.1128/MCB.23.10.3623-3635.2003. [DOI] [PMC free article] [PubMed] [Google Scholar]
- 12.Ungefroren H, Kruse ML, Trauzold A, Roeschmann S, Roeder C, Arlt A, Henne-Bruns D, Kalthoff H. J. Cell Sci. 2001;114:2735–2746. doi: 10.1242/jcs.114.15.2735. [DOI] [PubMed] [Google Scholar]
- 13.Sato T, Irie S, Kitada S, Reed JC. Science. 1995;268:411–415. doi: 10.1126/science.7536343. [DOI] [PubMed] [Google Scholar]
- 14.Haynes AP, Daniels I, Abhulayha AM, Carter GI, Metheringham R, Gregory CD, Thomson BJ. Br. J. Haematol. 2002;118:488–494. doi: 10.1046/j.1365-2141.2002.03643.x. [DOI] [PubMed] [Google Scholar]
- 15.Peter ME, Legembre P, Barnhart BC. Biochim. Biophys. Acta. 2005;1755:25–36. doi: 10.1016/j.bbcan.2005.01.001. [DOI] [PubMed] [Google Scholar]
- 16.Schulze-Bergkamen H, Krammer PH. Semin. Oncol. 2004;31:90–119. doi: 10.1053/j.seminoncol.2003.11.006. [DOI] [PubMed] [Google Scholar]
- 17.Ivanov VN, Bhoumik A, Ronai Z. Oncogene. 2003;22:3152–3161. doi: 10.1038/sj.onc.1206456. [DOI] [PubMed] [Google Scholar]
- 18.Yoshida S, Harada H, Nagai H, Fukino K, Teramoto A, Emi M. J. Hum. Genet. 2002;47:614–619. doi: 10.1007/s100380200094. [DOI] [PubMed] [Google Scholar]
- 19.Irie S, Li Y, Kanki H, Ohyama T, Deaven LL, Somlo S, Sato TA. DNA Seq. 2001;11:519–526. doi: 10.3109/10425170109041336. [DOI] [PubMed] [Google Scholar]
- 20.Cao H, Weller S, Orth JD, Chen J, Huang B, Chen JL, Stamnes M, McNiven MA. Nat. Cell Biol. 2005;7:483–492. doi: 10.1038/ncb1246. [DOI] [PubMed] [Google Scholar]
- 21.Cao H, Thompson HM, Krueger EW, McNiven MA. J. Cell Sci. 2000;113:1993–2002. doi: 10.1242/jcs.113.11.1993. [DOI] [PubMed] [Google Scholar]
- 22.Satyamoorthy K, DeJesus E, Linnenbach AJ, Kraj B, Kornreich DL, Rendle S, Elder DE, Herlyn M. Melanoma Res. 1997;7(Suppl. 2):S35–S42. [PubMed] [Google Scholar]
- 23.Li G, Kalabis J, Xu X, Meier F, Oka M, Bogenrieder T, Herlyn M. Oncogene. 2003;22:6891–6899. doi: 10.1038/sj.onc.1206819. [DOI] [PubMed] [Google Scholar]
- 24.Li G, Satyamoorthy K, Herlyn M. Cancer Res. 2001;61:3819–3825. [PubMed] [Google Scholar]
- 25.Berking C, Takemoto R, Schaider H, Showe L, Satyamoorthy K, Robbins P, Herlyn M. Cancer Res. 2001;61:8306–8316. [PubMed] [Google Scholar]
- 26.Myklebust AT, Helseth A, Breistol K, Hall WA, Fodstad O. J. Neurooncol. 1994;21:215–224. doi: 10.1007/BF01063770. [DOI] [PubMed] [Google Scholar]
- 27.van Dam H, Huguier S, Kooistra K, Baguet J, Vial E, van der Eb AJ, Herrlich P, Angel P, Castellazzi M. Genes Dev. 1998;12:1227–1239. doi: 10.1101/gad.12.8.1227. [DOI] [PMC free article] [PubMed] [Google Scholar]
- 28.Ahn S, Maudsley S, Luttrell LM, Lefkowitz RJ, Daaka Y. J. Biol. Chem. 1999;274:1185–1188. doi: 10.1074/jbc.274.3.1185. [DOI] [PubMed] [Google Scholar]
- 29.Ahn S, Kim J, Lucaveche CL, Reedy MC, Luttrell LM, Lefkowitz RJ, Daaka Y. J. Biol. Chem. 2002;277:26642–26651. doi: 10.1074/jbc.M201499200. [DOI] [PubMed] [Google Scholar]
- 30.Shajahan AN, Timblin BK, Sandoval R, Tiruppathi C, Malik AB, Min-shall RD. J. Biol. Chem. 2004;279:20392–20400. doi: 10.1074/jbc.M308710200. [DOI] [PubMed] [Google Scholar]
- 31.Zandi E, Rothwarf DM, Delhase M, Hayakawa M, Karin M. Cell. 1997;91:243–252. doi: 10.1016/s0092-8674(00)80406-7. [DOI] [PubMed] [Google Scholar]
- 32.Minden A, Lin A, McMahon M, Lange-Carter C, Derijard B, Davis RJ, Johnson GL, Karin M. Science. 1994;266:1719–1723. doi: 10.1126/science.7992057. [DOI] [PubMed] [Google Scholar]
- 33.Damke H, Binns DD, Ueda H, Schmid SL, Baba T. Mol. Biol. Cell. 2001;12:2578–2589. doi: 10.1091/mbc.12.9.2578. [DOI] [PMC free article] [PubMed] [Google Scholar]
- 34.Nicoletti I, Migliorati G, Pagliacci MC, Grignani F, Riccardi C. J. Immunol. Methods. 1991;139:271–279. doi: 10.1016/0022-1759(91)90198-o. [DOI] [PubMed] [Google Scholar]
- 35.Ivanov V, Fleming TJ, Malek TR. J. Immunol. 1994;153:2394–2406. [PubMed] [Google Scholar]
- 36.Itoh N, Yonehara S, Ishii A, Yonehara M, Mizushima S, Sameshima M, Hase A, Seto Y, Nagata S. Cell. 1991;66:233–243. doi: 10.1016/0092-8674(91)90614-5. [DOI] [PubMed] [Google Scholar]
- 37.Erdmann KS. Eur. J. Biochem. 2003;270:4789–4798. doi: 10.1046/j.1432-1033.2003.03895.x. [DOI] [PubMed] [Google Scholar]
- 38.Meinhold-Heerlein I, Stenner-Liewen F, Liewen H, Kitada S, Krajewska M, Krajewski S, Zapata JM, Monks A, Scudiero DA, Bauknecht T, Reed JC. Am. J. Pathol. 2001;158:1335–1344. doi: 10.1016/S0002-9440(10)64084-9. [DOI] [PMC free article] [PubMed] [Google Scholar]
- 39.Abaan OD, Levenson A, Khan O, Furth PA, Uren A, Toretsky JA. Oncogene. 2005;24:2715–2722. doi: 10.1038/sj.onc.1208247. [DOI] [PubMed] [Google Scholar]
- 40.Yao H, Song E, Chen J, Hamar P. Br. J. Cancer. 2004;91:1718–1725. doi: 10.1038/sj.bjc.6602136. [DOI] [PMC free article] [PubMed] [Google Scholar]
- 41.Karin M, Cao Y, Greten FR, Li ZW. Nat. Rev. Cancer. 2002;2:301–310. doi: 10.1038/nrc780. [DOI] [PubMed] [Google Scholar]
- 42.Orlowski RZ, Baldwin AS., Jr. Trends Mol. Med. 2002;8:385–389. doi: 10.1016/s1471-4914(02)02375-4. [DOI] [PubMed] [Google Scholar]
- 43.Kumar A, Takada Y, Boriek AM, Aggarwal BB. J. Mol. Med. 2004;82:434–448. doi: 10.1007/s00109-004-0555-y. [DOI] [PubMed] [Google Scholar]
- 44.Brockman JA, Scherer DC, McKinsey TA, Hall SM, Qi X, Lee WY, Ballard DW. Mol. Cell. Biol. 1995;15:2809–2818. doi: 10.1128/mcb.15.5.2809. [DOI] [PMC free article] [PubMed] [Google Scholar]
- 45.Lee FS, Hagler J, Chen ZJ, Maniatis T. Cell. 1997;88:213–222. doi: 10.1016/s0092-8674(00)81842-5. [DOI] [PubMed] [Google Scholar]
- 46.Praefcke GJ, McMahon HT. Nat. Rev. Mol. Cell. Biol. 2004;5:133–147. doi: 10.1038/nrm1313. [DOI] [PubMed] [Google Scholar]
- 47.Conner SD, Schmid SL. Nature. 2003;422:37–44. doi: 10.1038/nature01451. [DOI] [PubMed] [Google Scholar]
- 48.Altschuler Y, Barbas SM, Terlecky LJ, Tang K, Hardy S, Mostov KE, Schmid SL. J. Cell Biol. 1998;143:1871–1881. doi: 10.1083/jcb.143.7.1871. [DOI] [PMC free article] [PubMed] [Google Scholar]
- 49.Kato Y, Sato H, Ichikawa M, Suzuki H, Sawada Y, Hanano M, Fuwa T, Sugiyama Y. Proc. Natl. Acad. Sci. U. S. A. 1992;89:8507–8511. doi: 10.1073/pnas.89.18.8507. [DOI] [PMC free article] [PubMed] [Google Scholar]
- 50.Houston A, O'Connell J. Curr. Opin. Pharmacol. 2004;4:321–326. doi: 10.1016/j.coph.2004.03.008. [DOI] [PubMed] [Google Scholar]
- 51.Igney FH, Krammer PH. J. Leukoc. Biol. 2002;71:907–920. [PubMed] [Google Scholar]
- 52.Arai H, Gordon D, Nabel EG, Nabel GJ. Proc. Natl. Acad. Sci. U. S. A. 1997;94:13862–13867. doi: 10.1073/pnas.94.25.13862. [DOI] [PMC free article] [PubMed] [Google Scholar]
- 53.Aoki K, Akyurek LM, San H, Leung K, Parmacek MS, Nabel EG, Nabel GJ. Mol. Ther. 2000;1:555–565. doi: 10.1006/mthe.2000.0076. [DOI] [PubMed] [Google Scholar]
- 54.Villa F, Deak M, Bloomberg GB, Alessi DR, van Aalten DM. J. Biol. Chem. 2005;280:8180–8187. doi: 10.1074/jbc.M412211200. [DOI] [PubMed] [Google Scholar]
- 55.Cuppen E, van Ham M, Wansink DG, de Leeuw A, Wieringa B, Hendriks W. Eur. J. Cell Biol. 2000;79:283–293. doi: 10.1078/S0171-9335(04)70031-X. [DOI] [PubMed] [Google Scholar]
- 56.Kassel O, Schneider S, Heilbock C, Litfin M, Gottlicher M, Herrlich P. Genes Dev. 2004;18:2518–2528. doi: 10.1101/gad.322404. [DOI] [PMC free article] [PubMed] [Google Scholar]
- 57.Karin M, Lin A. Nat. Immunol. 2002;3:221–227. doi: 10.1038/ni0302-221. [DOI] [PubMed] [Google Scholar]
- 58.Gonzalez-Gaitan M, Stenmark H. Cell. 2003;115:513–521. doi: 10.1016/s0092-8674(03)00932-2. [DOI] [PubMed] [Google Scholar]
- 59.Eramo A, Sargiacomo M, Ricci-Vitiani L, Todaro M, Stassi G, Messina CG, Parolini I, Lotti F, Sette G, Peschle C, De Maria R. Eur. J. Immunol. 2004;34:1930–1940. doi: 10.1002/eji.200324786. [DOI] [PubMed] [Google Scholar]


