

Abstract
Economically important traits in many species generally show polygenic, quantitative inheritance. The components of genetic variation (additive, dominant and epistatic effects) of these traits conferred by multiple genes in shared biological pathways remain to be defined. Here, we investigated 11 full-length genes in cellulose biosynthesis, on 10 growth and wood-property traits, within a population of 460 unrelated Populus tomentosa individuals, via multi-gene association. To validate positive associations, we conducted single-marker analysis in a linkage population of 1,200 individuals. We identified 118, 121, and 43 associations (P< 0.01) corresponding to additive, dominant, and epistatic effects, respectively, with low to moderate proportions of phenotypic variance (R2). Epistatic interaction models uncovered a combination of three non-synonymous sites from three unique genes, representing a significant epistasis for diameter at breast height and stem volume. Single-marker analysis validated 61 associations (false discovery rate, Q ≤ 0.10), representing 38 SNPs from nine genes, and its average effect (R2 = 3.8%) nearly 2-fold higher than that identified with multi-gene association, suggesting that multi-gene association can capture smaller individual variants. Moreover, a structural gene–gene network based on tissue-specific transcript abundances provides a better understanding of the multi-gene pathway affecting tree growth and lignocellulose biosynthesis. Our study highlights the importance of pathway-based multiple gene associations to uncover the nature of genetic variance for quantitative traits and may drive novel progress in molecular breeding.
Keywords: Chinese white poplar (Populus tomentosa), epistasis, pathway-based multiple gene association, transcript profiling, validation population
1. Introduction
Trees have unique features that distinguish them from most herbaceous species, including large sizes, long lifespans and woody, perennial growth. Many tree species occur in widely distributed populations that harbour a wealth of diversity.1 Large, diverse tree populations can be exploited for breeding to improve economically important properties. In addition, deciphering the mechanisms by which forest trees have adapted to their changing environments is an intriguing research problem. Tree growth and wood formation are complex dynamic processes that require coordinate regulation of diverse metabolic pathways in the whole plant.2,3 Improving economically important traits in trees by molecular marker-assisted selection (MAS) will require improving our understanding of the molecular mechanisms underlying phenotypic variation, particularly for traits with complex genetic architecture, such as wood properties or growth. Research has been hindered by trees' large size, long generation times, and the lack of mutants for reverse genetic approaches.1,4
As an alternative approach, recent work has examined complex traits in trees by forward genetic methods, such as quantitative trait loci (QTL) and association mapping of genes or alleles underlying quantitative traits.5 Single-marker association studies have identified candidate functional single-nucleotide polymorphisms (SNPs) that explain a small proportion of the additive variation (≤5% on average) in growth or wood properties, and many of these genes have not been cloned in full length yet.6–10 It is well known that genes do not work in isolation; instead, complex cellular pathways and molecular networks are often involved in phenotypic variation.11 Variation in quantitative traits includes additive, dominant, and epistatic effects that are conferred by multiple variants within interactive genes in different biological pathways.11,12 The complete effects of genetic variation for multiple full-length genes [including promoter, introns, untranslated regions (UTRs), and exons] in related biological pathways remain to be addressed in forest trees. Multi-gene association models take advantage of large numbers of SNPs in population-wide linkage disequilibrium (LD) with QTL regions harbouring functional loci affecting complex traits.13 Studies using multi-gene association may identify genetic variants that jointly have significant effects but individually make only a small contribution.13,14
Our previous studies using single-marker association (i.e. mixed linear models15) have identified sites of SNPs in several candidate genes that located in close proximity to the causal polymorphisms or even the functional variant itself for growth and wood-property traits.16–19 To extend these observations, this study investigates the nature of genetic variance (additive, dominant, and epistatic effects) for 11 full-length candidate genes related to cellulose biosynthesis in 10 quantitative traits, using multi-gene association, as well as haplotype-based association approaches, in a population of 460 unrelated individuals of Populus tomentosa. To verify the most significant associations, we conducted single-marker analysis in a family-based linkage population consisting of 1,200 individuals. Moreover, tissue-specific transcript abundances of these genes provide a better understanding of the multi-gene network, affecting tree growth and lignocellulose biosynthesis.
2. Materials and methods
2.1. Population materials and phenotypic data
The discovery population (association population) consisted of 460 24-yr-old unrelated individuals, representing almost the entire natural distribution range of P. tomentosa, i.e. Southern region, Northwestern region, and Northeastern region (30–40°N, 105–125°E). Plants were randomly sampled in 2009 from a collection of 1,047 natural P. tomentosa in Guan Xian County, Shandong Province, China (36°23′N, 115°47′E) and used for the initial multi-gene association (Supplementary Table S1, Du et al.12). In addition, 40 unrelated individuals were randomly selected from this association population and used to identify SNPs.
To confirm the association results identified in the discovery population, a validation population (linkage population) consisting of 1,200 hybrid individuals were randomly selected from 5,000 F1 progeny established by controlled crossing between clone ‘YX01’ (Populus alba× Populus glandulosa) as the female and clone ‘LM 50’ (P. tomentosa) as the male. The progeny were planted in 2008 in the Xiao Tangshan horticultural fields, Beijing, China (40°2′N, 115°50′E) using a randomized complete block design with three replications per genotype.
Ten growth and wood-property traits were scored for all individuals in the two populations, using at least three replications per genotype. The growth traits were tree height, diameter at breast height (DBH), and stem volume. The wood-property traits were holocellulose, α-cellulose, hemicellulose, and lignin content (chemical composition), and fibre length, fibre width, and microfibre angle (physical properties) (Supplementary data S1–S2). The detailed sampling and measurement methods, and phenotypic variance for these 10 traits in the two populations were conducted as previously described.17,20 Pearson's correlations for these 10 phenotypic traits were shown in Supplementary data S3.
2.2. RNA extraction and cDNAs identification
Thirty ramets of 1-yr-old P. tomentosa clone ‘LM50’ were selected and planted at Xiao Tangshan horticultural fields, Beijing, China (40°2′N, 115°50′E). A piece of bark was peeled off from the main stem at ∼1.0 m height of 1-yr-old P. tomentosa clone ‘LM50’ using a chisel. The newly formed xylem (∼3 mm thick) was first removed from the exposed surface, and then mature xylem was collected by further scraping into the stem at ∼2 mm thick; finally, the collected samples were placed into 50-ml Falcon tubes filled with liquid nitrogen and stored in a freezer at −80°C until RNA extraction.21 Using the Plant Qiagen RNeasy kit, total RNA from the stem xylem tissues was extracted and then reverse transcribed into cDNA with the SuperScript First-Strand Synthesis system (Life Technologies, Carlsbad, CA, USA). The stem xylem cDNA library was constructed using the Superscript λ System (Life Technologies, Rockville, MD, USA). The detailed procedures for constructing the cDNA library were previously described by Li et al.21 In our study, the cDNA library consisted of 5.0 × 10⁶ pfu with an insert size range of 1.0–4.0 kb. By random end-sequencing of 30,000 cDNA clones and comparison with all sequences in NCBI (http://www.ncbi.nlm.nih.gov), we chose 11 cDNAs with high similarities to Arabidopsis or Populus trichocarpa sequences to examine the relationship with lignocellulosic biosynthesis (Supplementary Table S2). All cDNA sequences chosen were deposited in GenBank (accession numbers shown in Supplementary Table S2).
2.3. DNA extraction and full-length genomic DNA identification
Using the DNeasy Plant Mini kit (Qiagen China, Shanghai), total genomic DNA was extracted from fresh young leaves. For sequencing the full-length genomic DNA sequences, specific primers were designed based on each cDNA sequence. PCR amplification was performed according to Zhang et al.22 All the genomic DNA of candidate genes were obtained by direct sequencing of both strands, using conserved T7 and SP6 primers in the BigDye Terminator Cycle Sequencing Kit (version 3.1; Applied Biosystems, Foster City, CA, USA) and a 4300 DNA Analyzer (Li-Cor Biosciences, Lincoln, NE, USA). Full-length genomic DNA sequences of all 11 candidate genes were isolated by PCR amplification from the P. tomentosa LM50 clone (Supplementary Table S2). Of these, five of these genes were previously reported in single-marker association studies (Supplementary Table S2). Also, these 11 full-length gene sequences were deposited in GenBank (accession numbers shown in Supplementary Table S2).
2.4. Tissue-specific expression analysis
Fresh tissues (root, stem phloem, stem cambium, developing xylem, mature xylem, expanding leaf, expanded leaf, and apex) were sampled from 1-yr-old plants of P. tomentosa (clone LM50). Developing xylem tissues were collected by scraping the thin (∼1.0 mm) and partially lignified layer on the exposed xylem surface of main stems at the 1.0 m height of plant, and the liquid stem cambium was collected from the exposed xylem surface as described previously.21 The main root (5 cm in length), expanding leaf (the 2–3rd leaf from the stem top), expanded leaf (the 5–6th leaf), and the final shoot apex (2–3 mm in length) were immediately collected from 1-yr-old P. tomentosa clone ‘LM50’. The extraction of RNA from various fresh tissues and the reverse transcription into cDNA was used for testing of tissues-specific transcript abundance for all 11 candidate genes. Real-time quantitative PCR (RT–qPCR) was performed on a 7500 Fast Real-Time PCR System (ABI) using the LightCycler-FastStart DNA master SYBR Green I kit (Roche). The qPCR program and the real-time amplification reaction were performed as described by Du et al.16 All reactions were performed in triplicate technical and triplicate biological repetitions, respectively. The melting curve was used to check the specificity of the amplified fragments, and all data were analysed using the Opticon Monitor Analysis software 3.1 tool (Bio-Rad, USA), following the manual protocol. The results obtained for the different tissues were standardized to the levels of Actin gene (the internal control). The specific primer pairs were individually designed to target the 3′ UTR of each gene, using Primer Express 3.0 software (Applied Biosystems) (Supplementary Table S3). Mean value and standard deviation (s.d.) for expression data of all repetitions in each set was determined using SPSS Statistics Version 19.0 (SPSS Inc., Chicago, IL, USA) (Details not shown).
To better understand the co-expression interactions among these candidate genes, Pearson's correlations between each pair of genes were determined for all 11 genes, according to their tissue-specific transcript abundances in SPSS Statistics, version 19.0. A structural network representing significant gene–gene correlations was visualized using the NodeXL Excel Template, version 1.0.1.238 (http://nodexl.codeplex.com/).
2.5. SNP discovery and genotyping
To identify SNPs, full-length genomic DNA of all 11 candidate genes were sequenced and aligned among 40 unrelated individuals from the association population of P. tomentosa, without considering insertions/deletions (INDELs). All 440 sequences were deposited in GenBank (Supplementary Table S4). Sequence alignments and manual editing were performed as described by Du et al.17 Next, all common SNPs (minor allele frequency ≥0.05) identified were genotyped using the Beckman Coulter (Franklin Lakes, NJ, USA) sequencing system.
2.6. Nucleotide diversity and LD
Diploid sequences were phased into haplotypes with the Phase v. 2.1, using 10,000 iterations of the Bayesian Markov Chain Monte Carlo (MCMC) Model.23 We then used alignments of these 40 phased haplotypes for each gene to estimate the number of segregating sites, nucleotide diversity, neutrality tests, and the pattern of codon usage with DnaSP version 5.10.24 Nucleotide diversity was estimated using the average number of pairwise differences per site (π)25,26 and the number of segregating sites (θw).27 Neutrality test statistics, Tajima's D,28 and Fu and Li's D,29 were calculated using data for the whole population with 10,000 coalescent simulations. The pattern of codon usage was measured using relative synonymous codon usage (RSCU).30
The squared correlation of allele frequencies (r2)31 between each pair of common SNPs (frequency ≥ 0.05) within candidate genes was calculated with 105 permutations, using TASSEL Ver. 2.0.1 (http://www.maizegenetics.net/). To assess the extent of LD within the sequenced gene regions, the decay of LD with physical distance (base pairs) within each candidate locus and over all candidate genes was estimated in 10,000 permutations of the data by non-linear regression.32 Singletons were excluded in the LD analyses. This analysis was done both within the three climatic regions and for the complete data set.
2.7. Association analysis
2.7.1. Multi-SNP additive and dominance models
fGWAS, version 2.0 (http://statgen.psu.edu/software/fgwas-soft.html, Li et al.33), in R (http://cran.r-project.org/) was used to conduct multi-SNP association analyses. For each trait, the genotyping data for all common SNPs and their genomic positional information were identified and standardized using PLINK version 1.07 (http://pngu.mgh.harvard.edu/~purcell/plink/res.shtml). This software is a Bayesian hierarchical model and use a MCMC algorithm to simultaneously fit and estimate the possible additive and dominant effects associated with all SNPs. The proportion of the phenotypic variance (R2) explained by each particular SNP was estimated in the models. Positive dominance represents that the phenotypic mean value observed within the heterozygous class is higher than the average phenotypic mean across both homozygous classes based on Least Squares Means, whereas negative dominance was opposite (not a recessive lethal). To address the total phenotypic variance accounted for by all trait-associated SNPs on a trait-by-trait basis, we calculated a ‘cumulative R2’ metric. These values were obtained by the difference in R2 between full and reduced models.34 The details were referenced according to McKown et al.35
2.7.2. Multi-SNP epistasis models
A multifactorial dimensionality reduction (MDR) method36 that was designed specifically for detecting and characterizing non-additive interactions (i.e. epistasis). The ReliefF algorithm was applied to filter all unlinked SNPs (r2 < 0.1 or different genes) to the best five loci for each trait that provide the greatest signal with 100 nearest neighbours. MDR was applied to assess all two-way to five-way models for the five significant filtered SNPs. Finally, an independent assessment of epistasis was performed using entropy-based measures of information gain.37 Specifically, a new measure model of three-way epistasis that adjusts for lower order effects was used to examine high-order non-additive interactions.38
2.7.3. Haplotype-based association models
All high-LD haplotypes (r2≥ 0.70, P≤ 0.001) were estimated for each gene, and their frequencies were determined using HaploView version 4.2 (http://www.broad.mit.edu/mpg/haploview.html). Singleton alleles and haplotypes with a frequency <5% were discarded when constructing the haplotypes. Haplotype-based association tests with phenotypic traits were performed using the Haplo.stats package in R,39 and significances of the haplotype associations were identified based on 104 permutation tests. The input consisted of genotype matrices, phenotype matrices, and structure analysis matrices (Q) to correct for population structure.40 In this analysis, the Q matrix was identified according to the optimal subpopulation structure in our association population.41 Corrections for multiple testing of smoothed P-values for all associations were performed using the false discovery rate (FDR) through QVALUE.42 A q-value of 0.10 was considered as the significance threshold.
2.7.4. Single-marker linkage analysis
On the basis of significant SNPs identified above, gene sequences were compared between hybrid parents, and SNP markers that segregated in the 1,200 F1 progeny were selected. Inheritance tests of these SNPs were examined in the linkage population by performing a χ2 test at 0.01 probability, and SNPs following Mendelian expectations were used in single-marker analysis using PLINK version 1.07. The same FDR method was used to correct for multiple tests.42
3. Results
3.1. Tissue-specific transcript profiling
To provide insights into gene interactions and functions in the biological pathway, we examined transcript accumulation for 11 candidate genes in various tissues and organs of P. tomentosa, including root, stem, and leaf (Fig. 1A). We found that the 11 genes exhibited distinct, but partially overlapping patterns of expression. Most genes were preferentially expressed in the developing xylem and mature xylem, with moderate expression in the cambium region and expanded leaves (Fig. 1A). For example, in the stem of P. tomentosa, Cellulose synthase 7 (PtoCesA7), UDP-glucose dehydrogenase 1 (PtoUGDH1), and S-adenosine-l-homocysteine-hydrolase 1 (PtoSAHH1) transcripts were most abundant in the developing and mature xylems, with moderate abundance in the cambium. PtoCesA7 and PtoUGDH1 were also preferentially expressed in roots (Fig. 1A), whereas PtoCesA3 and UDP-glucuronate decarboxylase 1 (PtoUXS1) were highly expressed in the apex (Fig. 1A). PtoUXS1 were most abundant in expanded leaves.
Figure 1.

Tissue-specific transcript profiling and a correlation network of 11 candidate genes in Populus tomentosa. (A) Relative transcript levels of 11 candidate genes in different tissues and organs of P. tomentosa. Expression levels were normalized to the Actin gene; Apex, apical shoot meristem, the error bars represent ±standard deviation (SD). (B) A gene–gene correlation network was constructed, on the basis of comparison and correlation analyses of transcription abundances among these genes. Solid lines represent positive correlations and dashed lines represent negative correlations; the thickness of each line indicates the strength/significance of correlations, P < 0.05 level of significance (thin lines), P < 0.01 (thick lines). Data were log-transformed before Pearson's correlation.
Next, we constructed gene–gene correlation networks using the patterns of tissue-specific expression of these 11 candidate genes and identified 20 positive or negative gene–gene correlations (P ≤ 0.05, Supplementary Table S5) that make up a highly interrelated network (Fig. 1B). Of these gene pairs, PtoCesA3 and Sucrose synthase 1 (PtoSUS1) (P ≤ 0.01, R = −0.938), PtoSAHH1 and PtoSAHH2 (P ≤ 0.01, R = 0.959), and PtoCesA4 and Endo-1,4-β-glucanase 1 (PtoGH9A1) (P ≤ 0.01, R = 0.952) showed highly significant correlations (Supplementary Table S5).
3.2. SNP discovery and nucleotide diversity
We first used a re-sequencing approach to identify SNPs in all 11 candidate genes. By sequencing the 11 full-length genes from 40 unrelated individuals encompassing nearly the entire natural range of P. tomentosa, we identified 2,114 SNPs in the c. 47,300 bp sequenced, with an average density of one SNP per 25 bp. Of these SNPs, c. 44.0% (930) were common sites (frequency ≥ 0.05) (Supplementary Table S4). The SNPs were not evenly distributed, with the number of SNPs per gene ranging from 59 to 388 (average, 192), consistent with varying levels of nucleotide diversity among genes (Supplementary Table S4). Using sequences from the P. trichocarpa reference as an out-group, a survey of the single-base mutation types indicated that C : T changes were the most abundant (38.6%), followed by A : G changes (30.4%), and overall SNPs the ratio of transitions to transversions was 2.23.
Within the coding regions of all 11 genes (22,098 bp total sequence), the average non-synonymous nucleotide diversity (dN) was ∼5-fold lower than the synonymous nucleotide diversity (dS), and the dN/dS ratio was <1 for all exons, indicating strong purifying selection at non-synonymous sites at these Populus genes.22 To investigate the extent of codon bias in P. tomentosa, we calculated RSCU values for all types of codons and found that the 11 candidate genes show similar patterns of RSCU (Supplementary Fig. S1). Most of the preferred codons end with U, but A and G were also less commonly found in the third position in these genes. Previous studies indicated that codon bias (with C or G ending codons) is expected to be strongest for highly expressed genes.34 Thus, our observation may be consistent with low expressed values for all these genes (Fig. 1A). More work is needed to sort these issues out in P. tomentosa. The values of Fu and Li's D statistical tests were negative for all genes, with four significant departures observed in the whole population (P≤ 0.05, Supplementary Table S4), revealing an excess of low-frequency polymorphisms in the species-wide samples.
3.3. SNP genotyping and LD
We selected a set of 651 common SNPs that met the quality control thresholds and that had genotype frequencies consistent with Hardy–Weinberg equilibrium (Supplementary data S4). The percentage of successfully genotyped SNPs that were found in non-coding regions of the genes was 75.4%, distributed within introns (45.4%), 5′ UTRs (16.9%), and 3′ UTRs (13.1%). Remaining SNPs were located in the coding regions, either at synonymous sites (18.5%) or at non-synonymous sites (6.1%).
Estimates of r2 values for all pairwise combinations of SNPs were pooled to assess the overall pattern of LD with physical distance (Fig. 2). The non-linear regression shows a clear and rapid decline of LD from 0.60 to 0.10 at a distance of ∼1,100 bp in the whole population (Fig. 2). Nevertheless, LD analyses within each geographical climatic region showed a much higher level of LD with the r2 values declining to 0.1 within c. 2,300 bp (Southern and Northeastern regions) and c. 3,400 bp (Northwestern region) (Fig. 2). We found a clear and rapid decline of LD with distance within each gene in the whole population, respectively (r2 ≥ 0.1, within c. 500–1,800 bp, Supplementary Fig. S2), indicating that LD does not extend over entire gene in the species.
Figure 2.
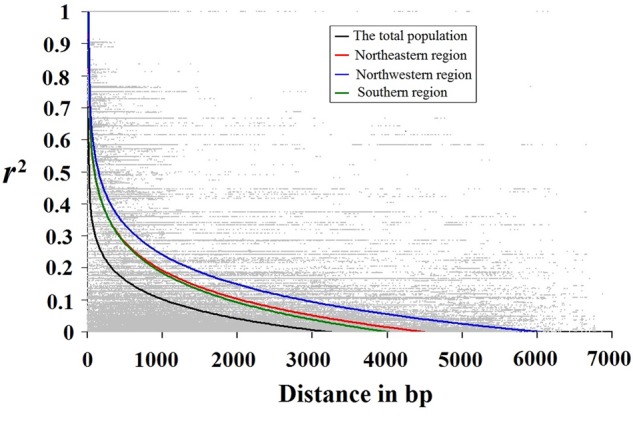
Decay pattern of LD in all Populus tomentosa samples and each climatic region. Decay of LD for all common SNP (minor allele frequency ≥ 5%) sites pooled across all analysed genes. Pairwise correlations between SNPs are plotted against the physical distance between the SNPs in base pairs. The curves describe the non-linear regressions of r2 (Er2) onto the physical distance in base pairs. The details of three climatic regions are shown in Supplementary Table S1.
3.4. Multi-SNP association under additive, dominance, and epistasis models
We first employed Bayesian hierarchical models, emphasizing multi-SNP additive and dominant effects for each quantitative trait, and uncovered a multitude of genetic associations, including some not previously found by single-marker methods (Supplementary Table S6). Some particular SNP-trait associations detected previously were examined in this case; for example, a non-synonymous substitution in exon3 of PtoCesA4 (PtoCesA4_1914) was shown to be in strong association with α-cellulose.17 We then constructed a structural network to visually represent all 123 associations (P < 0.01) between all 10 growth and wood-property traits and 93 unique SNPs (Fig. 3). The 93 loci were not evenly distributed among all 11 genes, with a range from 1 (PtoBGlu1, β-1,4-glucosidase) to 19 (PtoUXS1). 37.6% of the 93 loci were distributed in coding regions, and among these, 94.3% of the associations contained a combination of additive and dominant effects (Supplementary Table S6).
Figure 3.

A structural network that represents all significant associations (P < 0.01) in the association population of Populus tomentosa. All associations were identified between 10 growth and wood-property traits and 93 unique SNPs from 11 candidate genes using Bayesian hierarchical models. Different colours represent different genes with corresponding SNPs. The number of SNPs identified in each gene is shown in parentheses.
3.4.1. Multi-gene associations under the additive effect model
We detected 118 significant associations for a total of 92 unique SNPs within 11 genes associated with all 10 traits (Table 1 and Supplementary data S6). Total numbers of identified SNP-trait associations varied across trait categories, and the association numbers of associations for wood chemical compositions, wood physical properties, and growth traits were 40, 38, and 40, respectively. SNP markers explained between 0.5 and 6.6% of the phenotypic variation (average R2 = 2.3%; Supplementary Table S6). Twenty-four of the 92 SNP markers exhibited significant associations with at least two traits (Supplementary Table S6). Although the association result does not indicate which SNPs may be causal, 11 of these 92 unique SNPs represent amino acid replacement (non-synonymous) polymorphisms (Supplementary Table S6). For each trait, the number of significant SNPs ranged from 8 to 16, which captured a small to moderate fraction (17.0–36.0%) of the additive variation when considered jointly (Table 1, Fig. 4).
Table 1.
Summary of the additive effect and phenotypic contribution rate (R2) of all significant SNPs for each trait in the Populus tomentosa association population
| Trait | Number of candidate genes | Number of SNPs | Range of additive effect (%) | Range of R2 (%) | Total R2 (%)a |
|---|---|---|---|---|---|
| Lignin (%) | 6 | 8 | 0.477–2.391 | 0.8–5.5 | 21.9 |
| Holocellulose (%) | 6 | 12 | 0.472–3.876 | 0.7–4.1 | 28.1 |
| Hemicellulose (%) | 5 | 8 | 0.263–1.876 | 0.9–3.1 | 17.0 |
| α-Cellulose (%) | 7 | 12 | 0.833–3.228 | 0.5–5.7 | 31.7 |
| Fibre length (mm) | 7 | 13 | 0.007–0.143 | 0.9–6.6 | 36.0 |
| Fibre width (µm) | 5 | 9 | 0.150–1.458 | 0.8–6.1 | 24.9 |
| Microfibre angle (MFA, °) | 7 | 16 | 0.073–2.535 | 0.6–3.6 | 30.0 |
| Diameter at breast height (DBH, cm) | 5 | 11 | 0.372–4.788 | 0.5–3.2 | 24.0 |
| Tree height (m) | 8 | 16 | 0.192–1.621 | 0.8–3.5 | 33.1 |
| Stem volume (m3) | 5 | 13 | 0.074–0.902 | 0.7–4.0 | 25.0 |
See Supplementary Table S6 for further details of these association results under additive models; significance level for association (significance is P ≤ 0.01).
Total R2 was calculated according to McKown et al.35
Figure 4.

Low-to-moderate phenotypic contribution rate (R2) explained for growth and wood properties in Populus tomentosa. The line and bar denote the numbers and phenotypic contribution rate (R2) of the list of SNPs identified for each trait under additive and dominant models, respectively. All SNPs were identified using the Bayesian hierarchical models in fGWAS, version 1.0 (http://statgen.psu.edu/software/fgwas-soft.html) in R (http://cran.r-project.org/).
Correspondingly, each trait was associated with variation in at least five candidate genes (Table 1). Furthermore, we identified three genes (PtoCesA4, PtoCesA7, and PtoSAHH2) that were associated to all four wood chemical compositions. (Supplementary Table S6). For wood physical properties, SNP-trait associations were identified for four genes (PtoCesA3, PtoCesA4, PtoSUS1, and PtoUXS1) that were associated with all three traits. In addition, PtoCesA7 and PtoSAHH2 were associated with fibre length and microfibre angle (Supplementary Table S6). Additive models found nine genes with SNPs associated with variation in growth traits; of these, two genes (PtoCesA3 and PtoUXS1) with SNPs associated across all three growth traits, as well as identified with all three wood physical properties (Supplementary Tables S6). At least five SNPs within PtoUXS1 had associations to each growth trait. No significant SNP from PtoUGDH and PtoBGlu1 was associated with growth traits.
On the basis of these additive SNPs simultaneously associated to each trait (Supplementary Table S6), we identified phenotypic variation among possible genotype combinations for the same trait and some genotype combinations that may be useful for selection breeding. An example of multi-genotype combinations for lignin is shown in Fig. 5. Eight SNPs from six different genes were significantly associated with lignin content, with two associated SNPs from PtoGH9A1 showing low LD and hence representing independent associations.
Figure 5.

Phenotypic variations among the possible genotype combinations for lignin under multi-SNP additive models. (A) These eight allelic variants have significant additive effect with a small proportion of phenotypic variation (R2), ranging from 0.80 to 5.48%. Pairwise LD plots among multiple loci within each candidate genes were estimated using TASSEL Ver. 2.0.1(http://www.maizegenetics.net/). Genotype effect and the position/haplotype block of each allelic variant were shown for lignin content. (B) Twenty possible common combinations with a frequency ≥5% from the eight allelic variants were identified with various phenotypic variations on lignin content in the association population of Populus tomentosa. Some combinations were discarded, because the sample size was <10 individuals.
3.4.2. Multi-gene associations under the dominance model
Under the dominance model, we detected 121 significant associations, including 72 associations with positive dominance values and 49 with negative values, representing a total of 92 unique SNPs within the 11 genes across all three trait categories (10 traits) (Table 2 and Supplementary data S6). Of the 92 SNPs, ∼95% of the significant SNPs had both additive and dominant effects on all traits within each category (Supplementary Table S6). Many genes were repeatedly associated with multiple traits within/across trait categories, and different SNPs with different effects from the same gene were identified. A number of SNP associations with positive versus negative effect across the three trait categories were 25/16 for wood chemical compositions, 25/12 for wood physical properties, and 22/21 for growth traits (Table 2). When we considered dominant variation per trait by combining the positive and negative types, the total number of significant SNPs varied from 8 to 18, with the total R2 explained ranging from 1.8 to 13.0% (Fig. 4).
Table 2.
Summary of the dominant effect and phenotypic contribution rate (R2) of all significant SNPs for each trait in the Populus tomentosa association population
| Trait | Number of candidate genes | Number of SNPs | Range of dominance effect (%) | Range of dominant effect | Range of R2 (%) | Total R2 (%)a | Negative/positiveb |
|---|---|---|---|---|---|---|---|
| Lignin (%) | 6 | 6 | −1.347 to −0.125 | −1.347 to −0.125 | 0.6 to 2.0 | 7.2 | N |
| 3 | 3 | 1.579 to 2.192 | 1.579 to 2.192 | 2.4 to 3.5 | 9.0 | P | |
| Holocellulose (%) | 4 | 4 | −2.482 to −0.08 | −2.482 to −0.08 | 0.8 to 3.6 | 10.2 | N |
| 3 | 8 | 0.941 to 2.371 | 0.941 to 2.371 | 1.7 to 4.0 | 22.6 | P | |
| Hemicellulose (%) | 2 | 2 | −2.110 to −1.527 | −2.110 to −1.527 | 3.3 to 4.9 | 8.1 | N |
| 3 | 6 | 0.623 to 2.221 | 0.623 to 2.221 | 0.6 to 5.1 | 17.6 | P | |
| α-Cellulose (%) | 4 | 4 | −0.973 to −0.170 | −0.973 to −0.170 | 0.7 to 2.0 | 4.4 | N |
| 5 | 8 | 0.073 to 3.347 | 0.073 to 3.347 | 0.6 to 3.9 | 16.6 | P | |
| Fibre length (mm) | 4 | 4 | −0.043 to −0.009 | −0.043 to −0.009 | 0.9 to 2.5 | 6.6 | N |
| 4 | 8 | 0.008 to 0.071 | 0.008 to 0.071 | 0.6 to 4.5 | 17.1 | P | |
| Fibre width (µm) | 2 | 2 | −1.420 to −0.515 | −1.420 to −0.515 | 1.1 to 3.5 | 4.6 | N |
| 5 | 7 | 0.179 to 1.301 | 0.179 to 1.301 | 0.6 to 3.1 | 15.9 | P | |
| Microfibre angle (MFA, °) | 4 | 6 | −3.882 to −0.433 | −3.882 to −0.433 | 1.2 to 5.4 | 17.3 | N |
| 6 | 10 | 0.180 to 3.697 | 0.180 to 3.697 | 0.6 to 5.3 | 27.9 | P | |
| Diameter at breast height (DBH, cm) | 5 | 6 | −3.028 to −0.452 | −3.028 to −0.452 | 0.9 to 3.0 | 12.0 | N |
| 4 | 6 | 0.694 to 2.785 | 0.694 to 2.785 | 1.2 to 3.2 | 14.4 | P | |
| Tree height (m) | 6 | 8 | −2.341 to −0.126 | −2.341 to −0.126 | 0.7 to 4.4 | 17.0 | N |
| 7 | 10 | 0.202 to 2.303 | 0.202 to 2.303 | 1.0 to 4.9 | 30.0 | P | |
| Stem volume (m3) | 4 | 7 | −0.350 to −0.085 | −0.350 to −0.085 | 1.7 to 3.9 | 17.0 | N |
| 3 | 6 | 0.044 to 0.389 | 0.044 to 0.389 | 1.0 to 4.1 | 12.6 | P |
Significance level for association (significance is P≤ 0.01).
Total R2 was calculated according to McKown et al.35
N: negative dominant effect; P: positive dominant effect; see Supplementary Table S6 for further details of these association results under dominance models.
The 72 associations showing positive dominant effects represented 59 SNPs from 10 genes associating with all 10 traits. Of these, 22 SNPs were located in the coding regions, including 7 non-synonymous and 15 synonymous changes. A number of significant SNPs per gene varied from 1 to 11. For each trait, the number of SNPs ranged from 3 to 10, with total R2 explained ranging from 9.0 to 30.0% (Table 2). For the 49 associations showing negative dominant effects, we identified 44 loci from 10 genes that were significantly associated with 10 traits, with a small R2 explained per locus ranging from 0.6 to 5.4%, respectively. The number of significant SNP within each gene varied from 1 (PtoBGlu1) to 11 (PtoUXS1). A range of 2–8 SNPs with the negative dominant effects was found for each trait, with total variation explained ranging from 4.4% (α-cellulose) to 17.3% (microfibre angle) (Table 2). Ten SNPs from six genes that simultaneously have positive and negative dominant effects for different traits (Supplementary Table S6). For example, the synonymous SNP PtoSAHH2_285 had a negative dominant effect for lignin, while having a positive effect for holocellulose. Table 2 shows detailed descriptions of the genetic parameters for all traits under positive and negative dominant effects.
3.4.3. Multi-gene associations under the epistasis model
We used the MDR method (http://phg.mc.vanderbilt.edu/Software/MDR) to detect and characterize SNP–SNP epistasis associated with these traits (Supplementary Tables S7 and S8). We first applied the ReliefF algorithm to filter all unlinked SNPs (r2 < 0.1 or located in different genes) to identify significant 5 loci per trait. After correcting for multiple testing, we found 42 associations (Q ≤ 0.10) across nine traits. These associations represent 34 unique SNPs from seven genes with main effects varying from 0.1 to 7.5% (Supplementary Table S7). We found that 9 of the 34 unique SNPs observed in the epistasis models also showed significant additive and dominant effects. Using multi-way SNP–SNP interaction models for these filtered SNPs, we identified 58 significant SNP–SNP pairs where the epistatic interactions ranged from −7.0 to 0.9% (Supplementary Table S8). The majority of epistatic effects were found between unlinked loci located in different genes. We also detected epistatic effects among different SNPs within the same gene. For instance, two epistasis pairs consisting of three SNPs within PtoCesA4 were identified for fibre length, all with negative interaction values (Supplementary Table S8).
Three-way interaction model provided a combination of three non-synonymous loci (PtoCesA4_1914, PtoGH9A1_1936, and PtoGA20ox_632) from three unique genes, representing a significant epistatic interaction for DBH and stem volume, with three-way epistatic effects of −11.7 and −12.1% (Fig. 6A). Negative epistatic effects suggest redundancy between loci, meaning that these loci provide, in part, the same information for the traits.36 Figure 6B shows the mean values of phenotypic variances among all three genotype combinations. We investigated the nature of epistatic interactions among non-synonymous mutations, contributing to the phenotypic variation, in the three genes, and discovered that most of the variation is captured by combinatorial permutations of allelic variants at three loci (Fig. 6C). We identified the specific combinatorial patterns of amino acid replacements at these three loci, by comparing the expected values of eight combinations with high (H) or low (L) phenotypic values with the observed values of the specific combinatorial patterns (Fig. 6).
Figure 6.

Three-way epistatic interaction of a combination of three non-synonymous loci for DBH and stem volume. (A) Summary of information gain by main effects, pairwise effects, and the three-way effect for each of three non-synonymous loci (PtoCesA4_1914, PtoGH9A1_1936, and PtoGA20ox_632). (B) Phenotypic variation for each genotype combination from the three non-synonymous loci. High-phenotype values for genotype combinations are shaded in dark grey, and low values are shaded in light grey; the vertical lines/boxes represent the higher or lower phenotypic values of different genotype combinations than the average values of sum of three separate genotypes. (C) All combinatorial permutations of allelic variants of three non-synonymous loci. Two high-epistatic combinatorial patterns of amino acid replacements at these three loci were identified (shaded regions).
Overall, using multi-gene association models, we captured all three components of genetic variation conferred by multiple variants within candidate genes in cellulose biosyntheses pathway both within and across these three trait categories. In total, we identified 118, 121, and 43 associations consistent with additive, dominant, and epistatic effects, respectively (Supplementary Tables S6–S8). Also, we observed no differences in the magnitudes of additive and dominant effects between three trait categories (Tables 1 and 2). Some genes have extensive complexity in both genetic variation and the resulting phenotype, and numerous SNPs from different genes were associated across these three trait categories, suggesting that tree growth and wood biosynthesis are complex, dynamic processes that require the coordinate regulation of diverse sets of genes.2,3 Notably, our present investigation suggests that CesA members may have additional functional roles in tree growth and development, beyond the direct effects of the cellulose synthase subunits in biosynthesis of the cell wall. CesA members represent an interesting set of candidates for further study in trees.
3.5. Validation of association in the linkage population
To validate the associations identified above, we examined associations in a linkage population. From the 118 unique significant SNPs obtained by multi-SNP and MDR models (Supplementary Tables S6 and S7), we identified 109 common SNP markers that segregated in the 1,200 F1 progeny following Mendelian expectations (P ≥ 0.01, Supplementary data S5). We conducted 1,090 tests for association of these SNP with growth and wood-quality traits (109 SNPs × 10 traits) in the linkage population. After correction for multiple testing errors, we found 61 associations at the threshold of Q ≤ 0.10, representing 38 SNPs from nine genes that show associations with all 10 traits (Supplementary Table S9). These 38 unique SNPs included 5 non-synonymous, 15 synonymous, and 18 non-coding SNPs (Supplementary Table S9). Thirty SNPs were similarly detected by multi-SNP additive and dominance models in the discovery population, and nine loci were shared between the epistasis models and the single-marker analysis (Supplementary Tables S6 and S7). Most of the significant markers were identified for multiple traits with different genotypic effects; for example, PtoCesA4_1914 is associated with seven traits, and PtoGA20ox_632 with six (Supplementary Table S9). In addition, 28 (46.0%) associations identified in the validation population were similarly detected in the multi-SNP models (Supplementary Tables S6 and S9). For each trait, the number of SNPs ranged from 3 to 9, with marker effects that varied from 2.2 to 13.5% (Supplementary Table S9). Effect sizes for the SNPs analysed using single-marker linkage test were nearly 2-fold higher than effects identified using multi-SNP models (average R2 = 3.8%).
Correspondingly, each trait is associated with at least three candidate genes (Supplementary Table S9) using single-marker linkage analysis. With wood chemical composition, we identified two genes (PtoCesA4 and PtoCesA7) that were simultaneously associated with the content of all four polysaccharide traits. In addition, we identified that PtoGH9A1 was significantly associated with hemicellulose and lignin contents, whereas PtoCesA3 was associated with hemicellulose and α-cellulose content (Supplementary Table S9). Among wood physical properties and growth traits, SNP-trait associations identified two genes (PtoCesA4 and PtoGA20Ox) that were associated with all six traits. Furthermore, PtoUXS1 has SNPs associated with both DBH and stem volume traits, as well as two wood physical properties (fibre width and microfibre angle), consistent with the associations under multi-SNP models in our discovery population (Supplementary Tables S6 and S9). No SNPs from PtoUGDH1 and PtoBGlu1 were associated with any of the 10 phenotypic traits.
3.6. Haplotype-based association analysis
We identified 138 high-LD blocks (r2 ≥ 0.70, P ≤ 0.001), including 429 common haplotypes (frequency ≥ 5%) from the 11 candidate genes, with block sizes from 2 to 564 bp. The number of common haplotypes per block varied from 2 to 7, with an average of 3.0 (Table 3). The number of LD blocks and common haplotypes per gene varied from 4 to 20 and 15 to 60, respectively (Table 3). Haplotype-based association tests identified a total of 162 common haplotypes from 66 blocks at P ≤ 0.05 (Table 3 and Supplementary data S10). Using multiple test corrections, we found 39 significant blocks from 10 candidate genes, including 90 haplotypes, that associated with nine traits excluding stem volume (139 associations, Q ≤ 0.10); no significant haplotypes were found for PtoSAHH2. The number of blocks and haplotypes for each trait ranged from 2 to 12 and 5 to 33, respectively (Supplementary Table S11).
Table 3.
Summary of haplotype-based association analysis within 11 candidate genes for each trait in the Populus tomentosa association population
| Abbreviation of gene | Gene name | Number of LD block | Number of common haplotypesa | Length range of haplotype (bp) | Number of haplotypes (P ≤ 0.05)b | Number of haplotypes, FDR corrected [(Q) ≤ 0.10]c | Number of associated traits |
|---|---|---|---|---|---|---|---|
| PtoBGlu1 | β-1,4-glucosidase | 4 | 15 | 35–564 | 4 | 4 | 4 |
| PtoCesA3 | Cellulose synthase | 20 | 58 | 31–431 | 20 | 12 | 3 |
| PtoCesA4 | Cellulose synthase | 19 | 57 | 2–320 | 16 | 11 | 4 |
| PtoCesA7 | Cellulose synthase | 16 | 60 | 12–484 | 23 | 9 | 5 |
| PtoGA20Ox | GA20-oxidase | 9 | 30 | 52–246 | 10 | 7 | 2 |
| PtoGH9A1 | Endo-1,4-β-glucanase | 14 | 41 | 27–274 | 19 | 9 | 5 |
| PtoSAHH1 | S-adenosine-l-homocysteine-hydrolase | 8 | 30 | 60–202 | 11 | 6 | 1 |
| PtoSAHH2 | S-adenosine-l-homocysteine-hydrolase | 5 | 21 | 77–355 | 6 | 0 | 0 |
| PtoSUS1 | Sucrose synthase | 20 | 46 | 8–395 | 25 | 14 | 6 |
| PtoUGDH1 | UDP-glucose dehydrogenase | 7 | 28 | 47–192 | 8 | 8 | 3 |
| PtoUXS1 | UDP-glucuronate decarboxylase | 16 | 43 | 8–203 | 20 | 10 | 7 |
| Total | / | 138 | 429 | 2–564 | 162 | 90 | / |
/: not applied.
Common haplotype (frequency ≥ 0.05).
P-value = significance level for association (significance is P ≤ 0.05).
Q-value = a correction for multiple testing [FDR (Q) ≤ 0.10]; see Supplementary Tables S10 and S11 for further details of these haplotype-based association results.
Most of the significantly associated genes/blocks were shared among traits (Supplementary Table S11). For example, haplotypes belonging to PtoUXS1 were associated with seven traits. PtoCesA7 had haplotypes that were simultaneously associated with all four chemical composition traits. In addition, PtoUGDH1 with haplotypes were significantly associated with three chemical compositions, excluding α-cellulose content (Supplementary Table S11). PtoUXS1 had haplotypes that were associated with all three wood physical properties. Within the growth trait category, several significant haplotypes were identified within PtoUXS1 and PtoSUS1 that were associated with tree height and DBH. Examination of haplotypes may provide support for the SNP-based association.
On the basis of the significant blocks we identified within several genes for each trait (Supplementary Table S11), we identified four exclusive multi-haplotype combinations with numerous genetic variants for three traits—holocellulose, lignin, and tree height (Supplementary Fig. S3). Taking holocellulose content as example, we identified several combinations of multiple haplotypes from two significant blocks in PtoCesA4 and PtoGH9A1, with mean values from 66.725 to 75.321%, consistent with the two genes having significant correlation (P ≤ 0.01, R = 0.952) (Fig. 1B). In addition, eight unique haplotypes from four genes, showing specific (presence/absence) for different climatic regions of the natural population of P. tomentosa, were associated with five traits, respectively (Table 4). For fibre width, two haplotypes (C-A-G and T-A-G) from PtoSUS1 and PtoBGlu1 were exclusively found in the Northwestern region, and were associated with higher fibre width (Supplementary Table S11).
Table 4.
List of climatic region-specific haplotypes significantly associated with wood quality and growth traits in Populus tomentosa after correction for multiple testing [FDR (Q) ≤ 0.10]
| Trait | P-value | Q-value | Amplicon | Significant haplotypes | NE | S | NW | Haplotype frequency | Phenotypic variation (mean ± SE) |
|---|---|---|---|---|---|---|---|---|---|
| Holocellulose | 0.0010 | 0.0273 | PtoBGlu1_4972-4990-5014-5164 | C-G-G-C | - | + | - | 0.050 | 68.200 ± 0.090 |
| Hemicellulose | 0.0010 | 0.0273 | PtoCesA3_555-571 | T-C | + | + | - | 0.050 | 36.905 ± 1.605 |
| A-C | + | + | - | 0.325 | 29.232 ± 1.431 | ||||
| Fibre length | 0.0001 | 0.0160 | PtoBGlu1_5408-5417-5443 | T-A-G | + | - | - | 0.050 | 1.2920 ± 0.047 |
| 0.0001 | 0.0160 | PtoUXS1_1678-1685-1707-1848-1862-1884-1899- 1913-1914-2125-2131-2198-2221-2303 | G-G-T-G-C-C-T-T-G-A-T-C-A-G | + | - | - | 0.111 | 1.3077 ± 0.031 | |
| Fibre width | 0.0010 | 0.0273 | PtoSUS1_3199-3242-3301 | C-A-G | + | - | - | 0.050 | 25.607 ± 1.243 |
| 0.0001 | 0.0160 | PtoBGlu1_5408-5417-5443 | T-A-G | + | - | - | 0.050 | 27.606 ± 1.245 | |
| Tree height | 0.0050 | 0.0532 | PtoUXS1_3000-3005-3043-3054-3059 | G-T-T-T-C | + | + | - | 0.111 | 13.500 ± 0.991 |
These amplicons were selected based on the significant squared correlation of allele frequencies r2 (r2 ≥ 0.70, P ≤ 0.001); +: the haplotype was found in this climatic region; -: not found; NE: northeastern region; S: southern region; NW: northwestern region; SE: standard error.
4. Discussion
4.1. Functional interpretations of genetic associations
Here we have used multi-gene association approaches, combining extensive full-length candidate genes from a shared biological pathway and with detailed, replicated phenotypic information from natural populations of P. tomemtosa to uncover numerous loci underlying variation in wood chemical composition, physical properties, and growth traits. We further validated mostly these associations in an independent linkage population. Significant additive, dominant, and epistatic effects were observed for tree growth and lignocellulosic composition. The number of associations we detected is larger, while the average R2 explained individually is lower, than in previous single-marker association for similar traits in the association population.16–19 Supportively, effect sizes for the SNPs analysed in a large size of linkage population (average R2 = 3.8%) were nearly 2-fold higher than effects identified using multi-gene association models, suggesting that pathway-based association analyses across multiple genes may provide higher power to uncover the relatively small individual effects.14,43 Also, it is possible that linkage drag in regions around the candidate genes causes larger R2 values of allelic variants in the linkage population than in the association population. More statistics models for estimating the genetic effect in multiple population backgrounds are needed. Markers found to be associated with traits span both coding and non-coding portions of genes, with a predominance for additive effects and small effect sizes (Tables 1 and 2), suggesting that this best describe the genetic architecture of complex traits in trees.5,44 Low to moderate R2 were captured by fitting all SNPs simultaneously from all 11 candidate genes (Fig. 4), suggesting that we thus far lack sufficient genomic coverage to capture the majority genetic variation. Many genes with significant SNPs for three trait categories were detected, consistent with our expectations of modelling all combined markers from a set of interrelated genes concurrently, instead of using candidate gene-based ‘one-marker-at-a-time’ approach in tree species.45
All candidate genes were originally isolated from a xylem cDNA library of P. tomentosa, and a part of the genes was highly up-regulated in xylem tissue (Fig. 1A), indicating that these genes are likely main candidates for participating in secondary cell wall formation. Previous studies have indicated that wood biosynthesis and tree growth require the coordinate regulation of diverse metabolic pathways, and that the genes in these shared pathways are often functional homologs.3,8 This viewpoint agrees with our observation that the number of common genes (i.e. genes that were identified as being significantly associated with a trait at least twice using different association models, including additive effect, dominance, epistasis, and haplotype) affecting each trait varied from 2 to 6 (Table 5). We identified PtoCesA4 and PtoCesA7 as being associated to four wood chemical compositions (Table 5 and Supplementary data S6), consistent with the central role played by CesA7 and CesA4, as subunits of the CesA complex required for proper secondary wall cellulose synthesis as well as other possible functions related to wall function.46,47 The result supports previous association studies by Wegrzyn et al.7 and Du et al.16,17 In addition, we identified two common genes directly related to polysaccharides (PtoCesA4 and PtoUXS1) that were associated simultaneously with all three wood ultrastructure traits (Table 5). UXS is likely ubiquitous among plants and is a target for regulatory control during cell wall biosynthesis,17 which further supports our findings that PtoUXS1 explains a significant amount of R2 of all growth traits (Table 5). However, the mechanism by which specific allelic variation in PtoUXS1 could affect tree cell elongation is not yet apparent.
Table 5.
Identification of the common genes significantly related to growth and wood properties in Populus tomentosa
| PtoBGlu1 | PtoCesA3 | PtoCesA4 | PtoCesA7 | PtoGA20Ox | PtoGH9A1 | PtoSAHH1 | PtoSAHH2 | PtoSUS1 | PtoUGDH1 | PtoUXS1 | |
|---|---|---|---|---|---|---|---|---|---|---|---|
| Lignin | + | + | + | ||||||||
| Holocellulose | + | + | + | + | + | ||||||
| Hemicellulose | + | + | + | + | + | ||||||
| α-Cellulose | + | + | + | + | + | + | |||||
| Fibre length | + | + | + | ||||||||
| Fibre width | + | + | + | + | + | ||||||
| Microfibre angle | + | + | + | ||||||||
| DBH | + | + | + | ||||||||
| Tree height | + | + | + | + | + | ||||||
| Stem volume | + | + |
+: genes that were identified as being significantly associated with a trait at least two times using different models, including additive effect, dominance, epistasis, and haplotype.
Taking α-cellulose content as an example, we identified six common genes significantly related to this trait, specifically PtoBGlu1, PtoCesA3, PtoCesA4, PtoCesA7, PtoGH9A1, and PtoSUS1 (Table 5). When taken together, multi-SNP models explained a small to moderate portions of the variation from both additive and dominant effects (31.7 and 12.2%, respectively). Previous evidence suggest that these six genes may play key roles in cellulose biosynthesis,47–49 supporting these observations. SNPs in PtoSUS1 showed high additive and dominant effects (Supplementary Table S6), and two LD blocks, including five significant haplotypes (Supplementary Table S11), were associated with α-cellulose. In plants, SUS catalyzes a reversible reaction that preferentially converts sucrose into fructose and UDP-glucose. UDP-glucose is the immediate precursor for the synthesis of cellulose.50 Another enzyme involved in cellulose formation during xylem development is β-glucosidase (BGlu), which hydrolyzes cellobiose to glucose, and is a rate-limiting factor during enzymatic hydrolysis of cellulose.51 Here, we identified two haplotypes and a non-coding SNP in PtoBGlu1 (Supplementary Tables S6 and S11). Furthermore, korrigan cellulase (KOR), an endo-β-1,4-glucanase, belonging to the glycosyl hydrolase family 9 (GH9), can hydrolyze the β-1,4 linkage of the cellulose chain.52 PtoGH9A1, an orthologue of KORRIGAN1, contains three haplotypes associated with α-cellulose (Supplementary Table S6), and we also found epistatic interactions for the trait between a non-synonymous SNP (PtoGH9A1_1936) and SNPs in PtoCesA3 and PtoCesA4. These findings were supported by significant correlations in gene expression among these six genes (Fig. 1B).
A similar situation was also observed for hemicellulose, the second most abundant polysaccharide after cellulose, where we identified several haplotypes and eight SNPs from five of the candidate genes (Supplementary Tables S6 and S11). Of these, PtoUGDP1 and PtoUXS1 are key enzymes in hemicellulose biosynthesis.53,54 Five common candidate genes were shared between wood-property and growth traits (Table 5). PtoSAHH2 is associated with hemicellulose, tree height, and stem volume. The observation is consistent with SAHH being a cytokinin-binding protein participating in xylogenesis.46 Interestingly, associations with lignin were found within genes directly or indirectly related to cellulose or xylan biosynthesis, such as PtoUXS1, PtoCesA4, and PtoCesA7 (Table 5). This finding was supported by the strong genetic interrelations between the lignin biosynthetic pathway and polysaccharide biosynthesis.3,55 Applying biological pathway-based association11 to examine many more candidate genes involved in the diverse metabolic pathways of tree is needed in future investigation.
The numerous genes that we detected have multiple significant associations across all three trait categories (Tables 1–3, and 5), and the finding was possible to be explained by two hypothesis. On one hand, significant genetic correlations were frequently estimated among multiple related trait fractions or percentages of the whole tree body, especially within each trait category in our present study (Supplementary data S3). On the other hand, this observation may be considered to be an indication of pleiotropy in the broad sense, and the potential pleiotropic loci identified in this study provide novel candidates for explaining phenotypic variation in Populus. Pleiotropic loci span multiple functions and may have effects by acting upstream in signalling pathways that affect many traits or by directly targeting multiple genes for regulation,35 which is consistent with our discoveries that PtoGA20Ox, PtoSAHH1, and PtoSAHH2 are all associated with multiple traits (Tables 1–5). More work should be focused on transcription factors/regulators in future.
4.2. Epistasis for growth and wood-property traits
Non-additive interactions between separate mutations (epistasis) can significantly influence the rate and direction of evolutionary change.13 Also, epistasis is an important but often-ignored component of genetic variation in breeding for quantitative traits, due to limited statistical power to detect and estimate epistasis. In our study, we detected and characterized SNP–SNP epistasis associated with the phenotypic traits by using a MDR method (Supplementary Tables S7 and S8). The detection of epistasis hence provides necessary information complementary to that gained through single-locus analysis. We observed that 11 of the 34 unique SNPs identified through the MDR analyses were located in coding regions, with the remaining 23 being located in non-coding regions (Supplementary Table S7), supporting the notion that most associations exhibited pervasive epistatic effects and that it involves both non-coding and coding polymorphisms.56
We identified three non-synonymous loci from three unique genes with significant epistatic effects for DBH and stem volume (Fig. 6 A–D). The similar epistatic pattern for these two traits may be due to a significant positive phenotypic correlation (Supplementary data S3).20 Also, the observation may be supported by previous studies reporting that examinations of interactions between amino acid mutations in the same/shared proteins underlying variation in a measurable phenotype may best reveal the mechanisms of epistasis.57 Without the expectations of an additive null model, the phenotypic effects of allelic substitutions (L → H and H → L) at specific combinatorial patterns of amino acid replacements at these three non-synonymous mutations were highly dependent on genetic background.58 We observed two specific combinatorial patterns: first, in the presence of each amino acid type (H for Ser and L for Thr) in PtoGH9A1_1936, the Asn (L) in PtoGA20Ox_632 conferred an increased phenotype value on the Asn (L) background in PtoCesA4_1914, and a decrease on the His (H) background in PtoCesA4_1914 (Fig. 6B and C). Similarly, the L-type amino acid type in PtoCesA4_1914 conferred a decrease on the Ser (H) background in PtoGA20Ox_632 and an increase on the Asn (L) background in PtoGA20Ox_632 (Fig. 6B and C). Second, without consideration of amino acid types present in PtoCesA4_1914, the L-type in PtoGH9A1_1936 conferred an increased phenotype value in the L background in PtoGA20Ox_632 and a decrease on the H background in PtoGA20Ox_632 (Fig. 6B and C). Similarly, the L-type amino acid in PtoGA20Ox_632 conferred a decrease on the H background in PtoGH9A1_1936 and an increase on the L background in PtoGH9A1_1936 (Fig. 6B and C). These findings are examples of sign epistasis58 and suggest the co-selection of epistatic alleles or protein–protein interactions, although the mechanisms for their generation and maintenance are not clear. These observations were supported by the significant positive correlations in gene expression for each pair of these three genes in our tissue-specific transcript profiling (Fig. 1B).
4.3. Future perspectives for MAS breeding
The future of tree improvement will depend on the co-selection of favourable alleles for traits of interest and on the application of combination of haplotypes/genotypes in a manner that effectively overcomes the low levels of LD observed in forest trees.59 Also, genomic selection (GS) is expected to cause a paradigm shift in tree breeding by improving the efficiency and speed of the breeding process.45 Therefore, examining the phenotypic differences among combinations of multiple haplotypes/genotypes for a specific trait (Fig. 5 and Supplementary data S3) provides a foundation for dissecting complex traits through multi-gene or GS in trees. Only 63% of SNPs in haplotypes were identified in the multi-SNP models (Supplementary Tables S6 and S11), consistent with previous observations that haplotype-based tests can detect previously unknown QTL and are thus well supported for unraveling the genetic basis of complex traits.59 Populus tomentosa is distributed across a wide geographical area of northern China20 and thus can provide a potential source of region-specific haplotypes (Table 4). These region-specific signatures may reflect, as well as affect, strong regional differentiation in these traits. Probably these fixed loci are likely key to understanding geographic adaptation and may also be targeted in region-based breeding.
The present work has identified a number of candidate allelic variants that could be exploited to alter key economic traits for industrial applications. However, the direct use of QTL or association information for MAS breeding has not been successful, chiefly because of the difficulty in transferring associations across populations and species of forest trees.45 Future work should focus on replicated sampling for a larger number of broadly representative ecotypes especially across different environments, as well as considering genetic background or genotype × environment interactions.1 Also, joint mapping with association populations and multiple specific biparental crosses is likely to be extremely powerful for improving map resolution and to improve identification of new alleles. The incorporation of more genes (such as gene family members, transcription factors/regulators, transferases, transporters, kinases, and hydrolases) in shared biosynthetic pathways11 would provide a more complete dissection of the effects of genetic variation on growth and lignocellulosic traits. We believe these studies will gradually drive the application of MAS to selection breeding of trees at the early seedling stage.
Supplementary data
Supplementary data are available at www.dnaresearch.oxfordjournals.org.
Funding
This work was supported by the State Key Basic Research Program of China (No. 2012CB114506), the National ‘863’ Plan Project (No. 2013AA102702), and the 111 Project (No. B13007). Funding to pay the Open Access publication charges for this article was provided by the State Key Basic Research Program of China (No. 2012CB114506), the National ‘863’ Plan Project (No. 2013AA102702), and the 111 Project (No. B13007).
Supplementary Material
Acknowledgements
We thank Prof. Ronald R. Sederoff (NC State University, Raleigh, NC, USA) for detailed comments and specific suggestions for improving the manuscript, and also Prof. Rongling Wu and Dr Zhong Wang (Center for Statistical Genetics, Pennsylvania State University, Hershey, PA, USA) for advice on statistical analysis.
References
- 1.Neale D.B., Kremer A. Forest tree genomics: growing resources and applications. Nat. Rev. Genet. 2011;12:111–22. doi: 10.1038/nrg2931. [DOI] [PubMed] [Google Scholar]
- 2.Somerville C., Bauer S., Brininstool G., et al. Toward a systems approach to understanding plant cell walls. Science. 2004;306:2206–11. doi: 10.1126/science.1102765. [DOI] [PubMed] [Google Scholar]
- 3.Persson S., Wei H., Milne J., Page G.P., Somervill C.R. Identification of genes required for cellulose synthesis by regression analysis of public microarray data sets. Proc. Natl Acad. Sci. USA. 2005;102:8633–8. doi: 10.1073/pnas.0503392102. [DOI] [PMC free article] [PubMed] [Google Scholar]
- 4.González-Martīnez S.C., Ersoz E., Brown G.R., Wheeler N.C., Neale D.B. DNA sequence variation and selection of tag single-nucleotide polymorphisms at candidate genes for drought-stress response in Pinus taeda L. Genetics. 2006;172:1915–26. doi: 10.1534/genetics.105.047126. [DOI] [PMC free article] [PubMed] [Google Scholar]
- 5.Eckert A.J., Wegrzyn J.L., Cumbie W.P., et al. Association genetics of the loblolly pine (Pinus taeda, Pinaceae) metabolome. New Phytol. 2012;193:890–902. doi: 10.1111/j.1469-8137.2011.03976.x. [DOI] [PubMed] [Google Scholar]
- 6.Thumma B.R., Nolan M.F., Evans R., Moran G.F. Polymorphisms in cinnamoyl coa reductase (CCR) are associated with variation in microfibril angle in Eucalyptus spp. Genetics. 2005;171:1257–65. doi: 10.1534/genetics.105.042028. [DOI] [PMC free article] [PubMed] [Google Scholar]
- 7.Wegrzyn J.L., Eckert A.J., Choi M., et al. Association genetics of traits controlling lignin and cellulose biosynthesis in black cottonwood (Populus trichocarpa, Salicaceae) secondary xylem. New Phytol. 2010;188:515–32. doi: 10.1111/j.1469-8137.2010.03415.x. [DOI] [PubMed] [Google Scholar]
- 8.Beaulieu J., Doerksen T., Boyle B., et al. Association genetics of wood physical traits in the conifer White Spruce and relationships with gene expression. Genetics. 2011;188:197–214. doi: 10.1534/genetics.110.125781. [DOI] [PMC free article] [PubMed] [Google Scholar]
- 9.Du Q.Z., Pan W., Xu B.H., Li B.L., Zhang D.Q. Polymorphic SSR loci within PtoCesA genes are associated with growth and wood properties in Populus tomentosa. New Phytol. 2013;197:763–76. doi: 10.1111/nph.12072. [DOI] [PubMed] [Google Scholar]
- 10.Guerra F.P., Wegrzyn J.L., Sykes R., et al. Association genetics of chemical wood properties in black poplar (Populus nigra) New Phytol. 2013;197:162–76. doi: 10.1111/nph.12003. [DOI] [PubMed] [Google Scholar]
- 11.Wang K., Li M., Hakonarson H. Analysing biological pathways in genome-wide association studies. Nat. Rev. Genet. 2010;11:843–54. doi: 10.1038/nrg2884. [DOI] [PubMed] [Google Scholar]
- 12.Hoggart C.J., Whittaker J., De Iorio M., Balding D. Simultaneous analysis of all SNPs in genome-wide and re-sequencing association studies. PLoS Genet. 2008;4:e1000130. doi: 10.1371/journal.pgen.1000130. [DOI] [PMC free article] [PubMed] [Google Scholar]
- 13.Huang W., Richards S., Carbone M., et al. Epistasis dominates the genetic architecture of Drosophila quantitative traits. Proc. Natl Acad. Sci. USA. 2012;109:15553–59. doi: 10.1073/pnas.1213423109. [DOI] [PMC free article] [PubMed] [Google Scholar]
- 14.Yang J., Benyamin B., McEvoy B., et al. Common SNPs explain a large proportion of the heritability for human height. Nat. Genet. 2010;42:565–9. doi: 10.1038/ng.608. [DOI] [PMC free article] [PubMed] [Google Scholar]
- 15.Yu J., Pressoir G., Briggs W.H., et al. A unified mixed-model method for association mapping that accounts for multiple levels of relatedness. Nat. Genet. 2006;38:203–8. doi: 10.1038/ng1702. [DOI] [PubMed] [Google Scholar]
- 16.Du Q., Pan W., Tian J., Li B., Zhang D. The UDP-glucuronate decarboxylase gene family in Populus: structure, expression, and association genetics, PLoS ONE. 2013;84:e60880. doi: 10.1371/journal.pone.0060880. [DOI] [PMC free article] [PubMed] [Google Scholar]
- 17.Du Q., Xu B., Pan W., et al. Allelic variation in a cellulose synthase gene PtoCesA4 associated with growth and wood properties in Populus tomentosa. G3. 2013;3:2069–84. doi: 10.1534/g3.113.007724. [DOI] [PMC free article] [PubMed] [Google Scholar]
- 18.Tian J., Du Q., Chang M., Zhang D. Allelic variation in PtGA20Ox associates with growth and wood properties in Populus spp. PLoS ONE. 2012;7:e53116. doi: 10.1371/journal.pone.0053116. [DOI] [PMC free article] [PubMed] [Google Scholar]
- 19.Tian J., Chang M., Du Q., Xu B., Zhang D. Single-nucleotide polymorphisms in PtoCesA7 and their association with growth and wood properties in Populus tomentosa. Mol. Genet. Genomics. 2014;289:439–55. doi: 10.1007/s00438-014-0824-6. [DOI] [PubMed] [Google Scholar]
- 20.Du Q., Xu B., Gong C., et al. Variation in growth, leaf, and wood property traits of Chinese white poplar Populus tomentosa, a major industrial tree species in Northern China. Can. J. For. Res. 2014;44:326–39. [Google Scholar]
- 21.Li X., Wu H., Dillon S., Southerton S.G. Generation and analysis of expressed sequence tags from six developing xylem libraries in Pinus radiata D.Don. BMC Genomics. 2009;10:1–18. doi: 10.1186/1471-2164-10-41. [DOI] [PMC free article] [PubMed] [Google Scholar]
- 22.Zhang D.Q., Du Q.Z., Xu B.H., Zhang Z.Y., Li B. The actin multigene family in Populus: organization, expression and phylogenetic analysis. Mol. Genet. Genomics. 2010;284:105–19. doi: 10.1007/s00438-010-0552-5. [DOI] [PubMed] [Google Scholar]
- 23.Stephens M., Scheet P. Accounting for decay of linkage disequilibrium in haplotype inference and missing-data imputation. Am. J. Hum. Genet. 2005;76:449–62. doi: 10.1086/428594. [DOI] [PMC free article] [PubMed] [Google Scholar]
- 24.Rozas J., Sanchez-Delbarrio J., Messeguer X., Rozas R. DnaSP, DNA polymorphism analyses by the coalescent and other methods. Bioinformatics. 2003;19:2496–7. doi: 10.1093/bioinformatics/btg359. [DOI] [PubMed] [Google Scholar]
- 25.Nei M. Molecular evolutionary genetics. New York: Columbia University Press; 1987. [Google Scholar]
- 26.Park T., Casella G. The Bayesian lasso. J Am Stat Assoc. 2008;103:681–6. [Google Scholar]
- 27.Watterson G.A. On the number of segregating sites in genetical models without recombination. Theor. Popul. Boil. 1975;7:188–93. doi: 10.1016/0040-5809(75)90020-9. [DOI] [PubMed] [Google Scholar]
- 28.Tajima F. Statistical method for testing the neutral mutation hypothesis by DNA polymorphism. Genetics. 1989;123:585–95. doi: 10.1093/genetics/123.3.585. [DOI] [PMC free article] [PubMed] [Google Scholar]
- 29.Fu Y., Li W. Statistical tests of neutrality of mutations. Genetics. 1993;133:693–709. doi: 10.1093/genetics/133.3.693. [DOI] [PMC free article] [PubMed] [Google Scholar]
- 30.Ikemura T. Codon usage and tRNA content in unicellular and multicellular organisms. Mol. Biol. Evol. 1985;2:13–34. doi: 10.1093/oxfordjournals.molbev.a040335. [DOI] [PubMed] [Google Scholar]
- 31.Hill W.G., Robertson A. Linkage disequilibrium in finite populations. Theor. Appl. Genet. 1968;38:226–31. doi: 10.1007/BF01245622. [DOI] [PubMed] [Google Scholar]
- 32.Remington D.L., Thornsberry J.M., Matsuoka Y., et al. Structure of linkage disequilibrium and phenotypic associations in the maize genome. Proc. Natl Acad. Sci. USA. 2001;98:11479–84. doi: 10.1073/pnas.201394398. [DOI] [PMC free article] [PubMed] [Google Scholar]
- 33.Li J., Das K., Fu G., Li R., Wu R. The Bayesian lasso for genome-wide association studies. Bioinformatics. 2011;27:516–23. doi: 10.1093/bioinformatics/btq688. [DOI] [PMC free article] [PubMed] [Google Scholar]
- 34.Ingvarsson P.K. Molecular evolution of synonymous codon usage in Populus. BMC Evol. Biol. 2008;8:307. doi: 10.1186/1471-2148-8-307. [DOI] [PMC free article] [PubMed] [Google Scholar]
- 35.McKown A., Klápště J., Guy R., et al. Genome-wide association implicates numerous genes underlying ecological trait variation in natural populations of Populus trichocarpa. New Phytol. 2014;22 doi: 10.1111/nph.12815. doi:10.1111/nph.12815. [DOI] [PubMed] [Google Scholar]
- 36.Hahn L.W., Ritchie M., Moore J. Multifactor dimensionality reduction software for detecting gene-gene and gene-environment interactions. Bioinformatics. 2003;19:376–82. doi: 10.1093/bioinformatics/btf869. [DOI] [PubMed] [Google Scholar]
- 37.Moore J.H., Gilbert J., Tsai C., et al. A flexible computational framework for detecting, characterizing, and interpreting statistical patterns of epistasis in genetic studies of human disease susceptibility. J. Theor. Boil. 2006;241:252–61. doi: 10.1016/j.jtbi.2005.11.036. [DOI] [PubMed] [Google Scholar]
- 38.Hu T., Chen Y., Kiralis J., et al. An information-gain approach to detecting three-way epistatic interactions in genetic association studies. J. Am. Med. Inform. Assoc. 2013;20:630–6. doi: 10.1136/amiajnl-2012-001525. [DOI] [PMC free article] [PubMed] [Google Scholar]
- 39.Sinnwell J., Schaid D. haplo.stats: Statistical Analysis of Haplotypes With Traits and Covariates When Linkage Phase Is Ambiguous. 2009. R package version 1.4.4. http://CRAN.R-project.org/package=haplo.stats. (1 August 2012, date last accessed)
- 40.Patterson N., Price A., Reich D. Population structure and eigen analysis. PLoS Genet. 2006;2:2074–93. doi: 10.1371/journal.pgen.0020190. [DOI] [PMC free article] [PubMed] [Google Scholar]
- 41.Du Q., Wang B., Wei Z., Zhang D., Li B. Genetic diversity and population structure of Chinese white poplar (Populus tomentosa) revealed by SSR markers. J. Hered. 2012;103:853–62. doi: 10.1093/jhered/ess061. [DOI] [PubMed] [Google Scholar]
- 42.Storey J.D., Tibshirani R. Statistical significance for genome wide studies. Proc. Natl Acad. Sci. USA. 2003;100:9440–5. doi: 10.1073/pnas.1530509100. [DOI] [PMC free article] [PubMed] [Google Scholar]
- 43.Ingvarsson P.K., Garcia M.V., Luquez V., Hall D., Jansson S. Nucleotide polymorphism and phenotypic associations within and around the phytochrome B2 locus in European aspen Populus tremula, Salicaceae. Genetics. 2008;178:2217–26. doi: 10.1534/genetics.107.082354. [DOI] [PMC free article] [PubMed] [Google Scholar]
- 44.Hill W.G., Goddard M., Visscher P. Data and theory point to mainly additive genetic variance for complex traits. PLoS Genet. 2008;4:e1000008. doi: 10.1371/journal.pgen.1000008. [DOI] [PMC free article] [PubMed] [Google Scholar]
- 45.Resende M.D., Resende M., Sansaloni C., et al. Genomic selection for growth and wood quality in Eucalyptus: capturing the missing heritability and accelerating breeding for complex traits in forest trees. New Phytol. 2012;194:116–28. doi: 10.1111/j.1469-8137.2011.04038.x. [DOI] [PubMed] [Google Scholar]
- 46.Somerville C. Cellulose synthesis in higher plants. Annu. Rev. Cell Dev. Biol. 2006;22:53–78. doi: 10.1146/annurev.cellbio.22.022206.160206. [DOI] [PubMed] [Google Scholar]
- 47.Persson S., Paredez A., Carroll A., et al. Genetic evidence for three unique components in primary cell-wall cellulose synthase complexes in Arabidopsis. Proc. Natl Acad. Sci. USA. 2007;104:15566–71. doi: 10.1073/pnas.0706592104. [DOI] [PMC free article] [PubMed] [Google Scholar]
- 48.Szyjanowicz P.M., McKinnon I., Taylor N., et al. The irregular xylem 2 mutant is an allele of korrigan that affects the secondary cell wall of Arabidopsis thaliana. Plant J. 2004;37:730–40. doi: 10.1111/j.1365-313x.2003.02000.x. [DOI] [PubMed] [Google Scholar]
- 49.Coleman H.D., Yan J., Mansfield S. Sucrose synthase affects carbon partitioning to increase cellulose production and altered cell wall ultrastructure. Proc. Natl Acad. Sci. USA. 2009;106:13118–23. doi: 10.1073/pnas.0900188106. [DOI] [PMC free article] [PubMed] [Google Scholar]
- 50.Joshi C.P., Bhandari S., Ranjan P., et al. Genomics of cellulose biosynthesis in poplars. New Phytol. 2004;164:53–61. doi: 10.1111/j.1469-8137.2004.01155.x. [DOI] [PubMed] [Google Scholar]
- 51.Harhangi H., Steenbakkers P., Akhmanova A., et al. A highly expressed family 1 β-glucosidase with transglycosylation capacity from the anaerobic fungus Piromyces sp, E2. Biochim. Biophys. Acta. 2002;1574:293–303. doi: 10.1016/s0167-4781(01)00380-3. [DOI] [PubMed] [Google Scholar]
- 52.Urbanowicz B.R., Bennett A., del Campillo E., et al. Structural organization and a standardized nomenclature for plant endo-1,4-β-glucanases cellulases of glycosyl hydrolase family 9. Plant Physiol. 2007;144:1693–6. doi: 10.1104/pp.107.102574. [DOI] [PMC free article] [PubMed] [Google Scholar]
- 53.Bar-Peled M., Griffith C., Doering T. Functional cloning and characterization of a UDP-glucuronic acid decarboxylase: the pathogenic fungus Cryptococcus neoformans elucidates UDP-xylose synthesis. Proc. Natl Acad. Sci. USA. 2001;98:12003–08. doi: 10.1073/pnas.211229198. [DOI] [PMC free article] [PubMed] [Google Scholar]
- 54.Campbell R., Sala R., van de Rijn I., Tanner M. Properties and kinetic analysis of UDP-glucose dehydrogenase from group A streptococci. Irreversible inhibition by UDP-chloroacetol. J. Biol. Chem. 1997;272:3416–22. doi: 10.1074/jbc.272.6.3416. [DOI] [PubMed] [Google Scholar]
- 55.Porth I., Klápště J., Skyba O., et al. Genome-wide association mapping for wood characteristics in Populus identifies an array of candidate single nucleotide polymorphisms. New Phytol. 2013;200:710–26. doi: 10.1111/nph.12422. [DOI] [PubMed] [Google Scholar]
- 56.Kacser H., Burns J.A. The molecular basis of dominance. Genetics. 1981;97:639–66. doi: 10.1093/genetics/97.3-4.639. [DOI] [PMC free article] [PubMed] [Google Scholar]
- 57.Bridgham J.T., Ortlund E.A., Thornton J.W. An epistatic ratchet constrains the direction of glucocorticoid receptor evolution. Nature. 2009;461:515–9. doi: 10.1038/nature08249. [DOI] [PMC free article] [PubMed] [Google Scholar]
- 58.Natarajan C., Inoguchi N., Weber R.E., et al. Epistasis among adaptive mutations in deer mouse hemoglobin. Science. 2013;340:1324–7. doi: 10.1126/science.1236862. [DOI] [PMC free article] [PubMed] [Google Scholar]
- 59.Gore M.A., Chia J.M., Elshire R., et al. A first-generation haplotype map of maize. Science. 2009;326:1115–7. doi: 10.1126/science.1177837. [DOI] [PubMed] [Google Scholar]
Associated Data
This section collects any data citations, data availability statements, or supplementary materials included in this article.