

Abstract
Motivation: The deconvolution of isoform expression from RNA-seq remains challenging because of non-uniform read sampling and subtle differences among isoforms.
Results: We present a weighted-log-likelihood expectation maximization method on isoform quantification (WemIQ). WemIQ integrates an effective bias removal with a weighted expectation maximization (EM) algorithm to distribute reads among isoforms efficiently. The weight represents the oversampling or undersampling of sequence reads and is estimated through a generalized Poisson model without any presumption on the bias sources and formats. WemIQ significantly improves the quantification of isoform and gene expression as well as the derived exon inclusion rates. It provides robust expression estimates across different laboratories and protocols, which is valuable for the integrative analysis of RNA-seq. For the recent single-cell RNA-seq data, WemIQ also provides the opportunity to distinguish bias heterogeneity from true biological heterogeneity and uncovers smaller cell-to-cell expression variability.
Availability and implementation: WemIQ can be downloaded from http://www-rcf.usc.edu/~liangche/software.html
Contact: liang.chen@usc.edu
Supplementary information: Supplementary data are available at Bioinformatics online.
1 Introduction
The rapid advances in high-throughput sequencing technologies provide us an opportunity to dissect transcriptomes with unprecedented resolution (Cloonan et al., 2008; Marguerat and Bahler, 2010; Mortazavi et al., 2008; Nagalakshmi et al., 2008; Wang et al., 2009). Based on RNA-seq studies, alternative splicing has become more and more appreciated as a key mechanism in higher eukaryotes to expand transcriptomes by generating multiple isoforms from a single gene (Brett et al., 2002; Graveley, 2001; Nilsen and Graveley, 2010). For example, it has been reported that up to 95% of human multi-exon genes undergo alternative splicing (Pan et al., 2008). Therefore, an accurate quantification of transcript isoforms is important to understand gene regulation through alternative splicing.
However, the accurate estimation of transcript isoform expression from RNA-seq data remains a challenge. Many state-of-the-art approaches initially assumed that short sequence reads in RNA-seq were uniformly sampled from each transcript. However, the position-level read count often demonstrates larger variation than expected under the uniform sampling assumption (Li et al., 2010; Srivastava and Chen, 2010), and shows enormous inter-gene and intra-gene bias heterogeneity. As a result, read counts need to be adjusted in a dynamic way for the abundance quantification. Add-on functions have been introduced to handle the overdispersion in the methods of isoform expression estimation (Li and Dewey, 2011; Roberts et al., 2011). These methods usually assumed a constant bias factor for each relative position of genes or simply corrected the sequence-specific bias caused by random hexamer priming. However, the overall bias is complicated and caused by multiple factors including many unknown ones, and the bias pattern can vary significantly across different regions and different protocols (Hansen et al., 2010; Li et al., 2010; Roberts et al., 2011). In light of these facts, previously we proposed to use the generalized Poisson (GP) model to estimate the bias in a data-adaptive way without any presumption (Srivastava and Chen, 2010). However, this has not yet been integrated into the isoform expression deconvolution.
In this article, we propose a robust isoform-expression quantification method: Weighted-log-likelihood expectation maximization Isoform Quantification (WemIQ). Given gene annotation, WemIQ can accurately quantify RNA products at both the gene and transcript isoform level from RNA-seq data. WemIQ uses the expectation maximization (EM) strategy to distribute reads among different isoforms and incorporates the fragment length information of paired-end reads. More importantly, bias in RNA-seq is corrected by assigning different weights to reads from different gene regions when calculating the weighted log-likelihood. The weighted-log-likelihood approach enables efficient isoform expression deconvolution with appropriate bias removal.
To demonstrate the effectiveness of our method, we applied WemIQ to both simulated and real data sets. Simulation studies show that, in both transcript-isoform-centric and exon-centric quantification, our approach significantly outperforms the state-of-the-art software, such as Cufflinks (Trapnell et al., 2010), RSEM (Li and Dewey, 2011) and SpliceTrap (Wu et al., 2011a). Cufflinks and RSEM quantify isoform expression, while SpliceTrap quantifies exon inclusion rates in an exon-centric way. Unlike other simulation studies which generated reads based on the uniform assumption (Li and Dewey, 2011; Mortazavi et al., 2008) or based on a pipeline in consideration of only a few bias factors (Griebel et al., 2012), our simulations generated reads with various bias patterns to mimic the real situation. Analyses on a variety of real RNA-seq data sets also show that our bias correction is more effective; our expression quantification is more accurate; and the expression estimates are more robust across different laboratories and different protocols. For the application to the recent single-cell RNA-seq data, interestingly, we found that compared with population-cell RNA-seq, single-cell RNA-seq usually exhibits a larger bias variation across different genes or different regions of the same gene, and WemIQ meets the challenges by separating bias heterogeneity from true biological heterogeneity by obtaining smaller but still significant cell-to-cell variability.
2 Methods
2.1 Bias estimation in WemIQ and weight assignment for each read
As in our previous paper (Srivastava and Chen, 2010), we separated a gene into non-redundant virtual exons. An overlapped exon would be split into multiple virtual exons (see Supplementary Fig. S1). Let X represent the number of mapped reads starting from a certain position within a virtual exon, and it follows a GP distribution with
| (1) |
where represents the average bias effort from all possible sources that makes the read deviating from the uniform sampling, and is the underlying true expression. Besides, is the largest positive integer for which when . The limit on q when is imposed to ensure that there are at least five classes with non-zero probabilities and the truncation errors (i.e. is slightly smaller than 1) do not affect practical application (Consul, 1989). Let denote the MLE of , denote the sample mean of the mapped read counts. Then the MLE of can be expressed as , which is a weighted sample mean and it preserves the true expression after the bias removal. Therefore, for each read, we assign a weight to adjust for its bias.
2.2 Isoform and gene expression quantification in WemIQ
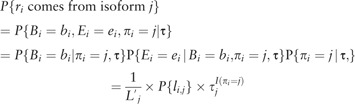
For a considered gene with transcript isoforms, we estimate the fraction of reads coming from each isoform by the EM strategy. Specifically, the observed data are the read set mapped to this gene, where is the total number of reads. The hidden data are the reads’ origins of transcript isoforms: . if belongs to isoform . Then the probability that comes from isoform with the starting position and ending position can be represented as:
 |
(2) |
where is the effective length of transcript , and it can be can be approximated by where is the length of transcript and is the average fragment length (either inferred from reads mapped to single-isoform genes or specified by users). denotes the fragment length of if the read comes from isoform and is a Gaussian distributed random variable with parameters inferred from single-isoform genes or specified by users. if is incompatible with transcript . Then the complete-data log likelihood for a regular EM algorithm can be expressed as
| (3) |
However, considering bias in RNA-seq, we assign each read a different credibility weight . If spans multiple virtual exons, the first virtual exon was used for the bias assignment. As we mentioned, the bias level is estimated from its corresponding virtual exon in a data-adaptive way. Our proposed weighted complete-data log likelihood is:
 |
(4) |
The expectation and maximization steps are iterated to estimate . The expression level of isoform is then estimated as:
| (5) |
The gene expression is estimated as the sum of the isoform expression: . The relative expression of isoform is defined as , and the relative estimation error can be expressed as .
We aligned sequence reads to the reference genome using TopHat (version 2.04) (Trapnell et al., 2009). The resultant SAM files were taken into WemIQ and Cufflinks (version 2.02) for isoform quantification. RSEM (version 1.2.4) and SpliceTrap (version 0.90.5) took raw reads as input and performed the alignment internally by calling Bowtie (Langmead et al., 2009). MMSEQ (version 1.0.8) (Turro et al., 2011) was also used in the performance comparison for simulations under real gene structures. For MMSEQ, the isoform percentage was calculated as the ratio between the isoform expression and the gene expression estimates. Their Gibbs Sampling-based estimates were also considered in Section 4 of Supplementary Text S1. STAR (version 2.3.0) was utilized for part of the read mapping (details in Section 5 of Supplementary Text S1). The implementation of WemIQ is efficient. Starting from SAM files, it only takes WemIQ approximately 8 min and <2 Gb memory to estimate gene and isoform expression based on a total of 5.6 million read pairs.
2.3 Normalization of gene and isoform expressions
Let , and denote the total gene number, the isoform number for gene g and effective length of transcript in gene g. Our ‘isoform-reads per kilo base per million bias-corrected reads’ is defined as:
| (6) |
Note that we omitted subscript g in the previous paragraph for ease of notation.
3. Results
3.1 Bias heterogeneity needs to be properly handled in isoform expression quantification
Bias may arise from every step of the RNA-seq experiment in a dynamic manner and hence is intrinsically heterogeneous across different genes or even across different regions within the same gene. To explore the extent of sequencing bias heterogeneity, we first studied the overdispersion variation in several human tissues (Illumina BodyMap2 transcriptome). As expected, for different exons of the same transcript, the degree of overdispersion, represented by in the GP model (Srivastava and Chen, 2010), shows a large range. For example, the largest difference within each gene had a median of 0.20–0.32 in a variety of tissues (brain, muscle, liver and kidney). In addition, different genes exhibited different bias. For instance, the gene-level bias reflected by the median of exon-level for a gene could be as high as 0.95 or as low as 0.21 in the kidney tissue. Such intra-gene and inter-gene bias heterogeneity need to be considered in the quantification of isoform expression (more discussions in Section 1 of Supplementary Text S1 and Fig. S2).
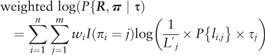
Although bias in RNA-seq has received much attention, the current bias removal methods are still far from optimal. To demonstrate the inappropriateness of the current bias removal methods, we studied the expression of single-isoform genes in these human tissues (Illumina BodyMap2 transcriptome). If read fragments are sampled uniformly along a single-isoform gene, the position-level read count is expected to follow a Poisson distribution. The observed extra heterogeneity of read counts reflects RNA-seq bias. We performed the Kolmogorov–Smirnov (KS) test to compare the observed read-count distribution with the expected Poisson distribution. A KS statistic near zero indicates good fitting, while a lager KS statistic indicates more severe bias. The solid lines (no bias correction) in Figure 1 clearly show severe deviations from the uniform sampling in real data as the majority of genes display a large KS statistic. We then corrected the sequence-specific bias from random hexamer priming and the bias from relative positions similarly to those in Hansen et al. (2010) and Wu et al. (2011b) in order to understand whether these biases could account for most, if not all, of the deviations (details in Section 2 of Supplementary Text S1). Surprisingly, the deviation from the uniformity was even worse (the dashed-dot lines in Fig. 1). Notably, Cufflinks has recently changed to use only the sequence-specific bias correction in light of the reduced accuracy caused by positional bias correction for some RNA-seq datasets. We therefore corrected the sequence-specific bias alone. However, the performance was still worse than that without any correction, and similar to the performance when both types of bias were removed (the dotted lines in Fig. 1 and they overlapped the dashed-dot lines with slight differences).
Fig. 1.
Comparison of different methods for bias correction in RNA-seq. The cumulative distribution functions of the KS statistics are plotted for the uncorrected data (‘_non’), data whose bias has been corrected by WemIQ (‘_WemIQ’), data corrected for the sequence-specific bias (‘_seq’) and data corrected for both the sequence-specific and the positional bias (‘_seq+pos’)
Different from the other bias removal approaches, WemIQ uses the GP-based model which captures the bias directly from the read-count distribution without specifying the bias source (Srivastava and Chen, 2010). WemIQ assigns each read a credibility weight according to its bias level estimated from GP (details given in Section 2). As shown in Figure 1 (boxplots given in Supplementary Fig. S3), our correction (dashed lines) effectively removes the bias in all considered tissues. For example, in the muscle tissue, up to 90.0% of the single-isoform genes had a KS statistic <0.1 after the bias correction by GP. This percentage decreased to 52.4% with the traditional positional and sequence-specific bias corrections. Hence, WemIQ removed the bias effectively. Additional data sets were used to further evaluate the performance of the WemIQ bias correction. Similar results were obtained (Supplementary Fig. S4). However, it is worth pointing out that the bias correction was usually integrated into the expression quantification process. It is difficult to study the benefit from the bias correction alone for these expression-quantification methods. However, the large bias heterogeneity both within and across genes justifies the immediate necessity of deliberate handling of the read non-uniformity.
3.2 Simulations show improved quantification of isoform expression by WemIQ
Our WemIQ removes the bias heterogeneity in RNA-seq when deconvoluting isoform-level expression through a weighted EM algorithm, as shown in the flow chart in Supplementary Figure S1. We performed a variety of simulations to demonstrate the improvement over other methods (Supplementary Fig. S5). Instead of using the generative model with the uniform-sampling assumption or only a few known bias sources (Griebel et al., 2012), we simulated read counts with overdispersion to mimic the dynamic nature of real RNA-seq experiment. For a fair comparison, the negative binomial instead of the GP distribution was used to generate the reads (details in Section 3 of Supplementary Text S1), even though the latter has been shown to better fit the read-count distribution in real RNA-seq data (Srivastava and Chen, 2010) and additional simulations based on GP also demonstrated the significant improvement from WemIQ (results not shown).
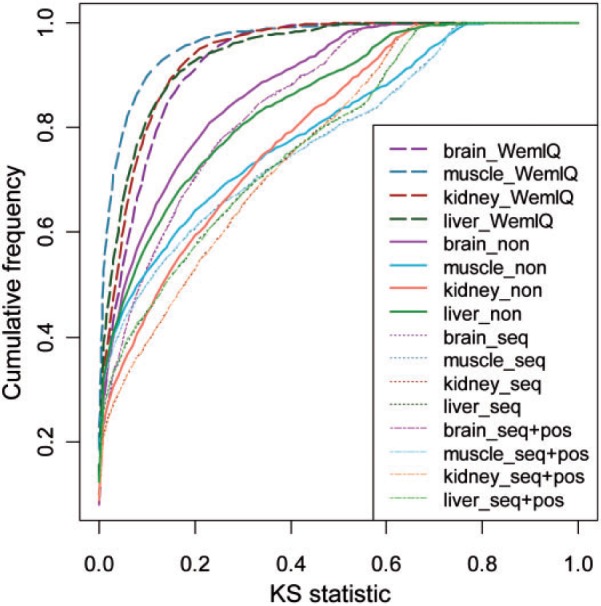
We started from a simple gene model with two transcript isoforms: the longer one contains five 250-nucleotide (nt) exons; while the shorter isoform lacks the second exon (Supplementary Fig. S5A). A total of 27.8 million 50-base pair (bp) pair-end reads were generated for 1000 cases of this gene model. We also turned on the bias correction for Cufflinks and RSEM. For the simulated datasets, the bias correction in RSEM improved its performance while Cufflinks reported similar results regardless of its bias removal. For the real data analyses in Sections 3.6–3.7, the results without the bias correction were similar or slightly worse than those with the bias correction (details in Section 5 of Supplementary Text S1). Hereinafter, we adopted their internal bias correction options in RSEM and Cufflinks in comparison with WemIQ. As shown in Figure 2 A, WemIQ significantly outperforms Cufflinks and RSEM no matter when the longer (‘L’) or the shorter (‘cas2’) isoform was the minor isoform. For example, when the shorter isoform was the minor one, the mean relative error of isoform percentages for WemIQ was 0.20 as compared with 0.38 for Cufflinks and 0.36 for RSEM (Ps < 2.2 × 10⁻¹⁶, paired Wilcoxon tests).
Fig. 2.
The boxplots of the relative estimation error for the isoform expression percentage are presented for A: the two-isoform gene model with an exon-skipping event; B: the low read coverage scenario for the two-isoform gene model; C: the three-isoform gene model with two exon-skipping events; D: the three-isoform gene model with an exon-skipping event and an alternative-splice-site event. The curves are drawn separately for scenarios when each isoform (‘L’ for the longer isoform, ‘cas2’ for the one skipping the second exon, ‘cas4’ for the one skipping the fourth exon) was specified as the minor one
Despite the advances of sequencing technologies, some regions or genes still have limited sequence reads, either because of low expression levels or lower mappability (e.g. repetitive regions). Therefore, we simulated another group of relatively low-coverage data with the average position-level read count of 1.1 for the two-isoform gene model. WemIQ still significantly outperformed the other methods (Fig. 2B, Ps < 2.2 × 10⁻¹⁶, paired Wilcoxon tests).
We extended the two-isoform gene model to a three-isoform model by adding a third isoform (‘cas4’) in which the fourth exon was skipped (Supplementary Fig. S5B). Consistent with the two-isoform cases, WemIQ greatly improved the estimation of relative expression of isoforms (Fig. 2C). The mean relative errors were around 0.38–0.58 for WemIQ while they were as high as 0.74–1.10 for the other two methods. When the long (‘L’) isoform was minor, the isoform quantification became more challenging. This is possibly due to the limited number of the read fragments that spanned the two cassette exons and uniquely belonged to the longer isoform. WemIQ still achieved the smallest estimation errors (Fig. 2C). Under this scenario, the chance for Cufflinks and RSEM to falsely declare the minor isoform among the three isoforms was as high as 0.18 and 0.27, while the chance was only 0.04 for WemIQ.
To compare the performance of the models on isoforms with subtle differences, we considered another three-isoform model with a cassette-exon event (‘cas2’) and an alternative-splice-site event (‘ASS’). The alternative splice sites were separated by only 15 nt (Supplementary Fig. S2C). WemIQ again demonstrated significant improvements (Fig. 2D). For example, the mean relative estimation error of WemIQ was 0.43 when the long (‘L’) isoform was the minor one. It increased to 0.80 and 0.66 in Cufflinks and RSEM, respectively (Ps < 3.8 × 10⁻⁸, paired Wilcoxon tests).
3.3 WemIQ improves isoform expression quantification despite incomplete gene annotations
Although RNA-seq provides an opportunity to dissect the complexity of transcriptomes, it is still challenging to reconstruct transcript isoforms from RNA-seq ab initio. In a recent survey of an array of computational methods with multiple alignment protocols, the highest sensitivity is only about 21% and the highest precision is about 60% (Steijger et al., 2013). Our WemIQ requires the pre-assembled gene annotations as input. To understand how incomplete annotation would affect isoform quantification, we tested the performance of our model and others through simulation studies where some existing isoforms were missed by annotations.
There are many possibilities of how a missing isoform may affect the quantification of remaining known isoforms. The scenario that makes the deconvolution more challenging is when the missing isoform is very similar to one of the known isoforms. To simulate such a case, we built on top of the two-isoform gene model, and assumed a third isoform that was lowly expressed and missing in the annotation. The missing isoform was similar to the longer (or the shorter) transcript, but used an alternative splice site 100 nt away from the original splice site at the fourth exon (Supplementary Fig. S5D and S5E). As shown in Figure 3 , WemIQ still significantly outperforms RSEM and Cufflinks. For example, when the missing isoform was truncated from the longer one (‘ML’), the mean relative error for the two known isoforms was 0.56 for WemIQ, but increased to 0.74 and 0.68 for Cufflinks and RSEM, respectively (Ps < 5.1 × 10⁻⁷, paired Wilcoxon tests).
Fig. 3.
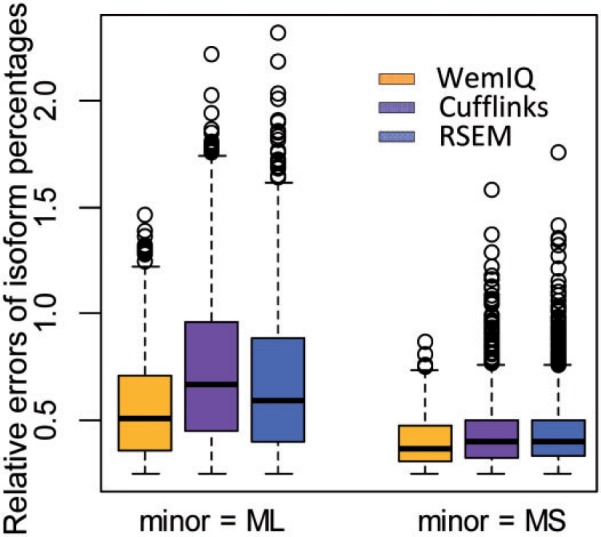
Comparison of isoform expression estimation in simulated data with incomplete gene annotation. ‘ML’ or ‘MS’ represents that the missing isoform is similar to the long or the short isoform but with an alternative splice site. The missing isoform was simulated to be lowly expressed as the minor isoform
3.4 WemIQ provides more accurate and robust estimation of exon inclusion rates
Exon-centric studies require the accurate inference of the inclusion rates of cassette exons. We compared the performance of WemIQ, Cufflinks, RSEM and SpliceTrap on this task in the two-isoform model (Fig. 4 ). Specifically, we considered six scenarios where the simulated true inclusion rates of the cassette exon were 1/5, 1/4, 1/3, 2/3, 3/4 and 4/5, respectively (the red lines in Fig. 4). In all cases, WemIQ outperformed Cufflinks, RSEM and SpliceTrap by providing more accurate estimation of inclusion rates with smaller variation (Fig. 4). When the exon was included at a relatively low level (i.e. 1/5–1/3), WemIQ still accurately inferred the inclusion rate while the performance of the other three methods was unsatisfactory. In general, Cufflinks and RSEM tended to overestimate the inclusion rates and SpliceTrap underestimated the inclusion rates. These deviations were further compounded by a large variation of the estimates (Fig. 4). In studies of splicing regulation, a difference of 0.1 in the inclusion rate is usually of high interest. We found that 18.9%, 21.6% and 40.9% of the exons analyzed by Cufflinks, RSEM and SpliceTrap, respectively, exhibited an inclusion rate deviating from the true rate by more than 0.1. Conversely, only 1.4% of cassette exons in WemIQ had such an error.
Fig. 4.
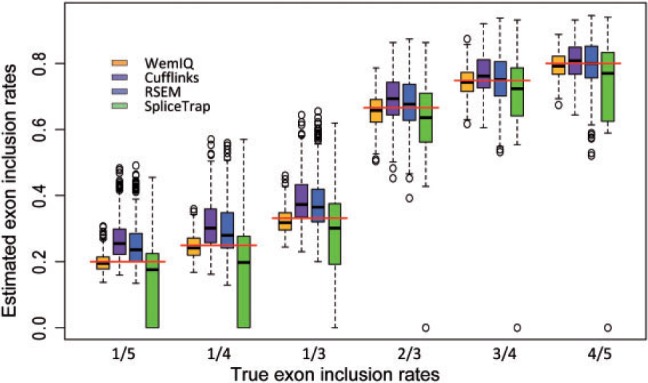
Comparison of exon inclusion rate estimation in the simulated data. The underlying true inclusion rates are also shown by the red horizontal lines
3.5 WemIQ provides accurate isoform quantification for simulations based on real gene structures
To test the performance of WemIQ under complicated gene structures, we also selected 78 genes with a variety of annotation structures from the Ensemble annotation. We then generated RNA-seq reads that shared similar bias characteristics as real data (see details in Section 4 of Supplementary Text S1). Besides, another quantification method MMSEQ (Turro et al., 2011) was included in the comparison here. The errors of isoform percentage estimates are shown in Supplementary Figure S6. WemIQ demonstrates lower estimation errors than those for Cufflinks, RSEM and MMSEQ (Ps < 0.0007, Wilcoxon tests). Linear regression models were used to evaluate the consistency between the true and estimated isoform percentages. The R-squared value for WemIQ was as high as 0.9273, larger than 0.879 for cufflinks, 0.8748 for RSEM and 0.883 for MMSEQ. In addition, WemIQ provides noticeably smaller number of isoform estimates with errors ≥0.1 (smaller number of red dots in Figure 5 as compared with other methods), suggesting improved estimation accuracy. Then we extended this simulation scheme to the genome-wide scale by selecting the annotation structures of all the multi-isoform autosomal genes in the Ensemble annotation (version 75). WemIQ still provided improved isoform-level estimation (Supplementary Fig. S7).
Fig. 5.
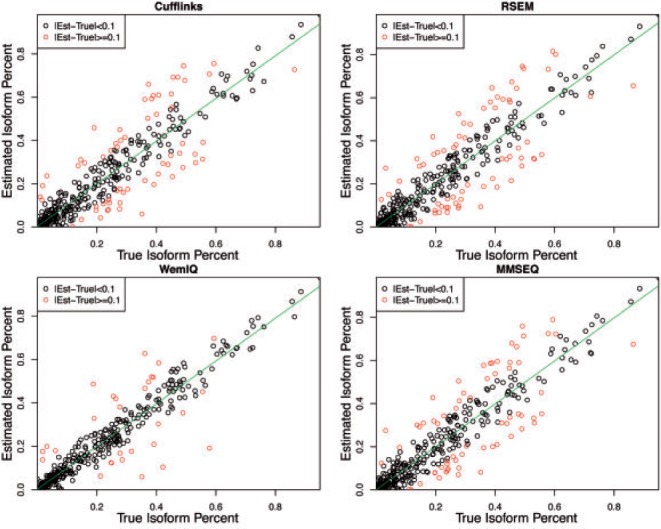
Isoform percentage estimation for simulations based on real gene annotation structures. WemIQ still demonstrates improved estimation accuracy with better agreement with the true percentages and smaller number of isoforms with large errors (red dots, |estimate−true value| ≥0.1)
3.6 Comparison of gene expression estimation with qRT-PCR
In addition to the advantages in the estimation of relative isoform expression and exon inclusion rates, WemIQ also provides more accurate overall gene expression estimation (i.e. the sum of isoform expressions). We used the TaqMan qRT-PCR results on ∼1000 genes in the Microarray Quality Control Project as a benchmark for gene expression measurements (Shi et al., 2006). Then we applied WemIQ, Cufflinks and RSEM on a set of 50-bp paired-end reads from the same human brain sample used in the qRT-PCR experiments and compared the estimates from both platforms (Au et al., 2010). The Pearson correlation of the log scale qRT-PCR and WemIQ gene quantifications was 0.739, higher than those of Cufflinks (0.681) and RSEM (0.700), indicating an improved overall gene expression estimation. The scatter plots of the RNA-seq quantification by different methods versus the qRT-PCR measurements are shown in Supplementary Figure S8. In addition, we investigated the gene-level estimation when its transcripts are heavily overlapped through simulations (Section 6 of Supplementary Text S1). WemIQ still performs better than other considered methods (Supplementary Fig. S11).
3.7 Robustness of expression estimates across laboratories and protocols
It is well known that even in the same tissue, biases in RNA-seq data usually vary significantly across different laboratories or protocols (Hansen et al., 2010; Li et al., 2010; Roberts et al., 2011). Therefore, a robust mRNA quantification method providing consistent estimation is valuable, particularly for the comparison or integrative analysis of RNA-seq data across laboratories. Here, we tested WemIQ, Cufflinks and RSEM on four RNA-seq datasets from two laboratories (‘Caltech’ and ‘Cshl’) with different protocols. Each laboratory provided two RNA-seq technical replicates for the GM12878 cells.
We observed a small but significant difference in the (i.e. the bias estimator) distribution in the four data sets, demonstrating different bias levels across laboratories. For example, the median for the ‘Caltech’ data (without preserving the strand information) were only 0.175 and 0.230, but they increased to 0.270 and 0.256 for the ‘Cshl’ data (preserving the strand information) (Ps < 2.2 × 10⁻¹⁶, paired Wilcoxon tests). To evaluate the estimation consistency across laboratories, we calculated the expression fold change between the two laboratories. The median gene expression fold change (i.e. the ratio of the larger value to the smaller value) was 1.74 for WemIQ, consistently <1.86 for Cufflinks and 2.05 for RSEM (P = 5.8 × 10⁻¹¹ for Cufflinks, and P < 2.2 × 10⁻¹⁶ for RSEM; paired Wilcoxon tests). However, ideally the median fold change should be around one to enable the direct cross-laboratory analysis. We further focused on the 628 highly expressed genes (details in Section 5 of Supplementary Text S1) because the estimation power for them is usually higher. The median fold change from WemIQ reduced to 1.47, still remarkably less than those from Cufflinks and RSEM (1.68 and 1.80, Ps < 2.2 × 10⁻¹⁶; paired Wilcoxon tests). In addition, we found that WemIQ consistently provided less number of genes with large expression fold changes (Fig. 6 A). Specifically, only 20.5% of the highly expressed genes showed more than 2-fold expression changes, compared with 35.0% for Cufflinks and 42.0% for RSEM (scatter plots in Supplementary Fig. S9).
Fig. 6.
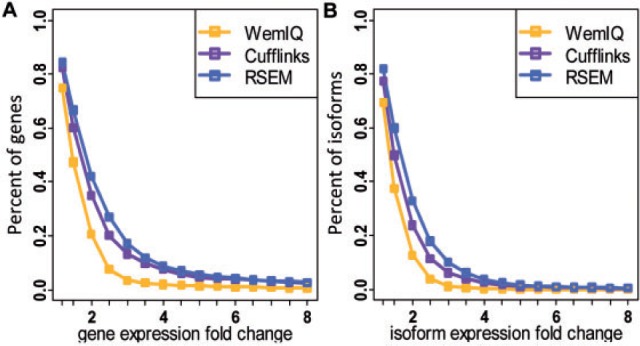
Estimation consistency between two laboratories. A: Expression fold change for highly expressed genes. B: Expression fold change for highly expressed isoforms. X-axis is the fold change threshold, and y-axis is the percentage of genes (or isoforms) exhibiting a fold change greater than the threshold. Results from four pair-wise comparisons between the two laboratories are pooled together
Similarly, WemIQ provided more consistent expression estimates at the isoform level. The median fold change of expressed isoforms between the two laboratories was 1.83 for WemIQ, significantly less than those for Cufflinks and RSEM (1.92 and 2.09; P = 1.4 × 10⁻¹⁰ for Cufflinks, and P < 2.2 × 10⁻¹⁶ for RSEM; paired Wilcoxon tests). We also selected 1938 highly expressed isoforms (details in Section 5 of Supplementary Text S1), the median fold change in WemIQ was only 1.36, but increased to 1.50 in Cufflinks and 1.66 in RSEM (Ps < 2.2 × 10⁻¹⁶, paired Wilcoxon tests). Furthermore, 12.7% of the highly expressed isoforms showed a larger than 2-fold expression change in WemIQ, compared with 23.8% and 32.9% in Cufflinks and RSEM, respectively (Fig. 6B, scatter plots in Supplementary Fig. S10). All these results suggest the improved robustness of isoform level estimation across laboratories.
3.8 WemIQ accounts for the bias heterogeneity in single-cell RNA-seq data
There is a rapidly emerging need to dissect the transcriptome from a tiny quantity of RNA (e.g. RNA from a single cell) (Adiconis et al., 2013; Shalek et al., 2013). Starting from very limited amount of genetic material, many more rounds of amplification are necessary during the library construction steps, possibly resulting in different bias patterns and additional computational challenges (Adiconis et al., 2013; Griebel et al., 2012). Here, we applied our method on 21 RNA-seq samples, including 18 single-cell and 3 population-cell RNA-seq data sets for the mouse bone–marrow-derived dendritic cells (Shalek et al., 2013).
The degree of bias is more variable in single-cell RNA-seq than population-cell RNA-seq. Compared with population-cell RNA-seq (‘P1–P3’), single-cell RNA-seq (‘C1–C18’) demonstrated larger variation among exon-level bias within a gene (Fig. 7 A, Ps < 4.1 ×10⁻¹⁶, Wilcoxon tests). As shown in the barplot of Figure 7B, the gene-level bias in a single-cell RNA-seq also varies a lot across different genes, demonstrating more severe bias heterogeneity across genes than that of population-cell RNA-seq (Ps < 2.6 × 10⁻¹¹, Wilcoxon tests). Besides, we calculated the pairwise gene-level correlation between the samples and provided the heatmap in Figure 7B. We found that the largest Pearson correlation coefficients were among the population-cell RNA-seq data sets (0.559–0.610), and the correlation between single-cell RNA-seq data sets (or between single-cell and population-cell RNA-seq) was much lower (0.279–0.583). The above results suggest that bias from single-cell RNA-seq varies more across genes or different regions of a specific gene than population-cell RNA-seq. Therefore, the heterogeneity of the observed read counts among individual single cells was severely complicated by the bias heterogeneity among single-cell RNA-seq experiments. The appropriate bias correction is essential to dissect real transcriptome differences among individual cells.
Fig. 7.
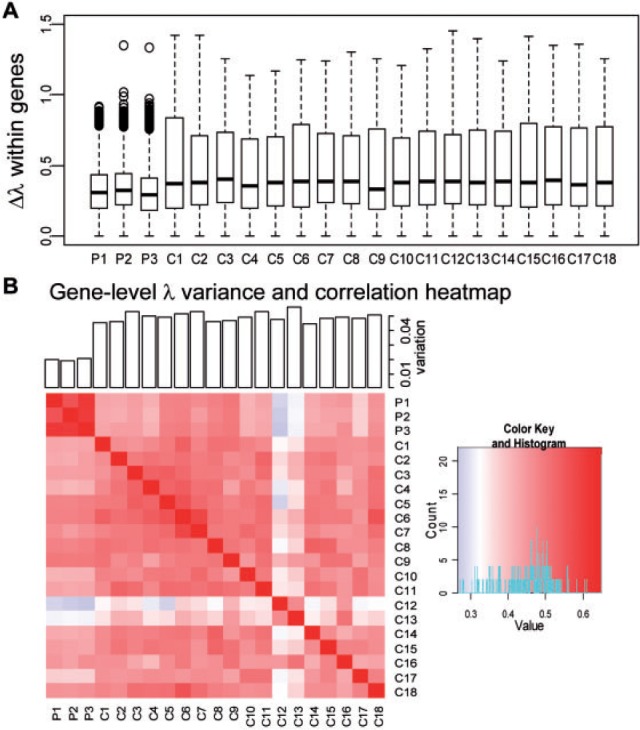
Comparison of the single-cell and population-cell bias parameter. A: Within-gene bias variation. The boxplots show the maximum difference () among exons within a gene. Single-cell RNA-seq (C1–C18) exhibits larger than population-cell RNAs-seq (P1–P3). B: Across-gene bias variation. Pair-wise gene-level correlation heatmap was given. The variance of gene-level s for each data set was plotted in the bars on top of the heatmap
By correcting the heterogeneous bias patterns through WemIQ, we obtained lower cell-to-cell expression variability than other methods (Fig. 8 ). Specifically, we selected 991 highly expressed genes (details in Section 5 of Supplementary Text S1) and calculated the coefficient of variation (CV) values of the 18 single-cell expression estimates for each gene. CV is often used to describe the extent of variability with respect to the mean, and a larger CV value suggests larger data variability. The median CV for WemIQ was 0.78, significantly less than 0.87 and 0.89 for Cufflinks and RSEM (Fig. 8A, Ps < 2.2 × 10⁻¹⁶, paired Wilcoxon tests). Besides, 907 highly expressed isoforms were selected and similarly we observed significantly smaller CV values from WemIQ (Fig. 8B, 0.76 versus 0.84 and 0.85 for Cufflinks and RSEM; Ps < 2.2 × 10⁻¹⁶, paired Wilcoxon tests). Although the cell-to-cell variability was smaller, it was still significantly larger than the CV from population-cell RNA-seq (Ps < 2.2 × 10⁻¹⁶, paired Wilcoxon tests for highly expressed genes or isoforms).
Fig. 8.
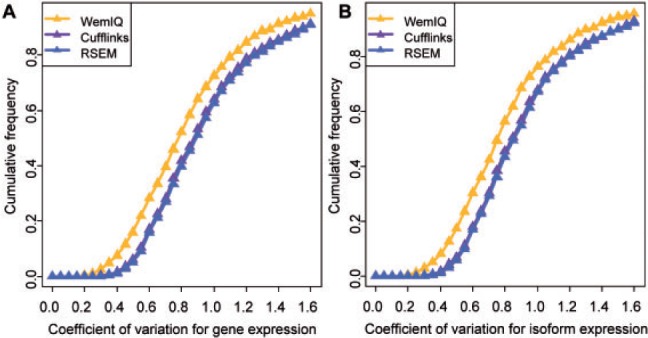
Expression variation across single cells by different methods. Based on the expression estimates from WemIQ, Cufflinks and RSEM, the CV across 18 single-cell RNA-seq data is calculated and their empirical cumulative distribution functions are shown for A: 991 highly expressed genes; and B: 907 highly expressed isoforms
Furthermore, we focused on expression fold changes between the values averaged across the 18 single-cell estimates and those from each of the population-cells (e.g. >10 000 cells) data. At both gene and isoform level, WemIQ provided less number of genes or isoforms with large fold changes. For example, only 25.9% and 25.3% of the highly expressed genes and isoforms exhibited at least 2-fold expression changes, obviously less than those from Cufflinks and RSEM (31.2% and 30.3% for Cufflinks, 36.8% and 35.2% for RSEM).
4 Discussion
Sequencing bias during RNA-seq experiments hinders the deconvolution of transcript isoform expression, because the expression heterogeneity caused by multiple isoforms of the same gene is mixed with that caused by different biases for different regions. Hence, isoform-level expression estimation from RNA-seq experiments is still a challenging problem and lines of methods were proposed for more accurate quantification (Bohnert and Ratsch, 2010; Hu et al., 2014; Huang et al., 2013; Li and Dewey, 2011; Mezlini et al., 2013; Suo et al., 2014). We previously developed a hierarchical Bayesian model (BASIS) to identify differentially isoforms without quantifying the absolute isoform expression for each condition (Zheng and Chen, 2009). However, the estimation of the absolute expression levels of transcript isoforms requires a more delicate handling of bias in RNA-seq. Our GP-based model can effectively separate bias from true expression signals (Srivastava and Chen, 2010). However, the simple integration of the GP probability mass function to the isoform deconvolution makes the computation infeasible.
WemIQ targets the challenges of accurate isoform quantification by an efficient weighted-log-likelihood-based EM algorithm. Reads from different genomic regions were assigned with different weights according to the degree of the sequencing bias. The bias parameter was estimated in a data-adaptive manner without any assumption about the bias source and format. The weight assignment can be treated as a ‘weighted sampling’ scheme to penalize or compensate oversampled or undersampled sequence reads.
Simulation studies with simple and real gene structures demonstrated that WemIQ significantly improved the expression estimation from both the isoform-centric and the exon-centric perspectives under a variety of gene structures. WemIQ can handle the additional overdispersion caused by missing transcripts and thus provides more robust estimations over Cufflinks and RSEM when gene annotation is incomplete. Besides, we compared the overall gene expression levels with other platforms such as the qRT-PCR results and WemIQ showed an improved estimation. It is worth mentioning that although qRT-PCR may not perfectly measure gene expression, it represents another independent platform with potentially different bias sources. Due to the lack of benchmark dataset, it is difficult to directly compare the isoform expression measurements. In addition to the improved estimation accuracy, WemIQ also provides very robust estimates based on the study of sub-sampled reads from a real RNA-seq data set (details in Section 7 of Supplementary Text S1, Supplementary Figs S12 and S13). On the other hand, we should note that there may be some extreme gene structures with many isoforms and each of them containing only a few nucleotide differences. The power of isoform quantification for these cases is limited and waits for more advanced sequencing technologies with more and longer sequence reads.
We also applied our method on a variety of real RNA-seq data, including the ENCODE data from different laboratories and single-cell sequencing data with very low input genetic materials. Results demonstrate that WemIQ provides more robust expression estimation at both the gene and isoform level. Therefore, WemIQ may serve as a powerful tool to make direct comparison across different experiments. We also note that in the cross-laboratory comparison, the median fold change was still higher than the ideal value of 1.0 and could be as large as 1.735 even for highly expressed genes or isoforms. Since we simply used the total bias-corrected reads to perform the normalization across samples, additional improvements on the normalization may further help the cross-laboratory analysis of RNA-seq data. In addition, we observed larger bias heterogeneity from single-cell RNA-seq data than the population-cell RNA-seq, which further complicated the exploration of true cell-to-cell expression variation. Due to the careful read weighting scheme, WemIQ discovered smaller expression variability in single cells.
WemIQ utilizes only reads that are uniquely mapped to the genome for the expression quantification. For earlier RNA-seq data where the read length is usually 36 nucleotides or less, it might be an issue to discard reads mapped to multiple genomic locations. However, with the development of sequencing technologies for longer reads, the effect of discarding multireads could be small for majority genes.
In summary, we propose WemIQ to quantify gene expression from the RNA-seq data with the transcript isoform resolution. It separates sequencing bias heterogeneity across different genomic regions or different laboratories from expression heterogeneity due to different transcript isoforms or different single cells. WemIQ can serve as a powerful quantification tool for transcriptomics.
Funding
This work was supported by the National Institutes of Health [R01GM097230].
Conflict of Interest: none declared.
Supplementary Material
References
- Adiconis X., et al. (2013) Comparative analysis of RNA sequencing methods for degraded or low-input samples. Nat. Methods, 10, 623–629. [DOI] [PMC free article] [PubMed] [Google Scholar]
- Au K.F., et al. (2010) Detection of splice junctions from paired-end RNA-seq data by SpliceMap. Nucleic Acids Res., 38, 4570–4578. [DOI] [PMC free article] [PubMed] [Google Scholar]
- Bohnert R., Ratsch G. (2010) rQuant.web: a tool for RNA-Seq-based transcript quantitation. Nucleic Acids Res., 38, W348–W351. [DOI] [PMC free article] [PubMed] [Google Scholar]
- Brett D., et al. (2002) Alternative splicing and genome complexity. Nat. Genet., 30, 29–30. [DOI] [PubMed] [Google Scholar]
- Cloonan N., et al. (2008) Stem cell transcriptome profiling via massive-scale mRNA sequencing. Nat. Methods, 5, 613–619. [DOI] [PubMed] [Google Scholar]
- Consul P.C. (1989) Generalized Poisson Distributions: Properties and Applications. Statistics, textbooks and monographs. M. Dekker, New York. [Google Scholar]
- Graveley B.R. (2001) Alternative splicing: increasing diversity in the proteomic world. Trends Genet., 17, 100–107. [DOI] [PubMed] [Google Scholar]
- Griebel T., et al. (2012) Modelling and simulating generic RNA-Seq experiments with the flux simulator. Nucleic Acids Res., 40, 10073–10083. [DOI] [PMC free article] [PubMed] [Google Scholar]
- Hansen K.D., et al. (2010) Biases in Illumina transcriptome sequencing caused by random hexamer priming. Nucleic Acids Res., 38, e131. [DOI] [PMC free article] [PubMed] [Google Scholar]
- Hu Y., et al. (2014) PennSeq: accurate isoform-specific gene expression quantification in RNA-Seq by modeling non-uniform read distribution. Nucleic Acids Res., 42, e20. [DOI] [PMC free article] [PubMed] [Google Scholar]
- Huang Y., et al. (2013) A robust method for transcript quantification with RNA-seq data. J. Comput. Biol., 20, 167–187. [DOI] [PMC free article] [PubMed] [Google Scholar]
- Langmead B., et al. (2009) Ultrafast and memory-efficient alignment of short DNA sequences to the human genome. Genome Biol., 10, R25. [DOI] [PMC free article] [PubMed] [Google Scholar]
- Li B., Dewey C.N. (2011) RSEM: accurate transcript quantification from RNA-Seq data with or without a reference genome. BMC Bioinformatics, 12, 323. [DOI] [PMC free article] [PubMed] [Google Scholar]
- Li J., et al. (2010) Modeling non-uniformity in short-read rates in RNA-Seq data. Genome Biol., 11, R50. [DOI] [PMC free article] [PubMed] [Google Scholar]
- Marguerat S., Bahler J. (2010) RNA-seq: from technology to biology. Cell Mol Life Sci., 67, 569–579. [DOI] [PMC free article] [PubMed] [Google Scholar]
- Mezlini A.M., et al. (2013) iReckon: simultaneous isoform discovery and abundance estimation from RNA-seq data. Genome Res., 23, 519–529. [DOI] [PMC free article] [PubMed] [Google Scholar]
- Mortazavi A., et al. (2008) Mapping and quantifying mammalian transcriptomes by RNA-Seq. Nat. Methods, 5, 621–628. [DOI] [PubMed] [Google Scholar]
- Nagalakshmi U., et al. (2008) The transcriptional landscape of the yeast genome defined by RNA sequencing. Science, 320, 1344–1349. [DOI] [PMC free article] [PubMed] [Google Scholar]
- Nilsen T.W., Graveley B.R. (2010) Expansion of the eukaryotic proteome by alternative splicing. Nature, 463, 457–463. [DOI] [PMC free article] [PubMed] [Google Scholar]
- Pan Q., et al. (2008) Deep surveying of alternative splicing complexity in the human transcriptome by high-throughput sequencing. Nat. Genet., 40, 1413–1415. [DOI] [PubMed] [Google Scholar]
- Roberts A., et al. (2011) Improving RNA-Seq expression estimates by correcting for fragment bias. Genome Biol., 12, R22. [DOI] [PMC free article] [PubMed] [Google Scholar]
- Shalek A.K., et al. (2013) Single-cell transcriptomics reveals bimodality in expression and splicing in immune cells. Nature, 498, 236–240. [DOI] [PMC free article] [PubMed] [Google Scholar]
- Shi L., et al. (2006) The MicroArray Quality Control (MAQC) project shows inter- and intraplatform reproducibility of gene expression measurements. Nat. Biotechnol., 24, 1151–1161. [DOI] [PMC free article] [PubMed] [Google Scholar]
- Srivastava S., Chen L. (2010) A two-parameter generalized Poisson model to improve the analysis of RNA-seq data. Nucleic Acids Res., 38, e170. [DOI] [PMC free article] [PubMed] [Google Scholar]
- Steijger T., et al. (2013) Assessment of transcript reconstruction methods for RNA-seq. Nat. Methods, 10, 1177–1184. [DOI] [PMC free article] [PubMed] [Google Scholar]
- Suo C., et al. (2014) Joint estimation of isoform expression and isoform-specific read distribution using multisample RNA-Seq data. Bioinformatics, 30, 506–513. [DOI] [PubMed] [Google Scholar]
- Trapnell C., et al. (2009) TopHat: discovering splice junctions with RNA-Seq. Bioinformatics, 25, 1105–1111. [DOI] [PMC free article] [PubMed] [Google Scholar]
- Trapnell C., et al. (2010) Transcript assembly and quantification by RNA-Seq reveals unannotated transcripts and isoform switching during cell differentiation. Nat. Biotechnol., 28, 511–515. [DOI] [PMC free article] [PubMed] [Google Scholar]
- Turro E., et al. (2011) Haplotype and isoform specific expression estimation using multi-mapping RNA-seq reads. Genome Biol., 12, R13. [DOI] [PMC free article] [PubMed] [Google Scholar]
- Wang Z., et al. (2009) RNA-Seq: a revolutionary tool for transcriptomics. Nat. Rev. Genet., 10, 57–63. [DOI] [PMC free article] [PubMed] [Google Scholar]
- Wu J., et al. (2011a) SpliceTrap: a method to quantify alternative splicing under single cellular conditions. Bioinformatics, 27, 3010–3016. [DOI] [PMC free article] [PubMed] [Google Scholar]
- Wu Z., et al. (2011b) Using non-uniform read distribution models to improve isoform expression inference in RNA-Seq. Bioinformatics, 27, 502–508. [DOI] [PubMed] [Google Scholar]
- Zheng S., Chen L. (2009) A hierarchical Bayesian model for comparing transcriptomes at the individual transcript isoform level. Nucleic Acids Res., 37, e75. [DOI] [PMC free article] [PubMed] [Google Scholar]
Associated Data
This section collects any data citations, data availability statements, or supplementary materials included in this article.