Abstract
Spontaneous molecular oscillations are ubiquitous in biology. But to our knowledge, periodic cell migratory patterns have not been observed. Here we report the highly regular, periodic migration of cells along rectilinear tracks generated inside three-dimensional matrices, with each excursion encompassing several cell lengths, a phenotype that does not occur on conventional substrates. Short hairpin RNA depletion shows that these one-dimensional oscillations are uniquely controlled by zyxin and binding partners α-actinin and p130Cas, but not vasodilator-stimulated phosphoprotein and cysteine-rich protein 1. Oscillations are recapitulated for cells migrating along one-dimensional micropatterns, but not on two-dimensional compliant substrates. These results indicate that although two-dimensional motility can be well described by speed and persistence, three-dimensional motility requires two additional parameters, the dimensionality of the cell paths in the matrix and the temporal control of cell movements along these paths. These results also suggest that the zyxin/α-actinin/p130Cas module may ensure that motile cells in a three-dimensional matrix explore the largest space possible in minimum time.
Spontaneous molecular oscillations in cells are common in biology1. Examples in eukaryotic and prokaryotic cells include genetic oscillations during circadian rhythms2, oscillatory actin waves that drive protrusion activity in the lamella of spreading cells3,4, oscillating Purkinje neuron activity that causes involuntary eye movement5, oscillations of spindle asters in C. elegans6,7, spontaneous oscillations of auditory hair bundles, which modify and modulate the mechanical properties of the hair bundle, allowing for their adaptation to sounds of different frequency8,9, RhoA-mediated periodic contraction of the actin cortex and associated periodic shape oscillations in spreading cells and in cells partially detached from their substratum, following microtubules disassembly10–15, and periodic pole-to-pole oscillations of Min proteins, which control the formation and location of the Z-ring in elongated bacterial cells16–21. Oscillations of cellular organelles and whole-cell shape oscillations have also been observed. For instance, the out-of-phase retractions of the trailing edge and leading edge in keratocytes result in periodic lateral oscillations of the cell body22, and the nucleus of neurons undergo interkinetic oscillations during retinal development23. Moreover, the nucleus, the microtubule-organizing center and the Golgi apparatus of the fibroblastic cells and gliomas patterned on narrow adhesive stripes can undergo oscillatory motion along the stripes24,25, although these oscillations are temporarily random, that is, the movement of these confined cells is not periodic. These different types of spontaneous oscillations occur in the absence of external force and are independent of initial conditions1. However, to our knowledge, spontaneous large-scale periodic migration of a whole cell in the absence of an externally applied oscillatory chemical, stiffness or electric gradient has not been observed (Supplementary Movies 1 and 2 illustrate such periodic migrations).
The protein zyxin, which concentrates mainly at focal adhesions, along stress fibres (SF), and at the leading edge of cells on flat substrates, regulates cell motility26–30. Here we investigated whether and how zyxin regulated the motility of cells embedded inside a three-dimensional (3D) matrix, a more physiological setting. In a previous paper31, we found that zyxin depletion yielded higher 3D cell speed compared with control cells (whereas the depletion of other focal adhesion proteins typically decreased cell speed), as well as higher 3D-persistent distance of migration, higher protrusion activity, higher growth rate of protrusions and higher cell-induced force applied onto the matrix, but unchanged two-dimensional (2D) cell speed on 2D substrates. Here we focus on the shape of trajectories forged by cells in matrix, which we contrast to the conventional 2D case.
Results
Depletion of zyxin induces oscillatory migration in 3D matrix
Similar to other single cells on 2D substrates, wild-type (WT) HT-1080 fibrosarcoma cells underwent random migration, that is, the trajectories of these cells were conventional 2D random walks (Fig. 1a,b; Supplementary Movie 3). This means that the paths taken by the cells on substrates were 2D (as shown below, these paths could have been one-dimensional (1D); Table 1) and that cells moved in a temporally random fashion along these 2D paths (they could have been periodic). These cellular trajectories are well described by just two parameters: cell speed and persistence time32, that is computer-generated 2D random-walk trajectories using only these two parameters are qualitatively similar33. Similarly, short hairpin RNA interference (shRNAi) zyxin-depleted cells placed on 2D substratum showed random-walk motility (Fig. 1c; Supplementary Movie 4; see Supplementary Fig. S1 for the characterization of the cells used in this paper). Moreover, the zyxin-depleted cells in which RNAi-resistant enhanced green fluorescent protein (EGFP)–zyxin was re-expressed (Fig. 1d), as well as cells depleted of other focal adhesion proteins, including talin (Fig. 1e), p130Cas (Fig. 1f), as well as vasodilator-stimulated phosphoprotein (VASP), focal adhesion kinase (FAK) and vinculin31, all showed random-walk motility.
Figure 1. Cells depleted of zyxin or other focal adhesion proteins undergo temporally random migration on a 2D substrate.
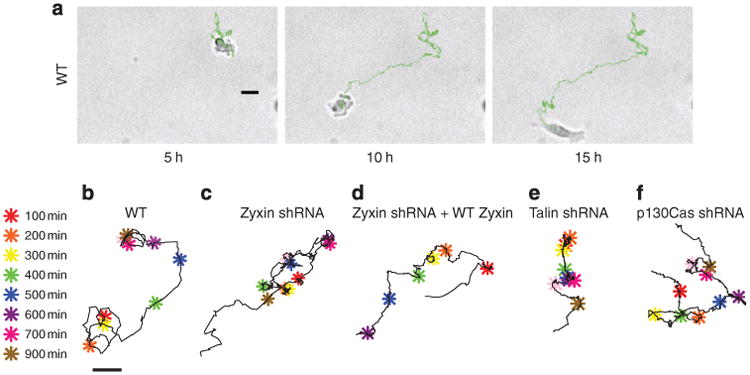
(a) Evolution of a typical trajectory of a single WT cell placed on a conventional 2D collagen I-coated glass substrate. Scale bar represents 20 μm. (b–f) Typical trajectories of a single WT cell (b), zyxin-depleted cell (c), zyxin-depleted cell where WT zyxin was re-expressed (d), talin-depleted cell (e) and p130Cas-depleted cell (f) placed on flat 2D collagen I-coated glass substrates. These trajectories are confined to the 2D plane of the substrate and are temporally random. Colour-coded asterisks indicate cell positions along the 1,000-min long trajectories at 100-min time intervals. Scale bar in panel (b) represents 20 μm and applies to all trajectories. Single-cell trajectories in panels (b–f) are representative of the most abundant motile phenotype for each case.
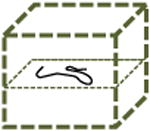
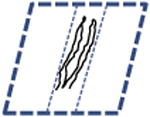
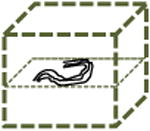
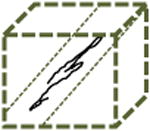
Table 1. Modes of cell migration.
| Trajectory | Characteristics | Condition | Trajectory | Characteristics | Condition | ||
|---|---|---|---|---|---|---|---|
|
|
|
||||||
| Temporal | Dimensional | Temporal | Dimensional | ||||
|
|
|
||||||
| 2D Substrate | 3D matrix | ||||||

|
Random | 2D | Wild Type, Zyxin shRNA, Zyxin shRNA + Wild Type Zyxin, Talin shRNA, p130cas shRNA, FAK shRNA |

|
Random | 3D | Wild Type, VASP shRNA, crp1 shRNA, Zyxin VBDmu, Zyxin shRNA + Wild Type Zyxin |

|
Periodic | 2D | Not Observed |

|
Periodic | 3D | Not Observed |
|
Random | 1D | Not Observed |
|
Random | 2D | Not Observed |
|
Periodic | 1D | Not Observed |
|
Periodic | 2D | Not Observed |

|
Unidirectional | Not Observed |
|
Random | 1D | α-actinin shRNA, Zyxin ΔABD | |
|
Periodic | 1D | Zyxin shRNA | ||||
| 1D Stripe |
|
Unidirectional | p130cas shRNA | ||||

|
Random | 1D | Wild Type, α-actinin shRNA, Zyxin ΔABD | ||||

|
Periodic | 1D | Zyxin shRNA | ||||
|
Unidirectional | Wild Type, Zyxin shRNA, α-actinin shRNA, Zyxin ΔABD | |||||
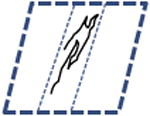
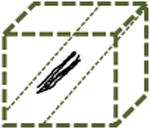
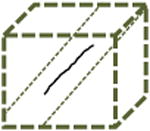
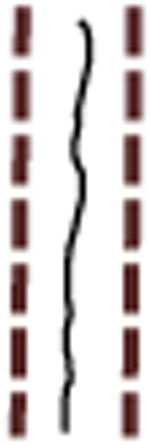
Left columns: schematics of possible and observed cell trajectories in 1D, 2D and 3D microenvironments. Middle columns: temporal and dimensional characteristics of cell migration. Right columns: types of cells (WT or shRNA-depleted of specific proteins), in which such migratory patterns were observed in this paper. On 2D substrates, focal adhesion proteins (zyxin, vinculin, talin, and so on) do not control the dimensional and temporal characters of migration of cells. However, in 3D matrices, zyxin controls both the dimensional and temporal characters of the cell trajectories. Moreover, the depletion of p130Cas and α-actinin, respectively, induces (mostly) 1D unidirectional and 1D random migration inside the 3D matrix. Finally, along the 1D stripes, depletion of zyxin and α-actinin induces periodic and random migration of cells, respectively. Note that the lines of a 1D random or periodic cell trajectory are in actuality and by definition identically overlapping, but are drawn slightly separated here for clarity.
Inside a 3D collagen I matrix, fully embedded WT HT1080 cells underwent 3D random-walk motility (Fig. 2a, Supplementary Movies 5 and 6). However, in striking contrast, the zyxin-depleted cells in a 3D matrix displayed highly periodic, oscillatory motion (Fig. 2b–d and Supplementary Movies 1 and 2). Zyxin-depleted cells moved unidirectionally over distances of several cell lengths before undergoing a sharp change in direction of exactly 180°, typically without a pause and/or lateral movement, and proceeded in the opposite direction for approximately the same time and same distance, and so on (Fig. 2c,d), along tracks that were either rectilinear or sometimes gently curved (Fig. 2b–d; Supplementary Movies 1 and 2). Lengths and durations of the excursions varied somewhat cell to cell, but for each cell, they showed low coefficients of variations (Fig. 2c,d), that is, these oscillations were periodic, not temporally random. These large-scale 1D periodic migratory oscillations occurred despite the fact that zyxin-depleted cells were completely embedded inside the matrix, which would a priori allow for movements of the cells in the entire 3D space of the matrix. Indeed, WT cells inside a matrix generated trajectories that had an open 3D spatial topology (Fig. 2a,e). The 1D periodic migratory patterns of the zyxin-depleted cells could not have been computer-generated as random walks by manipulating the values of cell speed and/or persistence34. Hence, our results reveal that, unlike for the 2D case, the two parameters, speed and persistence, are not sufficient to describe the 3D cell migration.
Figure 2. Zyxin mediates the 3D temporally random migration of single tumour cells in a 3D matrix.
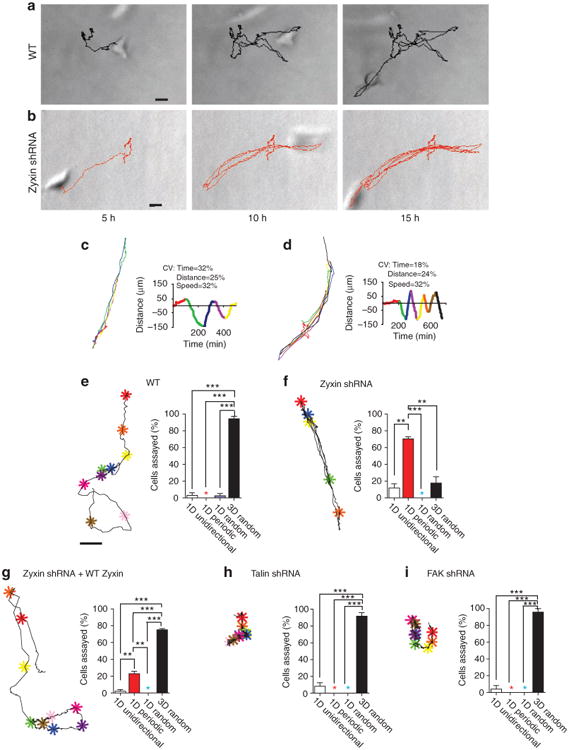
(a,b) Evolution of a typical random trajectory of a single WT cell (a) and typical evolution of a highly regular oscillatory trajectory of a single zyxin-depleted cell (b), both fully embedded inside a 3D collagen I matrix. Scale bar represents 20 μm. (c,d) Representative trajectories and corresponding time-dependent displacements along 1D tracks of two matrix-embedded zyxin-depleted cells (top and bottom panels). Each unidirectional movement of the cell, until it moved in the opposite direction, was colour-coded for ease of visualization. The right panels show the time-dependent displacements along the 1D paths in colours corresponding to the excursions shown in the left panels. Coefficients of variations (CV) of lengths and durations of the 1D periodic excursions are noted. (e–i) Typical trajectory (left) and percentages (right) of individual WT cells (e) and zyxin-depleted cells (f), zyxin-depleted cells where FH tagged-zyxin was expressed (g), talin-depleted cells (h), FAK-depleted cells (i) showing either a 1D unidirectional (white bar), 1D periodic (red bar), 1D random (blue bar), or conventional migration phenotype that was both 3D and temporally random (black bar). A coloured star indicates a value of zero. Colour-coded asterisks indicate cell positions along the 1,000-min long trajectories at 100-min time intervals. Scale bar in panel (e) represents 20 μm and applies to all trajectories. Single-cell trajectories in panels (a), (b) and (e–i) are representative of the most abundant motile phenotype for each case. Bar graphs show percentages of cells undergoing different modes of motility within each shRNA population; N = 3 biological repeats averaged for each graph; at least 30 cells were analysed. ***P < 0.001; **P < 0.01; *P < 0.05.
Ninety-six percent of WT cells underwent conventional 3D random-walk migration in the matrix, with 4% undergoing 1D random or 1D unidirectional migration (Fig. 2e). In contrast, just 20% of the zyxin-depleted cells underwent 3D random-walk motion, 70% underwent 1D periodic oscillatory migration and 10% underwent 1D unidirectional migration during the 16.5 h of observation (Fig. 2f). This difference may reflect the extent of zyxin depletion between individual cells. This remarkable 1D/oscillatory phenotype was largely rescued when RNAi-resistant EGFP–zyxin was re-introduced in zyxin-depleted cells (Fig. 2g). Indeed, nearly 80% of the zyxin-depleted cells co-expressing RNAi-resistant EGFP–zyxin underwent regular random-walk motion in the 3D matrix that was similar to the 3D migration of the WT cells. Only 21% underwent 1D periodic motion and 1% underwent 1D unidirectional migration confined to 1D tracks inside the matrix (Fig. 2g). Hence, the 1D/oscillatory zyxin phenotype is specifically caused by zyxin depletion and not an off-target effect of RNAi.
Zyxin phenotype is unique among focal adhesion proteins
Next, we assessed whether the 1D/oscillatory phenotype showed by cells depleted of the focal adhesion protein zyxin was shared by cells depleted of other well-known focal adhesion proteins. The depletion of major focal adhesion proteins, including talin (Fig. 2h) and FAK(Fig. 2i) did not qualitatively affect the mode of cell motility inside a 3D matrix compared with control WT cells; close to 100% of the cells depleted of these proteins formed the 3D random trajectories inside the matrix.
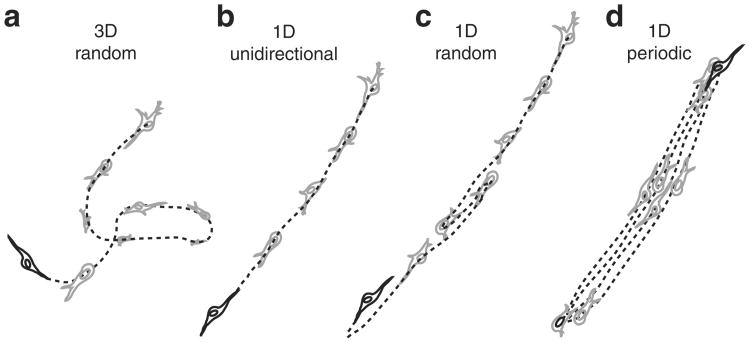
Finally, we verified that the 1D/oscillatory phenotype showed by HT-1080 fibrosarcoma cells depleted of zyxin was shared by other human fibrosarcoma cells, including 8387 fibrosarcomas (Supplementary Fig. S2). Zyxin-depleted 8387 fibrosarcomas cells also showed regular 1D periodic migratory oscillations within the 3D matrix. Together, these results indicate that zyxin has the distinct function of controlling the dimensionality of the trajectories (that is, 3D paths as opposed to rectilinear 1D paths in the matrix, Fig. 3a,b) and the temporal character of the migratory patterns along these paths (that is, temporally random as opposed to periodic oscillatory or unidirectional, Fig. 3c,d) inside a 3D matrix (see also Table 1).
Figure 3. Schematic of time-dependent trajectories of cells fully embedded inside 3D matrices.
(a) Conventional 3D random migration, as observed with WT cells and cells depleted of focal adhesions proteins such as vinculin, talin, FAK and VASP. (b) 1D unidirectional migration, as observed with p130Cas-depleted cells. (c) 1D random migration, as observed with α-actinin-depleted cells. (d) 1D periodic migration, as observed with zyxin-depleted cells (see also classification in Table 1).
Zyxin phenotype is mediated by partners α-actinin and p130Cas
Within cells on substrates, zyxin is localized to focal adhesions, SF and the leading edge of many motile cells where it interacts with its known binding partners: the F-actin-binding and crosslinking protein α-actinin, the cysteine-rich protein 1, the scaffolding protein p130Cas and the F-actin assembly regulator VASP30,35,36. We asked whether these proteins regulated 3D cell motility similarly to zyxin. ShRNAi α-actinin- and p130Cas-depleted cells showed no periodic migratory phenotype motion, but displayed motility phenotypes closer to the 1D/oscillatory phenotype than 3D random motility by being more frequently 1D (Fig. 4). Indeed, although 45% of the α-actinin-depleted cells still showed 3D random-walk motility, 55% forged 1D trajectories in the 3D matrix; these cells migrated randomly (that is, randomly changed their polarization) or unidirectionally (that is, maintained a constant polarization) along these 1D tracks, and no cells showed periodic oscillatory migration (Fig. 4a; Table 1). The p130Cas-depleted cells still showed 65% 3D random-walk motility, but 35% forged 1D unidirectional trajectories in the 3D matrix (Fig. 4c; Table 1). Hence, the 1D migration of p130Cas-depleted cells in matrix was neither temporally random nor periodic, but rather unidirectional, adding a third main type of temporal pattern of migration along the 1D paths in the matrix (Table 1). In contrast, VASP- and cysteine-rich protein 1-depleted cells underwent mostly regular 3D random-walk migration in matrix (Fig. 4b and d), giving rise to a distribution profile of cell motility similar to the WT cells (Fig. 2e). As controls, we found that α-actinin-, VASP- and p130Cas-depleted cells all underwent 2D random-walk motility on substrates (not shown).
Figure 4. Regulation of dimensionality and temporal character of cellular migration by binding partners of zyxin.
(a-d) Types of migration of α-actinin-depleted cells (a), VASP-depleted cells (b), 130Cas-depleted cells (c) and cysteine-rich protein 1 (CRP-1)-depleted cells (d) embedded in a 3D collagen I matrix for 12-h observation time. Cells displayed either 1D highly persistent (unidirectional) migration (white bars), 1D periodic oscillatory migration (red bars), 1D random migration (blue bars), or 3D random migration (black bars) inside the 3D matrix. A coloured star indicates a value of zero. Insets, typical trajectories of the corresponding cells. Colour-coded asterisks indicate cell positions along the 1,000-min long trajectories at 100-min time intervals. Scale bar in panel (a), 20 μm, applies to all trajectories in the insets of Fig. 4. (e). Schematic of the protein zyxin, which contains domains that bind to α-actinin, VASP and LIM domains that bind p130Cas. (f,g) Fractions of zyxin VBDmu cells (a zyxin mutant that cannot bind VASP) (f) and zyxin ΔABD cells (a zyxin mutant that lacks its α-actinin binding domain) (g) that undergo either 1D highly persistent (unidirectional) migration (white bars), 1D oscillatory migration (red bars), 1D random migration (blue bars), or 3D random migration (black bars) inside the 3D matrix. Insets, typical trajectories of the corresponding cells. Bar graphs in panels (a-d, f,g) show percentages of cells undergoing different modes of motility within each shRNA population N = 3 biological repeats averaged for each graph; at least 30 cells were analysed for each condition. ***P < 0.001; **P < 0.01; *P < 0.05.
By re-introducing RNAi-resistant mutants of zyxin selectively incapable of interacting with VASP or α-actinin, into zyxin-depleted cells (Fig. 4e), we asked whether the capacity of zyxin to interact with these proteins could explain zyxin's function in migrating cells in 3D. The expression of zyxin VBDmu—a zyxin mutant that cannot bind VASP, but can bind α-actinin and p130Cas (Fig. 4e and f)—in zyxin-depleted cells eliminated the oscillatory motion of most cells. Migratory patterns of these cells were either conventional 3D random walks, 1D random or 1D unidirectional (Fig. 4f), a motility profile similar to the WT cells. These results indicated that the ability of zyxin to bind VASP had no significant role in regulating the temporal and dimensional controls of motility by zyxin in a 3D matrix.
In contrast, the expression of zyxin ΔABD —a zyxin mutant lacking its α-actinin-binding domain, but retaining its VASP-and p130Cas-binding ability (Fig. 4e,g)—in zyxin-depleted cells converted these cells to a temporally random 1D migration phenotype (Fig. 4g). Seventy percent of these cells showed a 1D temporally random migration phenotype, whereas nearly all of the rest showed a 3D random-walk motility phenotype or 1D unidirectional (Fig. 4g). That the distributions of modes of migratory patterns in α-actinin-depleted cells (Fig. 4a) and in zyxin ΔABD cells (Fig. 4g) were different is likely to stem from the fact that α-actinin-binding partners, other than zyxin, are not directly affected in the case of zyxin ΔABD while they are for total α-actinin depletion. These results indicated that α-actinin and the ability of zyxin to bind α-actinin had a significant role in the regulation of the dimensionality of motility patterns of cells in matrix
Zyxin-depleted cells form straight channels in a 3D matrix
To move through the matrix, cells need to protrude31 and remodel the surrounding matrix37. Reflection confocal microscopy of the (unlabelled) collagen I matrix containing the cells revealed the microchannels generated by the movements of cells in the matrix. These studies showed that WT cells formed tortuous, thick, 3D, hollow tracks within the matrix, which were consistent with the 3D random-walk motion of the WT cells (Fig. 5a). The WT cells rarely moved back into empty channels left in their wake, as they preferred to deform and digest the matrix ahead of them38, indicated by the large majority that underwent 3D random migration (see cell trajectories, Fig. 2a,e, and Supplementary Movies 5 and 6). Hence, the periodic migratory oscillations of the zyxin-depleted cells in the matrix cannot be merely explained by cells retracing the channel formed during the first excursion because of the reduced steric interactions. In contrast to WT cells, the zyxin-depleted cells formed highly regular, thin, 1D tracks in the matrix (Fig. 5b), consistent with the 1D motion of the zyxin-depleted cells in the matrix. After forming a straight channel in the matrix during their first excursion, the zyxin-depleted cells moved back and forth in a highly regular manner along that channel (Fig. 2).
Figure 5. Regulation of cellular protrusion orientation and migratory patterns by zyxin and binding partners.
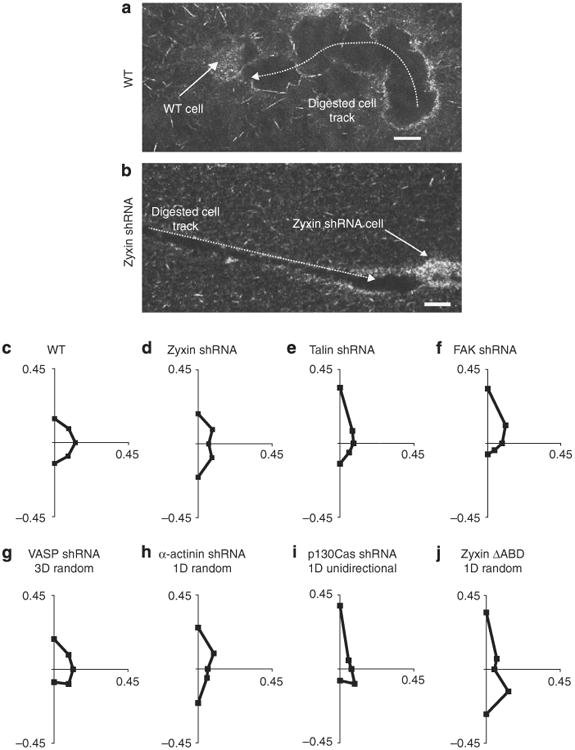
(a,b) Confocal reflection micrographs of typical tracks generated by an individual WT cell (a) and a zyxin-depleted cell (b) fully embedded inside a collagen I matrix. Scale bars represent 20μm. (c-j) Angular distributions of pseudopodial protrusions displayed by WT cells (c), zyxin-depleted cells (d), talin-depleted cells (e), FAK-depleted cells (f), VASP-depleted cells (g), α-actinin-depleted cells (h), p130Cas-depleted cells (i) and zyxin ΔABD cells (j) along the periphery of cells fully embedded inside a 3D matrix for a 12-h observation time. For each case, the direction of the first recorded protrusion is arbitrarily taken as pointing north, corresponding to the positive y axis of the graphs. Axes labels represent the fraction of the total number of protrusions, measured across multiple cells, which occurred in each radial direction about the centroid of the cells during the 12-h observation. Graphs of protrusion orientation summarize results within the specified mode of motility sub-population for a minimum of 100 protrusions and 8 cells over 12 h. Supplementary Figure S3 explains the methodology used to determine the orientation of protrusions in further detail.
Zyxin depletion promotes polarized protrusions in 3D matrix
HT-1080 cells in a 3D matrix generate pseudopodial protrusions that follow collagen fibres at the cell's leading edge, as they simultaneously pull on the fibres31. We hypothesized that, to mediate 1D motility inside the 3D matrix, zyxin depletion favoured the formation of protrusions oriented along the major cell axis—only in the direction of migration—to induce motility along the 1D tracks within the 3D matrix, instead of being isotropically oriented along the cell periphery. To test this, starting from a first recorded protrusion arbitrarily taken as being oriented in the north direction, we determined the time-dependent angular distribution of subsequent protrusions along the cell periphery (Fig. 5c–j; Supplementary Fig. S3 shows the methodology used here to measure the orientation of protrusions). Pseudopodia generated by the WT cells formed an isotropic angular distribution within ∼12 h, as protrusions occurred not only at the front, but also on the sides of the cell (Fig. 5c).
In contrast, the angular distribution of protrusions in periodically migrating zyxin-depleted cells was significantly more polarized (Fig. 5d). The absence of zyxin prevented these cells from generating protrusions uniformly along the cell periphery. Protrusions in talin-depleted cells showed a less uniform angular distribution than the WT cells, but were much more isotropic than the zyxin-depleted cells, with many protrusions at angles different from north and south (Fig. 5e). We note that the angular distribution of protrusions in talin-depleted cells is more enriched in the original northern direction than WT cells, because they have a persistence time of motility that is significantly longer than the WT cells (38 versus 23 min31). Finally, p130Cas-depleted cells, which displayed a significant population of persistent (unidirectional) 1D trajectories inside a 3D matrix (inset, Fig. 4c), showed a distribution that essentially favoured just one narrow peak after 12 h (Fig. 5i; unidirectional cell population only).
Next, we determined the angular distributions of protrusions in zyxin ΔABD (does not bind α-actinin) and zyxin VBDmu (does not bind VASP) cells (Fig. 4e), as well as α-actinin-depleted cells and VASP-depleted cells. The majority of zyxin ΔABD cells maintained the polarized directionality of protrusions, as seen with zyxin-depleted cells (Fig. 5j; only protrusions of cells undergoing 1D random migration are plotted), but their protrusions were unevenly distributed between the north and south poles, giving rise to the randomness of their 1D trajectories and further supporting the link between the dimensionality and temporal characteristics of the 3D cell motility and the angular distribution of protrusions. Protrusions in α-actinin-depleted cells were also mostly polarized north and south, but slightly less so than in zyxin-depleted cells (Fig. 5h; only cells undergoing 1D random migration are shown), as expected as these cells undergo 1D random-walk motility in the matrix (Fig. 4a). The angular distribution of protrusions in α-actinin-depleted cells was more enriched in the original northern direction, because they have a persistence time of motility that is significantly longer than WT cells31.
In summary, the angular distributions of protrusions strongly correlated with the type of displacements of cells inside a 3D matrix: isotropic for WT cells whose motion is dimensionally 3D, temporally random and single-peaked for unidirectional motion of p130Cas-depleted cells, and two-peaked for zyxin-depleted cells whose motion is 1D and oscillatory. Hence, zyxin depletion caused cells to forge 1D tracks inside the matrix, because it confined cell protrusions to two diametrically opposed directions along the cell axis in a temporally regular way.
Zyxin depletion induces oscillatory migrations on 1D tracks
Individual zyxin-depleted cells generate highly linear tracks along which they travel back-and-forth in the matrix (Figs 2, 5), but undergo temporally and spatially random migration on substrates. We asked whether the oscillatory component of the 1D/periodic oscillatory motion of the zyxin-depleted cells in the matrix was initiated by cues imparted by the fibrillar nature of the matrix, which elongated the cells. To address this question, we confined cells within 20-μm-wide collagen I-coated stripes on substrates flanked by non-adhesive polyethylene glycol-coated stripes to restrict cell motion to quasi 1D tracks similar to those spontaneously generated by zyxin-depleted cells inside a matrix33. The width of the stripes was chosen to be similar to the width of the tracks in 3D (Fig. 5b). This approach allowed us to separate the temporal aspects of migration in matrix (temporally random versus periodic versus unidirectional) from dimensional aspects of migration (1D versus 3D). On stripes, WT cells underwent 1D random-walk motion, albeit more persistent than observed in the 2D and 3D environments (Fig. 6a,d,e; Supplementary Movie 7). As cells on stripes can reorient their microtubule-organizing center and Golgi by encountering obstacles25, we tracked cells far from the marked edges of the patterns.
Figure 6. The oscillatory motion of zyxin-depleted cells in 3D matrix is recapitulated on 1D confining stripes on flat substrates.
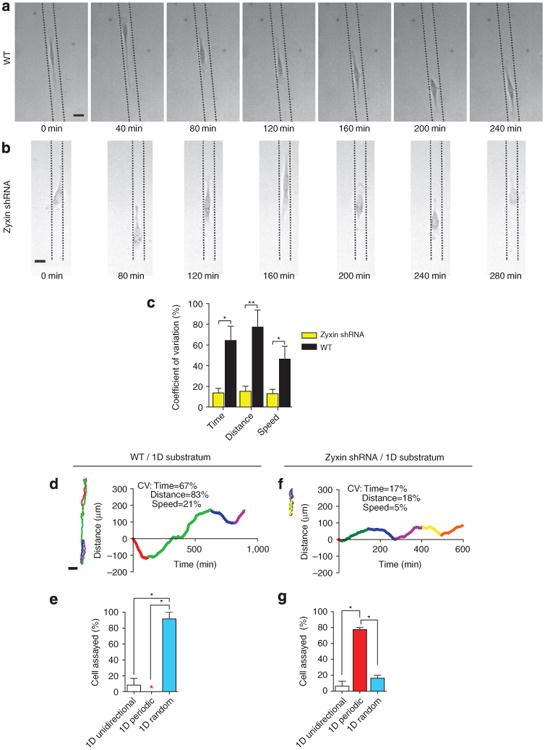
(a,b) Typical random 1D movements of WT cells (a) and periodic oscillatory 1D movements of zyxin-depleted cells (b) confined to collagen-I-coated, 20-μm-wide stripes flanked by non-adhesive 10-μm-wide polyethylene glycol stripes on substrates. Dotted lines on micrographs represent borders of the patterned collagen stripe on which the cell is migrating. Scale bar represents 20 μm. (c) Coefficients of variations of the length, duration and cell speed during each unidirectional excursion of WT and zyxin-depleted cells on 1D stripes. (d–g) Typical colour-coded trajectories (left) and corresponding time-dependent movements along the 1D stripes (right) of the WT cells (d,e) and zyxin-depleted cells (f,g) on 1D stripes. CV, coefficients of variations. Migration of the cells along the 1D stripes were either 1D unidirectional (white bars), 1D periodic (red bars), or 1D random (blue bars). Bar graph in (c), the excursions of at least eight cells were analysed for WT and zyxin shRNA. Remaining bar graphs show percentages of cells undergoing different modes of migration within each shRNA population. N = 3 biological repeats averaged for each graph; at least 25 cells were analysed for each graph. **P < 0.01; *P < 0.05.
In contrast, 75% of zyxin-depleted cells adopted a highly regular, periodic pattern of migration along the stripes, similar to the described 1D oscillatory movement of the zyxin-depleted cells inside a 3D matrix (Fig. 6b,f,g; Supplementary Movie 8). Although the lengths and durations of the oscillations varied from cell to cell, the coefficients of variation in the length, duration and cell speed of the 1D persistent moves for each zyxin-depleted cell was much lower than those of the WT cells (Fig. 6c).
The confinement of cells to stripes qualitatively changed the organization of filamentous actin and zyxin compared with the 2D case. As expected, EGFP–zyxin was positioned at the leading edge and at focal adhesions on conventional substrates (Fig. 7a). However, in majority of the cells on 1D stripes, EGFP–zyxin co-localized with actin at the leading and trailing edges, and cortically around the cell body (Fig. 7b, left panel). Few cells displayed discrete focal adhesions in these leading and trailing edges (Fig. 7b, right panel), and these focal adhesions were fewer and smaller than in the traditional 2D case, as previously described39. The EGFP–zyxin in cells fully embedded inside a matrix do not form large clusters either31. Similarly, actin filament bundles, readily visible at the basal surface of cells on substrates, largely disappeared at the ventral side and concentrated at the cortex when cells were confined to stripes (Fig. 7b), similarly to the concentration of actin bundles at the cortex in cells in the matrix31.
Figure 7. One-dimensional confining stripes recapitulate zyxin and actin localization of cells in 3D matrix and recapitulate the role of α-actinin in cellular migratory patterns.
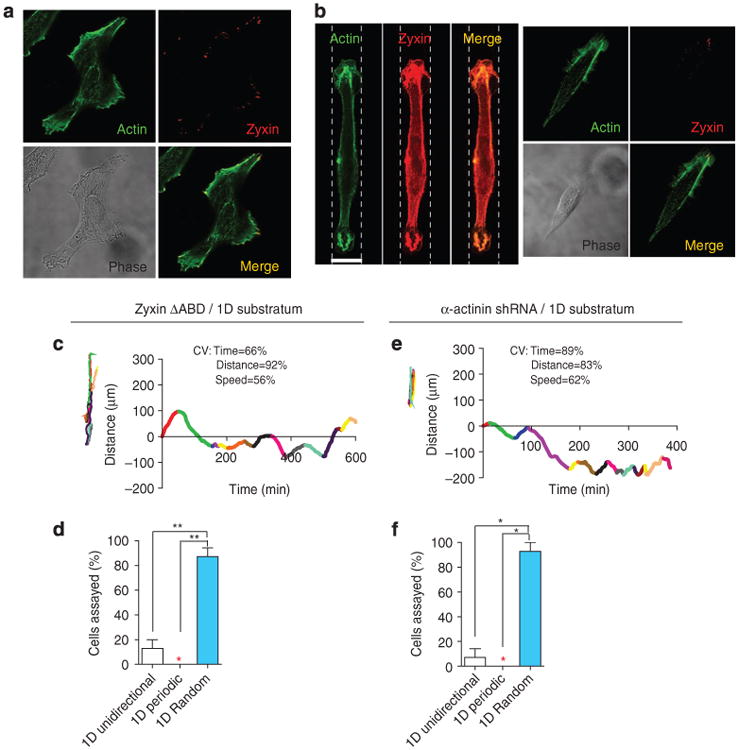
(a,b) Confocal micrographs of individual WT cells on flat collagen-coated 2D substrates (a) or 20-μm-wide collagen-coated stripes (b). Cells were stained for F-actin (green) and zyxin (red). Images were focused on the ventral side of the cells. Scale bar represents 20μm. Outlines of 1D micropatterns are shown with dotted lines. (c-f) Typical colour-coded trajectories (left, c,e) and corresponding time-dependent movements along the 1D stripes (right, c,e) of zyxin ΔABD cells (c,d) and α-actinin-depleted cells (e,f). CV, coefficients of variations. Fractions of cells showing either 1D unidirectional migration (white bars), 1D periodic oscillatory migration (red bars), or 1D random migration (blue bars) are displayed in panels (d) and (f). A coloured star indicates a value of zero. Bar graphs show percentages of cells undergoing different modes of migration within each shRNA population; at least 25 cells were analysed for each graph. **P < 0.01; *P < 0.05
For zyxin ΔABD cells (Fig. 7c,d) and α-actinin-depleted cells (Fig. 7e,f) on stripes, only temporally random and some unidirectional migration, comparable to WT cells, was observed. These results suggested that temporal and dimensional attributes of cell migration in matrix were tightly controlled by molecular mechanisms similar to those controlling the migration of cells along engineered 1D tracks. These results also suggest that elongating the zyxin-depleted cells may be sufficent to trigger and sustain periodic migration.
Oscillatory migration is not due to matrix compliance
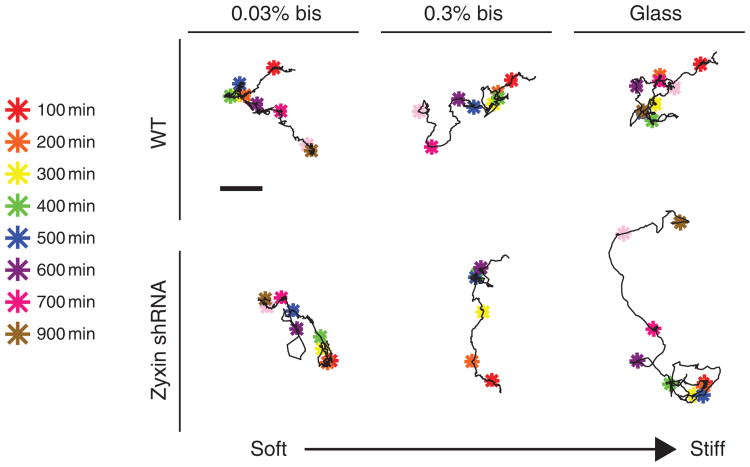
By moving cells from a 2D substratum to the more physiological environment of a 3D matrix, both the dimensionality of the cellular environment and the mechanical compliance of the environment are altered. A glass substratum coated with a thin layer of collagen I has a stiffness of ∼106 Pa, whereas a collagen I matrix has a low stiffness of ∼200 Pa40. To assess whether the oscillatory motion of the zyxin-depleted cells was caused by the high compliance of the collagen matrix, and not its three-dimensionality, the WT and zyxin-depleted cells were placed on planar compliant substrates using collagen-coated polyacrylamide gels containing controlled densities of crosslinkers, corresponding to stiffness values of 1, 50 and 500 kPa. We found that the WT and zyxin-depleted cells continued to show regular random-walk migration on soft substrates, which was qualitatively similar to that on glass substrates (Fig. 8). This suggests that the compliance of the 3D matrix alone does not mediate the 1D oscillatory motion of zyxin-depleted cells.
Figure 8. The 1D/oscillatory motion of zyxin-depleted cells in 3D matrix is not recapitulated on compliant surfaces.
Typical trajectories of WT cells (top) and zyxin-depleted cells (bottom) placed on very compliant (0.03% bis concentration in polyacrylamide gels), compliant (0.3% bis concentration) and stiff (glass) collagen-I-coated substrates. Colour-coded asterisks indicate cell positions along the 1,000-min long trajectories at 100-min time intervals. Scale bar (top) is 20 μm and applies to all trajectories. Here, 100% of WT and zyxin-depleted cells on compliant substrates showed 2D random trajectories; none showed 1D migration.
Discussion
Although the periodic motion of subcellular structures is a regular occurrence in eukaryotic and bacterial cells, to our knowledge, this is the first report of large-scale periodic oscillatory migration of cells. These periodic oscillations are spontaneous, that is, not driven by an external field, such as an alternating chemotactic gradient or an alternating electric-field gradient. This phenotype occurs in fibrillar matrix, which is physiologically more relevant than conventional 2D substrates. These studies reveal that, in addition to speed and persistence, cell migration in a 3D matrix also involves control of dimensional (1D versus 2D versus 3D) and temporal properties (periodic versus unidirectional versus random; Table 1) of cell movements. Hence, these results reveal that the basic aspects of 3D cell motility are exquisitely more regulated than 2D motility.
This work indicates that the periodic motion of zyxin-depleted cells, although completely abrogated on conventional substrates, can be recapitulated using 1D adhesive stripes to which cells are confined in their movements. Hence, these results also support the notion that 3D motility is more similar to 1D motility than 2D motility41. The fact that highly regular periodicity of the migration of zyxin-depleted cells in matrix, both in duration and travelled distance of each excursion, could be recapitulated using 1D stripes further suggest that the periodic migration of these cells may be initiated by a polarization cue (fibrillar collagen or linear stripes), propogated by an inability of the cells to reorient, and regulated by internal ‘clock’ and ‘ruler’, as opposed to extracellular-matrix hindrances or interactions.
How does zyxin ensure random migration of cells in 3D? Accumulating data in 2D studies has indicated that zyxin serves a unique mechanosensing and mechanotransducing role27,29,42. In response to cyclic stretch or shear stress, zyxin relocalizes from focal adhesions to terminal ends of SF and is required for SF thickening, maintenance and repair in response to external forces29,42. Whether the oscillation of the zyxin-depleted cells is a reflection of altered mechanosensing is a possibility, but it is unlikely to represent this function of zyxin, as this has been shown to require VASP binding and localization to SF27,29, whereas prevention of cellular oscillations in 3D by zyxin did not require VASP binding. Whether zyxin influences cell polarity response in a 3D matrix is another possibility, but the precise polarity responses of migrating cells in physiological 3D matrices remain to be defined and may well be distinct from cells on substrates. Moreover, zyxin has not been implicated in the direct regulation of cell polarity in cells migrating on substrates. We note that the enhanced persistence induced by depletion of zyxin is not sufficient to induce 1D/periodic migration. Indeed, the inhibition of Rho GTPase Rac1, which is known to enhance the persistence of migration43, did not induce significant 1D periodic migration in matrix (Supplementary Fig. S4). Rather, treated cells displayed the full range of dimensional and temporal characteristics associated with various modes of motility (Table 1). The drug NSC23766, which mainly targets and inhibits the Rho GTPase Rac 138,44, was applied at a final concentration of 10 μM.
Genetic and protein oscillations in cells often stem from negative feedback loops containing at least three regulatory elements45,46. By analogy, periodic 1D migratory oscillations may involve a negative feedback loop, which is likely to contain the major polarity complex Cdc42-PAR3-PAR6-aPKC and members of the Rho GTPase family47–49. The presence of a feedback loop may be induced by the (similar) 1D confinement of cells both in 1D micropatterns and in 3D matrix. Indeed, cell shape independent of other factors can have profound effects on the spatial distribution and level of activity of proteins, and therefore on signalling pathways50. Hence, after their initial elongation along the 1D fibres, cells in matrix control the dimensionality of their migratory patterns. It is not per se the extracellular matrix composed of 1D fibres that sustains the 1D migration of zyxin-depleted cells, as the lengths of cell excursions is much longer than both the pore size and the length of collagen fibres of the matrix. When adhesion ligands are presented in a linearly restricted fashion (via patterning on glass or collagen fibres in reconstituted matrices), cell morphology is similarly elongated instead of showing the broad, flat and thin morphology of cells on substrates. A signature of this similar cellular confinement may be reflected by the status of focal adhesions. On substrates, large focal plaques form along the basal surface of cells, but for 3D and 1D topologies, adhesion size and number are significantly reduced and their composition altered31,50–52.
Methods
Cell culture
HT-1080 cells (ATCC, Manassas, VA) were cultured in Dulbecco's modified Eagle's medium supplemented with 10% (v/v) fetal bovine serum (ATCC) and 500μl of Gentimicin (Sigma, St. Louis, MO). Medium for HT-1080 cells transfected with shRNA constructs (see more below) also included 1.5-μg ml−1 puromycin for selection. Cells were maintained at 37 °C and 5% CO2 in a humidified environment during culture and imaging. The cells were passaged every 2–3 days for a maximum of 20 passages for WT and 2 weeks for transfected cells. The 8387 fibrosarcoma cells (McCormick Lab, Michigan State University) were cultured in Eagles MEM (Invitrogen) supplemented with 1 mM sodium pyruvate (Sigma), 0.25 mM l-serine (Sigma), 0.15 mM l-aspartic acid (Sigma), 10% fetal bovine serum (Hyclone) and 100 U ml−1 penicillin and streptomycin (Invitrogen).
Depletion of proteins with shRNAs
The RNAi sequences targeting mRNA of each probed protein were selected with the RNAi design online programme from Dharmacon (http://www.dharmacon.com). Three to four targeting sites were chosen for each gene. After testing in HT1080 cells and 8387 fibrosarcomas with lentivirus-mediated RNAi, those that showed more than 90% depletion were selected for motility experiments. Depletion of talin, vinculin, FAK, p130Cas and zyxin in HT1080 cells was conducted as described in Fraley et al.31. The sequences used to deplete α-actinin and VASP are (the number after the sequence denotes the targeting position in mRNA): mh-ACTN1,4 5′-GCAGAGAAGTTCCGGCAGA-3′ (1299); mh-ACTN1,4 5′-GACCAAGATGGAGGAGATC-3′ (2123); mh-VASP 5′-GAGCCAAACTCAGGAAAGT-3′ (586). To rescue the zyxin-depleted cells, we generated an RNAi-resistant isoform of hZyxin (rrhZyxin) with four point mutations in the zyxin shRNA target sequence, keeping encoded amino acids intact (Supplementary Fig. S1A). Full-length rrhZyxin was obtained by overlapping PCR and subcloned into pFLRu-hZyxin-shRNA(756) in-frame with a C-terminal Flag-His tag. The zyxin mutant cDNA lacking the α-actinin-binding domain (zyxin ΔABD) was synthesized by removing amino acid residues 22–42 using rrhZyxin as a template, zyxin mutant lacking the VASP-binding domain (zyxin VBDmu) was constructed by making four point mutations (F71A, F93A, F104A, F114A), using rrhZyxin as a template kindly provided by Dr. Mary Beckerle (University of Utah). The two zyxin mutant cDNAs were subcloned into or pFLRu-hZyxin-shRNA(756) in-frame with C-terminal Flag-His tag; all constructs were sequence-validated. The shRNA expression cassettes were constructed by joint PCR, as described31. To rescue the depleted zyxin, an RNAi-resistant isoform of rrhZyxin was generated with zyxin shRNA target sequence, keeping encoded amino acids intact, based upon wobble base pairing rules. Full-length rrhZyxin was obtained by joint PCR and subcloned into pFLRu-hZyxin-shRNA(756) in-frame with C-terminal Flag-His tag. To construct C-terminal GFP-tagged zyxin in a lentiviral vector, we synthesized hZyxin cDNA by PCR and cloned it into the lentiviral vector pFLRu-GFP. Lentiviruses were generated and assessment of protein depletion in HT1080 (Supplementary Fig. S1) and 8387 fibrosarcoma cells (Supplementary Fig. S2) was conducted as described in Fraley et al.31. We note that the expression of a mutant zyxin first involves an shRNA-based depletion of endogeneous zyxin. Therefore, the two-part transduction, when zyxin mutant are expressed, results in some small residual 1D periodic behaviour, which is likely due to differences in expression levels of mutant zyxin (Fig. 2).
2D collagen I substrata
Two-dimensional cell culture plates were prepared by adding soluble rat tail type I collagen in acetic acid (BD Biosciences, San Jose, CA) to achieve a coverage of 33 μg cm−2 and incubated at room temperature for 2 h. Plates were then washed gently three times with PBS and plated with a low density of cells.
1D collagen I micropatterns
One-dimensional, 20-μm-wide stripes were patterned on glass coverslips using established microlithography techniques, as described33. Polydimethylsiloxane stamps were made by curing on an etched silicon wafer at 60 °C for 3 h. They were then coated with soluble rat tail type I collagen in acetic acid (BD Biosciences) and incubated at room temperature for 10 min. Simultaneously, glass coverslips were incubated in 5% (v/v) trimethoxysilane (Sigma) in ethanol for 20 min in the dark. Next, the coverslips were washed well with ethanol, then dried along with the coated stamps using pressurized N2. The coated stamps were applied to the coverslips using tweezers to avoid smudging and then swiftly removed. A 1 mg ml−1 solution of polyethylene glycol in room temperature PBS was then made and added to the stamped surface to incubate for 2 h in the dark. Coverslips were gently washed with room temperature PBS three times before cells were plated. Stamped 1D stripes are 3 mm in length. Care was taken to image in the middle of the patterned surface (to avoid edge effects), which was outlined with permanent marker on the bottom of the dish at the time of stamping.
3D collagen I matrices
Cell-impregnated 3D collagen matrices were prepared by mixing cells suspended in culture medium and 10× reconstitiution buffer (2.2 g sodium bicarbonate and 4.8 g HEPES 4-(2-hydroxyethyl)-1-piperazineethanesulfonic acid) in 100 ml nanopure water), 1:1 (v/v), with soluble rat tail type I collagen in acetic acid (BD Biosciences) to achieve a final concentration of 2 mg ml−1 collagen. Then, NaOH (1 M) was added to normalize pH (pH 7.0, 15–30 μl 1 M NaOH) and the mixture was placed in multi-well, coverslip-bottom culture plates (LabTek, Campbell, CA). All ingredients were kept chilled to avoid premature collagen polymerization, with care taken during mixing to avoid the introduction of bubbles into the collagen solution. Collagen gels were allowed to solidify overnight in an incubator at 37 °C and 5% CO2, then 500 μl of cell culture medium was added on top of the gels before use in experiments31,38. Cell density was kept low so as to ensure that single-cell motility measurements were accurate.
Immunofluorescence microscopy and reflection confocal microscopy
To visualize collagen, F-actin, and focal adhesions in cells plated 1D stripes, cells were fixed, permeablized, then incubated with primary antibodies against collagen I and zyxin for 1 h, or made to express EGFP–zyxin before plating and fixing. Then, they were washed and incubated with secondary antibody and Alexa Fluor 488 phalloidin (Invitrogen) for 1 h. Images of cells were collected using a Nikon A1 confocal microscope equipped with a ×60 water-immersion objective (Nikon) and controlled by Nikon Elements imaging software (NIS-3.1).
To visualize tracks left in the 3D collagen matrices by embedded cells, a Nikon A1 confocal microscope was configured to capture only reflected light from the 488-nm laser used to illuminate the sample and using a ×60 oil-immersion objective, NA = 1.4, WD = 210 μm (Nikon).
Cell tracking and trajectories
Cells embedded in the 3D collagen matrices were imaged at low magnification (×10) for 16.5 h. Single cells were tracked using image recognition software (Metamorph/Metavue), with position (x and y coordinates) measurements taken every 2 min. Trajectories were plotted based on this coordinate data. The 1D distance versus time graph for any given zyxin-depleted cell was plotted by comparing each position coordinate to the coordinate at the preceding time point to determine whether the cell was moving forward or backward. Then a ‘+’ or ‘−’ sign (forward or backward, respectively) was applied to the distance travelled between the two time points. Summing these distances and plotting them against time gives the distance versus time graph. Supplementary Movies 1,2,3,4,5,6 and 7 illustrate the methodology used in this paper to track individual cells on 1D and 2D substrates, and inside a 3D matrix, respectively. We note that only matrix-embedded cells, at least 200 μm away from the glass substrate, were monitored so as to avoid possible edge effects51.
Cell protrusion orientation
Protrusions at least 5 μm in length were monitored using a Roper Scientific Cascade 1 K CCD camera mounted on a Nikon TE2000E microscope. Low-magnification images were taken 2 min apart for at least 12 h. The length and position of the protrusions along the cell periphery were computed using tools in the Metamorph software and by hand. For protrusion orientation measurements, the space around the cell, originating at the cell's centriod, was divided into eight equal partitions with the northern partition aligned with the longest initial cellular protrusion. The fraction of total cellular protrusions that each of the eight partitions encompassed was calculated for each cell. Then all the data was combined to plot a final graph representing the fraction of protrusions in each partition. The protrusions of at least ten cells were characterized on three different days for each condition. Supplementary Figure S4 illustrates the method used in this paper to compute the orientation of protrusions during cell migration in matrix.
Statistics
The number of cells examined for each experiment is indicated in the figure captions. Mean values, s.e.m. and statistical analysis were calculated and plotted using Graphpad Prism (Graphpad Software, San Diego, CA). One-way analysis of variance and Tukey post-tests or pairwise two-tailed t-tests, depending on number of variables compared, were conducted to determine significance, which was indicated using the following guide scale: ***for P < 0.001, **for P < 0.01 and *for P < 0.05.
Supplementary Material
Acknowledgments
We thank Dr. J. Justin McCormick (Michigan State University, USA) for providing us with 8387 fibrosarcoma cells and Dr. Mary Beckerle (University of Utah, USA) for providing us with the zyxin VBD mutant. This research was supported in part by NIH Grant U54CA143868. S. I. F. was supported by an Achievement Reward for College Scientists (ARCS) and a National Science Foundation graduate fellowship. D. W. acknowledges fruitful discussions with Prof. Sean X. Sun (Johns Hopkins PSOC, USA) and Professor Timothy Elston (University of North Carolina and Johns Hopkins PSOC, USA).
Footnotes
Author contributions: Y. F. generated knockdowns; A. G. generated the CRP-1 knockdown cell line and performed associated migration experiments; S. I. F. performed all the other experiments and analysis, and co-wrote the manuscript; G. L. and D. W. co-supervised the project and co-wrote the manuscript.
Supplementary Information accompanies this paper at http://www.nature.com/naturecommunications
Competing financial interests: The authors declare no competing financial interests.
References
- 1.Kruse K, Julicher F. Oscillations in cell biology. Curr Opin Cell Biol. 2005;17:20–26. doi: 10.1016/j.ceb.2004.12.007. [DOI] [PubMed] [Google Scholar]
- 2.King DP, Takahashi JS. Molecular genetics of circadian rhythms in mammals. Annu Rev Neurosci. 2000;23:713–742. doi: 10.1146/annurev.neuro.23.1.713. [DOI] [PubMed] [Google Scholar]
- 3.Giannone G, et al. Periodic lamellipodial contractions correlate with rearward actin waves. Cell. 2004;116:431–443. doi: 10.1016/s0092-8674(04)00058-3. [DOI] [PubMed] [Google Scholar]
- 4.Kruse K, Camalet S, Julicher F. Self-propagating patterns in active filament bundles. Phys Rev Lett. 2001;87:138101. doi: 10.1103/PhysRevLett.87.138101. [DOI] [PubMed] [Google Scholar]
- 5.Yoshida T, Katoh A, Ohtsuki G, Mishina M, Hirano T. Oscillating Purkinje neuron activity causing involuntary eye movement in a mutant mouse deficient in the glutamate receptor d2 subunit. J Neurosci. 2004;24:2440–2448. doi: 10.1523/JNEUROSCI.0783-03.2004. [DOI] [PMC free article] [PubMed] [Google Scholar]
- 6.Grill SW, Kruse K, Jülicher F. Theory of mitotic spindle oscillations. Phys Rev Lett. 2005:94, 108104–108104. doi: 10.1103/PhysRevLett.94.108104. [DOI] [PubMed] [Google Scholar]
- 7.Pecreaux J, et al. Spindle oscillations during asymmetric cell division require a threshold number of active cortical force generators. Curr Biol. 2006;16:2111–2122. doi: 10.1016/j.cub.2006.09.030. [DOI] [PubMed] [Google Scholar]
- 8.Martin P, Bozovic D, Choe Y, Hudspeth AJ. Spontaneous oscillation by hair bundles of the bullfrog's sacculus. J Neurosci. 2003;23:4533–4548. doi: 10.1523/JNEUROSCI.23-11-04533.2003. [DOI] [PMC free article] [PubMed] [Google Scholar]
- 9.Martin P, Hudspeth AJ, Julicher F. Comparison of a hair bundle's spontaneous oscillations with its response to mechanical stimulation reveals the underlying active process. Proc Natl Acad Sci USA. 2001;98:14380–14385. doi: 10.1073/pnas.251530598. [DOI] [PMC free article] [PubMed] [Google Scholar]
- 10.Pletjushkina OJ, et al. Induction of cortical oscillations in spreading cells by depolymerization of microtubules. Cell Motil Cytoskeleton. 2001;48:235–244. doi: 10.1002/cm.1012. [DOI] [PubMed] [Google Scholar]
- 11.Costigliola N, et al. RhoA regulates calcium-independent periodic contractions of the cell cortex. Biophys J. 2010;99:1053–1063. doi: 10.1016/j.bpj.2010.06.010. [DOI] [PMC free article] [PubMed] [Google Scholar]
- 12.Kapustina M, et al. Mechanical and biochemical modeling of cortical oscillations in spreading cells. Biophys J. 2008;94:4605–4620. doi: 10.1529/biophysj.107.121335. [DOI] [PMC free article] [PubMed] [Google Scholar]
- 13.Weinreb GE, Elston TC, Jacobson K. Causal mapping as a tool to mechanistically interpret phenomena in cell motility: application to cortical oscillations in spreading cells. Cell Motil Cytoskeleton. 2006;63:523–532. doi: 10.1002/cm.20143. [DOI] [PubMed] [Google Scholar]
- 14.Salbreux G, Joanny JF, Prost J, Pullarkat P. Shape oscillations of non-adhering fibroblast cells. Phys Biol. 2007;4:268–284. doi: 10.1088/1478-3975/4/4/004. [DOI] [PubMed] [Google Scholar]
- 15.Paluch E, Piel M, Prost J, Bornens M, Sykes C. Cortical actomyosin breakage triggers shape oscillations in cells and cell fragments. Biophys J. 2005;89:724–733. doi: 10.1529/biophysj.105.060590. [DOI] [PMC free article] [PubMed] [Google Scholar]
- 16.Dajkovic A, Lan G, Sun SX, Wirtz D, Lutkenhaus J. MinC Spatially Controls Bacterial Cytokinesis by Antagonizing the Scaffolding Function of FtsZ. Curr Biol. 2008;18:235–244. doi: 10.1016/j.cub.2008.01.042. [DOI] [PubMed] [Google Scholar]
- 17.Raskin DM, de Boer PA. MinDE-dependent pole-to-pole oscillation of division inhibitor MinC in Escherichia coli. J Bacteriol. 1999;181:6419–6424. doi: 10.1128/jb.181.20.6419-6424.1999. [DOI] [PMC free article] [PubMed] [Google Scholar]
- 18.Raskin DM, de Boer PA. Rapid pole-to-pole oscillation of a protein required for directing division to the middle of Escherichia coli. Proc Natl Acad Sci USA. 1999;96:4971–4976. doi: 10.1073/pnas.96.9.4971. [DOI] [PMC free article] [PubMed] [Google Scholar]
- 19.Loose M, Kruse K, Schwille P. Protein self-organization: lessons from the min system. Annu Rev Biophys. 40:315–336. doi: 10.1146/annurev-biophys-042910-155332. [DOI] [PubMed] [Google Scholar]
- 20.Loose M, Fischer-Friedrich E, Herold C, Kruse K, Schwille P. Min protein patterns emerge from rapid rebinding and membrane interaction of MinE. Nat Struct Mol Biol. 18:577–583. doi: 10.1038/nsmb.2037. [DOI] [PubMed] [Google Scholar]
- 21.Loose M, Fischer-Friedrich E, Ries J, Kruse K, Schwille P. Spatial regulators for bacterial cell division self-organize into surface waves in vitro. Science. 2008;320:789–792. doi: 10.1126/science.1154413. [DOI] [PubMed] [Google Scholar]
- 22.Barnhart EL, Allen GM, Julicher F, Teriot JA. Bipedal locomotion in crawling cells. Biophys J. 2010;98:933–942. doi: 10.1016/j.bpj.2009.10.058. [DOI] [PMC free article] [PubMed] [Google Scholar]
- 23.Del Bene F, Wehman AM, Link BA, Baier H. Regulation of neurogenesis by interkinetic nuclear migration through an apical-basal notch gradient. Cell. 2008;134:1055–1065. doi: 10.1016/j.cell.2008.07.017. [DOI] [PMC free article] [PubMed] [Google Scholar]
- 24.Szabo B, et al. Auto-reverse nuclear migration in bipolar mammalian cells on micropatterned surfaces. Cell Motil Cytoskeleton. 2004;59:38–49. doi: 10.1002/cm.20022. [DOI] [PubMed] [Google Scholar]
- 25.Pouthas F, et al. In migrating cells, the Golgi complex and the position of the centrosome depend on geometrical constraints of the substratum. J Cell Sci. 2008;121:2406–2414. doi: 10.1242/jcs.026849. [DOI] [PubMed] [Google Scholar]
- 26.Feng Y, et al. The LIM protein, Limd1, regulates AP-1 activation through an interaction with Traf6 to influence osteoclast development. J Biol Chem. 2007;282:39–48. doi: 10.1074/jbc.M607399200. [DOI] [PubMed] [Google Scholar]
- 27.Yoshigi M, Hofman LM, Jensen CC, Yost HJ, Beckerle MC. Mechanical force mobilizes zyxin from focal adhesions to actin filaments and regulates cytoskeletal reinforcement. J Cell Biol. 2005;171:209–215. doi: 10.1083/jcb.200505018. [DOI] [PMC free article] [PubMed] [Google Scholar]
- 28.Hirota T, et al. Zyxin, a regulator of actin filament assembly, targets the mitotic apparatus by interacting with h-warts/LATS1 tumor suppressor. J Cell Biol. 2000;149:1073–1086. doi: 10.1083/jcb.149.5.1073. [DOI] [PMC free article] [PubMed] [Google Scholar]
- 29.Smith MA, et al. A zyxin-mediated mechanism for actin stress fiber maintenance and repair. Dev Cell. 2010;19:365–376. doi: 10.1016/j.devcel.2010.08.008. [DOI] [PMC free article] [PubMed] [Google Scholar]
- 30.Hofman LM, et al. Genetic ablation of zyxin causes Mena/VASP mislocalization, increased motility, and deficits in actin remodeling. J Cell Biol. 2006;172:771–782. doi: 10.1083/jcb.200512115. [DOI] [PMC free article] [PubMed] [Google Scholar]
- 31.Fraley SI, et al. A distinctive role for focal adhesion proteins in three-dimensional cell motility. Nat Cell Biol. 2010;12:598–604. doi: 10.1038/ncb2062. [DOI] [PMC free article] [PubMed] [Google Scholar]
- 32.Lauffenburger DA, Horwitz AF. Cell migration: A physically integrated molecular process. Cell. 1996;84:359–369. doi: 10.1016/s0092-8674(00)81280-5. [DOI] [PubMed] [Google Scholar]
- 33.Khatau SB, et al. A perinuclear actin cap regulates nuclear shape. Proc Natl Acad Sci USA. 2009;106:19017–19022. doi: 10.1073/pnas.0908686106. [DOI] [PMC free article] [PubMed] [Google Scholar]
- 34.Haber C, Ruiz SA, Wirtz D. Shape anisotropy of a single random-walk polymer. Proc Natl Acad Sci USA. 2000;97:10792–10795. doi: 10.1073/pnas.190320097. [DOI] [PMC free article] [PubMed] [Google Scholar]
- 35.Schmeichel KL, Beckerle MC. LIM domains of cysteine-rich protein 1 (CRP1) are essential for its zyxin-binding function. Biochem J. 1998;331(Part 3):885–892. doi: 10.1042/bj3310885. [DOI] [PMC free article] [PubMed] [Google Scholar]
- 36.Crawford AW, Michelsen JW, Beckerle MC. An interaction between zyxin and alpha-actinin. J Cell Biol. 1992;116:1381–1393. doi: 10.1083/jcb.116.6.1381. [DOI] [PMC free article] [PubMed] [Google Scholar]
- 37.Sabeh F, Shimizu-Hirota R, Weiss SJ. Protease-dependent versus-independent cancer cell invasion programs: three-dimensional amoeboid movement revisited. J Cell Biol. 2009;185:11–19. doi: 10.1083/jcb.200807195. [DOI] [PMC free article] [PubMed] [Google Scholar]
- 38.Bloom RJ, George JP, Celedon A, Sun SX, Wirtz D. Mapping local matrix remodeling induced by a migrating tumor cell using three-dimensional multiple-particle tracking. Biophys J. 2008;95:4077–4088. doi: 10.1529/biophysj.108.132738. [DOI] [PMC free article] [PubMed] [Google Scholar]
- 39.Rape AD, Guo WH, Wang YL. The regulation of traction force in relation to cell shape and focal adhesions. Biomaterials. 2011;32:2043–2051. doi: 10.1016/j.biomaterials.2010.11.044. [DOI] [PMC free article] [PubMed] [Google Scholar]
- 40.Yeung T, et al. Effects of substrate stiffness on cell morphology, cytoskeletal structure, and adhesion. Cell Motil Cytoskeleton. 2005;60:24–34. doi: 10.1002/cm.20041. [DOI] [PubMed] [Google Scholar]
- 41.Doyle AD, Wang FW, Matsumoto K, Yamada KM. One-dimensional topography underlies three-dimensional fibrillar cell migration. J Cell Biol. 2009;184:481–490. doi: 10.1083/jcb.200810041. [DOI] [PMC free article] [PubMed] [Google Scholar]
- 42.Colombelli J, et al. Mechanosensing in actin stress fibers revealed by a close correlation between force and protein localization. J Cell Sci. 2009;122:1665–1679. doi: 10.1242/jcs.042986. [DOI] [PubMed] [Google Scholar]
- 43.Pankov R, et al. A Rac switch regulates random versus directionally persistent cell migration. J Cell Biol. 2005;170:793–802. doi: 10.1083/jcb.200503152. [DOI] [PMC free article] [PubMed] [Google Scholar]
- 44.Gao Y, Dickerson JB, Guo F, Zheng J, Zheng Y. Rational design and characterization of a Rac GTPase-specific small molecule inhibitor. Proc Natl Acad Sci USA. 2004;101:7618–7623. doi: 10.1073/pnas.0307512101. [DOI] [PMC free article] [PubMed] [Google Scholar]
- 45.Pigolotti S, Krishna S, Jensen MH. Oscillation patterns in negative feedback loops. Proc Natl Acad Sci USA. 2007;104:6533–6537. doi: 10.1073/pnas.0610759104. [DOI] [PMC free article] [PubMed] [Google Scholar]
- 46.Bryant DM, Mostov KE. From cells to organs: building polarized tissue. Nat Rev Mol Cell Biol. 2008;9:887–901. doi: 10.1038/nrm2523. [DOI] [PMC free article] [PubMed] [Google Scholar]
- 47.Lee JS, Chang MI, Tseng Y, Wirtz D. Cdc42 mediates nucleus movement and MTOC polarization in Swiss 3T3 fibroblasts under mechanical shear stress. Mol Biol Cell. 2005;16:871–880. doi: 10.1091/mbc.E03-12-0910. [DOI] [PMC free article] [PubMed] [Google Scholar]
- 48.Daniels BR, Perkins EM, Dobrowsky TM, Sun SX, Wirtz D. Asymmetric enrichment of PIE-1 in the Caenorhabditis elegans zygote mediated by binary counterdiffusion. J Cell Biol. 2009;184:473–479. doi: 10.1083/jcb.200809077. [DOI] [PMC free article] [PubMed] [Google Scholar]
- 49.Daniels BR, Dobrowsky TM, Perkins EM, Sun SX, Wirtz D. MEX-5 enrichment in the C. elegans early embryo mediated by differential diffusion. Development. 2010;137:2579–2585. doi: 10.1242/dev.051326. [DOI] [PMC free article] [PubMed] [Google Scholar]
- 50.Meyers J, Craig J, Odde DJ. Potential for control of signaling pathways via cell size and shape. Curr Biol. 2006;16:1685–1693. doi: 10.1016/j.cub.2006.07.056. [DOI] [PubMed] [Google Scholar]
- 51.Fraley SI, Feng Y, Wirtz D, Longmore GD. Reply: reducing background fluorescence reveals adhesions in 3D matrices. Nat Cell Biol. 2011;13:5–7. doi: 10.1038/ncb0111-3. [DOI] [PMC free article] [PubMed] [Google Scholar]
- 52.Biggs MJ, Richards RG, Dalby MJ. Nanotopographical modification: a regulator of cellular function through focal adhesions. Nanomedicine. 2010;6:619–633. doi: 10.1016/j.nano.2010.01.009. [DOI] [PMC free article] [PubMed] [Google Scholar]
Associated Data
This section collects any data citations, data availability statements, or supplementary materials included in this article.


