

Abstract
Objectives
To characterize the endoscopic and histologic renal papillary lesions in a cohort of uric acid (UA) stone formers (SF).
Methods
Data was prospectively obtained during percutaneous nephrolithotomy between 2009–2013. Renal papillae were endoscopically analyzed to quantitate surface area (SA) occupied by plaque or plug, and biopsies were obtained. UA SF were compared to non-SF controls and patients with >50% CaOx in the absence of UA.
Results
There were 23 UA SF; of which 19 stones (83%) were admixed with CaOx and 4 (17%) were pure. Compared to CaOx SF and controls, UA SF had a higher prevalence of diabetes and obesity, greater serum creatinine and UA, lower eGFR and urine pH, and elevated UA supersaturation. Characteristics of UA SF were compared to 95 CaOx SF, and 19 controls. Overall, 23 (100%) UA SF had endoscopic plaque and 13 (57%) plugs. Endoscopically, UA SF displayed a greater incidence of plugging (57% vs 45% vs 11%; p=0.006) relative to CaOx SF and controls. Likewise, UA SF had a greater %SA of plugging (0.1 vs 0.0; p=0.002) and plaque (2.0 vs 0.9, p=0.006) than controls; but similar amounts to CaOx SF. Histologic plugs were similar in UA and CaOx SF, although CaOx SF demonstrated greater interstitial inflammation on endoscopic biopsy.
Conclusions
UA and CaOx SF have similar amounts of plaque, while UA SF have more endoscopic but not histological collecting duct plugs. These data suggest overlap between the pathogenesis of UA and CaOx stones. The anchoring site for UA stones remains uncertain.
Keywords: uric acid stones, endoscopy, Randall’s plaque, intramedullary collecting duct plugging, percutaneous nephrolithotomy
INTRODUCTION
Approximately 5–10% of all stone formers (SF) in the United States make uric acid stones (UA)1. Urinary characteristics that contribute to UA stone pathogenesis include low urine volume, hyperuricosuria and, most importantly, overly acidic urine2. Indeed UA supersaturation markedly increases at a pH of < 5.53. It has been previously reported that patients with the metabolic syndrome are at increased risk of UA stone formation due to an abnormally low urinary pH as a result of reduced renal ammoniagenesis that appears to be caused, at least in part, by insulin resistance4–10. Although these factors clearly promote UA crystallization, the mechanisms by which these crystals are retained in the kidney and grow into a stone are poorly defined.
Alexander Randall hypothesized that calcium stones form as deposits upon interstitial calcifications in the renal papillae, which were later named Randall’s plaque 11. In recent years, extensive work has been completed including endoscopic mapping and histopathology to further elucidate the association between Randall’s plaque and intramedullary collecting duct (IMCD) plugs, and the growth of calcium stones12–15. Investigators have described an association between the presence of plaque and multiple urinary parameters (low urine volume and pH, and high calcium)16. Previous studies have demonstrated IMCD plugging as a potential precursor lesion in patients with bowel disease and malabsorption17, as well as a subgroup of calcium oxalate (CaOx) stone formers (SF)18. A study of bowel resection patients demonstrated their IMCD plugs to be made of apatite and ammonium acid urate despite some of the stones being UA in composition17. However, to date no systematic anatomic studies have been completed to evaluate anatomic papillary lesions in a group of patients with UA stones in the absence of bowel disease. Here we report detailed mapping and biopsy results in a cohort of UA SF as compared to control patients without stones and a group of idiopathic CaOx SF. Results suggest an overlap in the pathology and pathogenesis of CaOx and UA stones.
PATIENTS AND METHODS
After Institutional Review Board approval, all non-pregnant patients over the age of 18 years undergoing percutaneous nephrolithotomy (PCNL) for urolithiasis by a single surgeon (AEK.) between September 2009 and June 2013, and who were able to give informed consent, were prospectively enrolled in this study. All patients had preoperative CT imaging for surgical planning, and a CT scan on postoperative day one to assess for residual fragments. Analyses were limited to 3 groups of enrolled patients: UA stones, CaOx stones, and controls. Patients were classified as UA if the stone contained any UA, and CaOx if a calcium stone contained > 50% CaOx in the absence of primary or enteric hyperoxaluria, bowel resection, renal tubular acidosis, medullary sponge kidney or primary hyperparathyroidism. Stones were classified based upon the % composition of UA including: majority (>80% UA), mixed (20–80% UA) and minority (<20% UA). Patients with a diagnosis of upper tract urothelial carcinoma and no prior history of nephrolithiasis who underwent nephroureterectomy, percutaneous tumor resection, or ureteroscopic tumor ablation were enrolled as a biopsy control group of non-SF.
Metabolic evaluation including 24-hour urine studies were obtained with patients on a random diet either preoperatively, if the patient was non-obstructed, or 6 weeks postoperatively. Due to a lack of comparable laboratory data within our non-SF controls undergoing endoscopy, a group of age and gender controlled non-SF in the community, collected as part of a parallel protocol, were matched in a 2:1 fashion to UA SF. Routine blood chemistries were obtained at a study visit. Stone composition was determined by micro-CT with confirmatory IR analysis, as previously described18.
After stone removal, the kidney undergoing PCNL was endoscopically mapped and a representative papillae was biopsied18,19. The papillary biopsy was taken from a calyx that would provide the best biopsy specimen within the confines of the surgical access and instruments. Endoscopic mapping and biopsy occurred after stone or tumor treatment. Quantification of papillary surface area (SA) covered by plaque and plug was completed using digital video data obtained at time of nephroscopy as previously described19. A plug was defined as a crystalline structure extruding from a duct of Bellini that could be physically removed, and a plaque was defined as discolored and slightly raised urothelium consistent with subepithelial crystal deposition20.
Papillary biopsy samples were fixed and sectioned as previously described, with one slide stained using Hematoxylin and Eosin and one with the method of Yasue for the presence of calcium18. Slides were read by a single renal pathologist (LHH) blinded to clinical details of the case and scored as none, mild (0–25% SA), moderate (26–75% SA) or marked (>75% SA) involvement with the following pathologies: 1) punctate tubular basement membrane (BM) Yasue staining; 2) dense tubular basement and adjacent interstitial Yasue staining; 3) intratubular Yasue positive calcifications; and 4) interstitial inflammation. The presence or absence of polarizing crystals (characteristic of CaOx) was also noted.
A Chi squared test was used for categorical data and Kruskal-Wallis test for continuous variables. All reported p-values were two sided, with p < 0.05 considered statistically significant. The median test, to evaluate the percentage of patients above the median, was utilized to compare differences in IMCD plug and plaque between each cohort. Statistical analyses were performed using SAS software version 9.3 and JMP version 9 (SAS Institute, Cary, NC; www.sas.com).
RESULTS
At the time of this analysis a total of 137 patients were enrolled in the study, of which 23 (17%) were UA SF with a median age of 60 years (IQR 56–70). Clinical characteristics are depicted in Supplemental Table 1. UA SF had a greater median body mass index (BMI) (36 vs. 29 vs. 30 kg/m2; p = 0.03) and increased prevalence of diabetes (52% vs. 22% vs. 16%; p = 0.007) relative to CaOx SF and controls. CaOx SF had a greater median number of stones than UA SF; whereas controls were older than both UA and CaOx SF. When stratified by the %UA composition, there were 10 (44%) majority, 8 (35%) mixed and 5 (22%) minority UA stones; of which 4 (17%) were pure and 19 (83%) were admixed UA stones that contained a mean 62% CaOx (range 10–97%) (Supplemental Figure 1). Among the UA SF, 2 (9%) had a history of small bowel surgery and 1 (4%) a horseshoe kidney.
Relative to CaOx SF and age-gender matched controls, UA SF had a greater serum creatinine (1.1 vs 1.0 vs 0.8; p < 0.0001) and UA (6.4 vs 5.8 vs 5.0; p = 0.0004), lower estimated GFR (69 vs 77 vs 95; p < 0.0001), and bicarbonate (26 vs 26 vs 28; p = 0.0002) (Supplemental Table 2). CaOx and UA SF had a greater serum calcium than controls. On urinary chemistries, UA SF had a lower urinary pH (5.7 vs. 6.0 vs. 6.3; p = 0.0024) and higher UA SS (delta Gibbs 2.0 vs. −0.2 vs. −2.1; p = 0.0001) compared to CaOx SF and matched controls (Supplemental Table 3). Urinary CaOx SS was, however, similar in UA and CaOx SF.
Endoscopic mapping of UA SF identified the presence of IMCD plugging in 13 (57%) patients (Figure 1A) and Randall’s plaque in 23 (100%) (Figure 1B), with a median %SA coverage of 0.1% (IQR 0.0–1.0) and 2.0% (IQR 1.0–3.1), respectively. The mean endoscopic % SA plug and plaque was 0.4% (±0.7) and 0.9% (±0.9) in pure and 0.7% (± 1.6) and 2.4% (±1.4) in mixed UA SF. When stratified based upon the % composition of UA within the stone, compared to majority and mixed, minority UA stones were found to have higher % SA plugging (0.5%±0.6 vs 0.0%±0.1 vs 2.0%±2.7, p = 0.04), while there was no difference found in mean %SA plaque across groups (1.5±0.9 vs 2.6±1.9 vs 2.7±1.1, p = 0.2).
Figure 1.
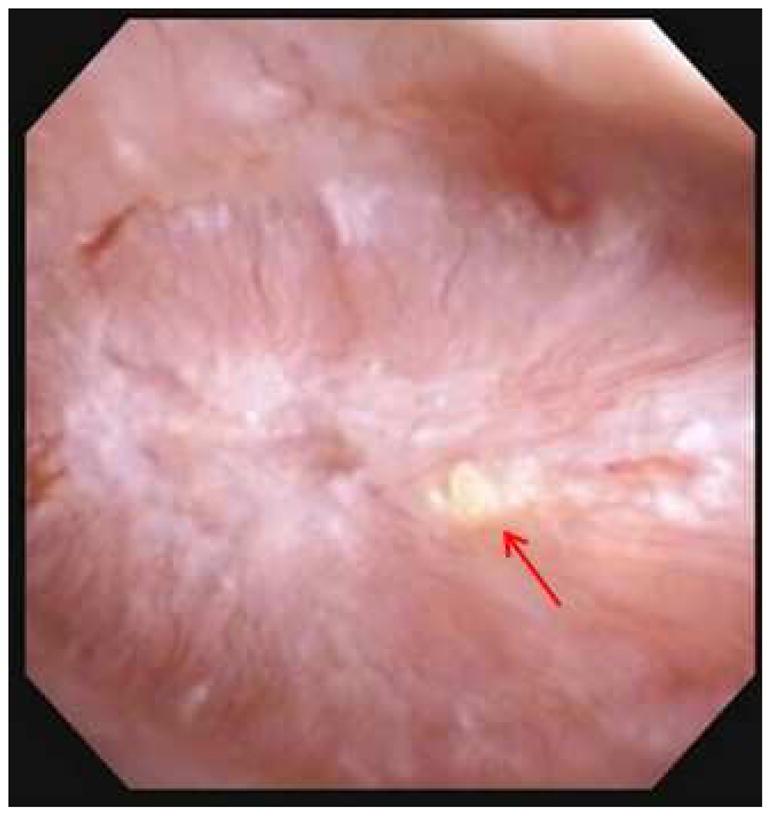
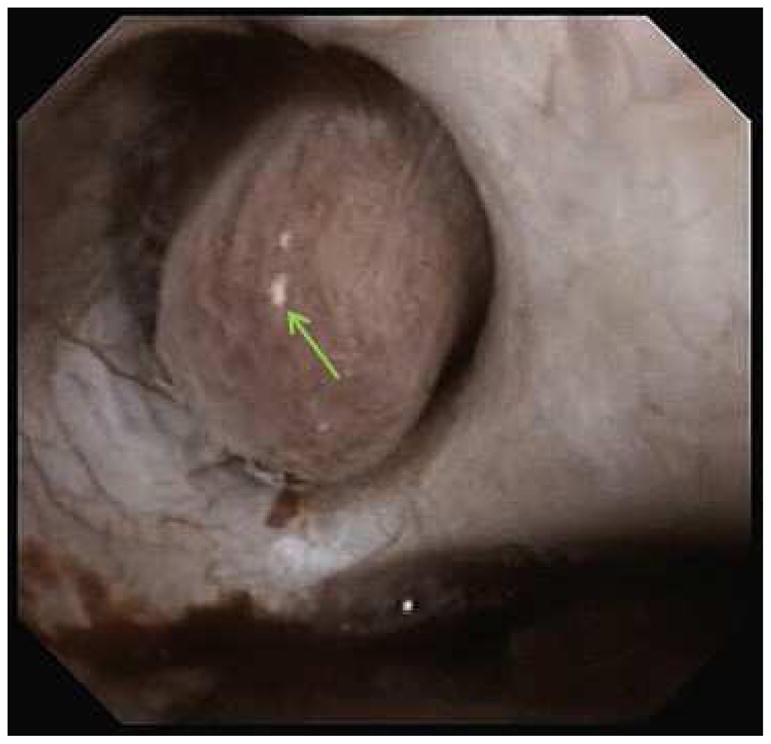
Figure 1A and B. Endoscopic mapping of UA papilla with A.) presence of IMCD tubular plugging (red arrow) and B.) papillary plaque (green arrow).
Endoscopic Randall’s plaque was noted in one or more calyces of 23 (100%) UA SF, 95 (100%) CaOx SF and 17 (90%) controls. Likewise, IMCD tubular plugging was noted in 13 (57%) UA SF, 43 (45%) CaOx SF and 2 (11%) controls (p = 0.006). Endoscopically, the median %SA covered with papillary plaque (p = 0.009) and plug (p = 0.006) was significantly lower among non-SF controls relative to SF (Table 1). Since the %SA occupied by plaque and plug were not normally distributed, a median test was applied and demonstrated that UA SF had a significantly greater %SA plaque (p = 0.006) and plug (p = 0.002) than controls and similar amounts relative to CaOx SF.
Table 1.
Endoscopic Precursor Lesions
| Non Stone Forming Endoscopic/Biopsy N = 19 |
CaOx N = 95 |
Uric Acid N = 23 |
p-value | |
|---|---|---|---|---|
| % Plaque SA (median; IQR) | 0.9 (0.6–1.5) | 2.0 (1.0–4.3) | 2.0 (1.0–3.1) | 0.009 |
| % Plug SA (median; IQR) | 0.0 (0.0–0.0) | 0.0 (0.0–0.7) | 0.1 (0.0–1.0) | 0.006 |
| Number with plaque > 0 (%) | 17 (90) | 95 (100) | 23 (100) | 0.002 |
| Number with plug > 0 (%) | 2 (11) | 43 (45) | 13 (57) | 0.006 |
Papillary and plaque data obtained at the time of endoscopic mapping.
Abbreviations: Calcium oxalate, CaOx; Surface area, SA
Figure 2 demonstrates typical intraluminal, punctate and dense BM calcifications in a UA SF. Histology of papillary tip biopsies demonstrated that CaOx SF had a greater prevalence of interstitial inflammation (p=<0.0001) and trend towards greater punctate BM calcifications (p = 0.054) (Figure 3A and Supplemental Table 4). Intraluminal calcifications (plug) and dense BM calcifications were similar between the two stone types. When the UA group was stratified by % UA composition, those with minority UA (hence majority CaOx) tended towards more dense BM staining than mixed or majority but this did not reach statistical significance (Figure 3B and Supplemental Table 5).
Figure 2.


Yasue-stained papillary biopsies from UA patients demonstrating A.) punctate BM calcifications; B.) dense BM calcifications; and C.) IMCD tubular plug
Figure 3.


Quantification of plaque and plug in papillary biopsies. Panel A: CaOx patients had more interstitial inflammation than UA patients and tended towards more punctate calcifications. Panel B: UA stone formers with majority CaOx (minority UA) tended to have more dense calcifications than the others, although this did not achieve statistical significance
DISCUSSION
In this study we examined urinary profiles, papillary anatomy and histology in a group of UA SF. Compared to CaOx and controls, UA SF had an elevated UA SS due to a lower urinary pH; however the three groups had similar urinary CaOx SS. In general, the distribution of plaque and plug was similar in UA SF and CaOx SF by both endoscopic mapping and histological examination of papillary tip biopsies; although there was a significantly greater interstitial inflammation and a trend towards more BM calcifications (plaque) among CaOx SF. Likewise, among UA SF, minority UA stones tended to have more plugs compared to mixed and majority stones. Plaque levels, meanwhile, were found to be similar across the three groups. These data suggest that UA SF are at risk for both CaOx and UA stones, and that their underlying pathology at the level of the papillum is similar. Indeed, UA stones often had alternating layers of CaOx and UA by micro CT. Among UA SF the amount of plaque may reflect the overall prevailing CaOx SS in a given patient, which also influences the relative percentage of CaOx versus UA in the final stone. Importantly, however, the key precursor lesion in the UA group, plaque, plug, or neither, is not immediately apparent.
Currently, the pathogenesis of UA stone formation is incompletely understood. It is generally assumed that UA stones form secondary to “free solution crystallization” within the renal pelvis and calyces3,21,22. Established risk factors include low urine volume, as seen in patients with ileostomies17,23, elevated urate excretion, encountered in those with gout23; but most importantly, low urinary pH which appears to be the most important risk factor4,7,8,10,24,25. This is due to the chemistry of UA which has a pKa of 5.3. Thus, when the urine pH approaches 5, the amount of protonated UA available for crystallization increases exponentially. Potential causes of an overly acidic urine include a high dietary acid load due to excessive protein intake 8, gastrointestinal losses of bicarbonate do to diarrhea or ostomy, chronic kidney disease, renal lipotoxicity26,27 and insulin resistance4,5,7–9,25. It has recently been reported that proximal tubular cell ammonium production from glutamine is influenced by insulin, and appears to be impaired in states of insulin resistance4,10,28. Indeed, our group of UA SF had a greater BMI, prevalence of diabetes and serum creatinine than the CaOx SF and controls.
Despite evidence that supports a key role of metabolic disturbances (mainly low urinary pH) in the pathogenesis of UA stones, little data exists evaluating the contribution of upper urinary tract anatomic lesions such as Randall’s plaque and IMCD tubular plugging17,18. In the current study, on endoscopic mapping, UA SF had a greater prevalence of IMCD tubular plugging (57%) compared to other groups, as well as a greater median % SA coverage with plug relative to non-SF controls (0.1% vs 0.0%; p=0.002). IMCD tubular plugging was previously described by Evan and colleagues in 7 patients with ileostomies that included 4 with UA stones. They theorized that this resulted in IMCD plugging17. In the current study we evaluated patients with UA stones regardless of gastrointestinal status, and also found that among the current cohort containing just 2 patients with a small bowel resection, IMCD plugging is still quite prevalent.
Papillary biopsies were available in the majority of our UA cohort. Of the 14 patients with available biopsy data, 12 (86%) demonstrated intraluminal crystals (histological “plugging”). While the Yasue stain detects calcium29, it does not detect non-calcium containing deposits17. Thus, it is possible that at least some of the plugs detected endoscopically were not calcium based. Evan and colleagues utilized micro-Fourier transform IR spectroscopy to characterize tubular deposits in a cohort of SF with bowel disease. Unexpectedly, these contained apatite, as found in calcium phosphate SF’s30; as well as sodium and ammonium acid urate17. The latter would not be seen by Yasue. Unfortunately, due to the biopsy fixative used in our study we were unable to determine the composition of the IMCD plugs observed.
The majority of UA SF had some amount of CaOx in their stones. Indeed, in many it was the major component. However, papillary anatomy and histology did not differ greatly within the UA group based upon the percentage of stone composed of UA. In addition, with the exception of interstitial inflammation, papillary anatomy and histology were similar between UA and CaOx patients; supersaturation for CaOx was similar across UA SF, CaOx SF and controls, while UA SS was higher in UA SF compared to the other two groups. These data suggest the UA SF are concurrently at risk for both CaOx and UA, while CaOx SF are at risk for calcium (but not UA) stones. Unfortunately, the current study does not clearly identify the nature of the key precursor lesion for UA stones. Among the UA group do stones anchor upon the substantial Randall’s plaque that was present, perhaps using a CaOx “bridge”? Can CaOx develop upon a UA nidus (perhaps in a plug)? Although both possibilities are consistent with our results, the current study did not characterize the attachment of stones to the renal papilla.
Limitations of the current study include its relatively small patient population and we attempted to control for this with a prospective, standardized design. Moreover, we recognize that the majority of UA SF were admixed with CaOx by micro CT analysis; which has demonstrated superior results in accurately characterizing stone composition relative to traditional methods. Indeed, to accurately define anatomic and histologic differences in a subset of pure UA SF a larger cohort would be necessary. Meanwhile, the endoscopic non-SF control population had limited laboratory data; therefore, we utilized an age-gender matched non-SF population with robust serum and urinary data to enhance our analysis. Since we were unable to determine plug composition, prospective studies of known UA SF are necessary to determine IMCD plug composition, but may be difficult since such patients are often treated with dissolution therapy. Finally, these data are from a single, tertiary referral institution and require external validation. Nevertheless, our study is the largest and most complete study of papillary anatomy in a group of idiopathic UA SF to date.
CONCLUSIONS
As others before us, we found significant differences between the UA SF patient phenotype compared to non-SF controls and idiopathic CaOx SF, namely: a lower urinary pH, higher serum creatinine and UA, lower GFR, greater BMI, and higher prevalence of diabetes. Moreover, we identified an increased incidence of endoscopic tubular plugging among UA SF relative to other cohorts, as well as significantly greater papillary plug SA coverage compared to non-SF controls. Meanwhile, except for interstitial inflammation which was more prevalent among CaOx SF, histologic and endoscopic papillary plaque characteristics overlapped between SF cohorts. These results suggest that IMCD tubular plugs may play a role in crystal retention. However, the role of plaque in UA stone formation remains an open question, especially since the vast majority of UA stones contain some CaOx. Indeed, the prevailing metabolic abnormalities, mainly UA SS, may drive the formation of UA or CaOx within the stones, and this appears to fluctuate over time, as reflected by the alternating layers of crystal types in the final stone.
Supplementary Material
Supplementary Figure 1. Photomicrograph and Micro-CT images of mixed UA stone demonstrating heterogeneous layering of UA (red arrow) and CaOx (green arrow)
Supplementary Table 1. Patient Characteristics
Supplementary Table 2. Serum Characteristics
Supplementary Table 3. Urine Characteristics
Supplementary Table 4. Papillary pathology UA vs CaOx
Supplementary Table 5. Papillary pathology vs percentage of UA
Acknowledgments
This work was supported by the Mayo Clinic O’Brien Urology Research Center U54 DK100227 from the National Institute of Diabetes and Digestive and Kidney Diseases and Grant Number UL1 TR000135 from the National Center for Advancing Translational Sciences (NCATS). Its contents are solely the responsibility of the authors and do not necessarily represent the official views of the NIH. The authors thank Mark Korinek for technical assistance and Brittni Barnett for study coordinator support. We also thank Fang Zhao MD, PhD and Xiangling Wang MD, PhD for their work with the renal stone database.
ABBREVIATIONS
- CaOx
calcium oxalate
- IMCD
intramedullary collecting duct
- PCNL
percutaneous nephrolithotomy
- SF
stone former
- SS
supersaturation
- SA
surface area
- UA
uric acid
- BM
basement membrane
Footnotes
Publisher's Disclaimer: This is a PDF file of an unedited manuscript that has been accepted for publication. As a service to our customers we are providing this early version of the manuscript. The manuscript will undergo copyediting, typesetting, and review of the resulting proof before it is published in its final citable form. Please note that during the production process errors may be discovered which could affect the content, and all legal disclaimers that apply to the journal pertain.
References
- 1.Gutman AB, Yu TF. Uric acid nephrolithiasis. The American journal of medicine. 1968;45:756–79. doi: 10.1016/0002-9343(68)90209-x. [DOI] [PubMed] [Google Scholar]
- 2.Sakhaee K, Maalouf NM, Sinnott B. Clinical review. Kidney stones 2012: pathogenesis, diagnosis, and management. The Journal of clinical endocrinology and metabolism. 2012;97:1847–60. doi: 10.1210/jc.2011-3492. [DOI] [PMC free article] [PubMed] [Google Scholar]
- 3.Shekarriz B, Stoller ML. Uric acid nephrolithiasis: current concepts and controversies. The Journal of urology. 2002;168:1307–14. doi: 10.1016/S0022-5347(05)64439-4. [DOI] [PubMed] [Google Scholar]
- 4.Abate N, Chandalia M, Cabo-Chan AV, Jr, Moe OW, Sakhaee K. The metabolic syndrome and uric acid nephrolithiasis: novel features of renal manifestation of insulin resistance. Kidney International. 2004;65:386–92. doi: 10.1111/j.1523-1755.2004.00386.x. [DOI] [PubMed] [Google Scholar]
- 5.Lieske JC, de la Vega LS, Gettman MT, Slezak JM, Bergstralh EJ, Melton LJ, 3rd, Leibson CL. Diabetes mellitus and the risk of urinary tract stones: a population-based case-control study. American journal of kidney diseases : the official journal of the National Kidney Foundation. 2006;48:897–904. doi: 10.1053/j.ajkd.2006.09.002. [DOI] [PubMed] [Google Scholar]
- 6.Maalouf NM, Sakhaee K, Parks JH, Coe FL, Adams-Huet B, Pak CY. Association of urinary pH with body weight in nephrolithiasis. Kidney International. 2004;65:1422–5. doi: 10.1111/j.1523-1755.2004.00522.x. [DOI] [PubMed] [Google Scholar]
- 7.Daudon M, Traxer O, Conort P, Lacour B, Jungers P. Type 2 diabetes increases the risk for uric acid stones. Journal of the American Society of Nephrology : JASN. 2006;17:2026–33. doi: 10.1681/ASN.2006030262. [DOI] [PubMed] [Google Scholar]
- 8.Cameron MA, Maalouf NM, Adams-Huet B, Moe OW, Sakhaee K. Urine composition in type 2 diabetes: predisposition to uric acid nephrolithiasis. Journal of the American Society of Nephrology : JASN. 2006;17:1422–8. doi: 10.1681/ASN.2005121246. [DOI] [PubMed] [Google Scholar]
- 9.Maalouf NM, Cameron MA, Moe OW, Sakhaee K. Metabolic basis for low urine pH in type 2 diabetes. Clinical journal of the American Society of Nephrology : CJASN. 2010;5:1277–81. doi: 10.2215/CJN.08331109. [DOI] [PMC free article] [PubMed] [Google Scholar]
- 10.Sakhaee K, Adams-Huet B, Moe OW, Pak CY. Pathophysiologic basis for normouricosuric uric acid nephrolithiasis. Kidney International. 2002;62:971–9. doi: 10.1046/j.1523-1755.2002.00508.x. [DOI] [PubMed] [Google Scholar]
- 11.Randall A. Papillary pathology as a precursor of primary renal calculus. Journal of Urology. 1940;44:580. [Google Scholar]
- 12.Evan AP, Lingeman JE, Coe FL, Parks JH, Bledsoe SB, Shao Y, Sommer AJ, Paterson RF, Kuo RL, Grynpas M. Randall’s plaque of patients with nephrolithiasis begins in basement membranes of thin loops of Henle. The Journal of clinical investigation. 2003;111:607–16. doi: 10.1172/JCI17038. [DOI] [PMC free article] [PubMed] [Google Scholar]
- 13.Kim SC, Coe FL, Tinmouth WW, Kuo RL, Paterson RF, Parks JH, Munch LC, Evan AP, Lingeman JE. Stone formation is proportional to papillary surface coverage by Randall’s plaque. The Journal of urology. 2005;173:117–9. doi: 10.1097/01.ju.0000147270.68481.ce. discussion 119. [DOI] [PubMed] [Google Scholar]
- 14.Evan A, Lingeman J, Coe FL, Worcester E. Randall’s plaque: pathogenesis and role in calcium oxalate nephrolithiasis. Kidney International. 2006;69:1313–8. doi: 10.1038/sj.ki.5000238. [DOI] [PubMed] [Google Scholar]
- 15.Evan AE, Lingeman JE, Coe FL, Miller NL, Bledsoe SB, Sommer AJ, Williams JC, Shao Y, Worcester EM. Histopathology and surgical anatomy of patients with primary hyperparathyroidism and calcium phosphate stones. Kidney International. 2008;74:223–9. doi: 10.1038/ki.2008.161. [DOI] [PubMed] [Google Scholar]
- 16.Kuo RL, Lingeman JE, Evan AP, Paterson RF, Parks JH, Bledsoe SB, Munch LC, Coe FL. Urine calcium and volume predict coverage of renal papilla by Randall’s plaque. Kidney International. 2003;64:2150–4. doi: 10.1046/j.1523-1755.2003.00316.x. [DOI] [PubMed] [Google Scholar]
- 17.Evan AP, Lingeman JE, Coe FL, Bledsoe SB, Sommer AJ, Williams JC, Jr, Krambeck AE, Worcester EM. Intra-tubular deposits, urine and stone composition are divergent in patients with ileostomy. Kidney International. 2009;76:1081–8. doi: 10.1038/ki.2009.321. [DOI] [PMC free article] [PubMed] [Google Scholar]
- 18.Linnes MP, Krambeck AE, Cornell L, Williams JC, Jr, Korinek M, Bergstralh EJ, Li X, Rule AD, McCollough CM, Vrtiska TJ, et al. Phenotypic characterization of kidney stone formers by endoscopic and histological quantification of intrarenal calcification. Kidney International. 2013 doi: 10.1038/ki.2013.189. [DOI] [PMC free article] [PubMed] [Google Scholar]
- 19.Krambeck AE, Lieske JC, Li X, Bergstralh EJ, Rule AD, Holmes D, 3rd, McCollough CM, Vrtiska TJ. Current Computed Tomography Techniques Can Detect Duct of Bellini Plugging but Not Randall’s Plaques. Urology. 2013 doi: 10.1016/j.urology.2013.04.028. [DOI] [PMC free article] [PubMed] [Google Scholar]
- 20.Kuo RL, Lingeman JE, Evan AP, Paterson RF, Bledsoe SB, Kim SC, Munch LC, Coe FL. Endoscopic renal papillary biopsies: a tissue retrieval technique for histological studies in patients with nephrolithiasis. The Journal of urology. 2003;170:2186–9. doi: 10.1097/01.ju.0000096065.61481.35. [DOI] [PubMed] [Google Scholar]
- 21.Coe FL, Evan AP, Worcester EM, Lingeman JE. Three pathways for human kidney stone formation. Urological research. 2010;38:147–60. doi: 10.1007/s00240-010-0271-8. [DOI] [PMC free article] [PubMed] [Google Scholar]
- 22.Lingeman JE. Pathogenesis of nephrolithiasis. The Journal of urology. 2013;189:417–8. doi: 10.1016/j.juro.2012.11.069. [DOI] [PMC free article] [PubMed] [Google Scholar]
- 23.Stansbridge EM, Griffin DG, Walker V. Who makes uric acid stones and why--observations from a renal stones clinic. Journal of clinical pathology. 2013;66:426–31. doi: 10.1136/jclinpath-2012-201373. [DOI] [PubMed] [Google Scholar]
- 24.Negri AL, Spivacow R, Del Valle E, Pinduli I, Marino A, Fradinger E, Zanchetta JR. Clinical and biochemical profile of patients with “pure” uric acid nephrolithiasis compared with “pure” calcium oxalate stone formers. Urological research. 2007;35:247–51. doi: 10.1007/s00240-007-0109-1. [DOI] [PubMed] [Google Scholar]
- 25.Maalouf NM. Metabolic syndrome and the genesis of uric acid stones. Journal of renal nutrition : the official journal of the Council on Renal Nutrition of the National Kidney Foundation. 2011;21:128–31. doi: 10.1053/j.jrn.2010.10.015. [DOI] [PMC free article] [PubMed] [Google Scholar]
- 26.Gorbachinsky I, Akpinar H, Assimos DG. Metabolic syndrome and urologic diseases. Reviews in urology. 2010;12:e157–80. [PMC free article] [PubMed] [Google Scholar]
- 27.Bobulescu IA, Dubree M, Zhang J, McLeroy P, Moe OW. Effect of renal lipid accumulation on proximal tubule Na+/H+ exchange and ammonium secretion. American journal of physiology. Renal physiology. 2008;294:F1315–22. doi: 10.1152/ajprenal.00550.2007. [DOI] [PMC free article] [PubMed] [Google Scholar]
- 28.Fuster DG, Bobulescu IA, Zhang J, Wade J, Moe OW. Characterization of the regulation of renal Na+/H+ exchanger NHE3 by insulin. American journal of physiology. Renal physiology. 2007;292:F577–85. doi: 10.1152/ajprenal.00240.2006. [DOI] [PMC free article] [PubMed] [Google Scholar]
- 29.Yasue T. Histochemical identification of calcium oxalate. Acta Histochem Cytochem. 1969;2:83–95. [Google Scholar]
- 30.Evan AP, Lingeman J, Coe F, Shao Y, Miller N, Matlaga B, Phillips C, Sommer A, Worcester E. Renal histopathology of stone-forming patients with distal renal tubular acidosis. Kidney International. 2007;71:795–801. doi: 10.1038/sj.ki.5002113. [DOI] [PubMed] [Google Scholar]
Associated Data
This section collects any data citations, data availability statements, or supplementary materials included in this article.
Supplementary Materials
Supplementary Figure 1. Photomicrograph and Micro-CT images of mixed UA stone demonstrating heterogeneous layering of UA (red arrow) and CaOx (green arrow)
Supplementary Table 1. Patient Characteristics
Supplementary Table 2. Serum Characteristics
Supplementary Table 3. Urine Characteristics
Supplementary Table 4. Papillary pathology UA vs CaOx
Supplementary Table 5. Papillary pathology vs percentage of UA