

Abstract
Accumulation of N-terminal fragments of mutant huntingtin (mHTT) in the cytoplasm, nuclei and axons of neurons is a hallmark of Huntington's disease (HD), although how these fragments negatively impact neurons remains unclear. We followed the distribution of mHTT in the striata of transgenic R6/2-J2 HD mice as their motor function declined. The fraction of cells with diffuse, perinuclear or intranuclear mHTT changed in parallel with decreasing motor function. In transgenic mice, medium spiny neurons (MSNs) that exhibited perinuclear inclusions expressed cell-cycle markers typically not seen in the striata of normal mice, and these cells are preferentially lost as disease progresses. Electron microscopy reveals that perinuclear inclusions disrupt the nuclear envelope. The progression of perinuclear inclusions being accompanied by cell-cycle activation and culminating in cell death was also observed in 1° cortical neurons. These observations provide a strong correlation between the subcellular location of mHTT, disruption of the nucleus, re-entry into the cell-cycle and eventual neuronal death. They also highlight the fact that the subcellular distribution of mHTT is highly dynamic such that the distribution of mHTT observed depends greatly on the stage of the disease being examined.
Introduction
Huntington's disease (HD) is caused by an expansion of CAG repeats in the huntingtin-encoding gene resulting in an expanded stretch of polyglutamine (polyQ). In addition to causing pathology, this expansion of polyQ results in the formation of various forms of aggregates, including microscopically visible inclusions, although the extent to which these inclusions play a role in the disease process remains enigmatic. Accumulation of N-terminal fragments in the nuclei of HD brain cells has been suggested as contributing to pathology (1–7) although some of these studies also report large inclusions in the cytoplasm with accompanying pathology (4). Studies finding that amelioration of disease can be achieved by the reduction of proteins that interact with cytoplasmic mHTT in R6/2 mice (8) further attest to the importance of cytoplasmic mHTT in the disease process. In some reports, cytoplasmic inclusions can be seen deforming the nucleus almost as if they were being ‘endo-nucleosed’ (9–11). Still other studies suggest that the formation of inclusions may confer a cell survival advantage (12), e.g. by capturing otherwise toxic intermediate aggregates. These conflicting reports emerge from very different levels of analysis ranging from cultured HeLa cells to intact animals and reflect the current ambiguity in the field as to the pathogenic consequences of mHTT inclusions in neuronal cells. Depending on the system being examined, it appears that HTT inclusions can be found in both the cytoplasm and the nucleus as well as in cellular processes (e.g. axons) and they may have different effects depending on location that have not yet been established.
To monitor the behavior of mHTT, we examined R6/2 mice that express the N-terminal exon 1 HTT peptide. Pathology in these mice closely parallels the pathology seen in patients. Further, inclusions observed in postmortem brain tissue only react with N-terminal HTT antibodies (13,14), and recent studies find that N-terminal fragments of mHTT are formed naturally as a consequence of both proteolytic cleavage (15–20) and an expanded CAG-dependent aberrant splicing event, which produces naturally occurring HTT exon 1 fragments (21). The potential of full-length and other longer HTT fragment models to be processed to smaller fragments can complicate interpretation of results. Although the R6/2 mouse exhibits particularly aggressive pathology, it does exhibit motor deficits that are less evident in full-length knock-in models (22), it recapitulates the transcriptional changes observed in human HD brains (23) and it represents the smallest processing fragment described (24), thus eliminating the potentially confounding problems of multiple processed fragments contributing to the events observed.
To better understand the natural history of inclusion formation in the intact mammalian brain and its relationship to pathology in CNS neurons, we followed the behavior of mHTT in transgenic mice during the period when motor function is declining to determine what subcellular events may correlate with progressive pathology. We find that the subcellular location of mHTT changes dynamically as pathology progresses with the fraction of cells exhibiting perinuclear inclusions (i.e. touching or almost touching the nuclear envelope, see Fig. 2) declining while the fraction with intranuclear inclusions increases. We find that perinuclear inclusions disrupt the nuclear membrane, which is accompanied by the activation of the cell cycle in terminally differentiated neurons, and that these events are associated with cell death. Additionally, in cultures of 1° neurons, cells containing perinuclear inclusions show activation of cell-cycle genes and accompanying cell death, whereas cells with intranuclear inclusions do not activate cell-cycle genes and remain viable, consistent with our observations in transgenic mice. Re-activation of the cell cycle in non-dividing neurons is known to trigger cell death pathways (25,26). The studies reported here with transgenic mice and cultured 1° neurons document the dynamic nature of mHTT subcellular distribution during disease progression and suggest a mechanism whereby mis-folded protein inclusions may contribute to degeneration of neurons by disrupting the nuclear envelope, activating the cell cycle and leading to slow progressive loss of neurons.
Figure 2.

Three classes of subcellular distribution of mHTT-GFP polypeptides are found in HEK 293T cells. (A) HEK 293T cells transfected with p-GFP, HTTex1p25Q-GFP or HTTex1p97Q-GFP were analyzed 24 h after transfection. Green, GFP fluorescence; red, nuclear pore proteins; blue, DAPI staining of the nucleus. Patterns of HTTex1p97Q-GFP distribution can be classified into types I, II (a, b, c) and III (see text). Ten fields of cells from each of three replicate platings were analyzed by confocal microscopy and optical (Z-series) sectioning. The percent of transfected cells with each particular pattern is indicated along with the total number of mHTT-positive cells counted in parentheses, and the classification rubric is indicated by the cartoon under the images. An additional three replicates were conducted in 293T cells using myc as a tag rather than GFP (Supplementary Material, Fig. S3). A parallel series of experiments and using ST14A cells were also performed, which yielded similar results (ST14A cells at 48 h are shown in Supplementary Material, Fig. S2). The scale bar equals 5 μm. (B) Z-series 3D reconstruction of a type IIc HEK 293T cell containing a perinuclear HTTex1p97Q-GFP inclusion. Different views of the reconstructed 3D shape. Green, GFP-tagged HTTex1p97Q; red, nuclear pore proteins; blue, DAPI are shown. The white arrowhead marks where the nuclear pore proteins are partially co-localized with the inclusion. Note the ‘sinking’ of the inclusion into the nuclear membrane. (C) Graphical presentation of the data from A showing the SEM of the replicates. The significance level of the GFP and/or 25Q versus all of the others is P = < 0.0002, and the P-value of all the comparisons of the 97Q classes IIb and IIc versus III is <0.0003.
Results
Progressive loss of motor control accompanied by changes in the subcellular location of mHTT in the striata of HD mice
The R6/2-J2 transgenic mouse model of HD used in this study is derived from the original R6/2 mice with ∼150 Qs (27) and expresses human HTT exon 1 with ∼298 Q's (27–29). In these mice, pathology progresses more slowly (29,30), thus allowing better separation between phases of pathogenesis. To understand the relationship between the behavior of mHTT proteins and progression of pathology in vivo, we followed the subcellular distribution of mHTT in the striata of these transgenic R6/2 mice.
Mice were tested for motor function between 10 and 36 weeks of age by testing their ability to remain on a rotating rod for ≥120 s (Fig. 1A). Beginning at 20 weeks, rapid deterioration of motor function is evident, with death occurring by ∼38 weeks. Accordingly, we evaluated the status of mHTT in brain sections of R6/2 mice at 20, 28 and 36 weeks. For each time point, sections were prepared from 3 R6/2 and 3 wild-type (wt) mice, stained with the anti-mHTT antibody (EM48) and with antibodies against either NeuN [Neuronal Nuclei (31)], DARPP32 (Dopamine- and cAMP-regulated neuronal PhosphoProtein), GFAP (Glial Fibrillary Acidic Protein) or ChAT (CHoline AcetylTransferase) to identify different cell types [neurons, dopaminergic medium spiny neurons (MSNs), astrocytes and cholinergic neurons, respectively]. All the cells from a given 63× objective field from every fifth section for a total of 10 sections/mouse were examined by confocal microscopy to evaluate cells in the striata, with 500–700 cells tabulated for each condition. Most cells in these sections stain positively for the neuronal marker NeuN (∼96%, Supplementary Material, Fig. S1A and Table S1A), and the bulk (∼93%) are also DARPP32 positive (Fig. 1D and Supplementary Material, Fig. S1B and Table S1B) attesting to their dopaminergic MSN identity. A few cells are positive for either GFAP or ChAT (Supplementary Material, Fig. S1C and D and Table S1C and D).
Figure 1.

Changes in the subcellular distribution of mHTT accompany loss of motor function in R6/2 mice. (A) Latency in rotarod performance of mice was tested by placing mice on a rotating rod at 16 rpm for 120 s. Early on, both Tg (N = 8) and wild-type (N = 9) mice can master the 2-min test. At ∼20 weeks, R6/2-J2 mice begin to show a rapid decrease in motor function that is evident at 28 and 36 weeks of age with death occurring by ∼38 weeks. Error bars represent SD, and ***P < 0.0001. (B) Three classes of mHTT-expressing cells can be identified in the striata of 20-week-old mice. The images shown here are from the larger study summarized in Supplementary Material, Figure S1B. Of 2222 cells scored for mHTT at 20 weeks, ∼64% were mHTT positive distributed among diffuse (67%), perinuclear (9%) and intranuclear (24%). Scale bars are 5 µm. Green, Human HTT; blue, DNA DAPI; red, NeuN. (C) The subcellular distribution of mHTT changes over the period of motor function loss. The number of cells with diffuse mHTT decreases. Concomitantly, the number with intranuclear inclusions increases whereas the number of cells with perinuclear inclusions declines. SEM analysis yields P-values for all comparisons of <0.001. (D) During the 20- to 36-week interval, the average number of DARPP32-positive cells observed in 10 sections from each of the 3 replicate mice declined approximately 32% whereas there is no decline evident in control mice. Error bars reflect SEM, and asterisks under the wt line indicate the P-value between wt and mHTT-expressing mice, whereas those under the HD line represent the statistical differences between 20 versus 28 weeks and 28 versus 36 weeks in the HD mice.
The intracellular patterns of mHTT distribution change markedly with age. Striatal cells can be categorized into three groups: those with diffuse staining of mHTT, those with perinuclear mHTT inclusions and those with intranuclear inclusions (Fig. 1B presents representative images from the data set summarized in Supplementary Material, Fig. S1B). At 20 weeks, the distribution of diffuse, perinuclear and intranuclear mHTT in the striata of R6/2 mice was 67, 9 and 24% of mHTT-positive cells, respectively (Supplementary Material, Fig. S1B and C and Table S1B). At 28 weeks, the distribution was 34, 5 and 61%, respectively, and by 36 weeks, this distribution had shifted to only 13% diffuse, 0% perinuclear and 87% with intranuclear inclusions (Supplementary Material, Fig. S1B). During these 16 weeks, the fraction of cells showing any mHTT staining increased from 62 to 75 to 87%, but concurrently, the number of DARPP32(+) MSNs in the striatum decreased about 34% (∼2% per week) (Fig. 1D; Supplementary Material, Table S1B). No decrease in DARPP32(+) cells was seen in the striata of wild-type mice during the same period. The decrease of striatal cells containing perinuclear inclusions and a reciprocal increase of striatal cells containing intranuclear inclusions (Fig. 1C) raise the possibility that either cytoplasmic, perinuclear inclusions can convert to nuclear inclusions or that striatal cells with perinuclear mHTT inclusions are preferentially eliminated during pathogenesis whereas cells with intranuclear inclusions are maintained.
Perinuclear inclusions impinge on the nuclear envelope
To better understand the changes in the distribution of mHTT seen in the mouse striatal studies, we examined the distribution of mHTT in cultured HEK 293T and rat striatal (ST14A) cells transfected with mHTTex1p97Q-GFP or unexpanded HTTex1p25Q-GFP or GFP alone. Staining with nuclear pore complex (NPC) antibodies followed by optical sectioning was used to ascertain whether mHTTex1p97Q-GFP inclusions were inside, outside or adjacent to the nucleus. Ten different fields of view (63×) from each of 3 independent cell transfections and platings (30 total fields) were subjected to confocal sectioning and scoring for the location of mHTT inclusions. In cells expressing unexpanded HTTex1p25Q-GFP or GFP alone, diffuse staining appears in both the cytoplasm and the nucleus, and no inclusions were formed (Fig. 2A and C). On the other hand, as observed in the striata of R6/2 mice, cells transfected with mHTTex1p97Q-GFP presented with both nuclear and cytoplasmic inclusions as well as with diffuse staining at 24 h post-transfection (Fig. 2A). Sixteen percent of cells transfected with mHTTex1p97Q-GFP show diffuse mHTT protein throughout the cytoplasm and nucleus (type I, Fig. 2A), whereas 73% exhibit cytoplasmic inclusions at various stages of interacting with the nucleus (types IIa, b, c; Fig. 2A and C) and 11% have inclusions inside the nucleus (type III; Fig. 2A and C). Of the 73% of cells with cytoplasmic inclusions, only a few (4%) exhibit cytoplasmic inclusions that are not touching the nuclear envelope (type IIa; Fig. 2A and C), whereas 25 and 43%, respectively, contain perinuclear inclusions in different stages of contact with the nucleus (types IIb; IIc; Fig. 2A and C). Some cells have inclusions just touching the nuclear membrane that do not stain with NPC antibodies (type IIb) whereas in others, inclusions can be seen sinking into the nuclei with extensive NPC antibodies decorating their surface (type IIc). Inclusions in ST14A striatal cells were similar to those in HEK 293T cells with 50% of the ST14A cells transfected with mHTT97Q-GFP having inclusions impinging on the nucleus after 48 h with no free cytoplasmic inclusions and roughly half of these showing robust NPC staining (Supplementary Material, Fig. S2). Both 293T and ST14A cells transfected with mHTTex1p97Q-GFP or unexpanded HTTex1p25Q-GFP or GFP were scored at 24, 48 and 72 h post-transfection. The relative percentages of the different types of mHTT distribution remained basically unchanged except that the 48-h samples have more type IIa cells.
A 3D rendering illustrates that cytoplasmic inclusions can distort the nuclear envelopes to the point of being almost engulfed by the nucleus (Fig. 2B). To rule out possible effects from the GFP tag, the mHTTex1p97Q-GFP peptide was tagged with a myc epitope in place of the GFP and transiently expressed in both HEK 293T and ST14A cells. Immunostaining with anti-myc and anti-NPC antibodies showed similar patterns of inclusions plunging into the nuclear envelope in both HEK 293T cells (Supplementary Material, Fig. S3) and ST14A cells (Supplementary Material, Fig. S2). In summary, ∼1200 cells from each of 3 time points with two labels (GFP and myc) in 2 different cell types (293T and ST14A) were examined with similar results. These observations build on previous observations showing perinuclear inclusions impinging on the nuclear envelope and cells with nuclear inclusions surviving (32–34). Our analysis indicated that at least some of the perinuclear inclusions behave almost as if they were being engulfed by an ‘endo-nucleolytic’ mechanism but left open the question of whether the perinuclear inclusions can actually convert to intranuclear inclusions.
Nuclear and cytoplasmic inclusions do not interconvert
To determine whether cytoplasmic inclusions can convert to intranuclear inclusions, we followed the aggregation process by both immunostaining and GFP fluorescence using time-lapse microscopy in HEK 293T and rat striatal (ST14A) cells transfected with HTTex1p97Q-GFP. Cells expressing HTTex1p97Q-GFP wfere identified by the appearance of weak and diffuse GFP fluorescence 24 h after transfection, and they were followed by time-lapse microscopy to track the aggregation process. The fates of 16 cells from 16 separate transfections were followed for 20–30 h (Fig. 3). Consistent with the observations from the immunostaining experiments (Figs 1B and 2A), three categories were observed with respect to the subcellular location of HTTex1p97Q-GFP. Five of 16 cells exhibited diffuse HTTex1p97Q-GFP (Fig. 3A) typical of the type I cells (Figs 1B and 2A). In these cells, inclusions did not form and the cells went through apparently normal cell divisions as seen with the left-most cell in Figure 3A. Half of the 16 cells exhibited an initially diffuse pattern of HTTex1p97Q-GFP in the cytoplasm that later coalesced to form cytoplasmic inclusion(s) (Fig. 3B). Once an inclusion was seeded (3 : 00, Fig. 3B), it proceeded to completely absorb all the diffuse material within ∼1 h (3 : 30, Fig. 3B). These inclusions invariably progressed to impinge on the nuclear envelope(s) (3 : 30–10:00) typical of the type II distribution described in Figure 2. Notably, three of these cells appeared to die between 11 and 20 h after formation of the cytoplasmic inclusions, based on their floating loose from the substrate and their nuclear envelope becoming indistinct (11 : 00, Fig. 3B). In contrast, all five cells with diffuse HTTex1p97Q-GFP in the cytoplasm were still alive after 20–30 h of live imaging (not shown). Finally, 3 of the 16 cells initially presented with diffuse HTTex1p97Q-GFP in the cytoplasm and nucleus but then progressed to form inclusions inside the nucleus (type III cells). These cells survived for the duration of the analysis (at least 15–17 h after the formation of the nuclear inclusions was evident) (Fig. 2C). Similar distributions and patterns of behavior were also seen in five transfected ST14A cells that were examined (not shown).
Figure 3.

Time-lapse photos of HTTex1p97Q-GFP-transfected HEK 293T cells. Live images were taken starting 24 h post-transfection. The numbers above the photographs indicate the time periods (h : min) of the recording. (A) Two cells with a diffuse pattern of HTTex1p97Q-GFP distribution in the cytoplasm. The left cell divides whereas the cell marked by the arrowhead continues to accumulate diffuse mHTT with both cells still viable after 15 h. Five of 16 recorded cells behaved in this way. (B) A cell progressing from a diffuse-cytoplasmic pattern to the formation of a perinuclear inclusion followed by the inclusion sinking onto the nuclear membrane (3 : 30–10 : 00). Eight of 16 recorded cells behaved like the cell shown here, with 3 of the 8 cells appearing to die between 11 and 20 h after formation of the cytoplasmic inclusions, based on their floating loose from the substrate and their nuclear envelope becoming indistinct. (C) A cell with diffuse HTTex1p97Q-GFP primarily in the cytoplasm initially, although also evident in the nucleus. The nuclear HTTex1p97Q-GFP then formed an intranuclear inclusion that rapidly attracted all the HTTex1p97Q-GFP to the growing inclusion. These cells survived until the end of the imaging period, which was 15–17 h after formation of the nuclear inclusions. Three of 16 recorded cells behaved in this way. Scale bar is equal to 5 μm, and images were taken with 40× magnification. Arrowheads indicate the cell being followed. Five additional transfected ST14A cells were also examined with similar results (not shown).
Despite the almost complete engulfment of some perinuclear inclusions by the nucleus (Fig. 2B), cytoplasmic inclusions (type II) were never observed progressing to a nuclear inclusion (type III). Thus, cytosolic inclusions, once formed, stay in the cytoplasm and are not imported into the nucleus, even though they can distort the nucleus and become decorated with NPC proteins as previously seen in other cell types (32–34) (Figs 1B, 2B and 3B).
Cell death associated with perinuclear but not nuclear inclusion formation
To confirm the relationship between subcellular distribution of mHTT and cell fate, we used the cell-impermeant viability indicators ethidium homodimer-1 (EthD-1) and propidium iodide (PI) as death markers for HEK 293T cells at 48 h after transfection with HTTex1p97Q-GFP (Fig. 4). For each dye, 3 separate transfections were stained and >500 cells scored for each dye. Almost 70% of cells had perinuclear inclusions whereas ∼13% had nuclear inclusions. Among the roughly 70% of cells with perinuclear inclusions, roughly half stained with EthD-1 (Fig. 4A) or PI (Fig. 4B) suggesting progression to cell death, whereas 98% of cells with nuclear inclusions were able to exclude the dyes suggesting a high level of viability. Thus, 95% of dying cells had cytoplasmic perinuclear inclusions that were impinging upon and distorting the nucleus (Fig. 4A and B). This is consistent with the apparently increased mortality of cells with perinuclear inclusions versus those with nuclear inclusions seen in Figure 3.
Figure 4.

Cell viability correlates with subcellular distribution of mHTT in transfected HEK 293T cells. Cells were transfected with HTTex1p97Q-GFP and analyzed by staining with ethidium homodimer, EthD-1 (A) or PI (B) at 48 h post-transfection. Images were taken at 40× magnification, and the number of live [EthD-1 (−)/GFP (+)] and dead [EthD-1 (+)/GFP (+)] cells with different subcellular distribution patterns of HTTex1p97Q-GFP was scored from three independent transfections. The percentages of the live (dye negative) and dead (dye positive) cells are listed. Note that ∼50% of cells with perinuclear inclusions are scored as dying with either dye whereas <2% of cells with intranuclear inclusions are compromised. The number of cells in each category divided by the total cells scored is shown in parentheses. The difference between dye positive and dye negative cells with nuclear inclusions is statistically significant at P < 0.05 whereas the differences between the perinuclear and nuclear of each category is significant at P < 0.001. Scale bar = 5 μm.
Perinuclear inclusions disrupt the nuclear membrane
As large inclusions appear to plunge into and distort the nuclear envelope (Fig. 2B) but apparently cannot convert to nuclear inclusions (Fig. 3), we examined the interaction between the inclusion and the nuclear envelope in more detail. HEK 293T cells were fixed 48 h after transfection with HTTex1p97Q-GFP (three replicates) (Fig. 5A) or HTTex1p97Q-myc (four replicates) (Fig. 5B) and scanned to identify cells with perinuclear inclusions that were then examined by electron microscopy (EM). In 4 of 10 cells, we found perinuclear inclusions impinging on and distorting the nuclear membranes (Fig. 5A and B). Higher magnification views showed cells in various stages of nuclear disruption. Figure 5Aa and b shows an inclusion drastically distorting the nucleus (similar to Fig. 2B), and Figure 5Ac and d shows another cell with areas of the nuclear envelope that are adjacent to the inclusion disrupted. Clear gaps in the lipid bilayer are evident (compare Fig. 5Ac and Ad with Ae). The disruption of the nuclear envelope might result in part from disruption of the arrangement of the NPC proteins. We used immuno-electron microscopy to examine the arrangement of the nuclear pore proteins (12-nm particles, red dots in Fig. 5Bc, d and e) relative to either unexpanded HTTex1p25Q-myc (Fig. 5C) or expanded HTTex1p97Q-myc (18-nm particles, black dots in Fig. 5B). Unexpanded HTTex1p25Q-myc molecules were found throughout the cytoplasm and not co-localized with NPC proteins, which faithfully aligned with the nuclear membrane (Fig. 5Cc and d). In contrast, in the regions where an expanded mHTT inclusion was juxtaposed with the nuclear membrane, NPC proteins did not align with the nuclear membrane (Fig. 5Bd) and the membrane layers could not be discerned in these regions. In addition, NPC proteins could be found intermingled with mHTT including on the opposite side of the inclusion from its contact point with the nuclear membrane (Fig. 5Bc). In cells with perinuclear inclusions of expanded HTTex1p97Q-myc, the nuclei were irregular in shape, with the nuclear membranes partially surrounding the inclusions (Fig. 5Aa and b) and NPC-positive particles found throughout the inclusion (red dots in Fig. 5Bc, d and e). The nuclear membrane in the area of contact with the inclusions was disorganized or missing (red box in Fig. 5Bb; also see Fig. 5Bd, e).
Figure 5.

The nuclear membrane is disrupted by inclusions of HTTex1p97Q-GFP. (A) EM photos of two HEK 293T cells 48 h after transfection with HTTex1p97Q-GFP. In A-a-b, the HTTex1p97Q-GFP inclusions are a deep gray color and the nuclear membrane is light gray. The colored boxes indicate the areas highlighted at higher magnifications in panels with the matching color boundaries. N denotes the nucleus. In A-a-b, inclusions intrude deep into the nucleus. In the cell depicted in A-c-e, the inclusion (97Q) abuts the nuclear membrane, and in the region of contact, the adjacent nuclear membrane appears to dissolve (A-c-d) whereas membrane is intact to the left and right of the contact region (A-c and e). Note the disruption of the nuclear envelope in A-d in comparison with A-e. (B) Immune-electron microscopy photos of a HEK 293T cell transfected with HTTex1p97Q-myc and then immuno-costained, followed by labeling with gold microparticles to reveal anti-myc (larger particles, e.g. indicated by black arrow in B-e.) and anti-NPC antibodies (smaller particles, red arrow B-e). In B-a, the inclusion can be seen impinging on the nucleus. The boxed region is shown in B-b with two areas highlighted in blue (B-c) and red (B-d). The area shown in B-c is on the side of the inclusion away from the nuclear membrane. The co-mingling of NPC (red) and myc (black) dots is indicative of extensive disruption of the nuclear membrane, because NPC components are now surrounding the inclusion and far from the nuclear membrane itself. For better visualization, the smaller 12-μm immunogold particles associated with anti-NPC are indicated with red dots. In B-d, note the disordered pattern of NPC dots and the absence of an organized nuclear membrane, which is further emphasized at higher magnification of the region indicated in green (i.e. B-e). For comparison, the effect of transfection with an unexpanded polyQ control (HTTex1p25Q-myc) is shown in (C). The nuclear membrane remains intact, the NPC antibodies are found to track the nuclear membrane and mHTT-myc is randomly distributed throughout the nucleus and cytoplasm. Note the faithful alignment of the red NPC dots along the course of the nuclear envelope in C-c-d and the random distribution of the mHTT-myc dots in both the nucleus and cytoplasm.
The combined confocal microscopy and EM data suggest that the bulk of mHTTex1p97Q-containing inclusions form in the cytoplasm where they eventually impinge on the nucleus, interact with nuclear pore proteins and disrupt the nuclear membrane.
Perinuclear inclusions are correlated with cell-cycle re-entry, and loss of MSNs in vivo
The time-lapse analysis (Fig. 3B) and EthD-1 and PI staining data (Fig. 4) showed that cells with cytoplasmic perinuclear inclusions did not appear to divide and they accounted for most of the dead cells transfected with mHTTex1p97Q-GFP whereas cells with nuclear inclusions were seen to divide (Fig. 3A) and appeared to remain viable (Fig. 4). FACS analysis of transfected HEK 293T cells suggested that cells with perinuclear inclusions impinging on the nuclear membrane exhibit an altered cell cycle that is not seen in any other fraction of mHTT-expressing cells (not shown).
To test for an impact on the cell cycle, brain sections from control and R6/2 mice were stained for mHTT and for the cell-cycle markers cyclin B1 (CycB1) or CDK5 (Fig. 6). Cyclin B1 is a classic cell-cycle marker involved in Maturation Promoting Factor and nuclear envelope breakdown (35) whereas CDK5 is an atypical kinase that is often implicated in the process of neurons reentering the cell cycle (36). It has been shown that almost all post-mitotic neurons, such as those found in the mouse striatum, remain in the G0/G1 phase of the cell cycle (37) and that neurons that reenter the cell-cycle arrest in G2/M and subsequently die (38,39). No CycB1- or CDK5-positive cell bodies were observed in over 1000 cells scored from 18 control mice (6 each at 20, 28 and 36 weeks). However, in the 90 sections examined from 3 different R6/2 mice, we found that all cells with perinuclear mHTT(+) inclusions were CycB1 positive at both 20 and 28 weeks (9 at 20 weeks and 5 at 28 weeks, Fig. 6A and Table 1). In contrast, no cells with diffuse mHTT or with intranuclear inclusions were positive for cell-cycle markers (Table 1). Similarly, CDK5 was detected in all striatal cells with perinuclear inclusions in both 20- and 28-week-old mice, suggesting that the cytoplasmic perinuclear inclusions are strongly correlated with re-entry into the cell cycle (Fig. 6B and Table 2). Notably, no CycB1- or CDK5-positive cells or perinuclear inclusion-containing cells could be identified in the striatal sections of 36-week-old HD mice (Fig. 6A and B and Tables 1 and 2). The absence of cells containing perinuclear inclusions, CycB1, or CDK5 in the striata of 36-week-old HD mice is consistent with the hypothesis that these cells died, which may contribute to the gradual loss of striatal neurons observed in HD mice (13,40) and the decrease in DARPP32-expressing cells over this time period in the R6/2 mice (Fig. 1D).
Figure 6.
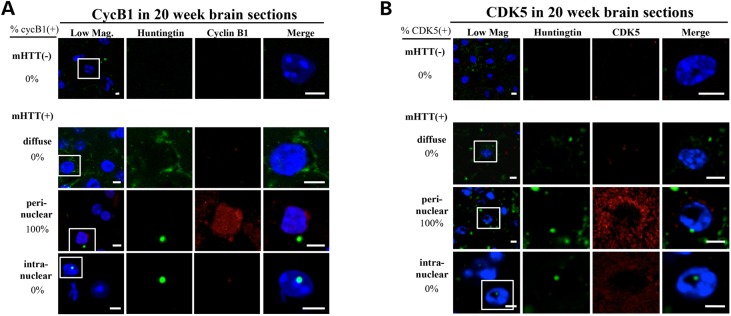
Cell-cycle re-entry and mHTT inclusion formation in the striatal cells of R6/2 mice. Brain sections were fixed and stained with DAPI (blue), anti-human HTT (green) and anti-CycB1 (red panels in A) or anti-CDK5 (red panels in B). Representative confocal images of the staining patterns of the striatal areas in brain sections from 20-week-old R6/2 mice are shown. The boxed region in each of the ‘low mag’ photos is enlarged in the other four panels on the same row for better visualization. For each age group, brain sections from three mice have been examined; the data are summarized in Tables 1 and 2. The percentage of cells exhibiting different subcellular patterns of the mHTT fragment (i.e. cytoplasmic perinuclear inclusions, intranuclear inclusions and diffuse) is indicated on the left side of each row. The number of CycB1(+) cells in (A) and CDK5(+) cells in (B) are indicated on the right side of each row of panels. All images have been analyzed by Z-series sectioning. All cells containing perinuclear mHTT inclusions display CycB1 and CDK5 staining, whereas no cells with intranuclear inclusions stain with these markers (also see Tables 1 and 2). Scale bar = 5 μm.
Table 1.
CycB1; mHTT at 20, 28 and 36 weeks
| Age (weeks) | Total cells | HTT(−) | HTT(+) |
|||
|---|---|---|---|---|---|---|
| Diffuse | Perinuclear inclusion | Intranuclear inclusion | ||||
| 20 | 530 | cyclin B1(+) | 0 | 0 | 27 | 0 |
| cyclin B1(−) | 198 | 212 | 0 | 93 | ||
| Percentage | 65% | 8% | 27% | |||
| 28 | 520 | cyclin B1(+) | 0 | 0 | 16 | 0 |
| cyclin B1(−) | 126 | 130 | 0 | 248 | ||
| Percentage | 32% | 4% | 65% | |||
| 36 | 501 | cyclin B1(+) | 0 | 0 | 0 | 0 |
| cyclin B1(−) | 75 | 38 | 0 | 388 | ||
| Percentage | 9% | 0% | 91% | |||
Brain sections of R6/2 mice of different ages (10 sections from each mouse; 3 mice for each combination of age, genotype and antibody, for a total of 36 mice) were analyzed by immunofluorescence co-staining with anti-human HTT and anti-CycB1 (Table 1) or anti-CDK5 (Table 2) as described in Figure 6. The number of cells staining with a cell-cycle marker among striatal cells in each of the mHTT categories is presented.
Table 2.
CDK5; mHTT at 20, 28 and 36 weeks
| Age (weeks) | Total cells | HTT(−) | HTT(+) |
|||
|---|---|---|---|---|---|---|
| Diffuse | Perinuclear inclusion | Intranuclear inclusion | ||||
| 20 | 580 | CDK5(+) | 0 | 0 | 28 | 0 |
| CDK5(−) | 231 | 231 | 0 | 90 | ||
| Percentage | 66% | 8% | 26% | |||
| 28 | 552 | CDK5(+) | 0 | 0 | 13 | 0 |
| CDK5(−) | 121 | 138 | 0 | 280 | ||
| Percentage | 32% | 3% | 65% | |||
| 36 | 543 | CDK5(+) | 0 | 0 | 0 | 0 |
| CDK5(−) | 74 | 25 | 0 | 444 | ||
| Percentage | 5% | 0% | 95% | |||
Activation of the cell cycle in primary cortical neurons by perinuclear inclusions is accompanied by cell death
Examination of brain sections revealed a correlation between perinuclear inclusions and the activation of cell-cycle markers, and the later absence of CycB1- or CDK5-positive cells in the 36-week-old mouse brains implies that these cells may have died. To better understand the relationship between perinuclear inclusions, re-activation of the cell cycle and cell death, primary cortical neurons cultured from three E16.5 C57BL/6 mice were transfected with HTTex1p97Q-GFP at DIV 5, and cells were analyzed at DIV 7 by staining with DAPI (blue), anti-human HTT (green), anti-CDK5 (yellow) and EthD-1 (red) (Fig. 7). Primary neurons with diffuse staining throughout the cell (∼19%) showed no evidence of CDK5 (Fig. 7) (36). Similarly, primary cortical neurons with intranuclear inclusions (∼12%) showed no evidence of the cell-cycle markers, and they showed <2% cell death. In contrast, all cells with perinuclear inclusions impinging on the nuclear envelope were positive for CDK5 and roughly half of them were dying as determined by their inability to keep the vital EthD-1 dye from entering the cell (Fig. 7). Thus, activation of the cell cycle and progression to death are strictly correlated with the presence of perinuclear inclusions impinging on the nuclear envelope both in primary cortical neurons (Fig. 7) and as inferred from the selective loss of perinuclear cells expressing cell-cycle markers in vivo (Fig. 6A and B and Tables 1 and 2).
Figure 7.

Cell-cycle re-entry and cell death correlate with perinuclear mHTT inclusion formation in cultured primary cortical cells of C57BL/6 mice. Primary cortical cells cultured from C57BL/6 mice at E16.5 were transfected with HTTex1p97Q-GFP at DIV 5 and analyzed at DIV 7 by staining with DAPI (blue), anti-human HTT (green), anti-CDK5 (yellow) and EthD-1 (red). Representative confocal images of the staining patterns taken at 63× magnification are shown, and the number of live [EthD-1(−)] and dying [EthD-1(+)] cells with different subcellular distribution patterns of HTTex1p97Q-GFP were scored for the presence of CDK5. Note that all cells with perinuclear inclusions also stained with CDK5 whereas CDK5 was not detected in any cells with diffuse mHTT or intranuclear mHTT inclusions. Further, roughly half of the perinuclear inclusion, CDK5-positive cells also stained with EthD-1 indicating progression to death. Total number of cells analyzed is 319. Thus, perinuclear inclusions, cell-cycle re-activation and cell death are highly correlated in these primary cortical neurons. Scale bar = 5 µm.
Discussion
The nature of mHTT inclusions and current controversies
Inclusions in HD are comprised primarily of N terminal fragments of mHTT because inclusions in postmortem brain tissue react only with N-terminal HTT antibodies and not with antibodies that recognize epitopes beyond ∼115 amino acids (17,41). Further, it has been found that exon 1 fragments (90aa) are produced naturally as a result of aberrant splicing in response to expanded CAG in patient tissues as well as in knock-in mice (21). R6/2 mice express mHTT exon 1 (90aa) at ∼75% the level of normal HTT (27) so that the ratio of mHTT to normal HTT is not dramatically different than that expected in a heterozygous patient. They also exhibit motor deficits similar to those seen in patients in contrast to unanticipated behaviors initially seen in knock-in models of HD (22), they faithfully replicate the gene expression disruptions seen in patient material (23,42,43) and exon 1 represents the smallest naturally occurring fragment described (21,24). Because of these facts, and the fact that models of HD-expressing full-length or other long HTT fragments cannot readily be prevented from releasing smaller HTT peptides as a result of processing, we used the R6/2 model to examine the dynamics of mHTT behavior as disease progresses. However, because different models of HD can exhibit different timing and features of disease progression, the dynamics of mHTT behavior may differ in other models. Nevertheless, the observations made here are likely to inform the behavior of exon 1 fragments seen in patient material.
Whether the aggregation process and/or inclusions play a cytotoxic, neutral or neuroprotective role continues to be debated (4,12,44,45). Although numerous studies describe the formation of mHTT inclusions in the nucleus as well as in the cytoplasm of transfected cells in culture, the differential effects of intranuclear versus cytoplasmic inclusions remain unsettled (3,12,27,45–48).
The distribution and disposition of mHTT in the mouse brain is dynamic
Two key hallmarks of HD are (1) the slow progression of pathogenic symptoms including motor function loss and striatal cell loss and (2) the formation of mHTT inclusions in both the nucleus and cytoplasm. However, the mechanisms whereby mHTT can cause pathology and whether the subcellular distribution of mHTT remains constant or changes during the course of disease are not well known. Cells expressing mHTT can be grouped into three categories, i.e. those containing diffuse mHTT, cytoplasmic inclusions or intranuclear inclusions. This is consistent with previous studies in cultured cells (9–12,32,49) and with histochemical analysis in vivo (50,51), which also found that inclusions can be either intranuclear or cytoplasmic and perinuclear, although quantitation was not provided. We find that the distribution and disposition of mHTT changes significantly in parallel with progressive loss of motor function in transgenic mice. As motor function is progressively lost, the number of cells with mHTT increases and the fraction of those cells with inclusions increases as well (Fig. 1A and C; Tables 1 and 2, Supplementary Material, Table S1A–D). The declining number of cells with diffuse mHTT and increasing number with inclusions are consistent with mHTT accumulating slowly until levels reach the threshold required for seeding of inclusions (52).
The cellular distribution of inclusions in striatal neurons also changes. As pathology progresses, the number of cells with intranuclear inclusions increases whereas the number with perinuclear inclusions decreases. The inability of cytoplasmic inclusions to become nuclear and the decreasing number of cells with perinuclear inclusions suggests that cells with perinuclear inclusions are preferentially dying. Consistent with the time lapse (Fig. 3) and cell viability experiments (Figs 4 and 8), diffuse mHTT and nuclear inclusions each appear to be well tolerated, whereas cytoplasmic, perinuclear inclusions are correlated with cell death. This progressive loss of cells with cytoplasmic inclusions correlates with the overall timing of progressive loss of motor function.
This raises the question of whether formation of nuclear versus cytoplasmic inclusions is an intrinsic and stochastic process or whether cellular factors influence the location of seeding. In the terminally differentiated cells of the mouse brain, the preference is for nuclear inclusions (Fig. 1C) whereas in dividing cells in culture (Fig. 2), the preference is strongly for cytoplasmic inclusions. This is consistent with other observations suggesting that cellular parameters can play a role in dictating where inclusions form, with terminally differentiated tissues tending toward nuclear inclusions (53–55). Identifying these components might allow one to manipulate the seeding process.
Perinuclear inclusions disrupt the nuclear membrane; nuclear inclusions do not
Although the factors that influence where inclusions will form remain unknown, when cytoplasmic seeding occurs, perinuclear inclusions eventually impinge on the nuclear membrane, cause local disruption of the nuclear envelope and become coated with NPC proteins (Fig. 2). This is consistent with the reported potential of mHTT to interact directly with the nuclear pore, as demonstrated by complex formation between mHTT inclusions and nucleoporin-62 (Nup-62) (56).
The distortion of the nuclear envelope by perinuclear inclusions appears similar to the engulfing of viral particles by the cytoplasmic membrane (57). We considered the possibility that perinuclear inclusions plunging into the nucleus might be involved in a novel ‘endonucleosis-like’ process, resulting in conversion of perinuclear inclusions into intranuclear inclusions. If so, a sign that this occurred would be bona fide intranuclear inclusions surrounded by NPCs. However, no evidence of NPC staining with any of the intranuclear inclusions was evident (Fig. 2). Further, time-lapse imaging shows that despite their causing severe distortion of the nuclear envelope, perinuclear inclusions appear unable to convert to nuclear inclusions. It is worth noting that inclusions pushing into the nuclear envelope can be incorrectly categorized as intranuclear in the absence of confocal analysis or other measures to correctly classify them.
In the region where the perinuclear inclusion impinges on the nuclear membrane, the membrane is disrupted (Fig. 5). Two possible mechanisms of nuclear disruption include (1) simple mechanical stress or (2) a localized urea-like denaturing propensity recently proposed for polyglutamine structures (9). The point of interaction between inclusions and the nuclear membrane was not coincident with the location of the microtubule-organizing center, a potential source of mechanical stress, as revealed by staining with anti ß-tubulin antibodies (not shown). On the other hand, the nuclear membrane appears to simply fade or dissolve at the point where inclusions intimately interact with the membrane (see, e.g. Fig. 5Cd and Dd). This observation is consistent with a model in which the polyQ inclusion creates a localized denaturing environment (9). Interestingly, we have never observed a nuclear inclusion disrupting the nuclear membrane.
We find that, in the striata of R6/2 mice, perinuclear mHTT inclusions are associated with cytotoxicity whereas nuclear inclusions appear to be well tolerated. This is consistent with other studies underscoring the importance of cytoplasmic mHTT in the pathogenic process (8,58).
Perinuclear inclusions are accompanied by re-entry into the cell-cycle and neuronal death; nuclear inclusions are not
The appearance of cell-cycle markers in the striata of both 20- and 28-week-old mice challenged with mHTT is strictly correlated with the presence of perinuclear inclusions (Fig. 6). In contrast, no cells with diffuse mHTT or with intranuclear inclusions exhibited cell-cycle markers at any time (Tables 1 and 2). By 36 weeks, cells with perinuclear inclusions and cell-cycle markers have disappeared from the striata suggesting that these cells may have died (Fig. 6A and B and Tables 1 and 2). Similarly, in primary cortical neurons expressing mHTT, cells with perinuclear inclusions were also positive for cell-cycle markers and roughly half of them were dying as revealed by their inability to keep vital dyes from entering the cell (Fig. 7).
Adult CNS neurons are post-mitotic, and the absence of cell division is believed to be a core feature of neuronal identity. Our observations are consistent with studies showing that neurons, in response to various stressors, reenter the cell cycle, arrest at G2/M and eventually die (59–64). It is also well established that activation of CDK5 by Aβ inclusions contributes to neurodegeneration in Alzheimer's disease (36) by causing affected neurons to reenter the cell cycle, arrest at G2/M and undergo apoptosis (64). Engineered activation of the cell cycle in a Drosophila model of tauopathy was sufficient to induce neuronal apoptosis (65). Such cell-cycle alterations have also been found in other models of neurodegenerative diseases including Parkinson's disease (61,66), ALS (61) and others (67,68).
In the case of HD, relatively little is known regarding the dysregulation of the cell cycle and neuronal death in response to mHTT expression. An increase of E2F-1 and cyclin D1 found in HD brain samples suggests activation of the cell cycle in patients (60). Disruption of the nuclear membrane may well be the cellular stressor that causes mature neurons to reenter the cell cycle. The relatively small fraction of striatal cells that exhibit perinuclear inclusions in the mouse may partially reflect the fact that there is less overt cell loss in HD-affected mouse brains than that in humans (69). Indeed, in postmortem human samples, the fraction of striatal cells with nuclear inclusions remains low even in higher grade samples (1–4%) whereas the fraction of cells with nuclear inclusions in the cortex (which is less impacted) increases with increasing grade (14). It may be that differences between mouse and man in the factors that dictate the subcellular distribution of mHTT account for the greater sensitivity of the human versus the mouse striatum to mHTT insult. Significantly, re-activation of cell-cycle markers was only detected in symptomatic mice at early (20 weeks) and middle (28 weeks) stages of pathogenesis but not in the late-stage mice (36 weeks) (Tables 1 and 2) when rotarod performance has declined and death is imminent. If the human pathology follows that seen in the mouse, late-stage postmortem human brain tissue may be depleted of perinuclear HTT-containing cells that have died.
Mechanisms of pathogenesis
Two events correlate with the progressive loss of motor function: (1) the loss of cells with perinuclear inclusions, and (2) an increase in cells with nuclear inclusions. Our observations suggest that perinuclear inclusions cause a re-activation of the cell cycle and lead to neuronal death. However, the functional consequences of nuclear inclusions are less obvious. It is formally possible that nuclear inclusions confer a cellular survival advantage, thus accounting for the increase in cells with nuclear inclusions over time, but that such cells are dysfunctional and, although they do not die, the putative dysfunctionality of these neurons could be contributing to various aspects of HD pathology (although overt loss of neurons remains the ultimate dysfunctional event).
In summary, these studies reveal dynamic changes in the distribution of mHTT during the course of disease progression and suggest a model in which perinuclear inclusions contribute to the death of striatal cells through disruption of their nuclear membranes and activation of the cell cycle. As the formation of nuclear and cytoplasmic inclusions are mutually exclusive (Figs 1 and 2), and our data suggest that only a small fraction of cells harbor perinuclear inclusions at any given time in vivo, these observations provide a mechanistic explanation for the slow, progressive degeneration seen in striatal tissues during HD pathogenesis.
Materials and Methods
Plasmid constructs
For construction of the plasmids HTTex1p25Q-GFP and HTTex1p97Q-GFP, exon 1 cDNAs encoding wild-type and mutant human Htt exon 1 fragment, respectively, were tagged with GFP at the C-termini and cloned into the pcDNA3 vector. To construct myc-tagged variants, PCR fragments amplified from HTTex1p25Q-GFP and HTTex1p97Q-GFP were cloned into the vector pEF-myc (Invitrogen), resulting in HTTex1p25Q-myc and HTTex1p97Q-myc, respectively, with the myc tag attached to the C-termini of the HTT fragments. The compositions of all plasmids were verified by DNA sequencing before use.
Antibodies
The sources and working dilutions of the primary antibodies were as follows: MAb414 (1 : 1000) was a mouse monoclonal antibody against the NPC protein, nucleoprotein 62 (Nup-62, Covance). Anti-c-myc (A-14; 1 : 1000), anti-CDK5 (C-8; 1 : 100) and anti-cyclin B1 (H-433, 1 : 100) were all from Santa Cruz Biotech. Anti-NeuN (1 : 200), anti-GFAP (1 : 200), anti-ChAT (1 : 200) and anti-human HTT (EM48; 1 : 200) were all from Millipore. Anti-DARPP32 (1 : 100; Abcam) recognized the dopamine- and cyclic AMP-regulated phosphoprotein. The appropriate Alexa Fluor 488 (1 : 1000), Alexa Fluor 546 (1 : 1000) and Alexa Fluor 647 (1 : 1000) conjugated secondary antibodies were from Molecular Probes.
Transgenic HD mice
Transgenic HD mice, B6CBA-Tg(HDexon1)62Gpb/2J (R6/2-J2), were acquired from Jackson Laboratories (Bar Harbor, ME). These mice initially expressed exon 1 of human HTT with 250 CAG (glutamine) repeats, but the length of the repeats increased to longer than 250 CAGs as the mice aged. These mice had a longer life span (36–40 weeks) than that reported for the original R6/2 strain (29). Onset of HD symptoms in these mice was apparent from ∼ 20 weeks of age based on the rotarod behavioral test. Rotarod performance was tested at different time intervals by testing how long each mouse could remain on a 16-rpm rotating rod over a 120-s interval. Two replicates of 9 wt and 8 Tg mice (34 total) were tested on the weeks indicated in Figure 1. Each mouse was given three trials, and the longest latency was recorded for the studies shown here. Mouse deaths were accompanied by decreased body weight and brain atrophy.
Immunofluorescent staining and quantification of brain sections from R6/2 mice
Brain sections were prepared following standard procedures. Briefly, brains from R6/2 and wt mice were prepared and 8 µm sections along the rostrocaudal axis spanning the striatum were prepared. After rinsing in PBS, slides containing the brain sections were immersed in 1% sudan black solution for 7 min and washed with 50% isopropanol/H2O until the samples became clear. Slides were then treated with 5% FBS in PBST (PBS plus 0.2% Tween-20) for 60 min at room temperature, followed by incubation with one or more of the primary antibodies (including anti-human HTT, anti-cyclin B1, anti-CDK5, anti-NeuN, anti-GFAP, anti-DARPP32 and anti-ChAT) in PBST overnight at 4°C. The sections were then rinsed five times in PBST and incubated for 1 h with Alexa Fluor 488-, 546- or 647-labeled donkey anti-mouse, anti-rabbit, anti-rat or anti-goat IgG. The sections were analyzed in the confocal laser-scanning microscope (Carl Zeiss LSM510) as described earlier for the HEK 293T cells.
To count the number of neurons, MSN-type cells and cells with mHTT inclusions in the striatal area of the brain, a total of 10 sections, from every fifth section covering the middle region of the striatum, were co-stained with anti-NeuN, anti-DARPP32 and anti-human HTT. For each staining, three R6/2 and three wt mice at each age were used (72 total). For the cyclinB1 and CDK5 studies, five R6/2 and five wt mice at each age were stained with the respective antibody. Sections were analyzed using a Zeiss LSM510 confocal microscope.
Cell culture and DNA transfection
HEK 293T cells were grown in Dulbecco's Modified Eagle Medium (Invitrogen) with 10% fetal bovine serum (Biological Industries). ST14A cells (embryonic day 14 rat striatal primordial cells expressing SV40 large T Antigen) were grown in Dulbecco's Modified Eagle Medium (high glucose, Hyclone) with 10% fetal bovine serum at 33°C. The HEK 293T cells were transfected with the plasmid DNAs using the calcium phosphate co-precipitation method, whereas ST14A cells underwent transient transfection by Lipofectamine 2000 (Invitrogen) according to the manufacturer's instructions. Primary cortical neurons were prepared as described (70). All experiments were performed 5 days after plating. The cortical primary cultures were transfected with HTTex1p97Q-GFP after 5 days in vitro (DIV 5) and analyzed at DIV 7 by staining with DAPI (blue), anti-human HTT (green), anti-CDK5 (yellow) and EthD-1 (red).
Immunofluorescence analysis of HEK 293T and ST14A cells
HEK 293T cells and ST14A cells were washed in PBS before fixing with 4% paraformaldehyde. The cells were then incubated with primary antibodies overnight at 4°C, followed by incubation with Alexa Fluor 546- and Alexa Fluor 647-conjugated secondary antibodies for 2 h. After incubation with DAPI (4′,6′-diamidino-2-phenylindole; Molecular Probes) to visualize the nuclei, the cells were mounted in Vectashield (Vector Laboratories) and imaged with a Zeiss LSM 510 META microscope using the MetaMorph software (Meta Imaging Series version 6.1; Universal Imaging Corporation).
Time-lapse imaging of HEK 293T cells
HEK 293T cells were cultured on coverslips and transiently transfected with HTTex1p97Q-GFP. At 24 h post-transfection, the cells were placed into the POC-R closed chamber (Live Cell Cultivation System, Major Instruments Co.) and imaged with a Zeiss PASCAL microscope with continuous recording of the cell fates for up to 20–30 h. The images were analyzed using MetaMorph software.
Electron microscopy
For EM and IEM, the cells were transiently transfected with HTTex1p97Q-GFP or HTTex1p97Q-myc, and harvested 48 h later. For conventional EM, the cells were trypsinized and fixed in 2.5% glutaraldehyde followed by 2% osmium tetroxide, dehydrated, prestained with 2% uranyl acetate in acetone and embedded in Poly/Bed 812 (Polysciences) according to the standard protocols. For IEM, the cells were fixed in 2% paraformaldehyde, treated with uranyl carbonate and embedded in LRGold (London Resin Co., London, UK). For immunocytochemical labeling, nonspecific binding on the sections was reduced by blocking with donkey serum. Sections were then incubated with appropriate primary antibodies followed by incubation with secondary antibodies (Jackson ImmunoResearch) at two different gold-tagged sizes (12 nm for anti-NPC and 18 nm for anti-myc) before being stained with uranyl acetate and lead hydroxide. Transmission electron microscopy images were acquired using a Tecnai G2 Spirit TWIN (FEI Company).
Staining of death markers in transfected cells
HEK 293T cells were cultured on 12-well dishes (Costar) and transiently transfected with HTTex1p97Q-GFP. After 48 h, cells were co-stained with either Hoechst 33342 (1 ug/ml, Invitrogen) plus the death marker PI (1 mg/ml, Calbiochem) or with Hoechst plus ethidium-homodimer-1 (2 µm/ml, Molecular Probes) in PBS for 10 min. The images were taken at 40× magnification using an Imagexpress XL (molecular device) and analyzed using the MetaXpress software.
Supplementary Material
Funding
This research was supported by the National Science Council (NSC) and the Academia Sinica (AS), Taipei, Taiwan, ROC, and by a grant from the National Institute of Health (NS-45283 to J.L.M.). Y.-C.S. was an AS postdoctoral fellow, and J.S. is an AS Investigator Awardee.
Supplementary Material
Acknowledgements
We thank Wei-Yuan Hsiao for providing the plasmid constructs HTTex1p25Q-myc and HTTex1p97Q-myc used in this study. We also thank Shu-Ping Tsai (EM facility), Shu-Ping Lee (confocal microscope core), Ya-Min Lin (cell sorting core), Dr Jan-Mou Lee and Dr I.-F. Wang from the Institute of Molecular Biology for their help and suggestions at various stages of the project.
Conflict of Interest statement. None declared.
References
- 1.Perutz M.F., Windle A.H. Cause of neural death in neurodegenerative diseases attributable to expansion of glutamine repeats. Nature. 2001;412:143–144. doi: 10.1038/35084141. [DOI] [PubMed] [Google Scholar]
- 2.Portera-Cailliau C., Hedreen J.C., Price D.L., Koliatsos V.E. Evidence for apoptotic cell death in Huntington disease and excitotoxic animal models. J. Neurosci. 1995;15:3775–3787. doi: 10.1523/JNEUROSCI.15-05-03775.1995. [DOI] [PMC free article] [PubMed] [Google Scholar]
- 3.Dragunow M., Faull R.L., Lawlor P., Beilharz E.J., Singleton K., Walker E.B., Mee E. In situ evidence for DNA fragmentation in Huntington's disease striatum and Alzheimer's disease temporal lobes. Neuroreport. 1995;6:1053–1057. doi: 10.1097/00001756-199505090-00026. [DOI] [PubMed] [Google Scholar]
- 4.Bjorkoy G., Lamark T., Brech A., Outzen H., Perander M., Overvatn A., Stenmark H., Johansen T. p62/SQSTM1 forms protein aggregates degraded by autophagy and has a protective effect on huntingtin-induced cell death. J. Cell Biol. 2005;171:603–614. doi: 10.1083/jcb.200507002. [DOI] [PMC free article] [PubMed] [Google Scholar]
- 5.Ross C.A., Margolis R.L., Rosenblatt A., Ranen N.G., Becher M.W., Aylward E. Huntington disease and the related disorder, dentatorubral-pallidoluysian atrophy (DRPLA) Medicine (Baltimore) 1997;76:305–338. doi: 10.1097/00005792-199709000-00001. [DOI] [PubMed] [Google Scholar]
- 6.Orr H.T. Hereditary ataxia. An unfolded protein. Lancet. 2001;358(Suppl):S35. doi: 10.1016/s0140-6736(01)07048-9. [DOI] [PubMed] [Google Scholar]
- 7.Li S.H., Li X.J. Huntingtin and its role in neuronal degeneration. Neuroscientist. 2004;10:467–475. doi: 10.1177/1073858404266777. [DOI] [PubMed] [Google Scholar]
- 8.Mielcarek M., Landles C., Weiss A., Bradaia A., Seredenina T., Inuabasi L., Osborne G.F., Wadel K., Touller C., Butler R., et al. HDAC4 reduction: a novel therapeutic strategy to target cytoplasmic huntingtin and ameliorate neurodegeneration. PLoS Biol. 2013;11:e1001717. doi: 10.1371/journal.pbio.1001717. [DOI] [PMC free article] [PubMed] [Google Scholar]
- 9.England J.L., Kaganovich D. Polyglutamine shows a urea-like affinity for unfolded cytosolic protein. FEBS Lett. 2011;585:381–384. doi: 10.1016/j.febslet.2010.12.023. [DOI] [PubMed] [Google Scholar]
- 10.Kaganovich D., Kopito R., Frydman J. Misfolded proteins partition between two distinct quality control compartments. Nature. 2008;454:1088–1095. doi: 10.1038/nature07195. [DOI] [PMC free article] [PubMed] [Google Scholar]
- 11.Waelter S., Boeddrich A., Lurz R., Scherzinger E., Lueder G., Lehrach H., Wanker E.E. Accumulation of mutant huntingtin fragments in aggresome-like inclusion bodies as a result of insufficient protein degradation. Mol. Biol. Cell. 2001;12:1393–1407. doi: 10.1091/mbc.12.5.1393. [DOI] [PMC free article] [PubMed] [Google Scholar]
- 12.Arrasate M., Mitra S., Schweitzer E.S., Segal M.R., Finkbeiner S. Inclusion body formation reduces levels of mutant huntingtin and the risk of neuronal death. Nature. 2004;431:805–810. doi: 10.1038/nature02998. [DOI] [PubMed] [Google Scholar]
- 13.DiFiglia M., Sapp E., Chase K.O., Davies S.W., Bates G.P., Vonsattel J.P., Aronin N. Aggregation of huntingtin in neuronal intranuclear inclusions and dystrophic neurites in brain. Science. 1997;277:1990–1993. doi: 10.1126/science.277.5334.1990. [DOI] [PubMed] [Google Scholar]
- 14.Gutekunst C.A., Li S.H., Yi H., Mulroy J.S., Kuemmerle S., Jones R., Rye D., Ferrante R.J., Hersch S.M., Li X.J. Nuclear and neuropil aggregates in Huntington's disease: relationship to neuropathology. J. Neurosci. 1999;19:2522–2534. doi: 10.1523/JNEUROSCI.19-07-02522.1999. [DOI] [PMC free article] [PubMed] [Google Scholar]
- 15.Goldberg Y.P., Nicholson D.W., Rasper D.M., Kalchman M.A., Koide H.B., Graham R.K., Bromm M., Kazemi-Esfarjani P., Thornberry N.A., Vaillancourt J.P., et al. Cleavage of huntingtin by apopain, a proapoptotic cysteine protease, is modulated by the polyglutamine tract. Nat. Genet. 1996;13:442–449. doi: 10.1038/ng0896-442. [DOI] [PubMed] [Google Scholar]
- 16.Wellington C.L., Ellerby L.M., Hackam A.S., Margolis R.L., Trifiro M.A., Singaraja R., McCutcheon K., Salvesen G.S., Propp S.S., Bromm M., et al. Caspase cleavage of gene products associated with triplet expansion disorders generates truncated fragments containing the polyglutamine tract. J. Biol. Chem. 1998;273:9158–9167. doi: 10.1074/jbc.273.15.9158. [DOI] [PubMed] [Google Scholar]
- 17.Lunkes A., Lindenberg K.S., Ben-Haiem L., Weber C., Devys D., Landwehrmeyer G.B., Mandel J.L., Trottier Y. Proteases acting on mutant huntingtin generate cleaved products that differentially build up cytoplasmic and nuclear inclusions. Mol. Cell. 2002;10:259–269. doi: 10.1016/s1097-2765(02)00602-0. [DOI] [PubMed] [Google Scholar]
- 18.Lunkes A., Mandel J.L. A cellular model that recapitulates major pathogenic steps of Huntington's disease. Hum. Mol. Genet. 1998;7:1355–1361. doi: 10.1093/hmg/7.9.1355. [DOI] [PubMed] [Google Scholar]
- 19.Li H., Li S.H., Yu Z.X., Shelbourne P., Li X.J. Huntingtin aggregate-associated axonal degeneration is an early pathological event in Huntington's disease mice. J. Neurosci. 2001;21:8473–8481. doi: 10.1523/JNEUROSCI.21-21-08473.2001. [DOI] [PMC free article] [PubMed] [Google Scholar]
- 20.Sawa A., Nagata E., Sutcliffe S., Dulloor P., Cascio M.B., Ozeki Y., Roy S., Ross C.A., Snyder S.H. Huntingtin is cleaved by caspases in the cytoplasm and translocated to the nucleus via perinuclear sites in Huntington's disease patient lymphoblasts. Neurobiol. Dis. 2005;20:267–274. doi: 10.1016/j.nbd.2005.02.013. [DOI] [PubMed] [Google Scholar]
- 21.Sathasivam K., Neueder A., Gipson T.A., Landles C., Benjamin A.C., Bondulich M.K., Smith D.L., Faull R.L., Roos R.A., Howland D., et al. Aberrant splicing of HTT generates the pathogenic exon 1 protein in Huntington disease. Proc. Natl Acad. Sci. USA. 2013;110:2366–2370. doi: 10.1073/pnas.1221891110. [DOI] [PMC free article] [PubMed] [Google Scholar]
- 22.Menalled L.B. Knock-in mouse models of Huntington's disease. NeuroRx. 2005;2:465–470. doi: 10.1602/neurorx.2.3.465. [DOI] [PMC free article] [PubMed] [Google Scholar]
- 23.Kuhn A., Goldstein D.R., Hodges A., Strand A.D., Sengstag T., Kooperberg C., Becanovic K., Pouladi M.A., Sathasivam K., Cha J.H., et al. Mutant Huntington's effects on striatal gene expression in mice recapitulate changes observed in human Huntington's disease brain and do not differ with mutant huntingtin length or wild-type huntingtin dosage. Hum. Mol. Genet. 2007;16:1845–1861. doi: 10.1093/hmg/ddm133. [DOI] [PubMed] [Google Scholar]
- 24.Landles C., Sathasivam K., Weiss A., Woodman B., Moffitt H., Finkbeiner S., Sun B., Gafni J., Ellerby L.M., Trottier Y., et al. Proteolysis of mutant Huntingtin produces an exon 1 fragment that accumulates as an aggregated protein in neuronal nuclei in Huntington disease. J. Biol. Chem. 2010;285:8808–8823. doi: 10.1074/jbc.M109.075028. [DOI] [PMC free article] [PubMed] [Google Scholar]
- 25.Seward M.E., Swanson E., Norambuena A., Reimann A., Cochran J.N., Li R., Roberson E.D., Bloom G.S. Amyloid-beta signals through tau to drive ectopic neuronal cell cycle re-entry in Alzheimer's disease. J. Cell Sci. 2013;126:1278–1286. doi: 10.1242/jcs.1125880. [DOI] [PMC free article] [PubMed] [Google Scholar]
- 26.Heintz N. Cell death and the cell cycle: a relationship between transformation and neurodegeneration? Trends Biochem. Sci. 1993;18:157–159. doi: 10.1016/0968-0004(93)90103-t. [DOI] [PubMed] [Google Scholar]
- 27.Mangiarini L., Sathasivam K., Seller M., Cozens B., Harper A., Hetherington C., Lawton M., Trottier Y., Lehrach H., Davies S.W., et al. Exon 1 of the HD gene with an expanded CAG repeat is sufficient to cause a progressive neurological phenotype in transgenic mice. Cell. 1996;87:493–506. doi: 10.1016/s0092-8674(00)81369-0. [DOI] [PubMed] [Google Scholar]
- 28.Menalled L.B., Chesselet M.F. Mouse models of Huntington's disease. Trends Pharmacol. Sci. 2002;23:32–39. doi: 10.1016/s0165-6147(00)01884-8. [DOI] [PubMed] [Google Scholar]
- 29.Lin Y.T., Chern Y., Shen C.K., Wen H.L., Chang Y.C., Li H., Cheng T.H., Hsieh-Li H.M. Human mesenchymal stem cells prolong survival and ameliorate motor deficit through trophic support in Huntington's disease mouse models. PLoS One. 2011;6:e22924. doi: 10.1371/journal.pone.0022924. [DOI] [PMC free article] [PubMed] [Google Scholar]
- 30.Morton A.J., Glynn D., Leavens W., Zheng Z., Faull R.L., Skepper J.N., Wight J.M. Paradoxical delay in the onset of disease caused by super-long CAG repeat expansions in R6/2 mice. Neurobiol. Dis. 2009;33:331–341. doi: 10.1016/j.nbd.2008.11.015. [DOI] [PubMed] [Google Scholar]
- 31.Mullen R.J., Buck C.R., Smith A.M. NeuN, a neuronal specific nuclear protein in vertebrates. Development. 1992;116:201–211. doi: 10.1242/dev.116.1.201. [DOI] [PubMed] [Google Scholar]
- 32.Gong B., Lim M.C., Wanderer J., Wyttenbach A., Morton A.J. Time-lapse analysis of aggregate formation in an inducible PC12 cell model of Huntington's disease reveals time-dependent aggregate formation that transiently delays cell death. Brain Res. Bull. 2008;75:146–157. doi: 10.1016/j.brainresbull.2007.08.005. [DOI] [PubMed] [Google Scholar]
- 33.Kazantsev A., Walker H.A., Slepko N., Bear J.E., Preisinger E., Steffan J.S., Zhu Y.Z., Gertler F.B., Housman D.E., Marsh J.L., et al. A bivalent Huntingtin binding peptide suppresses polyglutamine aggregation and pathogenesis in Drosophila. Nat. Genet. 2002;30:367–376. doi: 10.1038/ng864. [DOI] [PubMed] [Google Scholar]
- 34.Preisinger E., Jordan B.M., Kazantsev A., Housman D. Evidence for a recruitment and sequestration mechanism in Huntington's disease. Philos. Trans. R. Soc. Lond. B Biol. Sci. 1999;354:1029–1034. doi: 10.1098/rstb.1999.0455. [DOI] [PMC free article] [PubMed] [Google Scholar]
- 35.Vincent I., Jicha G., Rosado M., Dickson D.W. Aberrant expression of mitotic cdc2/cyclin B1 kinase in degenerating neurons of Alzheimer's disease brain. J. Neurosci. 1997;17:3588–3598. doi: 10.1523/JNEUROSCI.17-10-03588.1997. [DOI] [PMC free article] [PubMed] [Google Scholar]
- 36.Lopes J.P., Oliveira C.R., Agostinho P. Cdk5 acts as a mediator of neuronal cell cycle re-entry triggered by amyloid-beta and prion peptides. Cell Cycle. 2009;8:97–104. doi: 10.4161/cc.8.1.7506. [DOI] [PubMed] [Google Scholar]
- 37.Yoshikawa K. Cell cycle regulators in neural stem cells and postmitotic neurons. Neurosci. Res. 2000;37:1–14. doi: 10.1016/s0168-0102(00)00101-2. [DOI] [PubMed] [Google Scholar]
- 38.Zhu X., McShea A., Harris P.L., Raina A.K., Castellani R.J., Funk J.O., Shah S., Atwood C., Bowen R., Bowser R., et al. Elevated expression of a regulator of the G2/M phase of the cell cycle, neuronal CIP-1-associated regulator of cyclin B, in Alzheimer's disease. J. Neurosci. Res. 2004;75:698–703. doi: 10.1002/jnr.20028. [DOI] [PubMed] [Google Scholar]
- 39.Arendt T., Rodel L., Gartner U., Holzer M. Expression of the cyclin-dependent kinase inhibitor p16 in Alzheimer's disease. Neuroreport. 1996;7:3047–3049. doi: 10.1097/00001756-199611250-00050. [DOI] [PubMed] [Google Scholar]
- 40.Slow E.J., van Raamsdonk J., Rogers D., Coleman S.H., Graham R.K., Deng Y., Oh R., Bissada N., Hossain S.M., Yang Y.Z., et al. Selective striatal neuronal loss in a YAC128 mouse model of Huntington disease. Hum. Mol. Genet. 2003;12:1555–1567. doi: 10.1093/hmg/ddg169. [DOI] [PubMed] [Google Scholar]
- 41.Schilling G., Becher M.W., Sharp A.H., Jinnah H.A., Duan K., Kotzuk J.A., Slunt H.H., Ratovitski T., Cooper J.K., Jenkins N.A., et al. Intranuclear inclusions and neuritic aggregates in transgenic mice expressing a mutant N-terminal fragment of huntingtin. Hum. Mol. Genet. 1999;8:397–407. doi: 10.1093/hmg/8.3.397. [DOI] [PubMed] [Google Scholar]
- 42.Seredenina T., Luthi-Carter R. What have we learned from gene expression profiles in Huntington's disease? Neurobiol. Dis. 2012;45:83–98. doi: 10.1016/j.nbd.2011.07.001. [DOI] [PubMed] [Google Scholar]
- 43.Ross C.A., Tabrizi S.J. Huntington's disease: from molecular pathogenesis to clinical treatment. Lancet Neurol. 2011;10:83–98. doi: 10.1016/S1474-4422(10)70245-3. [DOI] [PubMed] [Google Scholar]
- 44.Zuchner T., Brundin P. Mutant huntingtin can paradoxically protect neurons from death. Cell Death Differ. 2008;15:435–442. doi: 10.1038/sj.cdd.4402261. [DOI] [PubMed] [Google Scholar]
- 45.Stack E.C., Kubilus J.K., Smith K., Cormier K., Del Signore S.J., Guelin E., Ryu H., Hersch S.M., Ferrante R.J. Chronology of behavioral symptoms and neuropathological sequela in R6/2 Huntington's disease transgenic mice. J. Comp. Neurol. 2005;490:354–370. doi: 10.1002/cne.20680. [DOI] [PubMed] [Google Scholar]
- 46.Beilharz E.J., Williams C.E., Dragunow M., Sirimanne E.S., Gluckman P.D. Mechanisms of delayed cell death following hypoxic-ischemic injury in the immature rat: evidence for apoptosis during selective neuronal loss. Brain Res. Mol. Brain Res. 1995;29:1–14. doi: 10.1016/0169-328x(94)00217-3. [DOI] [PubMed] [Google Scholar]
- 47.Turmaine M., Raza A., Mahal A., Mangiarini L., Bates G.P., Davies S.W. Nonapoptotic neurodegeneration in a transgenic mouse model of Huntington's disease. Proc. Natl Acad. Sci. USA. 2000;97:8093–8097. doi: 10.1073/pnas.110078997. [DOI] [PMC free article] [PubMed] [Google Scholar]
- 48.Kazemi-Esfarjani P., Benzer S. Genetic suppression of polyglutamine toxicity in Drosophila. Science. 2000;287:1837–1840. doi: 10.1126/science.287.5459.1837. [DOI] [PubMed] [Google Scholar]
- 49.Chang D.T., Rintoul G.L., Pandipati S., Reynolds I.J. Mutant huntingtin aggregates impair mitochondrial movement and trafficking in cortical neurons. Neurobiol. Dis. 2006;22:388–400. doi: 10.1016/j.nbd.2005.12.007. [DOI] [PubMed] [Google Scholar]
- 50.Yamamoto A., Lucas J.J., Hen R. Reversal of neuropathology and motor dysfunction in a conditional model of Huntington's disease. Cell. 2000;101:57–66. doi: 10.1016/S0092-8674(00)80623-6. [DOI] [PubMed] [Google Scholar]
- 51.Davies S.W., Turmaine M., Cozens B.A., DiFiglia M., Sharp A.H., Ross C.A., Scherzinger E., Wanker E.E., Mangiarini L., Bates G.P. Formation of neuronal intranuclear inclusions underlies the neurological dysfunction in mice transgenic for the HD mutation. Cell. 1997;90:537–548. doi: 10.1016/s0092-8674(00)80513-9. [DOI] [PubMed] [Google Scholar]
- 52.Ossato G., Digman M.A., Aiken C., Lukacsovich T., Marsh J.L., Gratton E. A two-step path to inclusion formation of huntingtin peptides revealed by number and brightness analysis. Biophys. J. 2010;98:3078–3085. doi: 10.1016/j.bpj.2010.02.058. [DOI] [PMC free article] [PubMed] [Google Scholar]
- 53.Cooper J.K., Schilling G., Peters M.F., Herring W.J., Sharp A.H., Kaminsky Z., Masone J., Khan F.A., Delanoy M., Borchelt D.R., et al. Truncated N-terminal fragments of huntingtin with expanded glutamine repeats form nuclear and cytoplasmic aggregates in cell culture. Hum. Mol. Genet. 1998;7:783–790. doi: 10.1093/hmg/7.5.783. [DOI] [PubMed] [Google Scholar]
- 54.Moffitt H., McPhail G.D., Woodman B., Hobbs C., Bates G.P. Formation of polyglutamine inclusions in a wide range of non-CNS tissues in the HdhQ150 knock-in mouse model of Huntington's disease. PLoS One. 2009;4:e8025. doi: 10.1371/journal.pone.0008025. [DOI] [PMC free article] [PubMed] [Google Scholar]
- 55.Orth M., Cooper J.M., Bates G.P., Schapira A.H. Inclusion formation in Huntington's disease R6/2 mouse muscle cultures. J. Neurochem. 2003;87:1–6. doi: 10.1046/j.1471-4159.2003.02009.x. [DOI] [PubMed] [Google Scholar]
- 56.Suhr S.T., Senut M.C., Whitelegge J.P., Faull K.F., Cuizon D.B., Gage F.H. Identities of sequestered proteins in aggregates from cells with induced polyglutamine expression. J. Cell Biol. 2001;153:283–294. doi: 10.1083/jcb.153.2.283. [DOI] [PMC free article] [PubMed] [Google Scholar]
- 57.Hamirally S., Kamil J.P., Ndassa-Colday Y.M., Lin A.J., Jahng W.J., Baek M.C., Noton S., Silva L.A., Simpson-Holley M., Knipe D.M., et al. Viral mimicry of Cdc2/cyclin-dependent kinase 1 mediates disruption of nuclear lamina during human cytomegalovirus nuclear egress. PLoS Pathog. 2009;5:e1000275. doi: 10.1371/journal.ppat.1000275. [DOI] [PMC free article] [PubMed] [Google Scholar]
- 58.Benn C.L., Landles C., Li H., Strand A.D., Woodman B., Sathasivam K., Li S.H., Ghazi-Noori S., Hockly E., Faruque S.M., et al. Contribution of nuclear and extranuclear polyQ to neurological phenotypes in mouse models of Huntington's disease. Hum. Mol. Genet. 2005;14:3065–3078. doi: 10.1093/hmg/ddi340. [DOI] [PubMed] [Google Scholar]
- 59.Martin-Aparicio E., Avila J., Lucas J.J. Nuclear localization of N-terminal mutant huntingtin is cell cycle dependent. Eur. J. Neurosci. 2002;16:355–359. doi: 10.1046/j.1460-9568.2002.02075.x. [DOI] [PubMed] [Google Scholar]
- 60.Pelegri C., Duran-Vilaregut J., del Valle J., Crespo-Biel N., Ferrer I., Pallas M., Camins A., Vilaplana J. Cell cycle activation in striatal neurons from Huntington's disease patients and rats treated with 3-nitropropionic acid. Int. J. Dev. Neurosci. 2008;26:665–671. doi: 10.1016/j.ijdevneu.2008.07.016. [DOI] [PubMed] [Google Scholar]
- 61.Lee H.G., Casadesus G., Zhu X., Castellani R.J., McShea A., Perry G., Petersen R.B., Bajic V., Smith M.A. Cell cycle re-entry mediated neurodegeneration and its treatment role in the pathogenesis of Alzheimer's disease. Neurochem. Int. 2009;54:84–88. doi: 10.1016/j.neuint.2008.10.013. [DOI] [PMC free article] [PubMed] [Google Scholar]
- 62.Wu Q., Combs C., Cannady S.B., Geldmacher D.S., Herrup K. Beta-amyloid activated microglia induce cell cycling and cell death in cultured cortical neurons. Neurobiol. Aging. 2000;21:797–806. doi: 10.1016/s0197-4580(00)00219-0. [DOI] [PubMed] [Google Scholar]
- 63.McShea A., Lee H.G., Petersen R.B., Casadesus G., Vincent I., Linford N.J., Funk J.O., Shapiro R.A., Smith M.A. Neuronal cell cycle re-entry mediates Alzheimer disease-type changes. Biochim. Biophys. Acta. 2007;1772:467–472. doi: 10.1016/j.bbadis.2006.09.010. [DOI] [PubMed] [Google Scholar]
- 64.Yang Y., Varvel N.H., Lamb B.T., Herrup K. Ectopic cell cycle events link human Alzheimer's disease and amyloid precursor protein transgenic mouse models. J. Neurosci. 2006;26:775–784. doi: 10.1523/JNEUROSCI.3707-05.2006. [DOI] [PMC free article] [PubMed] [Google Scholar]
- 65.Khurana V., Feany M.B. Connecting cell-cycle activation to neurodegeneration in Drosophila. Biochim. Biophys. Acta. 2007;1772:446–456. doi: 10.1016/j.bbadis.2006.10.007. [DOI] [PMC free article] [PubMed] [Google Scholar]
- 66.Klein J.A., Ackerman S.L. Oxidative stress, cell cycle, and neurodegeneration. J. Clin. Invest. 2003;111:785–793. doi: 10.1172/JCI18182. [DOI] [PMC free article] [PubMed] [Google Scholar]
- 67.Lopes J.P., Agostinho P. Cdk5: multitasking between physiological and pathological conditions. Prog. Neurobiol. 2011;94:49–63. doi: 10.1016/j.pneurobio.2011.03.006. [DOI] [PubMed] [Google Scholar]
- 68.Patrick G.N., Zukerberg L., Nikolic M., de la Monte S., Dikkes P., Tsai L.H. Conversion of p35 to p25 deregulates Cdk5 activity and promotes neurodegeneration. Nature. 1999;402:615–622. doi: 10.1038/45159. [DOI] [PubMed] [Google Scholar]
- 69.Li X.J., Li S. Influence of species differences on the neuropathology of transgenic Huntington's disease animal models. J. Genet. Genomics. 2012;39:239–245. doi: 10.1016/j.jgg.2012.05.002. [DOI] [PMC free article] [PubMed] [Google Scholar]
- 70.Trushina E., Dyer R.B., Badger J.D., 2nd, Ure D., Eide L., Tran D.D., Vrieze B.T., Legendre-Guillemin V., McPherson P.S., Mandavilli B.S., et al. Mutant huntingtin impairs axonal trafficking in mammalian neurons in vivo and in vitro. Mol. Cell. Biol. 2004;24:8195–8209. doi: 10.1128/MCB.24.18.8195-8209.2004. [DOI] [PMC free article] [PubMed] [Google Scholar]
Associated Data
This section collects any data citations, data availability statements, or supplementary materials included in this article.