

Abstract
The strong genetic association between particular HLA alleles and type 1 diabetes (T1D) indicates a key role for CD4+ T cells in disease; however, the differentiation state of the responsible T cells is unclear. T cell differentiation originally was considered a dichotomy between Th1 and Th2 cells, with Th1 cells deemed culpable for autoimmune islet destruction. Now, multiple additional T cell differentiation fates are recognized with distinct roles. Here, we used a transgenic mouse model of diabetes to probe the gene expression profile of islet-specific T cells by microarray and identified a clear follicular helper T (Tfh) cell differentiation signature. Introduction of T cells with a Tfh cell phenotype from diabetic animals efficiently transferred diabetes to recipient animals. Furthermore, memory T cells from patients with T1D expressed elevated levels of Tfh cell markers, including CXCR5, ICOS, PDCD1, BCL6, and IL21. Defects in the IL-2 pathway are associated with T1D, and IL-2 inhibits Tfh cell differentiation in mice. Consistent with these previous observations, we found that IL-2 inhibited human Tfh cell differentiation and identified a relationship between IL-2 sensitivity in T cells from patients with T1D and acquisition of a Tfh cell phenotype. Together, these findings identify a Tfh cell signature in autoimmune diabetes and suggest that this population could be used as a biomarker and potentially targeted for T1D interventions.
Introduction
Identifying the type of immune response that underlies autoimmune tissue destruction is a critical step in designing appropriate immunomodulatory strategies. In the case of type 1 diabetes (T1D), current dogma holds that Th1 cells cause pathology, and deviating the Th1 response has been a cornerstone of immunotherapeutic efforts. This view stemmed from the seminal observation that islet-specific T cells differentiated to a Th1 phenotype caused aggressive diabetes in neonatal nonobese diabetic mice, while those differentiated under Th2 conditions did not (1). While the latter study suggested Th1 cells to be the most likely drivers of T1D, data emerging over the following 2 decades were not always consistent with this conclusion. Although IFN-γ expression correlated with diabetes in NOD mice (2), other data suggested that diabetes in this model represented a Th2 rather than a Th1 phenomenon (3). Analysis of T cell differentiation in patients with T1D was similarly confusing: some work suggested increased IFNG mRNA (4) or stimulation-induced IFN-γ protein in individuals newly diagnosed with T1D (4, 5); however, others found IFN-γ production to be significantly lower in patients with recent-onset T1D than in healthy control subjects (6, 7). In one study, T cell reactivity to preproinsulin was shown to be Th2 dominant in autoantibody-positive subjects (8), again challenging the Th1 paradigm.
The identification of Th17 cells heralded a shift in our appreciation of autoimmune tissue damage and prompted the first move away from a strict dichotomy between Th1 and Th2 (9). Some data hinted at involvement of Th17 cells in T1D (10, 11), although other studies suggested that IL-17 was dispensable (12) or even protective (13, 14) in this setting. The incorporation of Th17 cells into the Th1/Th2 paradigm focused attention on additional cytokines, outside of those associated with Th1 or Th2 differentiation (IFN-γ and IL-4, respectively). One example, IL-21, was shown to be capable of promoting the Th17 response (15, 16). IL-21 is a member of the common γ-chain signaling cytokine family and acts on a broad range of target cell populations, including B cells, CD8 T cells, NK cells, and dendritic cells. Interestingly, abrogation of IL-21 signaling was shown to be protective in mouse models of diabetes (17, 18), while transgenic expression of IL-21 in the pancreatic islets was sufficient to induce diabetes in nonautoimmune (C57BL/6) mice (18). The cellular source of IL-21 in the setting of diabetes is currently unclear, although Th17 cells and follicular helper T (Tfh) cells represent likely candidates. Here, we used an unbiased microarray approach to reassess T cell differentiation in a mouse model of spontaneous autoimmune diabetes. The data indicate that islet-specific T cells responding to pancreatic antigen show the characteristic features of Tfh cell differentiation. Furthermore, analysis of memory CD4 T cells from patients with T1D reveals a striking upregulation of Tfh-associated genes, including CXCR5 and IL21, which are tightly correlated. Collectively, these data implicate IL-21–producing Tfh cells in the immune response associated with T1D.
Results
Islet-specific T cells in the pancreatic LN show a Tfh gene signature.
To dissect the gene expression changes associated with the T cell response to tissue-specific self antigen, we performed microarray analysis on DO11 T cells responding to pancreas-expressed ovalbumin in the DO11 RIP-mOVA mouse model of diabetes (19). Gene expression profiles of CD4 T cells sorted from pancreatic LNs (PanLNs) of DO11 RIP-mOVA mice were compared with those of cells sorted from non-antigen-draining (inguinal) LNs. Conventional (CD4+CD25–) and regulatory (CD4+CD25+) populations were analyzed separately, and cells from the PanLNs were also gated on CD69 expression, since it has been shown that T cells responding to pancreas-derived self antigen upregulate this activation marker (20). Strikingly, 4 of the 20 most significantly upregulated genes in conventional T cells responding to tissue-derived self antigen were archetypal Tfh cell genes (Table 1 and ref. 21). When we hand-curated genes previously associated with Tfh cell differentiation (22), it was clear that these were strongly upregulated in T cells responding to islet antigen. This included Bcl6, the key transcription factor associated with Tfh cell differentiation (refs. 23–25 and Figure 1A). The application of canonical correspondence analysis (CCA) to microarray data has recently been reported (26). This method permits the interrogation of transcriptomic data, in the context of a specific biological problem, using another transcriptome as explanatory data. We adopted this approach to analyze our microarray data in conjunction with a published Tfh data set (25) (see Methods). CCA successfully identified the features of T cells in the PanLNs (magenta circles, Figure 1B), which showed a strong correlation with Tfh cells (blue arrow, Figure 1B). Axis 1 described the major variance (76% of the analyzed space; precisely, inertia) and represented the difference between major T cell groups and that of Tfh (CXCR5+BCL6+) and naive (CXCR5–BCL6–) T cells. Thus, “Tfh-ness” of sample populations could be estimated by CCA using the transcriptomic data derived from Tfh and naive T cells (Figure 1C). PanLN T cell samples scored highly compared with all other samples in this analysis. To address whether Tfh-ness was the dominant feature of PanLN T cells, we also performed heat map analysis using characteristic Th1, Th2, and Th17 genes (Supplemental Figure 1; supplemental material available online with this article; doi:10.1172/JCI76238DS1). PanLN T cells showed elements of the Th1 and Th2 signature; however, most of these genes were not highly expressed. CCA identified PanLN T cells as neutral in terms of Th1 and Th2 skewing and in terms of Th17 differentiation (data not shown). Collectively, these analyses confirmed that Tfh-ness was a major feature of islet-specific T cells in the PanLN, while any Th1, Th2, or Th17 skewing was minor in comparison.
Table 1.
The top 20 most significantly upregulated genes in PanLN T cells compared with inguinal LN T cells
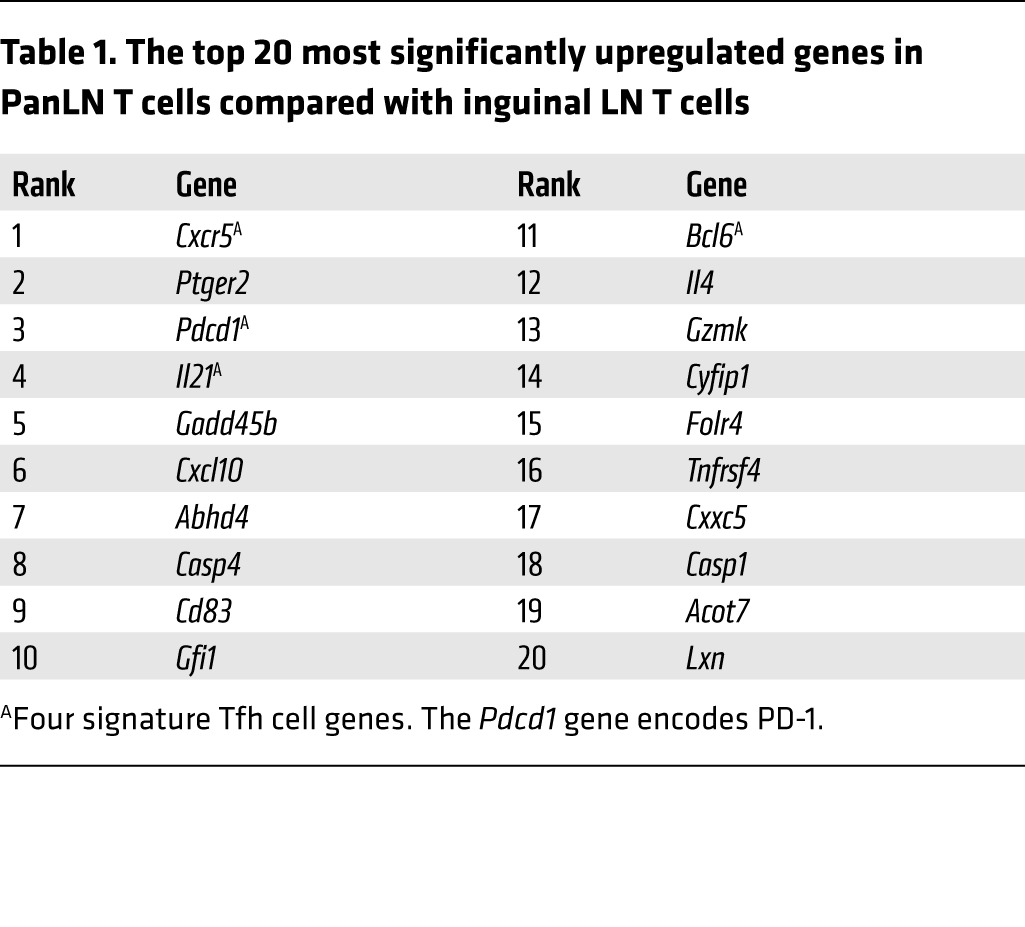
Figure 1. Islet-specific conventional T cells in the PanLNs of DO11 RIP-mOVA mice have a Tfh gene signature.

Microarray analysis of sorted islet-specific conventional T cells or Tregs (CD4+DO11+CD25–CD69–, CD4+DO11+CD25–CD69+, CD4+DO11+CD25+CD69–, CD4+DO11+CD25+CD69+) from the PanLNs or inguinal LNs (LN) of 6-week-old DO11 RIP-mOVA mice. (A) Heat map analysis of microarray data (3–6 replicates for each sort) using a panel of Tfh cell signature genes. PanLN T cell samples cluster together and show strong upregulation of Tfh cell genes. (B) PCA and CCA analysis incorporating a publically available Tfh data set to derive a “Tfh-ness” score. Sample score plot of PCA and CCA biplots, showing sample scores (circles) and explanatory variables (arrows, obtained from a publically available Tfh data set, GSE40068), are shown. (C) Plot of “Tfh-ness” score derived from CCA analysis of the 2 sets of microarray data in B, showing relative correlations of samples to the Tfh population. Differentially expressed genes in the Tfh data set were used (n = 200). Gray line indicates the center of sample scores (0).
Tfh cell markers are upregulated at sites of autoantigen expression, and Tfh cells can transfer disease.
The gene expression analysis suggested that encounter with pancreas-derived self antigen might trigger T cells to differentiate into Tfh cells. We therefore sought to examine this possibility using flow cytometry. CD4 T cells with a Tfh cell phenotype, as assessed by dual staining for CXCR5 and PD-1, could be detected at a markedly higher frequency in the PanLNs compared with the nondraining LNs (Figure 2, A and B). The elevation in CXCR5+PD-1+ T cells in the PanLNs depended on coexpression of both RIP-mOVA and DO11 transgenes (Figure 2A and data not shown). The archetypal function of Tfh cells is to foster the development of germinal centers, sites in which the quality of the B cell response to antigen is honed. Consistent with the presence of Tfh cells, confocal microscopy revealed the presence of germinal centers within the PanLNs of DO11 RIP-mOVA mice (Figure 2C and Supplemental Figure 2). The characteristic cytokine elicited by Tfh cells is IL-21, and we previously reported that mRNA for this cytokine was upregulated during progression to diabetes in DO11 RIP-mOVA mice (19). Flow cytometric staining revealed IL-21 production from conventional T cells in the PanLNs, and levels of IL-21 were further elevated in T cells within the pancreas itself (Figure 3, A and B). IL-21+ T cells did not coexpress IL-17, suggesting that they were not Th17 cells, but there was substantial coexpression of TNF-α and IFN-γ (Figure 3, C and D). It has been shown that IL-21 can derive from CCR9+ T cells in NOD mice and patients with Sjögren’s syndrome (27); however, pancreas-infiltrating CD4+ T cells showed elevated levels of mRNA for Cxcr5, Pdcd1, and Icos but not Ccr9 (Supplemental Figure 3). To directly test the capacity of T cells with a Tfh cell phenotype to transfer diabetes, DO11 T cells from pooled PanLNs of DO11 RIP-mOVA mice were CXCR5 enriched or depleted by cell sorting and their capacity to transfer diabetes into RIP-mOVA–expressing recipients was assessed. T cells enriched for CXCR5 expression showed a significantly increased capacity to transfer diabetes (Figure 4A). Pancreas infiltration could be observed in both groups, confirming successful engraftment of the adoptively transferred cells (Figure 4B). Collectively, these data demonstrate that Tfh cell signature markers are upregulated at sites of autoantigen expression in DO11 RIP-mOVA mice and that T cells with a Tfh cell phenotype are highly efficient at transferring disease.
Figure 2. Tfh cells are detected at sites of autoantigen expression in DO11 RIP-mOVA mice.

(A) Representative staining of pancreatic and inguinal LN (IngLN) cells for Tfh cell markers in 16-week-old DO11 and DO11 RIP-mOVA mice. Plots are gated on CD4+ lymphocytes, and the percentage of CXCR5+PD-1+ events within each oval gate is shown. (B) Frequencies of Tfh cells in the PanLNs and inguinal LNs of prediabetic (6 week) and diabetic (12 and 18 week) DO11 RIP-mOVA mice. Horizontal bars indicate the mean. (C) Confocal imaging of PanLNs and inguinal LNs from DO11 RIP-mOVA and DO11 mice: Ki67 (green), CD3 (blue), IgM (red). Images shown are from 18-week-old animals. GC, germinal center; FM, follicular mantel. Scale bar: 50 μm.
Figure 3. IL-21 production at sites of autoantigen expression in DO11 RIP-mOVA mice.

(A) Representative intracellular cytokine staining for IL-21 in CD4+FOXP3– cells (Tconv) and CD4+FOXP3+ cells (Tregs) isolated from the PanLNs or pancreata of 12-week-old DO11 RIP-mOVA mice. The percentage of CD4+CD3+ cells that are IL-21+ or IL-21– is shown. (B) IL-21 expression in conventional (CD4+FOXP3–) T cells in the inguinal LNs, PanLN, spleens (Spl), and pancreata (Panc) of 6- to 10-week-old DO11 RIP-mOVA mice. Horizontal bars indicate the mean. (C) Intracellular cytokine staining for IL-21, IL-17, TNF-α, and IFN-γ in conventional (CD4+FOXP3–) T cells isolated from the pancreata of DO11 RIP-mOVA mice. Plots shown are from an 11-week-old animal (blood glucose: 363 mg/dl). The frequency of events that fall within each quadrant is shown. (D) Collated data showing the percentage of IL-21+ cells in the pancreata of DO11 RIP-mOVA mice that coexpress IL-17, TNF-α, or IFN-γ (n = 5). ***P < 0.001, ****P < 0.00001. Central horizontal bars depict the mean and are spanned by bars showing the SEM.
Figure 4. Enrichment for Tfh cells leads to preferential transfer of disease.

(A) RIP-mOVA Cd28–/– mice were adoptively transferred with CXCR5-depleted or CXCR5-enriched DO11 T cells sorted from the PanLNs of DO11 RIP-mOVA mice. Blood glucose readings 4 weeks after transfer. **P < 0.01. Central horizontal bars depict the mean and are spanned by bars showing the SEM. (B) Representative pancreas sections stained for T cells (blue) and insulin (brown) are shown (n = 5). Original magnification, ×20.
Memory CD4 T cells from patients with T1D overexpress Tfh cell genes.
Given the findings in our mouse model, we sought to examine whether features of Tfh cell differentiation might be evident in humans with T1D. We studied peripheral blood CD4 T cells from individuals with T1D (see Methods) and healthy control subjects. Since the proportion of CD4 T cells with a memory phenotype can vary substantially between individuals, we prepared purified memory T cell populations (CD4+CD45RA–). This avoids the possibility of observed differences being attributable simply to differing proportions of memory cells within the CD4 compartment. mRNA levels were assessed for a panel of Tfh cell markers, transcription factors, and cytokines. Strikingly, mRNA levels for the Tfh cell markers CXCR5, ICOS, and PDCD1 were all significantly elevated in memory CD4 T cells from patients with T1D compared with those in memory CD4 T cells from healthy controls (Figure 5). mRNA for BCL6, the master transcription factor for Tfh cell differentiation, was also upregulated in the T1D samples relative to the control samples; however, levels of other transcription factors associated with T cell differentiation (including Tbet and GATA3) were not altered between the 2 cohorts. Cytokine mRNAs were generally present at low abundance in T cells examined immediately ex vivo. However, we observed elevated TNFA mRNA in the patients with T1D, along with trends toward higher IL21 and IFNG, although these did not reach significance (Figure 5).
Figure 5. mRNA analysis of memory T cells from patients with T1D reveals a Tfh cell phenotype.

Realtime PCR analysis of memory CD4+CD45RA– T cells negatively selected by magnetic cell separation from the blood of 17 patients with T1D (T1D) and 17 healthy controls (Con). Graphs show expression levels of the indicated target gene relative to GAPDH. Box and whisker plots show the median, interquartile range, and 10th to 90th percentile. P values greater than 0.05 are considered not significant.
Increased T cell CXCR5 expression in T1D.
To extend the above mRNA analysis, peripheral blood T cells from patients with T1D and controls were also assessed by flow cytometry. We first ascertained the distribution of CXCR5+ cells within the CD3+CD4+ compartment and found that they resided predominantly within the central memory (CD4+CD45RA–CD62L+) fraction in both patients with T1D and controls (Figure 6, A and B). However, patients with T1D had a significantly higher percentage of CXCR5+ cells in both the central memory and effector memory compartments when compared with healthy controls (Figure 6C). After normalization for differences in the size of the memory compartment between individuals, there was no association between the percentage of CXCR5+ cells and patient characteristics (Supplemental Figure 4, A and B), suggesting that elevations in CXCR5+ cells may be present at all disease stages. It has been shown that peripheral blood CXCR5+ cells can be subdivided on the basis of CXCR3 and CCR6 expression and that CXCR3–CCR6– and CXCR3–CCR6+ cells are selectively expanded in juvenile dermatomyositis (28). In our study, the proportion of CXCR5+ cells expressing CXCR3 and/or CCR6 did not differ between patients with T1D and controls (Supplemental Figure 4C). When we analyzed cells coexpressing CXCR5 and ICOS, these were significantly elevated in patients with T1D compared with control individuals (Figure 6D). In a second independent cohort of patients with T1D (n = 17) and healthy controls (n = 13), the percentage of CXCR5+ cells and CXCR5+ICOS+ cells was also higher in the patient samples (Supplemental Figure 5). We did not observe a relationship between autoantibody status and percentage of Tfh cells, although it should be noted that a separate study focusing on patients with new-onset T1D showed a small increase in the percentage of Tfh cells in individuals with IA-2 and ZnT8 autoantibodies but not with GAD autoantibodies (29).
Figure 6. Increased frequency of CXCR5+ T cells in patients with T1D.

(A) Representative staining of PBMCs with CXCR5 and canonical T cell memory markers CD45RA, CD62L, and CCR7. Plots are gated on CD3+CD4+ and central memory (C. memory) and effector memory (E. memory) subsets as shown. The percentage of events within each quadrant (top left) is shown on the graph, and the frequency of CXCR5+ events within the naive, central memory, and effector memory fraction is shown as boxed on each subsequent plot. (B) The proportions of CD4+CXCR5+ T cells that fall into naive (CD4+CD45RA+CD62L+), central memory (CD4+CD45RA–CD62L+), and effector memory (CD4+CD45RA–CD62L–) subsets in patients with T1D (n = 24) and healthy controls (n = 15). Central horizontal bars depict the mean and are spanned by bars showing the SEM. (C) Frequencies of CXCR5+ cells within naive, central memory, and effector memory CD4 T cell subsets in patients with T1D (n = 24) and healthy controls (n = 15). (D) A subset of the above individuals was examined for coexpression of CXCR5 and ICOS. Graph shows the percentage of CXCR5+ICOS+ cells within CD3+CD4+ T cells of patients with T1D (n = 11) and healthy controls (n = 9). Box and whisker plots show the median, interquartile range, and 10th to 90th percentile.
Increased IL-21 production in T1D.
No differences in the levels of cytokine expression between patients and controls could be discerned by intracellular staining of isolated cells directly ex vivo (data not shown). However, following a brief period of in vitro activation, T cells from patients with T1D showed a significantly increased propensity to express IL-21 (Figure 7A). Since the IL-21+ cells in the mouse model of diabetes coexpressed IFN-γ and TNF-α, we also tested for polyfunctionality in the T cells from patients with T1D. Significantly increased numbers of IL-21+TNF-α+ and IL-21+TNF-α+IFN-γ+ cells were noted in the T1D samples compared with control samples (Figure 7B). Single TNF-α producers, but not single IFN-γ producers, were also increased in the patients compared with controls (Figure 7B). The IL-21–producing population in patients with T1D largely comprised cells coproducing TNF-α or coproducing both TNF-α and IFN-γ (Figure 7C).
Figure 7. IL-21–producing CD4+ T cells are elevated in patients with T1D and correlate strongly with the proportion of CXCR5+ cells.

(A) Frequencies of CD4 T cells producing the indicated cytokines following 14-hour anti-CD3 stimulation of cells from patients with T1D (n = 22) and healthy controls (n = 13). Box and whisker plots show the median, interquartile range, and 10th to 90th percentile. (B) Frequencies of cells producing a defined combination of cytokines (as shown) within the stimulated CD4+ T cell population in patients with T1D (n = 22) and healthy controls (n = 13). *P ≤ 0.05, **P ≤ 0.01, ***P ≤ 0.001. Bars show the mean, and error bars show the SEM. (C) Distribution of cytokine production within the CD4+ IL-21–producing population showing that the majority of IL-21 producers coexpress TNF-α and/or IFN-γ. Data show values averaged from 22 individuals. Unlabeled segments comprise <1.5%. (D) Correlation between the frequency of IL-21+ CD4+ T cells following anti-CD3 stimulation as in A and fresh ex vivo CXCR5 expression in patients with T1D (n = 13). (E) Populations of naive (CD4+CD45RA+CXCR5–), memory CXCR5– (CD4+CD45RA–CXCR5–), and memory CXCR5+ (CD4+CD45RA–CXCR5+) cells were sorted by FACS from healthy controls and stimulated for 16 hours with anti-CD3/anti-CD28 beads. The proportion of cells expressing the cytokines IL-21, IL-4, IFN-γ, and IL-17 was then assessed. Bars show the mean, and error bars show the SEM.
Mouse studies have suggested that IL-21 derives predominantly from cells bearing a Tfh cell phenotype, although the relationship is a complex one, with indications that only a fixed proportion of CXCR5+ cells can produce IL-21 at any one time (30). Strikingly, correlation of ex vivo CXCR5 staining and stimulated IL-21 production showed that individuals with higher proportions of CXCR5+ cells also produced the highest level of IL-21 upon activation (Figure 7D). Furthermore, sorting CXCR5+ cells prior to stimulation revealed that IL-21 derived predominantly from CXCR5+ memory cells, while, in contrast, IFN-γ, IL-4, and IL-17 derived mainly from CXCR5– memory cells (Figure 7E).
IL-2 signaling antagonizes CXCR5 upregulation.
The above data indicate that Tfh cell signature genes were upregulated at the mRNA level in T cells from patients with T1D and elevations in CXCR5, ICOS, and IL-21 could be confirmed at the protein level. Experiments using murine T cells have shown that IL-2 can inhibit Tfh cell differentiation. Accordingly, signals through the IL-2R can dictate the balance between Tfh and T-effector differentiation (31, 32) via STAT5-dependent skewing of the BCL6/BLIMP1 ratio (33), and endogenous provision of IL-2 directly inhibits Tfh cell differentiation in response to influenza virus (34).
Intriguingly, substantial evidence links genetic alterations in the IL-2 pathway with T1D (35–38), and the functional response of T cells to IL-2 has been reported to be defective in T1D (39). This may reflect higher expression of PTPN2 (39), a phosphatase that inhibits JAK/STAT signaling and which is genetically associated with T1D, or polymorphisms at the IL2RA locus (40), although it is likely that additional mechanistic explanations remain undiscovered. It is therefore possible that suboptimal IL-2 signaling might favor Tfh cell differentiation in the setting of T1D. To explore this idea, we used T cells from patients with T1D to examine the relationship between IL-2 sensitivity and the propensity of T cells to upregulate CXCR5 in vitro. IL-12 was used, since it has been shown to be a strong inducer of CXCR5 and the Tfh cell phenotype in vitro (ref. 41 and Figure 8A). Consistent with data obtained in mice (33, 34), we found that IL-2 had an inhibitory influence on CXCR5 expression in human T cells (Figure 8B). This could reflect a skewing from a Tfh cell phenotype to other effector phenotypes, as documented in mice, although other explanations (such as differential survival effects) are also possible. By testing IL-2 sensitivity using a STAT5 assay, we demonstrated that there was an inverse correlation between sensitivity to IL-2 signaling and propensity to upregulate CXCR5 (Figure 8C and Supplemental Figure 6). Given the multiple defects in the IL-2 pathway documented in T1D, this provides a putative mechanism for augmented Tfh cell differentiation in this disease setting.
Figure 8. Patients who respond poorly to IL-2 show an increased propensity to upregulate CXCR5.

(A) Sorted CD4+CD45RA+ naive T cells from patients with T1D were cultured for 5 days with anti-CD3/anti-CD28 beads in the presence or absence of IL-12. Plots show representative CXCR5 staining. The percentage of gated CXCR5+ cells is shown on the graph. (B) Graphs show CXCR5 MFI of 5 independent experiments in which naive T cells were cultured for 5 days as above with IL-12 and or IL-2 (n = 15). Box and whisker plots show the median, interquartile range, and 10th to 90th percentile. *P ≤ 0.05, ***P ≤ 0.001, ****P ≤ 0.0001. U, untreated. (C) Relationship between CXCR5 induction and sensitivity of T cells to IL-2. CD4+ T cells from patients with T1D were treated with 100 U IL-2 for 10 minutes and then fixed and stained for phosphorylated STAT5 (pSTAT5). The percentage of pSTAT5+ is plotted against the proportion of CXCR5+ cells induced by culture in the presence of IL-12 (as in A and B) (n = 13).
Discussion
The perception of T cell differentiation as a Th1/Th2 dichotomy, with Th1 cells responsible for tissue-specific autoimmunity, has led numerous researchers to hunt for a Th1 signature in T1D, with widely variable results. Data from our mouse model of diabetes prompted us to seek evidence of a Tfh gene signature instead. This resulted in the identification of elevated expression of archetypal Tfh molecules, including CXCR5, IL-21, PD-1, ICOS, and BCL6 in memory T cells from patients with T1D. The significance of this finding warrants careful consideration. At face value, our ability to detect the Tfh cell differentiation program in diabetes is entirely consistent with the association of autoantibodies with this disease: such antibodies could not be generated without the specialized help provided by Tfh cells. In addition, persistent antigen has been suggested to favor the Tfh cell response (42, 43), a concept that fits well with ongoing antigenic availability in chronic autoimmunity. It should be noted that the average disease duration in our cohort was 19 years, emphasizing the chronicity of the response and also highlighting the potential for other factors, such as exposure to injected insulin or diabetes-related infections, to modify the T cell phenotype. Data from animal models support the notion that Tfh cells play a causal role in autoimmune diabetes: increased Tfh cell differentiation, as a consequence of roquin mutation, dramatically accelerated diabetes induction (44), and transfer of T cells with a Tfh cell phenotype preferentially induced diabetes in recipient mice (Figure 4A). There may also be additional intriguing reasons for a Tfh gene signature to manifest. The observation that early Th1 differentiation can involve the IL-12– and STAT4-dependent induction of Tfh-like cells has highlighted an extraordinary phenotypic overlap between Tfh and Th1 cells (45). Moreover, Th1 cells exposed to an environment in which IL-2 is limiting have been shown to adopt a Tfh cell phenotype (46). Thus, a Tfh cell signature could also plausibly derive from newly differentiating Th1 cells or mature Th1 cells that find themselves deprived of IL-2.
The predictive value of serum autoantibodies as biomarkers for diabetes progression is well recognized (47, 48); however, robust T cell biomarkers are currently lacking. The increase in circulating CXCR5+ T cells in patients with T1D presents a novel candidate in this regard. The relationship between blood-borne CXCR5+ cells and bona fide Tfh cells has been the subject of intense debate (28). It is now clear that Tfh cells can enter the circulating memory pool (25, 30, 49–51) yet downregulate many characteristic markers at this stage (52) only to reacquire them upon subsequent reencounter with antigen (53). Interestingly, although much of the Tfh cell signature is lost upon transition to memory status, intermediate levels of CXCR5 itself are maintained (43), potentially explaining the observed elevation in CXCR5+ cells in patients with T1D. Recent 2-photon analysis has provided visual proof that germinal center–resident T cells can leave the germinal center to enter the circulation (54), and the appearance of circulating Tfh-like cells in settings of SLAM-associated protein (SAP) deficiency suggests that pre-Tfh cells can also contribute to the circulating pool (55).
A striking parallel between the murine and human data generated in our study is that IL-21 production in both settings is associated with marked coexpression of IFN-γ and TNF-α. Thus, while IFN-γ is clearly present, our data suggest it may derive from Tfh cells rather than classic Th1 cells. Tfh cells are known to be capable of coexpressing IL-21, IFN-γ, and TNF-α (56), and IFN-γ+ Tfh cells have been imaged within germinal structures in vivo (57). Indeed, IFN-γ itself can promote Tfh cell differentiation (58), suggesting a feedback mechanism that could further amplify the response. Since Tfh cells can also produce IL-4 (59, 60), and the IL-21 they elicit can promote IL-17 production (15, 16), this could explain why T1D has previously been classified as a Th1, Th2, or Th17 phenomenon (1–3, 5, 8, 10, 11).
IL-12 is thought to be the major driver of Tfh cell differentiation (41, 61); however, recent evidence suggests that IFN-α, a cytokine strongly linked with diabetes (62, 63), can also promote adoption of this fate (64). The ability of IL-2 to inhibit Tfh cell differentiation (31–34), combined with the known defects in the IL-2 pathway in T1D (35–40), provides a putative mechanistic link to increased Tfh cell differentiation in this disease setting. However, the identification of an augmented Tfh cell response in T1D also provides impetus for analysis of other regulators of this pathway. In this regard, the microRNA cluster 17–92 presents an attractive candidate, given its ability to modulate Tfh cell differentiation (65, 66). Tfh cell numbers also have been reported to be subject to control by Qa-1–restricted CD8 T cells (67), and CD8 cells specific for the human equivalent of Qa-1 (HLA-E) have been reported to be functionally defective in T1D (68). More recently, the identification of Tregs expressing CXCR5 (69–71) has reinforced the notion that specialized regulatory mechanisms operate to curb Tfh cell differentiation, highlighting an additional checkpoint that might potentially be dysregulated in T1D.
Frequently, the traits that confer increased susceptibility to autoimmune disease afford an advantage in infectious settings. In this regard, Tfh cell numbers have recently been shown to correlate with protective antiviral immunity (72–74), while loss-of-function mutations in the IL-21 receptor result in immunodeficiency (75). The data presented herein add to a growing body of data linking Tfh cell differentiation with autoimmunity (71, 76, 77). Thus, polymorphisms that augment Tfh development might enhance protective immunity yet confer an increased risk of autoimmunity.
Methods
Mice.
DO11.10 TCR transgenic mice were obtained from The Jackson Laboratory. BALB/c RIP-mOVA mice (expressing the ovalbumin transgene under control of the rat insulin promoter, from line 296-1B) were a gift from W. Heath (The Walter and Eliza Hall Institute, Parkville, Melbourne, Australia). DO11.10 mice were crossed with RIP-mOVA mice to generate DO11 RIP-mOVA mice. Mice were housed in individually vented cages at the University of Birmingham Biomedical Services Unit or within the Comparative Biology Unit at the University College London.
Patients with T1D.
Peripheral venous blood was obtained from patients attending the clinical T1D service at the University Hospital Birmingham National Health Service Foundation Trust, United Kingdom. A total of 102 patients (mean age, 37 years; mean duration of T1D, 19 years; 60 men and 42 women) were recruited to this study, although not all assays were performed on every patient (see Supplemental Figure 7). Patients were selected on the basis of a clinical diagnosis of T1D according to the 1997 American Diabetes Association guidelines and the absence of unrelated disease. The control group consisted of 60 individuals (mean age, 29 years; 36 men and 24 women) with no known autoimmune disorders or family history of T1D. In assays in which samples from patients with T1D and healthy controls were directly compared, individuals were matched as closely as possible for age and sex. Where indicated HLA typing was performed using sequence-specific primers as previously described (78). For autoantibody assays, thresholds were set as previously published (79, 80) (GADA = 33 DK units/ml; IA-2A = 1.4 DK units/ml; ZnT8RA and ZnT8WA = 1.8 arbitrary units). Blood was processed no later than 3 hours after draw.
Microarray.
Antigen-specific (KJ-126+) CD4+CD25– cells (conventional T cells) or CD4+CD25+ cells (Tregs) were sorted from pooled PanLNs or inguinal LNs from 6-week-old DO11 RIP-mOVA mice by FACS (MoFlo, Dakocytomation). Antibodies used for the sort stain were CD4 (LT34; Ebioscience), KJ-126 (Caltag Laboratories), CD25 (PC61; BD Biosciences), and CD69 (H1.2F3; BD Biosciences). Cells were sorted on CD69 as a marker of activation, since it has been shown that T cells responding to pancreas-derived self antigen upregulate CD69 (20). Antigen-specific T cells were gated on CD69+ in the PanLNs (antigen-specific T cells in the inguinal LNs were CD69–). To obtain sufficient cells of each type, cells from 14 mice were pooled to generate each sample. Mice were randomly assigned into groups. Three to six replicates were collected per experimental group (each replicate deriving from 14 mice). Sort purities were 97.3%–99.7%. Sorted cells were snap frozen immediately in liquid nitrogen, and RNA was subsequently extracted using the RNeasy Micro Kit (Qiagen). Microarray analysis was performed using the GeneChip Mouse Genome 430A 2.0 Array, and data were acquired using the Affymetrix Model 450 Fluidics Station and Affymetrix Model 3000 scanner. Affymetrix GeneChip data were normalized using the robust multichip averaging (RMA) algorithm of the Bioconductor package, affy. Quality control was done by the Bioconductor package, affyQCReport. CCA was performed as previously described (26). Briefly, logged expression values of the diabetes T cell data set were analyzed by CCAM using fold change of Tfh and naive Tfh data set (Gene Expression Omnibus [GEO] accession no. GSE40068) (25) as an explanatory variable. For the Tfh-ness analysis, genes were filtered by the GSE40068 data only, using the false discovery rate of a moderated t-statistics of the Bioconductor package limma. The heat map was generated by heat map.2 of the CRAN package gplots. Principal component analysis (PCA) was performed using dudi.pca of the CRAN package ade4. Data have been deposited with the GEO accession number GSE62104.
Flow cytometry and histology.
Mouse cells were stained with mAbs against FOXP3 (FJK-16s), CD4 (LT34), CD3 (17A2), CXCR5 (2G8; BD Biosciences), PD-1 (J43), IL-21 (mhalx21), IL-17 (TC11-18H10; BD Biosciences), TNF-α (MP6-XT22), and IFN-γ (XMG1.2). All antibodies were purchased from eBioscience unless otherwise indicated. For quantitation of Tfh cells, Tregs were gated out using CD25 staining. For intracellular cytokine staining, cells were stimulated for 5 hours with phorbol myristate acetate and ionomycin in the presence of brefeldin A (Sigma-Aldrich) for the final 4 hours. For cytokine and FOXP3 staining, cells were fixed and permeabilized according to the manufacturer’s instructions (eBioscience). Human cells were stained with CD4 (SK3), CD3 (UCHT1; Life Technologies), CXCR5 (RF8B2; BD Pharmingen), CCR7 (G043H7; Biolegend), CD45RA (HI100), CD62L (DREG-56), CCR6 (R6H1), CXCR3 (1C6/CXCR3; BD Biosciences), ICOS (ISA-3) biotin (streptavidin APC) and PE-Cy7, IL-21 (eBio3a3-N2), TNF-α (MAb11), IFN-γ (B27; BD Biosciences), IL-4 (8D4-8), IL-17 (CZ8-23G1; Miltenyi Biotec), and pSTAT5 (47/STAT5/pY694; BD Biosciences). All antibodies were purchased from eBioscience unless otherwise indicated. For cytokine staining, cells were stimulated for 4 hours with phorbol myristate acetate and ionomycin in the presence of brefeldin A for the final 2 hours. Cells were then fixed and permeabilized according to the manufacturer’s instructions (eBioscience). For the pSTAT5 assay, stimulation was performed using 100 U recombinant human IL-2 (Peprotech) for 10 minutes. Fixation and staining were performed per the manufacturers instructions (BD Phospho Fix/Perm Buffer III). All data were acquired using a Dako CyAn (DakoCytomation) or Fortessa (BD) flow cytometer and analyzed using FlowJo software.
Adoptive transfer.
Adoptive transfer experiments were carried out as previously reported (81). RIP-mOVA Cd28–/– mice were injected with equivalent numbers of CXCR5-depleted or CXCR5-enriched CD4+DO11+ T cells sorted by FACS (MoFlo, Dakocytomation) from the pooled PanLNs of DO11 RIP-mOVA mice. Blood glucose was monitored by Glucometer Ascensia Elite XL (Bayer). Blood glucose readings above 250 mg/dl are typically considered diabetic. All injections were carried out in the absence of anesthesia and analgesia, and mice were returned immediately to home cages following the procedure. The welfare of experimental animals was monitored daily. No unexpected adverse events were noted during the course of these experiments.
Immunofluorescence staining and confocal microscopy.
PanLNs and inguinal LNs from DO11 RIP-mOVA and DO11 mice were embedded in O.C.T. compound (Tissue-Tek 4583) and frozen in liquid nitrogen vapor. Five- to seven-μm tissue sections were prepared, acetone fixed, and stored at –20°C. Prior to staining, slides were rehydrated in PBS and subjected to biotin blocking and preincubation with 10% goat serum (Sigma-Aldrich). Sections were incubated with goat anti–IgM-555 (Jackson), Ki67-FITC (BD 556026) detected with rabbit anti-FITC (DakoCytomation V0403) and then donkey anti-rabbit 488 (Invitrogen A21206), and hamster anti-CD3 (BD 553058) detected with goat anti-hamster Cy5 (Stratech Scientific). Images were captured by confocal microscopy (Zeiss LSM 510 Meta).
Realtime PCR.
PBMCs were isolated from the venous blood of patients with T1D or healthy controls blood by density centrifugation. CD4+CD45RA– T cells were selected by magnetic negative selection (EasySep Human Memory CD4+ T cell Enrichment Kit, Stemcell) and stored in RNAlater (Qiagen). RNA extraction was performed using the RNeasy Mini Kit (Qiagen). RNA was reverse transcribed and interrogated using TaqMan probes for BCL6, CXCR5, ICOS, IL21, PDCD1, FOXP3, GATA3, IL2, IL4, IL10, IL17A, TBX21, and IFNG. qPCR was carried out using the Stratagene Mx3000P. Gene expression was normalized to GAPDH using the 2–ΔCt calculation.
In vitro T cell differentiation.
PBMCs were isolated from venous blood by density centrifugation, and naive CD4 T cells were purified by negative magnetic separation (EasySep Human Naive CD4+ T cell Enrichment Kit, Stem Cell Technologies). Cells were plated at a density of 100,000 per well in a 96-well round bottom plate and stimulated with anti-CD3/28 beads (Human T-Activator Dynabeads, Life Technologies) for 5 days. Where indicated, cultures were treated with 10 ng/ml IL-12 and/or 20 ng/ml IL-2 (both from Peprotech).
Statistics.
Data were analyzed using Prism statistical software. Statistical significance was assessed using the Mann-Whitney test. Paired data were analyzed using a 2-tailed paired Student’s t test. A P value of less than 0.05 was considered significant.
Study approval.
Murine experiments were performed in accordance with the relevant Home Office project and personal licences following institutional ethical approval (from the University of Birmingham and University College London). Informed consent was obtained from all participants, and the study was approved by the National Research Ethics Committee.
Supplementary Material
Acknowledgments
We are grateful to Jane Buckner and Alice Long for sharing the phospho-STAT5 protocol, to Kathleen Gillespie for help with the HLA typing and autoantibody measurement, and to Abul Abbas and Linda Wicker for commenting on the manuscript. This work was funded by an MRC Senior Fellowship (to L.S.K. Walker), a project grant from JDRF (to L.S.K. Walker and P. Narendran), and a studentship from Diabetes UK (to L.S.K. Walker and P. Narendran). L. Wardzinski and A. Kogimtzis were supported by a Wellcome Trust project grant (to L.S.K. Walker). M. Ono is a BBSRC David Philips fellow.
Footnotes
Conflict of interest: The authors have declared that no conflict of interest exists.
Reference information:J Clin Invest. 2015;125(1):292–303. doi:10.1172/JCI76238.
References
- 1.Katz JD, Benoist C, Mathis D. T helper cell subsets in insulin-dependent diabetes. Science. 1995;268(5214):1185–1188. doi: 10.1126/science.7761837. [DOI] [PubMed] [Google Scholar]
- 2.Rabinovitch A, Suarez-Pinzon WL, Sorensen O, Bleackley RC, Power RF. IFN-gamma gene expression in pancreatic islet-infiltrating mononuclear cells correlates with autoimmune diabetes in nonobese diabetic mice. J Immunol. 1995;154(9):4874–4882. [PubMed] [Google Scholar]
- 3.Anderson JT, Cornelius JG, Jarpe AJ, Winter WE, Peck AB. Insulin-dependent diabetes in the NOD mouse model. II. Beta cell destruction in autoimmune diabetes is a TH2 and not a TH1 mediated event. Autoimmunity. 1993;15(2):113–122. doi: 10.3109/08916939309043886. [DOI] [PubMed] [Google Scholar]
- 4.Han D, et al. Immune profiling by multiple gene expression analysis in patients at-risk and with type 1 diabetes. Clin Immunol. 2011;139(3):290–301. doi: 10.1016/j.clim.2011.02.016. [DOI] [PMC free article] [PubMed] [Google Scholar]
- 5.Kallmann BA, et al. Systemic bias of cytokine production toward cell-mediated immune regulation in IDDM and toward humoral immunity in Graves’ disease. Diabetes. 1997;46(2):237–243. doi: 10.2337/diab.46.2.237. [DOI] [PubMed] [Google Scholar]
- 6.Mayer A, Rharbaoui F, Thivolet C, Orgiazzi J, Madec AM. The relationship between peripheral T-cell reactivity to insulin, clinical remissions and cytokine production in type 1 (insulin-dependent) diabetes mellitus. J Clin Endocrinol Metab. 1999;84(7):2419–2424. doi: 10.1210/jcem.84.7.5828. [DOI] [PubMed] [Google Scholar]
- 7.Halminen M, Simell O, Knip M, Ilonen J. Cytokine expression in unstimulated PBMC of children with type 1 diabetes and subjects positive for diabetes-associated autoantibodies. Scand J Immunol. 2001;53(5):510–513. doi: 10.1046/j.1365-3083.2001.00904.x. [DOI] [PubMed] [Google Scholar]
- 8.Durinovic-Bello I, et al. Pro- and anti-inflammatory cytokine production by autoimmune T-cells against preproinsulin in HLA-DRB1*04, DQ8 type 1 diabetes. Diabetologia. 2004;47(3):439–450. doi: 10.1007/s00125-003-1315-1. [DOI] [PubMed] [Google Scholar]
- 9.Steinman L. A brief history of T(H)17, the first major revision in the T(H)1/T(H)2 hypothesis of T-cell-mediated tissue damage. Nat Med. 2007;13(2):139–145. doi: 10.1038/nm1551. [DOI] [PubMed] [Google Scholar]
- 10.Ferraro A, et al. Expansion of Th17 cells and functional defects in T regulatory cells are key features of the pancreatic lymph nodes in patients with type 1 diabetes. Diabetes. 2011;60(11):2903–2913. doi: 10.2337/db11-0090. [DOI] [PMC free article] [PubMed] [Google Scholar]
- 11.Arif S, et al. Peripheral and islet interleukin-17 pathway activation characterizes human autoimmune diabetes and promotes cytokine-mediated beta-cell death. Diabetes. 2011;60(8):2112–2119. doi: 10.2337/db10-1643. [DOI] [PMC free article] [PubMed] [Google Scholar]
- 12.Joseph J, Bittner S, Kaiser FM, Wiendl H, Kissler S. IL-17 silencing does not protect nonobese diabetic mice from autoimmune diabetes. J Immunol. 2012;188(1):216–221. doi: 10.4049/jimmunol.1101215. [DOI] [PubMed] [Google Scholar]
- 13.Kriegel MA, Sefik E, Hill JA, Wu HJ, Benoist C, Mathis D. Naturally transmitted segmented filamentous bacteria segregate with diabetes protection in nonobese diabetic mice. Proc Natl Acad Sci U S A. 2011;108(28):11548–11553. doi: 10.1073/pnas.1108924108. [DOI] [PMC free article] [PubMed] [Google Scholar]
- 14.Lau K, et al. Inhibition of type 1 diabetes correlated to a Lactobacillus johnsonii N6.2-mediated Th17 bias. J Immunol. 2011;186(6):3538–3546. doi: 10.4049/jimmunol.1001864. [DOI] [PubMed] [Google Scholar]
- 15.Korn T, et al. IL-21 initiates an alternative pathway to induce proinflammatory T(H)17 cells. Nature. 2007;448(7152):484–487. doi: 10.1038/nature05970. [DOI] [PMC free article] [PubMed] [Google Scholar]
- 16.Yang L, et al. IL-21 and TGF-β are required for differentiation of human T(H)17 cells. Nature. 2008;454(7202):350–352. doi: 10.1038/nature07021. [DOI] [PMC free article] [PubMed] [Google Scholar]
- 17.Spolski R, Kashyap M, Robinson C, Yu Z, Leonard WJ. IL-21 signaling is critical for the development of type I diabetes in the NOD mouse. Proc Natl Acad Sci U S A. 2008;105(37):14028–14033. doi: 10.1073/pnas.0804358105. [DOI] [PMC free article] [PubMed] [Google Scholar]
- 18.Sutherland AP, et al. Interleukin-21 is required for the development of type 1 diabetes in NOD mice. Diabetes. 2009;58(5):1144–1155. doi: 10.2337/db08-0882. [DOI] [PMC free article] [PubMed] [Google Scholar]
- 19.Clough LE, et al. Release from regulatory T-cell-mediated suppression during the onset of tissue-specific autoimmunity is associated with elevated IL-21. J Immunol. 2008;180(8):5393–5401. doi: 10.4049/jimmunol.180.8.5393. [DOI] [PubMed] [Google Scholar]
- 20.Hoglund P, Mintern J, Waltzinger C, Heath W, Benoist C, Mathis D. Initiation of autoimmune diabetes by developmentally regulated presentation of islet-cell antigens in the pancreatic lymph nodes. J Exp Med. 1999;189(2):331–339. doi: 10.1084/jem.189.2.331. [DOI] [PMC free article] [PubMed] [Google Scholar]
- 21.Chtanova T, et al. T follicular helper cells express a distinctive transcriptional profile, reflecting their role as non-Th1/Th2 effector cells that provide help for B cells. J Immunol. 2004;173(1):68–78. doi: 10.4049/jimmunol.173.1.68. [DOI] [PubMed] [Google Scholar]
- 22.Vinuesa CG, et al. A RING-type ubiquitin ligase family member required to repress follicular helper T-cells and autoimmunity. Nature. 2005;435(7041):452–458. doi: 10.1038/nature03555. [DOI] [PubMed] [Google Scholar]
- 23.Nurieva RI, et al. Bcl6 mediates the development of T follicular helper cells. Science. 2009;325(5943):1001–1005. doi: 10.1126/science.1176676. [DOI] [PMC free article] [PubMed] [Google Scholar]
- 24.Yu D, et al. The transcriptional repressor Bcl-6 directs T follicular helper cell lineage commitment. Immunity. 2009;31(3):457–468. doi: 10.1016/j.immuni.2009.07.002. [DOI] [PubMed] [Google Scholar]
- 25.Liu X, et al. Bcl6 expression specifies the T follicular helper cell program in vivo. J Exp Med. 2012;209(10):1841–1852. doi: 10.1084/jem.20120219. [DOI] [PMC free article] [PubMed] [Google Scholar]
- 26.Ono M, Tanaka RJ, Kano M, Sugiman T. Visualising the cross-level relationships between pathological and physiological processes and gene expression: analyses of haematological diseases. PLoS One. 2013;8(1):e53544. doi: 10.1371/journal.pone.0053544. [DOI] [PMC free article] [PubMed] [Google Scholar]
- 27.McGuire HM, et al. A subset of interleukin-21+ chemokine receptor CCR9+ T helper cells target accessory organs of the digestive system in autoimmunity. Immunity. 2011;34(4):602–615. doi: 10.1016/j.immuni.2011.01.021. [DOI] [PubMed] [Google Scholar]
- 28.Morita R, et al. Human blood CXCR5(+)CD4(+) T-cells are counterparts of T follicular cells and contain specific subsets that differentially support antibody secretion. Immunity. 2011;34(1):108–121. doi: 10.1016/j.immuni.2010.12.012. [DOI] [PMC free article] [PubMed] [Google Scholar]
- 29.Xu X, et al. Inhibition of increased circulating Tfh cell by anti-CD20 monoclonal antibody in patients with type 1 diabetes. PLoS One. 2013;8(11):e79858. doi: 10.1371/journal.pone.0079858. [DOI] [PMC free article] [PubMed] [Google Scholar]
- 30.Luthje K, et al. The development and fate of follicular helper T-cells defined by an IL-21 reporter mouse. Nat Immunol. 2012;13(5):491–498. doi: 10.1038/ni.2261. [DOI] [PubMed] [Google Scholar]
- 31.Choi YS, et al. ICOS receptor instructs T follicular helper cell versus effector cell differentiation via induction of the transcriptional repressor Bcl6. Immunity. 2011;34(6):932–946. doi: 10.1016/j.immuni.2011.03.023. [DOI] [PMC free article] [PubMed] [Google Scholar]
- 32.Pepper M, Pagan AJ, Igyarto BZ, Taylor JJ, Jenkins MK. Opposing signals from the Bcl6 transcription factor and the interleukin-2 receptor generate T helper 1 central and effector memory cells. Immunity. 2011;35(4):583–595. doi: 10.1016/j.immuni.2011.09.009. [DOI] [PMC free article] [PubMed] [Google Scholar]
- 33.Johnston RJ, Choi YS, Diamond JA, Yang JA, Crotty S. STAT5 is a potent negative regulator of TFH cell differentiation. J Exp Med. 2012;209(2):243–250. doi: 10.1084/jem.20111174. [DOI] [PMC free article] [PubMed] [Google Scholar]
- 34.Ballesteros-Tato A, et al. Interleukin-2 inhibits germinal center formation by limiting T follicular helper cell differentiation. Immunity. 2012;36(5):847–856. doi: 10.1016/j.immuni.2012.02.012. [DOI] [PMC free article] [PubMed] [Google Scholar]
- 35.Lowe CE, et al. Large-scale genetic fine mapping and genotype-phenotype associations implicate polymorphism in the IL2RA region in type 1 diabetes. Nat Genet. 2007;39(9):1074–1082. doi: 10.1038/ng2102. [DOI] [PubMed] [Google Scholar]
- 36.Wellcome Trust Case Control Consortium. Genome-wide association study of 14,000 cases of seven common diseases and 3,000 shared controls. Nature. 2007;447(7145):661–678. doi: 10.1038/nature05911. [DOI] [PMC free article] [PubMed] [Google Scholar]
- 37.Todd JA, et al. Robust associations of four new chromosome regions from genome-wide analyses of type 1 diabetes. Nat Genet. 2007;39(7):857–864. doi: 10.1038/ng2068. [DOI] [PMC free article] [PubMed] [Google Scholar]
- 38.Dendrou CA, et al. Cell-specific protein phenotypes for the autoimmune locus IL2RA using a genotype-selectable human bioresource. Nat Genet. 2009;41(9):1011–1015. doi: 10.1038/ng.434. [DOI] [PMC free article] [PubMed] [Google Scholar]
- 39.Long SA, et al. Defects in IL-2R signaling contribute to diminished maintenance of FOXP3 expression in CD4(+)CD25(+) regulatory T-cells of type 1 diabetic subjects. Diabetes. 2010;59(2):407–415. doi: 10.2337/db09-0694. [DOI] [PMC free article] [PubMed] [Google Scholar]
- 40.Garg G, et al. Type 1 diabetes-associated IL2RA variation lowers IL-2 signaling and contributes to diminished CD4+CD25+ regulatory T-cell function. J Immunol. 2012;188(9):4644–4653. doi: 10.4049/jimmunol.1100272. [DOI] [PMC free article] [PubMed] [Google Scholar]
- 41.Ma CS, et al. Early commitment of naive human CD4(+) T-cells to the T follicular helper (T(FH)) cell lineage is induced by IL-12. Immunol Cell Biol. 2009;87(8):590–600. doi: 10.1038/icb.2009.64. [DOI] [PubMed] [Google Scholar]
- 42.Fahey LM, Wilson EB, Elsaesser H, Fistonich CD, McGavern DB, Brooks DG. Viral persistence redirects CD4 T-cell differentiation toward T follicular helper cells. J Exp Med. 2011;208(5):987–999. doi: 10.1084/jem.20101773. [DOI] [PMC free article] [PubMed] [Google Scholar]
- 43.Baumjohann D, et al. Persistent antigen and germinal center B cells sustain T follicular helper cell responses and phenotype. Immunity. 2013;38(3):596–605. doi: 10.1016/j.immuni.2012.11.020. [DOI] [PubMed] [Google Scholar]
- 44.Silva DG, et al. Anti-islet autoantibodies trigger autoimmune diabetes in the presence of an increased frequency of islet-reactive CD4 T-cells. Diabetes. 2011;60(8):2102–2111. doi: 10.2337/db10-1344. [DOI] [PMC free article] [PubMed] [Google Scholar]
- 45.Nakayamada S, et al. Early Th1 cell differentiation is marked by a Tfh cell-like transition. Immunity. 2011;35(6):919–931. doi: 10.1016/j.immuni.2011.11.012. [DOI] [PMC free article] [PubMed] [Google Scholar]
- 46.Oestreich KJ, Mohn SE, Weinmann AS. Molecular mechanisms that control the expression and activity of Bcl-6 in TH1 cells to regulate flexibility with a TFH-like gene profile. Nat Immunol. 2012;13(4):405–411. doi: 10.1038/ni.2242. [DOI] [PMC free article] [PubMed] [Google Scholar]
- 47.Yu L, et al. Early expression of antiinsulin autoantibodies of humans and the NOD mouse: evidence for early determination of subsequent diabetes. Proc Natl Acad Sci U S A. 2000;97(4):1701–1706. doi: 10.1073/pnas.040556697. [DOI] [PMC free article] [PubMed] [Google Scholar]
- 48.Notkins AL, Lernmark A. Autoimmune type 1 diabetes: resolved and unresolved issues. J Clin Invest. 2001;108(9):1247–1252. doi: 10.1172/JCI14257. [DOI] [PMC free article] [PubMed] [Google Scholar]
- 49.Weber JP, Fuhrmann F, Hutloff A. T-follicular helper cells survive as long-term memory cells. Eur J Immunol. 2012;42(8):1981–1988. doi: 10.1002/eji.201242540. [DOI] [PubMed] [Google Scholar]
- 50.Choi YS, et al. Bcl6 expressing follicular helper CD4 T-cells are fate committed early and have the capacity to form memory. J Immunol. 2013;190(8):4014–4026. doi: 10.4049/jimmunol.1202963. [DOI] [PMC free article] [PubMed] [Google Scholar]
- 51.Barr T, Gray D. T(FH) memory: more or less T(FH)? Eur J Immunol. 2012;42(8):1977–1980. doi: 10.1002/eji.201242755. [DOI] [PubMed] [Google Scholar]
- 52.Choi YS, Yang JA, Crotty S. Dynamic regulation of Bcl6 in follicular helper CD4 T (Tfh) cells. Curr Opin Immunol. 2013;25(3):366–372. doi: 10.1016/j.coi.2013.04.003. [DOI] [PMC free article] [PubMed] [Google Scholar]
- 53.Hale JS, et al. Distinct memory CD4+ T-cells with commitment to T follicular helper- and T helper 1-cell lineages are generated after acute viral infection. Immunity. 2013;38(4):805–817. doi: 10.1016/j.immuni.2013.02.020. [DOI] [PMC free article] [PubMed] [Google Scholar]
- 54.Shulman Z, et al. T follicular helper cell dynamics in germinal centers. Science. 2013;341(6146):673–677. doi: 10.1126/science.1241680. [DOI] [PMC free article] [PubMed] [Google Scholar]
- 55.He J, et al. Circulating precursor CCR7(lo)PD-1(hi) CXCR5(+) CD4(+) T-cells indicate Tfh cell activity and promote antibody responses upon antigen reexposure. Immunity. 2013;39(4):770–781. doi: 10.1016/j.immuni.2013.09.007. [DOI] [PubMed] [Google Scholar]
- 56.Perreau M, et al. Follicular helper T-cells serve as the major CD4 T-cell compartment for HIV-1 infection, replication, and production. J Exp Med. 2013;210(1):143–156. doi: 10.1084/jem.20121932. [DOI] [PMC free article] [PubMed] [Google Scholar]
- 57.Reinhardt RL, Liang HE, Locksley RM. Cytokine-secreting follicular T-cells shape the antibody repertoire. Nat Immunol. 2009;10(4):385–393. doi: 10.1038/ni.1715. [DOI] [PMC free article] [PubMed] [Google Scholar]
- 58.Lee SK, et al. Interferon-gamma excess leads to pathogenic accumulation of follicular helper T-cells and germinal centers. Immunity. 2012;37(5):880–892. doi: 10.1016/j.immuni.2012.10.010. [DOI] [PubMed] [Google Scholar]
- 59.Vijayanand P, et al. Interleukin-4 production by follicular helper T-cells requires the conserved Il4 enhancer hypersensitivity site V. Immunity. 2012;36(2):175–187. doi: 10.1016/j.immuni.2011.12.014. [DOI] [PMC free article] [PubMed] [Google Scholar]
- 60.Harada Y, et al. The 3′ enhancer CNS2 is a critical regulator of interleukin-4-mediated humoral immunity in follicular helper T-cells. Immunity. 2012;36(2):188–200. doi: 10.1016/j.immuni.2012.02.002. [DOI] [PubMed] [Google Scholar]
- 61.Schmitt N, et al. Human dendritic cells induce the differentiation of interleukin-21-producing T follicular helper-like cells through interleukin-12. Immunity. 2009;31(1):158–169. doi: 10.1016/j.immuni.2009.04.016. [DOI] [PMC free article] [PubMed] [Google Scholar]
- 62.Li Q, Xu B, Michie SA, Rubins KH, Schreriber RD, McDevitt HO. Interferon-alpha initiates type 1 diabetes in nonobese diabetic mice. Proc Natl Acad Sci U S A. 2008;105(34):12439–12444. doi: 10.1073/pnas.0806439105. [DOI] [PMC free article] [PubMed] [Google Scholar]
- 63.Diana J, et al. Crosstalk between neutrophils, B-1a cells and plasmacytoid dendritic cells initiates autoimmune diabetes. Nat Med. 2013;19(1):65–73. doi: 10.1038/nm.3042. [DOI] [PubMed] [Google Scholar]
- 64.Su C, Duan X, Zheng J, Liang L, Wang F, Guo L. IFN-α as an adjuvant for adenovirus-vectored FMDV subunit vaccine through improving the generation of T follicular helper cells. PLoS One. 2013;8(6):e66134. doi: 10.1371/journal.pone.0066134. [DOI] [PMC free article] [PubMed] [Google Scholar]
- 65.Baumjohann D, et al. The microRNA cluster miR-17 approximately 92 promotes TFH cell differentiation and represses subset-inappropriate gene expression. Nat Immunol. 2013;14(8):840–848. doi: 10.1038/ni.2642. [DOI] [PMC free article] [PubMed] [Google Scholar]
- 66.Kang SG, et al. MicroRNAs of the miR-17 approximately 92 family are critical regulators of T(FH) differentiation. Nat Immunol. 2013;14(8):849–857. doi: 10.1038/ni.2648. [DOI] [PMC free article] [PubMed] [Google Scholar]
- 67.Kim HJ, Verbinnen B, Tang X, Lu L, Cantor H. Inhibition of follicular T-helper cells by CD8(+) regulatory T-cells is essential for self tolerance. Nature. 2010;467(7313):328–332. doi: 10.1038/nature09370. [DOI] [PMC free article] [PubMed] [Google Scholar]
- 68.Jiang H, et al. HLA-E-restricted regulatory CD8(+) T-cells are involved in development and control of human autoimmune type 1 diabetes. J Clin Invest. 2010;120(10):3641–3650. doi: 10.1172/JCI43522. [DOI] [PMC free article] [PubMed] [Google Scholar]
- 69.Linterman MA, et al. Foxp3+ follicular regulatory T-cells control the germinal center response. Nat Med. 2011;17(8):975–982. doi: 10.1038/nm.2425. [DOI] [PMC free article] [PubMed] [Google Scholar]
- 70.Chung Y, et al. Follicular regulatory T-cells expressing Foxp3 and Bcl-6 suppress germinal center reactions. Nat Med. 2011;17(8):983–988. doi: 10.1038/nm.2426. [DOI] [PMC free article] [PubMed] [Google Scholar]
- 71.Vaeth M, et al. Follicular regulatory T-cells control humoral autoimmunity via NFAT2-regulated CXCR5 expression. J Exp Med. 2014;211(3):545–561. doi: 10.1084/jem.20130604. [DOI] [PMC free article] [PubMed] [Google Scholar]
- 72.Locci M, et al. Human circulating PD-1(+)CXCR3(–)CXCR5(+) memory Tfh cells are highly functional and correlate with broadly neutralizing HIV antibody responses. Immunity. 2013;39(4):758–769. doi: 10.1016/j.immuni.2013.08.031. [DOI] [PMC free article] [PubMed] [Google Scholar]
- 73.Cubas RA, et al. Inadequate T follicular cell help impairs B cell immunity during HIV infection. Nat Med. 2013;19(4):494–499. doi: 10.1038/nm.3109. [DOI] [PMC free article] [PubMed] [Google Scholar]
- 74.Bentebibel SE, et al. Induction of ICOS+CXCR3+CXCR5+ TH cells correlates with antibody responses to influenza vaccination. Sci Transl Med. 2013;5(176):176ra132. doi: 10.1126/scitranslmed.3005191. [DOI] [PMC free article] [PubMed] [Google Scholar]
- 75.Kotlarz D, et al. Loss-of-function mutations in the IL-21 receptor gene cause a primary immunodeficiency syndrome. J Exp Med. 2013;210(3):433–443. doi: 10.1084/jem.20111229. [DOI] [PMC free article] [PubMed] [Google Scholar]
- 76.Linterman MA, et al. Follicular helper T-cells are required for systemic autoimmunity. J Exp Med. 2009;206(3):561–576. doi: 10.1084/jem.20081886. [DOI] [PMC free article] [PubMed] [Google Scholar]
- 77.Tangye SG, Ma CS, Brink R, Deenick EK. The good, the bad and the ugly - TFH cells in human health and disease. Nat Rev Immunol. 2013;13(6):412–426. doi: 10.1038/nri3447. [DOI] [PubMed] [Google Scholar]
- 78.Gillespie KM, et al. HLA class II typing of whole genome amplified mouth swab DNA. Tissue Antigens. 2000;56(6):530–538. doi: 10.1034/j.1399-0039.2000.560607.x. [DOI] [PubMed] [Google Scholar]
- 79.Bonifacio E, et al. Harmonization of glutamic acid decarboxylase and islet antigen-2 autoantibody assays for national institute of diabetes and digestive and kidney diseases consortia. J Clin Endocrinol Metab. 2010;95(7):3360–3367. doi: 10.1210/jc.2010-0293. [DOI] [PMC free article] [PubMed] [Google Scholar]
- 80.Long AE, Gooneratne AT, Rokni S, Williams AJ, Bingley PJ. The role of autoantibodies to zinc transporter 8 in prediction of type 1 diabetes in relatives: lessons from the European Nicotinamide Diabetes Intervention Trial (ENDIT) cohort. J Clin Endocrinol Metab. 2012;97(2):632–637. doi: 10.1210/jc.2011-1952. [DOI] [PubMed] [Google Scholar]
- 81.Wang CJ, et al. Cutting edge: cell-extrinsic immune regulation by ctla-4 expressed on conventional T-cells. J Immunol. 2012;189(3):1118–1122. doi: 10.4049/jimmunol.1200972. [DOI] [PMC free article] [PubMed] [Google Scholar]
Associated Data
This section collects any data citations, data availability statements, or supplementary materials included in this article.