Abstract
A new predictive imaging modality is created through the ‘fusion’ of two distinct technologies: imaging mass spectrometry (IMS) and microscopy. IMS-generated molecular maps, rich in chemical information but having coarse spatial resolution, are combined with optical microscopy maps, which have relatively low chemical specificity but high spatial information. The resulting images combine the advantages of both technologies, enabling prediction of a molecular distribution both at high spatial resolution and with high chemical specificity. Multivariate regression is used to model variables in one technology, using variables from the other technology. Several applications demonstrate the remarkable potential of image fusion: (i) ‘sharpening’ of IMS images, which uses microscopy measurements to predict ion distributions at a spatial resolution that exceeds that of measured ion images by ten times or more; (ii) prediction of ion distributions in tissue areas that were not measured by IMS; and (iii) enrichment of biological signals and attenuation of instrumental artifacts, revealing insights that are not easily extracted from either microscopy or IMS separately. Image fusion enables a new multi-modality paradigm for tissue exploration whereby mining relationships between different imaging sensors yields novel imaging modalities that combine and surpass what can be gleaned from the individual technologies alone.
Biology and medicine are experiencing an unprecedented level of information acquisition, fueled by technological advancements that deliver enormous amounts of data with ever-increasing instrumental precision. As a result, the integration of information across different data types is one of the crucial challenges that lie ahead. This is apparent in the molecular imaging field, where a progressively heterogeneous set of imaging modalities and sensor types delivers a wide range of information on the molecular processes taking place in living cells1,2. Since the underlying measurement principles can differ widely, each imaging technology has its own molecular targets, advantages, and constraints. Although the use of multiple imaging modalities towards answering a single biomedical question is not uncommon3,4,5, most multi-modal studies treat their different image types as separate entities. Different modalities are commonly registered and overlaid to generate a single display, but true integration of data across technologies is largely left to human interpretation. Even though the potential of multi-modal integration is recognized for biological and medical research, a lot of work in this area has focused on developing instrumental6–14 and chemical answers15–16, while broad computational approaches capable of handling the heterogeneity and multi-resolution challenges have been largely lacking. As a result, biological insights can be segregated along technological borders, and important structural information may be overlooked. To help resolve this problem, we employ the concept of image fusion17,18 and demonstrate the power of cross-modality modeling on tissue samples, with data obtained by mass spectrometry and microscopy (Fig. 1). Image fusion is the generation of a single image from several source images, and typically aims to provide a more accurate description of the sample or combine information towards a particular human or machine perception task. Substantial development in recent years, particularly in multi-sensor image fusion where the source images are of different sensor types19,20, has led to applications in fields as diverse as satellite-based remote sensing21, clinical diagnostics22–24, and concealed weapon detection25.
Figure 1.
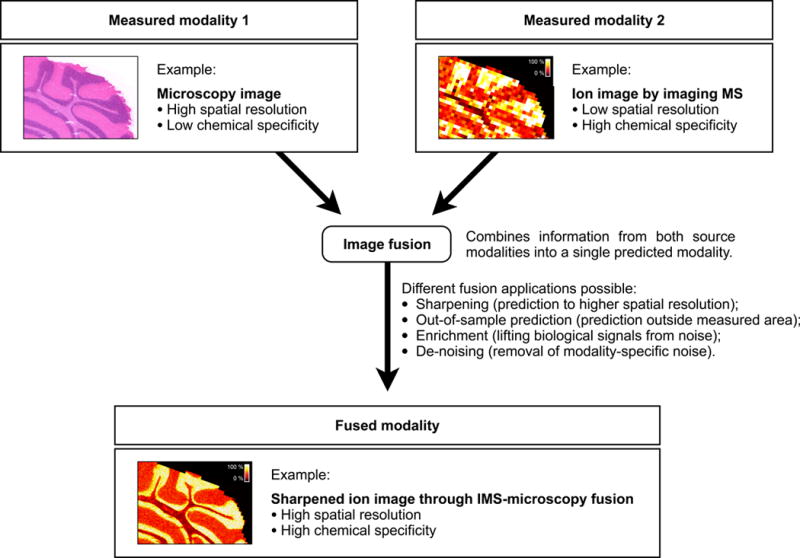
Image fusion of imaging mass spectrometry (IMS) and microscopy. Image fusion generates a single image from two or more source images, combining the advantages of the different sensor types. The integration of IMS and optical microscopy is given as an example. The IMS-microscopy fusion image is a predictive modality that delivers both the chemical specificity of IMS and the spatial resolution of microscopy in one integrated whole. Each source image measures a different aspect of the content of a tissue sample. The fused image predicts the tissue content as if all aspects were observed concurrently.
The current paper brings multi-sensor image fusion to the study of protein, peptide, lipid, small metabolite, and drug distributions in tissue. We introduce a two-part method that first models detectable relationships between the source modalities, and then uses that model for prediction (Supplementary Fig. 1). Matrix-assisted laser desorption ionization (MALDI) imaging mass spectrometry26–30 (IMS) is employed as a source modality that delivers chemically specific information over a wide mass range, beyond 100kDa, and that is applicable to a wide variety of biomolecules in living cells and tissues31–35. It is particularly well suited for image fusion because it is information-rich, mapping the spatial distributions of many hundreds of biomolecules throughout a tissue section. Optical microscopy of stained tissue is used as the second source modality, providing the fine-grained textural information that IMS typically does not supply. Furthermore, the computational approach is broadly applicable and can perform fusion with other imaging technologies as well (e.g. MRI, CT, PET, and others).
Images of the same subject, acquired using different modalities, often exhibit correspondences. In a brain study, for example, one might see the corpus callosum outlined both in a microscopy image and in an ion image obtained through IMS. Typically, microscopy will deliver a spatially fine-grained outline of the corpus callosum without telling us much about its chemical content, while IMS will characterize that same tissue structure in a chemically very specific but spatially coarse or “pixelated” manner. Although these technologies sample the same biological structure at different spatial resolutions, the visual trace present in both modalities indicates a correspondence between the IMS and microscopy measurements for this region. Such correspondences that tie observations in one modality to observations in another modality are used in image fusion for integrative and predictive purposes. Some cross-modality correspondences (as in the example above) are straightforward, can be described by a simple model (e.g. correlation), and are abundant enough to be visually recognized across image types. Most correspondences, however, tend to be more nuanced and complex. They typically involve derivatives of the variables natively provided by a sensor, often require advanced multivariate models to be described accurately, and usually fall below the level of detection for human eyes.
The integration of IMS and microscopy is accomplished by capturing IMS-microscopy relationships in a model. As this enables prediction of observations in one modality on the basis of measurements in the other modality, the model sets the stage for a multitude of predictive fusion applications. One example is an up-sampling application, known in remote sensing as sharpening36–38, which can predict the distribution of ion m/z 778.5 (identified as PE(P-40:4)) to a spatial resolution that exceeds the native IMS measurements by ten-fold (Fig. 2). The modeling challenge is approached as a massive multivariate regression task39 involving variables derived from IMS measurements and variables derived from microscopy measurements (Supplementary Fig. 2). The goal is to link each ion intensity variable to a combination of photon-based variables by modeling the distribution of spatially paired measurements from both images using partial least squares (PLS) regression40 (Supplementary Fig. 3). The resulting model is a set of slopes and intercepts that when combined with a microscopy measurement, outputs a prediction for the IMS variables. In the sharpening application, the model is applied to each microscopy pixel, effectively predicting ion intensities at spatial resolutions that exceed the native resolution of the IMS measurements. We demonstrate IMS-microscopy fusion for different tissue types, different target molecules, various histological staining protocols, and at different scales. In the latter case, we show application to the nanometer range, below that achievable with current MALDI IMS instrumentation.
Figure 2.
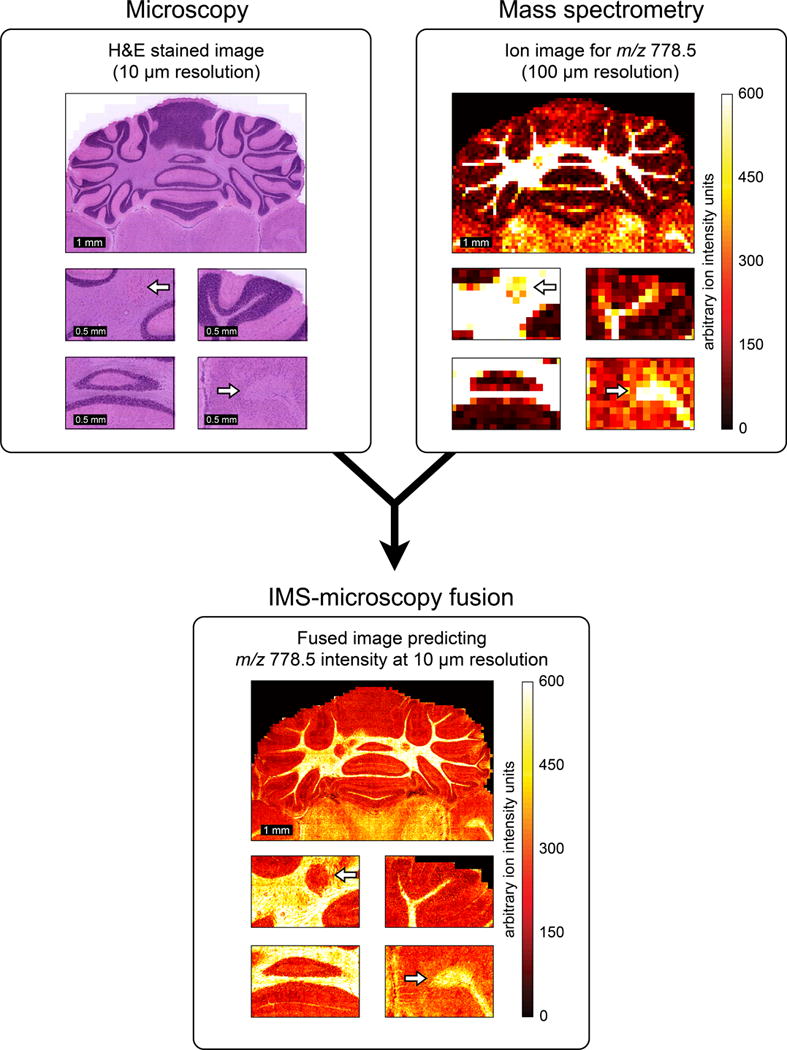
Example of IMS-microscopy fusion. An ion image measured in mouse brain, describing the distribution of m/z 778.5 (identified as lipid PE(P-40:4)) at 100 μm spatial resolution (a), is integrated with an H&E-stained microscopy image measured from the same tissue sample at 10 μm resolution (b). By combining the information from both image types, the image fusion process can predict the ion distribution of m/z 778.5 at 10 μm resolution (c).
Results
IMS-microscopy fusion is demonstrated through three different applications: (i) predicting ion distributions to a spatial resolution that exceeds that of the measured ion images (sharpening); (ii) predicting ion distributions in tissue areas that were not measured by IMS (out-of-sample prediction); and (iii) discovery of biological patterns that are difficult to retrieve from the source modalities separately (enrichment). The results cover seven distinct case studies (Supplementary Table 1), each describing a multi-modal tissue imaging experiment with microscopy and MALDI IMS from the same or an adjacent tissue section.
Sharpening ion distributions by microscopy
The sharpening of ion images provides a means of predicting molecular tissue content to a higher spatial resolution and introduces the general modeling procedure that underlies all our fusion applications. In case study 1, the tissue distribution of ion m/z 762.5 (identified as PE(16:0/22:6)) is measured through an IMS experiment performed at 100 μm spatial resolution (Fig. 3a). A microscopy image at 10 μm resolution (Fig. 3b) is taken from the same tissue section stained with H&E after the IMS acquisition. Our two-phase fusion method (see Online Methods and Supplementary Figs. 1, 2, and 3) combines the information from both modalities, builds a model to capture any cross-modality relationships it can detect, and employs that model and the microscopy measurements to predict the distribution for all ions at 10 μm resolution. The spatial prediction for ion m/z 762.5 is shown (Fig. 3c). Additionally, we compare the 100 μm measurement and the fusion-based 10 μm prediction to an ion image for m/z 762.5 actually acquired at 10 μm on an adjacent tissue section (Fig. 3d). The IMS acquisition parameters are identical for (a) and (d), except for increased laser power required to compensate for reduced signal intensities at 10 μm pixel widths. An example by an alternative up-sampling approach, bilinear interpolation (Supplementary Fig. 4), is clearly inferior. The Online Methods provide details on the model building and evaluation process (Supplementary Figs. 5 and 6).
Figure 3.
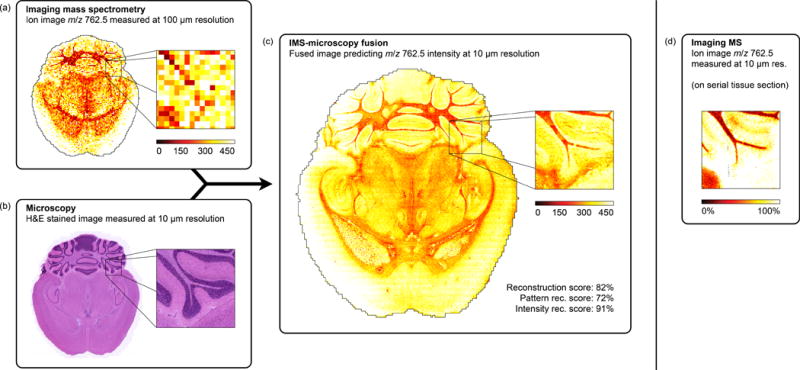
Prediction of the ion distribution of m/z 762.5 in mouse brain at 10 μm resolution from 100 μm IMS and 10 μm microscopy measurements (sharpening). This example in mouse brain fuses a measured ion image for m/z 762.5 (identified as lipid PE(16:0/22:6)) at 100 μm spatial resolution (a) with a measured H&E-stained microscopy image at 10 μm resolution (b), predicting the ion distribution of m/z 762.5 at 10 μm resolution (reconstr. score 82%) (c). For comparison, (d) shows a measured ion image for m/z 762.5 at 10 μm spatial resolution, acquired from a neighboring tissue section.
The IMS-microscopy model obtained by PLS regression between IMS and microscopy-derived variables, contains a sub-model for each IMS variable (Supplementary Fig. 5). Model performance is therefore specific to each IMS variable, and needs to be evaluated to ascertain for which ion peaks good prediction (and useful fusion) is possible. We introduce the concept of a ‘reconstruction score’ as a measure of predictive power (Supplementary Fig. 6). This percentage score summarizes how well the measured ion distribution can be predicted using the given microscopy observations. A value of 100% indicates that the cross-modality relationships allow complete reconstruction of the measured intensity distribution using only variables from the other technology. A value close to 0% signifies that no cross-modality relationship could be found or modeled for this ion, and that fusion-driven prediction is not an option for it. Most measured ion images can be predicted at least partially using microscopy, and in our examples we rely on fusion only for ions with a score above 75%. We additionally introduce the absolute residuals image and the 95% confidence interval image as measures of prediction performance in function of tissue location (Supplementary Fig. 6). While m/z 762.5 and 747.5 (a combination of three nominally isobaric lipids, Supplementary Fig. 9) exhibit a strong cross-modality relationship to H&E microscopy, m/z 766.5 (PE(18:0/20:4)) and 715.6 (PE-Cer(d16:1/22:0)) from the same IMS experiment are examples of ions for which no such relationships could be found and thus prediction is not recommended (Supplementary Figs. 7 and 8).
The access to information from different technologies allows fusion to predict beyond hard constraints inherent to a particular sensor type. This advantage, for example, enables the image sharpening application to push beyond the physical limits of the IMS laser by predicting at a spatial resolution below the wavelength of the laser. As an example, we apply the fusion procedure to a mouse brain sample on which both source modalities have been pushed to their current state-of-the-art in spatial resolution for the instrumentation used in this experiment (Fig. 4). Lipid distributions for m/z 646.4 (nominal isobars Cer(d18:1/24:1) and second 13C isotope of CerP(d18:1/18:0)) and 788.5 (nominal isobars PS(18:0/18:1) and PE(40:7)) were successfully predicted with 75% and 76% scores at 330 nm resolution (Fig. 4c), using a 355 nm wavelength laser to acquire the source IMS measurements. The ion images were acquired at 10 μm resolution (Fig. 4a), while the textural information was encoded at 330 nm resolution in an H&E stained microscopy image of an adjacent section (Fig. 4b).
Figure 4.
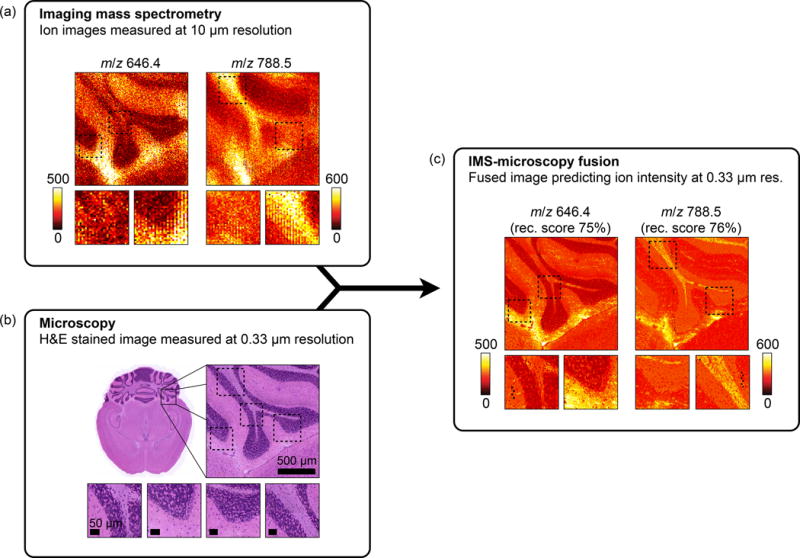
Prediction of the ion distributions of m/z 646.4 and 788.5 in mouse brain at 330 nm resolution from 10 μm IMS and 330 nm microscopy measurements (sharpening). Measured ion images acquired in mouse brain for m/z 646.4 and m/z 788.5 at 10 μm spatial resolution (a) are fused with an H&E-stained microscopy image measured at 0.33 μm resolution (b). The resulting IMS-microscopy model is combined with the microscopy measurements to predict the ion distributions of m/z 646.4 and m/z 788.5 at 330 nm resolution with an overall reconstruction score of respectively 75% and 76% (c).
Additional results in the supplementary information demonstrate how fusion can predict to any spatial resolution between the native IMS and microscopy resolutions (Supplementary Figs. 10, 11, and 19). It is also independent of the tissue type used or the molecule type measured (Supplementary Figs. 12 and 18), and the method is shown to operate with tissue stains other than H&E (Supplementary Figs. 13–16, 17). Fusion is shown to provide useful integration and prediction even for ion peaks that report multiple unresolved ion species (Supplementary Fig. 9). Finally, using a synthetic multi-modal data set, the behavior of the method is verified against a gold standard of known cross-modal and modality-specific patterns (Supplementary Fig. 17).
Predicting molecule distributions in non-IMS measured tissue
This application of the fusion process develops the capability of predicting ion distributions in areas not measured by IMS, using a model built from areas where data from both modalities are available. As an example, the ion distribution for m/z 10,516 is predicted in non-IMS measured mouse brain areas (Fig. 5). First, an IMS-microscopy model is built on a sub-area of the tissue where IMS measurements (in the MW range of interest) are available at 100 μm resolution and H&E-stained microscopy at 5 μm resolution. Subsequently, the model is used to predict both inside the IMS-measured area as well as the area outside, where only microscopy is available. The predicted pattern for m/z 10,516 outside the modeled area was successfully confirmed via IMS measurements external to this case study. Although prediction at the native IMS resolution of 100 μm is possible (Supplementary Fig. 21), the availability of microscopy at 5 μm resolution enables additional sharpening of the ion predictions to 5 μm both inside and outside the modeled area (Fig. 5).
Figure 5.
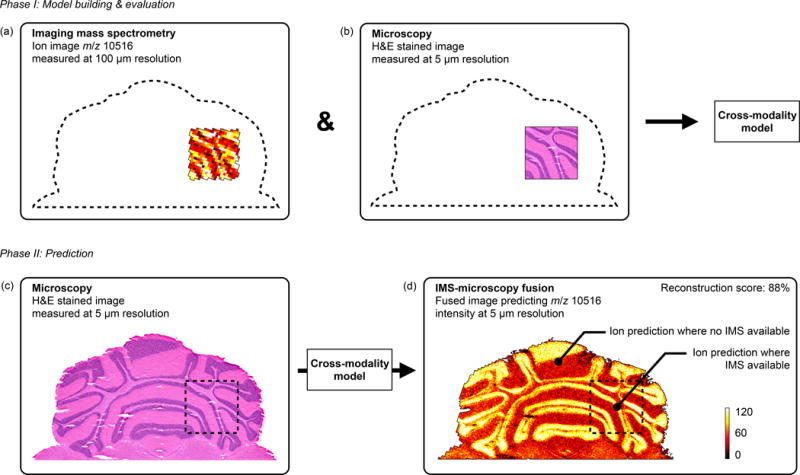
Prediction of m/z 10,516 distribution in mouse brain areas not measured by IMS (out-of-sample prediction). An IMS-microscopy model is built on a tissue sub-area for which IMS is available at 100 μm resolution (a) and H&E-stained microscopy is available at 5 μm resolution (b). The model is then used to predict the distribution of m/z 10,516 in areas where no IMS was acquired and only microscopy is available (reconstr. score 88%) (d). (Non-sharpened version available in Supplementary Fig. 21)
Discovery through multi-modal enrichment
The discovery of cross-modality relationships enables the separation of a measured tissue signal into a part that can be predicted by the other technology and a part that is modality-specific. For measured signals with strong cross-modal support, this information can be used to filter technology-specific noise from genuine tissue signal. This process can substantially increase the signal-to-noise ratio of observations, and enables discovery of patterns that might otherwise be missed. Each ion image measured by IMS can be considered a superposition of noise variation on top of a biological or sample signal pattern. The fusion model tries to write each ion image as a linear combination of microscopy-derived patterns, and for ion images with strong cross-modal support, the model succeeds in reproducing most if not all of the biological or sample signal pattern that way. Since the noise tends to be sensor-specific, it is highly unlikely that fusion finds a link to an identical pattern in the other technology. As a result, modality-specific noise variation will often not survive the modeling and prediction process, effectively de-noising the predictions. Since the biological signal often reports an underlying tissue structure that can modulate measurements in both modalities, finding a relationship across technologies is not uncommon and when that happens the presence of real tissue variation in the predictions is more readily observed. It is not necessarily so that all technology-specific variation is noise, since a measurement might be reporting a biological feature that can only be detected by one of the sensors. However, that situation can be detected by a reduced reconstruction score and can even be spatially confined to a tissue sub-area using for example the absolute residuals image. For measured variables and tissue areas with strong cross-modal support, fusion enables enrichment of genuine tissue signal and removal of modality-specific noise.
Multi-modal enrichment can cause a feature to be discovered or recognized as biological or sample-based when in a single-modality analysis it would be mistaken for noise or go unnoticed. Annotations a–c (Fig. 6) demonstrate this in a sharpened ion image of rat kidney. Propagation through the fusion process into the predictions indicates that these features are corroborated by measurements in both modalities. From a microscopy viewpoint, fusion enables discovery of patterns that may otherwise go undetected. From an IMS viewpoint, fusion provides an increased confidence in the genuine nature of these features, so that they may be recognized from faint signals in the noise.
Figure 6.
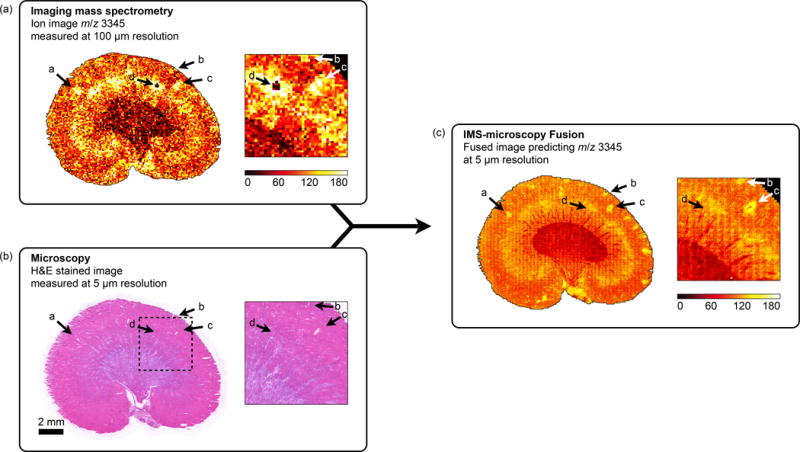
Discovery of tissue features through multi-modal enrichment. An ion image for m/z 3,345 measured by IMS at 100 μm resolution in a rat kidney section (a) is fused with H&E stained microscopy acquired at 5 μm resolution (b) to produce an ion distribution prediction at 5 μm resolution (reconstr. score 85%) (c). Annotations a–c demonstrate multi-modal enrichment. If only IMS is considered, these features could be mistaken for ‘matrix hotspot’ noise. However, their successful propagation through the fusion process and their presence in the final fused image confirms they are genuine tissue features that are corroborated by another technology (in this case microscopy). If only microscopy is considered, these features are so faint that they would probably not be detected. Instead, they are only discovered by fusion with another data source. Annotation d demonstrates multi-modal attenuation. The lack of cross-modal support for this localized drop in ion intensity reduces confidence in the biological nature of this feature.
Fusion separates features with support across technologies from those supported by only a single sensor type. Annotation d (Fig. 6) is an example of a single-modality feature. In IMS it shows a localized intensity drop, which might be perceived as biological since it covers multiple pixels. However, in microscopy (acquired post-IMS) there is no visual trace at this location and even the fusion process finds no cross-modal evidence to support this drop as a real tissue feature. Although lack of cross-modal corroboration does not necessarily mean a feature is noise, since it can be a biological feature detectable by only one of the technologies, it does reduce confidence in it being a genuine tissue feature and suggests here an IMS acquisition anomaly.
Fusion-based filtering can also be used as a global method for de-noising ion images with strong cross-modal support. As an example, an ion image for m/z 5,666 measured at 100 μm resolution in mouse brain is fused with an H&E-stained microscopy image at 5 μm resolution (Supplementary Fig. 20). The predicted ion distribution shows a clear decrease in speckled noise variation. A similar cleanup effect and increase in s/n is also observed in predictions for other ions from this data set (Supplementary Figs. 18 and 19).
Discussion
The image fusion process combines different image types, each measuring a different aspect of the content of a tissue sample, and predicts the tissue content in an integrated way as if all aspects were observed concurrently. Modeling between technologies is addressed as a multivariate regression analysis, using standard PLS regression. Since this report examines IMS-microscopy fusion, IMS-derived variables (peak intensities) are designated response variables and microscopy-derived variables (e.g. hue, texture, entropy) are used as predictor variables. The resulting mathematical model attempts to approximate each ion peak distribution in the IMS source as a linear combination of microscopy-derived patterns. Since each IMS variable has its own relationship to the microscopy patterns, the fusion model contains a sub-model for each variable (Supplementary Fig. 5) and predictive performance will be variable-specific. Building the best possible model does not ensure a good prediction in all cases, since there may not be a cross-modality relationship to exploit for a particular peak, or the complexity of the relationship cannot be described accurately using the present model. It is therefore imperative that the model-building step is followed by an evaluation step that assesses for each m/z its prediction reliability. We provide three indicative approaches. The first indicator is the reconstruction score, which reports how close a prediction using microscopy measurements gets to the measured ion distribution, given the model. The second indicator is the absolute residuals image, which shows where in the tissue microscopy-driven prediction approximates the IMS measurements well, and where it does not. A third indicator conveys prediction robustness as a function of location by calculating a 95% confidence interval (CI) image using bootstrapping (see Online Methods References 41 and 42). This CI-image highlights in which tissue areas the prediction is more robust and in which areas the prediction might be model-specific and less trustworthy. The Online Methods provide further details on these indicators (Supplementary Figs. 6–9) and devote a separate section to prediction beyond the IMS measurement resolution.
The prediction of molecular distributions in tissue areas for which no IMS is available is a form of out-of-sample prediction (Fig. 5). In molecular imaging studies where comprehensive measurement of the entire tissue sample is not practical or economical, or in studies where the number of samples is very large, out-of-sample prediction can provide a remarkable alternative. It can also provide an evidence-supported view into the probable content of tissue areas or samples that need to be saved for other analysis techniques, e.g. in multi-branched drug discovery workflows. Further, it can perform ‘anomaly detection’, where the measured content of a diseased tissue sample is directly compared to the content predicted to be there on the basis of a model trained on normal tissue. In high-dimensional data sets, this would immediately highlight differences and provide a facile path to pathology-derived anomalies. However, it is important to keep the conditions for the (microscopy) measurements between these different areas as similar as possible and to keep the model from over-fitting on the training data.
Fusion-based predictions show an enrichment of patterns supported by multiple technologies and an attenuation of modality-specific patterns. The enrichment effect is inherently present in fusion-based predictions and can be used to increase confidence in observations by cross-modal corroboration (Supplementary Figs. 18–20). The ability of fusion to aid in separating true signal variation from instrumental noise variation by integrating with another data source, has immediate value for increasing measurement sensitivity and s/n without the need to physically adjust the instrument.
The modeling aspects that influence the reliability of fusion-driven predictions are addressed in the Online Methods. A subsequent section specifically highlights how the empirical nature of the image fusion method, namely mining for cross-modality relationships rather than pre-defining them, ensures broad applicability to imaging modalities and sensor types beyond the data sources illustrated here. We also shortly discuss how the fusion process enables bi-directional communication and corroboration between different data sources, and how fusion with IMS can contribute to microscopy interpretation and the pathological recognition process. Furthermore, to enable the readers to experiment on their own data sets, we provide a full implementation of the image fusion framework as a command line utility that can be downloaded at http://fusion.vueinnovations.com. This package includes an example IMS-microscopy multi-modal data set.
In conclusion, image fusion enables the creation of novel predictive imaging modalities that combine the advantages of different sensor types to deliver insights that cannot be normally obtained from the separate technologies alone. The modeling of cross-modality relationships provides predictive paths to new biological understanding through the integration of observations from different measurement principles. It also allows these fused modalities to circumvent sensor-specific limitations (e.g. IMS resolution via sharpening), to attenuate technology-specific noise sources (e.g. matrix artifact attenuation by biological signal enrichment), and to predict observations in the absence of measurements (e.g. prediction of ion intensity in non-IMS measured areas). The predictive applications of image fusion can contribute in those cases where conducting a physical measurement is unpractical (e.g. measurement time, instrument stability), uneconomical (e.g. laser wear, detector deterioration), or even not feasible due to instrumental limitations (e.g. spatial resolution beyond laser capabilities, low s/n).
Multi-modal studies have become widespread and the complementarity between different technologies is well appreciated. This study shows that the fusion of microscopy and mass spectrometry can provide remarkable results, and lays the groundwork for more advanced modeling across technologies. These prediction methods can fulfill an instrumental role in realizing the full potential of multi-modal pattern discovery, particularly in the molecular mapping of tissue.
Supplementary Material
Acknowledgments
This work was supported by the US National Institutes of Health grants NIH/NIGMS R01 GM058008-14 and NIH/NIGMS P41 GM103391-03. R.V. thanks E. Waelkens for his encouragement and support.
Footnotes
Author contributions
R.V. conceived and developed the methodology, designed experiments, analyzed and interpreted data, and wrote the manuscript; J.Y. designed experiments, acquired data, and edited the manuscript; J.S. designed experiments, acquired data, performed identifications, and edited the manuscript; R.M.C. designed experiments, interpreted data, revised the manuscript, and is principle investigator for the grants that fund this research.
References
- 1.Weissleder R. Scaling down imaging: molecular mapping of cancer in mice. Nature Reviews Cancer. 2002;2:11–8. doi: 10.1038/nrc701. [DOI] [PubMed] [Google Scholar]
- 2.Massoud TF, Gambhir SS. Molecular imaging in living subjects: seeing fundamental biological processes in a new light. Genes & Development. 2003;17:545–80. doi: 10.1101/gad.1047403. [DOI] [PubMed] [Google Scholar]
- 3.Jahn KA, et al. Correlative microscopy: providing new understanding in the biomedical and plant sciences. Micron. 2012;43:565–82. doi: 10.1016/j.micron.2011.12.004. [DOI] [PubMed] [Google Scholar]
- 4.Jacobs RE, Cherry SR. Complementary emerging techniques: high-resolution PET and MRI. Current Opinion in Neurobiology. 2001;11:621–9. doi: 10.1016/s0959-4388(00)00259-2. [DOI] [PubMed] [Google Scholar]
- 5.Chughtai S, et al. A multimodal mass spectrometry imaging approach for the study of musculoskeletal tissues. International Journal of Mass Spectrometry. 2012:325–327. [Google Scholar]
- 6.Smith C. Two microscopes are better than one. Nature. 2012;492:293–297. doi: 10.1038/492293a. [DOI] [PubMed] [Google Scholar]
- 7.Caplan J, Niethammer M, Taylor RM, 2nd, Czymmek KJ. The power of correlative microscopy: multi-modal, multi-scale, multi-dimensional. Current Opinion in Structural Biology. 2011;21:686–93. doi: 10.1016/j.sbi.2011.06.010. [DOI] [PMC free article] [PubMed] [Google Scholar]
- 8.Modla S, Czymmek KJ. Correlative microscopy: a powerful tool for exploring neurological cells and tissues. Micron. 2011;42:773–92. doi: 10.1016/j.micron.2011.07.001. [DOI] [PubMed] [Google Scholar]
- 9.Townsend DW. A combined PET/CT scanner: the choices. Journal of Nuclear Medicine. 2001;42:533–4. [PubMed] [Google Scholar]
- 10.Townsend DW, Beyer T, Blodgett TM. PET/CT scanners: a hardware approach to image fusion. Seminars in Nuclear Medicine. 2003;33:193–204. doi: 10.1053/snuc.2003.127314. [DOI] [PubMed] [Google Scholar]
- 11.Masyuko R, Lanni EJ, Sweedler JV, Bohn PW. Correlated imaging – a grand challenge in chemical analysis. Analyst. 2013;138:1924–39. doi: 10.1039/c3an36416j. [DOI] [PMC free article] [PubMed] [Google Scholar]
- 12.Bocklitz TW, et al. Deeper understanding of biological tissue: quantitative correlation of MALDI-TOF and Raman imaging. Analytical Chemistry. 2013;85:10829–34. doi: 10.1021/ac402175c. [DOI] [PubMed] [Google Scholar]
- 13.Clarke FC, et al. Chemical image fusion. The synergy of FT-NIR and Raman mapping microscopy to enable a more complete visualization of pharmaceutical formulations. Analytical Chemistry. 2001;73:2213–20. doi: 10.1021/ac001327l. [DOI] [PubMed] [Google Scholar]
- 14.Judenhofer MS, et al. Simultaneous PET-MRI: a new approach for functional and morphological imaging. Nature Medicine. 2008;14:459–65. doi: 10.1038/nm1700. [DOI] [PubMed] [Google Scholar]
- 15.Glenn DR, et al. Correlative light and electron microscopy using cathodoluminescence from nanoparticles with distinguishable colours. Scientific Reports. 2012;2:865. doi: 10.1038/srep00865. [DOI] [PMC free article] [PubMed] [Google Scholar]
- 16.Josephson L, Kircher MF, Mahmood U, Tang Y, Weissleder R. Near-infrared fluorescent nanoparticles as combined MR/optical imaging probes. Bioconjugate Chemistry. 2002;13:554–60. doi: 10.1021/bc015555d. [DOI] [PubMed] [Google Scholar]
- 17.Blum RS, Liu Z. Multi-sensor image fusion and its applications. Taylor & Francis; Boca Raton, FL: 2006. [Google Scholar]
- 18.Bretschneider T, Kao O. Image fusion in remote sensing. Proceedings of the 1st Online Symposium of Electronic Engineers. 2000:1–8. [Google Scholar]
- 19.Pohl C, Van Genderen J. Multisensor image fusion in remote sensing: concepts, methods and applications. International Journal of Remote Sensing. 1998;19:823–854. [Google Scholar]
- 20.Price JC. Combining multispectral data of differing spatial resolution. IEEE Transactions on Geoscience and Remote Sensing. 1999;37:1199–1203. [Google Scholar]
- 21.Simone G, Farina A, Morabito FC, Serpico SB, Bruzzone L. Image fusion techniques for remote sensing applications. Information Fusion. 2002;3:3–15. [Google Scholar]
- 22.Gaemperli O, et al. Cardiac image fusion from stand-alone SPECT and CT: clinical experience. Journal of Nuclear Medicine. 2007;48:696–703. doi: 10.2967/jnumed.106.037606. [DOI] [PubMed] [Google Scholar]
- 23.Li H, et al. Object recognition in brain CT-scans: knowledge-based fusion of data from multiple feature extractors. IEEE Transactions on Medical Imaging. 1995;14:212–29. doi: 10.1109/42.387703. [DOI] [PubMed] [Google Scholar]
- 24.Yang L, Guo B, Ni W. Multimodality medical image fusion based on multiscale geometric analysis of contourlet transform. Neurocomputing. 2008;72:203–211. [Google Scholar]
- 25.Varshney PK, et al. Registration and fusion of infrared and millimeter wave images for concealed weapon detection. Proceedings of 1999 International Conference on Image Processing ICIP 99. 1999;3:532–536. [Google Scholar]
- 26.Caprioli RM, Farmer TB, Gile J. Molecular imaging of biological samples: localization of peptides and proteins using MALDI-TOF MS. Analytical Chemistry. 1997;69:4751–60. doi: 10.1021/ac970888i. [DOI] [PubMed] [Google Scholar]
- 27.Stoeckli M, Chaurand P, Hallahan DE, Caprioli RM. Imaging mass spectrometry: a new technology for the analysis of protein expression in mammalian tissues. Nature Medicine. 2001;7:493–6. doi: 10.1038/86573. [DOI] [PubMed] [Google Scholar]
- 28.Amstalden van Hove ER, Smith DF, Heeren R. A concise review of mass spectrometry imaging. Journal of Chromatography A. 2010;1217:3946–3954. doi: 10.1016/j.chroma.2010.01.033. [DOI] [PubMed] [Google Scholar]
- 29.Chaurand P. Imaging mass spectrometry of thin tissue sections: A decade of collective efforts. Journal of Proteomics. 2012;75:4883–4892. doi: 10.1016/j.jprot.2012.04.005. [DOI] [PubMed] [Google Scholar]
- 30.Norris JL, Caprioli RM. Analysis of tissue specimens by matrix-assisted laser desorption/ionization imaging mass spectrometry in biological and clinical research. Chemical Reviews. 2013;113:2309–42. doi: 10.1021/cr3004295. [DOI] [PMC free article] [PubMed] [Google Scholar]
- 31.Murphy RC, Hankin JA, Barkley RM. Imaging of lipid species by MALDI mass spectrometry. Journal of Lipid Research. 2009;50:S317–S322. doi: 10.1194/jlr.R800051-JLR200. [DOI] [PMC free article] [PubMed] [Google Scholar]
- 32.Van de Plas R. Tissue Based Proteomics and Biomarker Discovery – Multivariate Data Mining Strategies for Mass Spectral Imaging. Faculty of Engineering, K. U. Leuven; Leuven, Belgium: 2010. [Google Scholar]
- 33.Andersson M, Andren P, Caprioli RM. Neuroproteomics. CRC Press; Boca Raton, FL: 2010. chapter MALDI Imaging and Profiling Mass Spectrometry. [PubMed] [Google Scholar]
- 34.Franck J, et al. MALDI mass spectrometry imaging of proteins exceeding 30,000 daltons. Medical Science Monitor. 2010;16:BR293–BR299. [PubMed] [Google Scholar]
- 35.Bradshaw R, Bleay S, Wolstenholme R, Clench MR, Francese S. Towards the integration of matrix assisted laser desorption ionisation mass spectrometry imaging into the current fingermark examination workflow. Forensic Science International. 2013;232:111–124. doi: 10.1016/j.forsciint.2013.07.013. [DOI] [PubMed] [Google Scholar]
- 36.Chavez PS, Sides SC, Anderson JA. Comparison of three different methods to merge multiresolution and multispectral data- Landsat TM and SPOT panchromatic. Photogrammetric Engineering & Remote Sensing. 1991;57:295–303. [Google Scholar]
- 37.Garguet-Duport B, Girel J, Chassery JM, Patou G. The use of multiresolution analysis and wavelets transform for merging SPOT panchromatic and multispectral image data. Photogrammetric Engineering & Remote Sensing. 1996;62:1057–1066. [Google Scholar]
- 38.Lee J, Lee C. Fast and efficient panchromatic sharpening. IEEE Transactions on Geoscience and Remote Sensing. 2010;48:155–163. [Google Scholar]
- 39.Draper NR, Smith H, Pownell E. Applied regression analysis. Wiley; New York: 1966. [Google Scholar]
- 40.Wold S, Sjöström M, Eriksson L. PLS-regression: a basic tool of chemometrics. Chemometrics and Intelligent Laboratory Systems. 2001;58:109–130. [Google Scholar]
Associated Data
This section collects any data citations, data availability statements, or supplementary materials included in this article.


