Abstract
The regulated release of anorexigenic α-MSH and orexigenic Agouti-related protein (AgRP) from discrete hypothalamic arcuate neurons onto common target sites in the CNS plays a fundamental role in the regulation of energy homeostasis. Both peptides bind with high affinity to the melanocortin-4 receptor (MC4R); existing data showα-MSH is an agonist that couples the receptor to the Gαs signaling pathway1, while AgRP binds competitively to block α-MSH binding2, and block the constitutive activity mediated by the ligand-mimetic amino terminal domain of the receptor3. Here, we show that regulation of firing activity of hypothalamic PVN neurons by α-MSH and AgRP can be mediated independently of Gαs signaling by ligand-induced coupling of MC4R to closure of inwardly rectifying potassium channel, Kir7.1. Further, AgRP is a biased agonist that hyperpolarizes neurons by binding to MC4R and opening Kir7.1, independently of its inhibition of α-MSH binding. Consequently, Kir7.1 signaling appears central to melanocortin-mediated regulation of energy homeostasis within the PVN. Coupling of MC4R to Kir7.1 may explain unusual aspects of the control of energy homeostasis by melanocortin signaling, including the gene dosage effect of MC4R4, and the sustained effects of AgRP on food intake5.
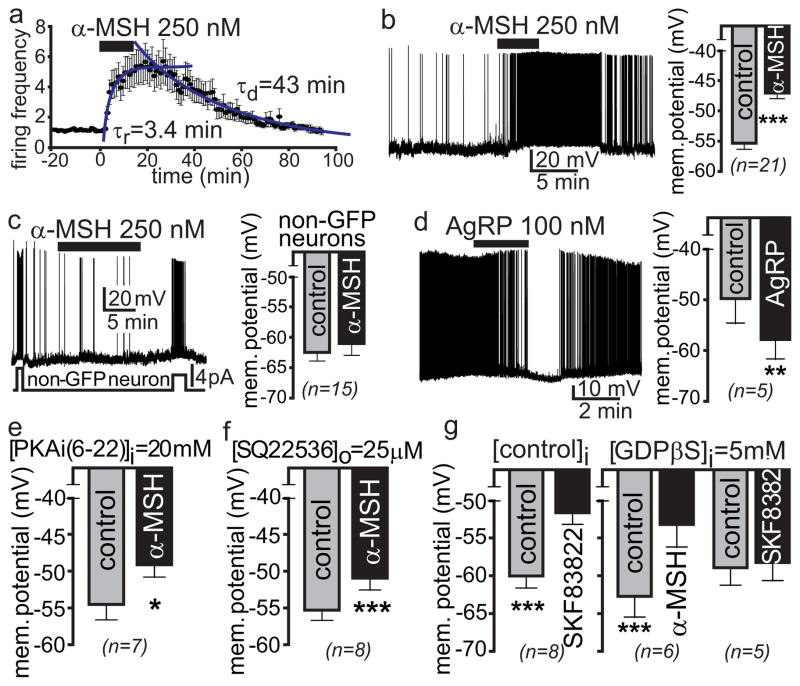
To better understand the diametrically opposed regulation of food intake by α-MSH and AgRP, we sought to identify mechanism(s) by which these peptides control firing activity of MC4R neurons in the paraventricular nucleus of the hypothalamus (PVN), a brain nucleus in which MC4R is known to control food intake6. Using electrophysiology with murine hypothalamic slice preparations in which MC4R PVN neurons are labeled with green fluorescent protein (GFP), α-MSH increases the frequency of action potential firing in PVN MC4R neurons recorded from loose patches (Fig. 1a), depolarizing these cells on average by ~8mV through action on postsynaptic MC4R (Fig. 1b)7. α-MSH had no effect on neighboring non-GFP labeled neurons (Fig. 1c). AgRP hyperpolarized PVN MC4R neurons (Fig. 1d), inhibiting their firing activity.
Fig. 1. Depolarization of hypothalamic PVN MC4R neurons by α-MSH is G-protein independent.
a, Normalized mean amplitude (+/−sem) and time-course ofα-MSH action on firing frequencies of PVN MC4R neurons (n=14) recorded in loose patch configuration using hypothalamic slice preparations from MC4R-GFP mice before and after the addition of 250 nM α-MSH and washout. b, A representative depolarizing response of a PVN MC4R neuron recorded in current clamp to bath application of 250 nM α-MSH. The bar graph represents mean +/− SEM (***p<0.0001). c, A representative response of a non-GFP expressing PVN neuron recorded in current clamp to bath application of 250 nM α-MSH. Application of brief current pulses (lower trace) caused depolarization and burst firing (upper trace), while α-MSH failed to depolarize this neuron. The bar graph represents mean +/− SEM (p>0.1). d, A representative hyperpolarizing response of a PVN neuron recorded in current clamp to bath application of 100 nM AgRP. The bar graph represents mean +/− SEM (**p<0.01). e, Intracellular PKA inhibitor, PKAi (6–22 amide) at 20 μM, fails to block the α-MSH-induced depolarization of membrane potential in PVN neurons. f, Inhibition of adenylyl cyclase by SQ22536 fails to block depolarizing effects of α-MSH. g, Application of 5 μM SKF83822, a selective D1 receptor agonist causes depolarization of PVN neurons (left panel). Intrapipette addition of 5 mM GDPβS, a blocker of G-protein signaling (right panel), fails to block the α-MSH – induced depolarization in PVN neurons, but blocks the depolarization and firing activity induced by SKF83822. Data in panels e-g shows mean +/− SEM, *p<0.05, ***p<0.001, paired t test.
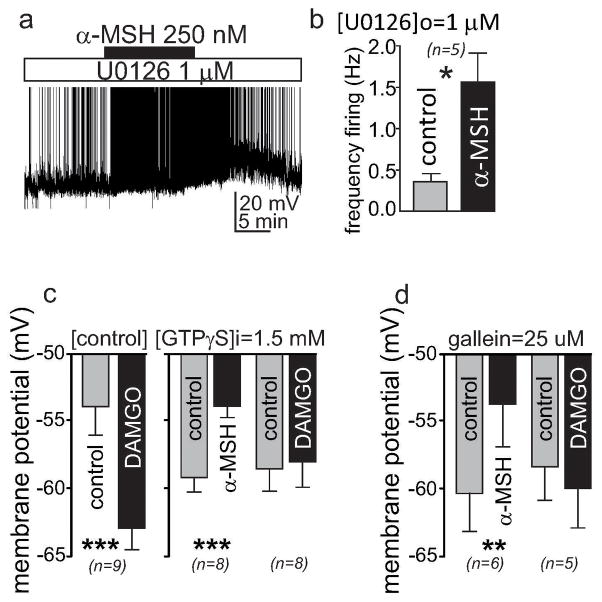
We next examined if α-MSH depolarized neurons through activation of the Gαs–adenylyl cyclase (AC)-cAMP-PKA pathway. PKAi (20uM intrapipette), a peptide inhibitor of PKA, failed to abolish the α-MSH induced increase in firing frequency in PVN neurons during whole cell recording, (not shown) or to block α-MSH induced depolarization of membrane potential (Fig. 1e). Inhibition of AC with SQ22536 (25μM) similarly failed to block α-MSH induced depolarization of membrane potential (Fig. 1f). Finally, we examined whether blocking G protein signaling can inhibit MC4R-mediated depolarization by loading cells with the inhibitory GDP analogue, GDPβS. To verify that GDPβS blocked G-protein function, we examined effects of activation of D1 dopamine receptor, known to depolarize neurons via activation of Gαs. Activation of D1 dopamine receptor by the D1 agonist 5 μM SKF83822 depolarized PVN neurons (Fig. 1g). GDPβS (5 mM) blocked D1 mediated depolarization, but failed to block α-MSH induced depolarization of PVN MC4R neurons (Fig. 1g). Several other inhibitors of components of G protein signaling were also ineffective in blocking neuronal firing or depolarization of PVN MC4R neurons by α-MSH (Extended Data Fig. 1a–d), including GTPγS (a non-hydrolyzable GTP analogue, 1.5 mM), gallein (a Gβγ blocker, 25 μM), or U0126 (a MAPK inhibitor, 1 μM). Together, these findings support a novel hypothesis: a G protein-independent pathway for MC4R mediated depolarization of PVN neurons.
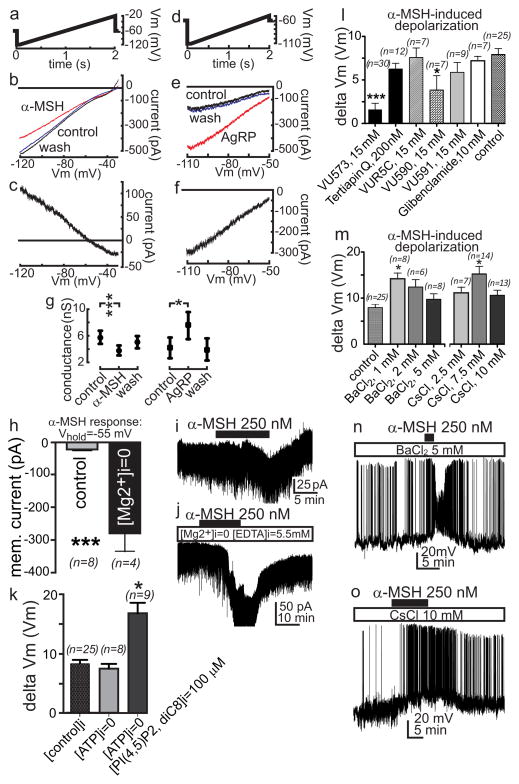
The currents underlying MC4R mediated depolarization of PVN neurons were then characterized with current–voltage (I–V) analysis in external 20 mM K+. Using whole cell recording from voltage clamped neurons pre-treated with 0.5 μM tetrodotoxin (TTX), 200 μM picrotoxin (PTX) and 1 mM kynurenic acid (KYN), current responses of PVN neurons to voltage ramps (−120 to −20 mV for 2 s) were used to generate the I–V relationships of the α-MSH induced response (Fig. 2a–c). α-MSH significantly (33%) decreased cell membrane conductance from 5.7 +/−1.0 nS in control to 3.8 +/− 0.8 nS (Fig. 2g), with current generated by α-MSH being linear from −120 to −60 mV that rectified inwardly at membrane potentials negative to its reversal of polarity. Its reversal potential was near −48.1 +/− 3.4 mV in the presence of 20 mM external K+, with an estimated reversal potential of K+ near −53.5 mV (Nernst equation). These results, in addition to those performed in 3.1 mM external [K+] (estimated ErevK+= ~−98 mV, not shown), suggest that α-MSH generates an inward current by closure of a steady state K+ mediated inward rectifier current, as in ARC neurons8.
Fig. 2. α-MSH depolarizes and AgRP hyperpolarizes hypothalamic PVN MC4R neurons by regulating Kir7.1.
a–c; g, Current-voltage (I–V) analysis of MC4R PVN neurons indicates that 250nM α-MSH generates depolarizing current by closure of inward rectifying K+ channels. d–g, I–V analysis of PVN MC4R neurons indicates that 50nM AgRP generates hyperpolarizing current by opening of inward rectifying K+ channels. Current responses of voltage clamped PVN neurons to voltage ramps (a&d) were used to generate the I–V relationship of the α-MSH and AgRP-induced response in the presence of 20 mM external K+. The resultant I–V relationships (b&e) indicate that application of α-MSH and AgRP, respectively, decrease and increase the cell membrane conductance which rectifies inwardly at membrane potentials negative to its reversal of polarity that are near the estimated reversal potential of K+ (α-MSH, n=14, b–c; g, AgRP, n=6, e–g). h–j, Depletion of intracellular Mg2+ significantly increases K+ efflux through MC4R regulated channels at membrane potentials positive to the ErevK+. Averaged groups (h) and their representative current responses to α-MSH (i–j)from PVN MC4R neurons voltage clamped at −55 mV in normal control (i) and in Mg2+ depleted (j) internal solutions. k, While zero ATP pipette solution slightly attenuated, the addition of 100 μM PI(4,5)P2 diC8 to zero ATP solution significantly increased the amplitude of the α-MSH induced depolarization recorded from PVN MC4R neurons. l, Effects of blockers of inward rectifying K+ channels on α-MSH (250 nM)-induced depolarization of PVN MC4R neurons compared to α-MSH alone (control) m–o, Effects of various concentrations of BaCl2 or CsCl on the α-MSH induced depolarization measured in current clamp using similar protocol as in l. The α-MSH -induced depolarization was not blocked in higher concentrations of BaCl2 (m–n) or CsCl (m&o), exhibiting a greater amplitude in the presence of these non-selective Kir blockers. Bars indicate mean +/−SEM, *p<0.05, ***p<0.001, unpaired t test.
We next tested the hypothesis that AgRP hyperpolarizes cells by activating K+ mediated currents. Current responses of PVN neurons to voltage ramps (−110 to −50 mV for 2 s) were used to generate I–V relationships of the AgRP-induced response in 20 mM external [K+] (Fig. 2d–f). Application of AgRP (50 nM) significantly increased membrane conductance (75%, Fig 2g), and the AgRP-activated current displayed a reversal of polarity (−46.7 +/− 3.0 mV) and rectification properties similar to α-MSH, suggesting that AgRP increases the density of an inward rectifying K+ current.
A hallmark of Kir channel-mediated current is the relative blockade of K+ outward current by intracellular polyamines and Mg2+ at membrane potentials positive to the ErevK+9. To further characterize the MC4R-regulated current, we examined whether the amplitude of K+ outward current affected by α-MSH is greater in Mg2+ depleted intracellular solution. Recordings from PVN neurons voltage clamped around −55 mV indicated that the amplitude of the α-MSH regulated current was ~10x greater when intracellular Mg2+ was depleted compared to control (Fig. 2h–j). Another characteristic of Kir channels is sensitivity to PIP2(4,5) 10. While this response is attenuated in zero ATP internal solution in which phospholipid synthesis is blocked (Fig. 2k), addition of 100 μM PI(4,5)P2 diC8 to the internal solution potentiated the α-MSH-induced response. (Fig. 2k).
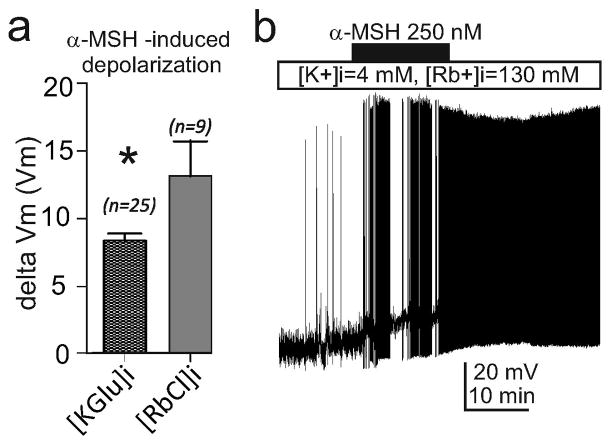
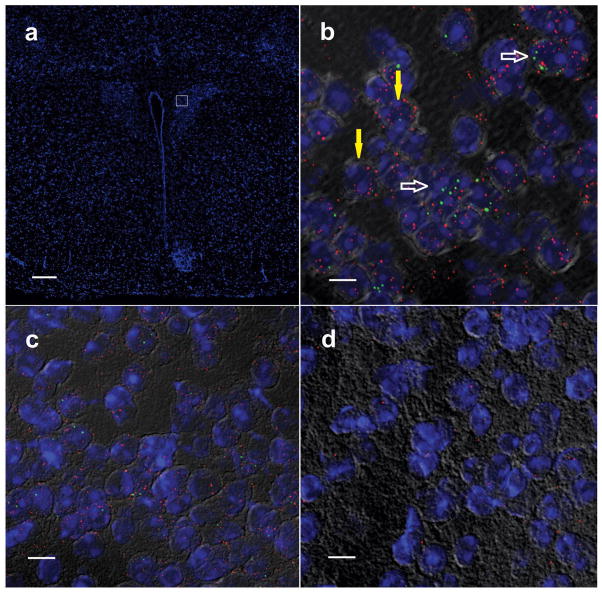
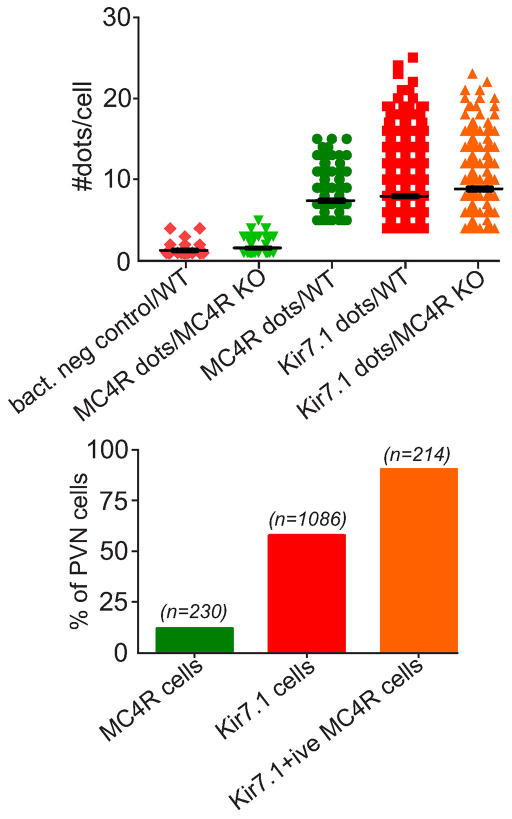
To identify the subtype(s) of Kir channels involved in the α-MSH induced depolarization, we used a panel Kir channel blockers (Fig. 2l, and Supplementary Table 1) with previously characterized channel subtype specificity11. Additionally, we used the bee venom tertiapin Q, a blocker of Kir3.x and Kir1.1 and glibenclamide, a blocker of Kir6.x/SURx. The depolarizing effect of α-MSH was inhibited ~80% by 15 μM VU573, a selective blocker of Kir2.3, Kir3.x and Kir7.1, and blocked by the Kir7.1 blocker VU590, but not VUR5C, an inactive VU573 analogue, tertiapin Q, glibenclamide, or VU591. These data suggest that Kir7.1 generates the current underlying the α-MSH-induced depolarization in mouse PVN neurons. Kir7.1 is reported to be resistant to external BaCl2 or CsCl, at concentrations that block other Kir channels12, and the α-MSH induced depolarization persisted in the presence of BaCl2 or CsCl. The increased amplitude of this response in higher concentrations of BaCl2 (>1 mM) and CsCl (>2.5 mM), may result from non-selective blockade of other voltage sensitive outward currents (Fig. 2m–o). Additionally, Kir7.1 is more permeable to rubidium than other Kir(s)13, and when K gluconate in the patch pipette was replaced with RbCl (RbCl 130 mM and KCl 4 mM), α-MSH induced, Rb-mediated depolarization was observed and its magnitude was significantly greater than physiological K+-mediated depolarization (Extended Data Fig. 2). Using dual fluorescent in situ hybridization in sections of mouse PVN, we also determined that approximately 90% of PVN neurons expressing MC4R mRNA co-expressed Kir7.1 mRNA (Extended data Fig. 3–4).
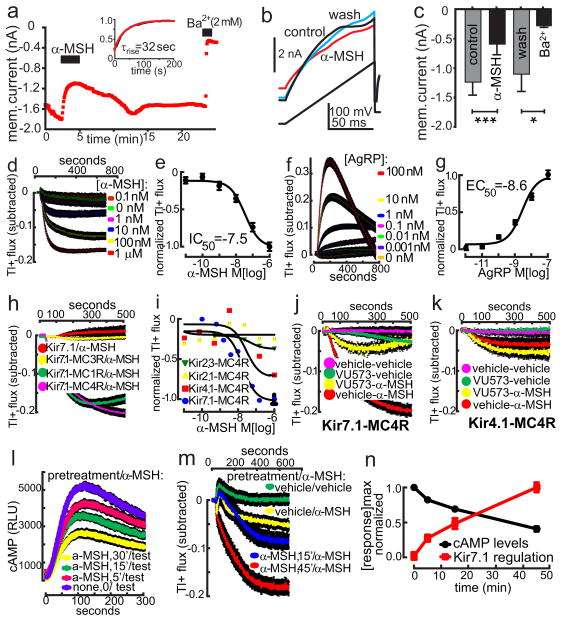
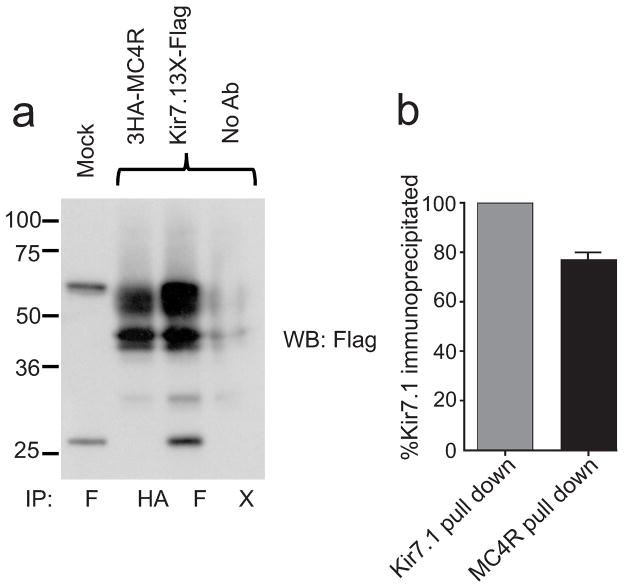
To confirm that MC4R signaling is capable of modulating Kir7.1 function, we transfected MC4R and Kir7.1 channels into HEK293 cells, using an M125R variant of Kir7.1 that exhibits higher unitary conductance than the native channel, previously demonstrated to allow detection of the channel in cell lines14. Whole cell recordings were performed 24–48 h after cotransfecting cells with MC4R, Kir7.1 M125R and GFP expression plasmids to examine effects of α-MSH on membrane current by examining the I–V analysis of α-MSH response. α-MSH significantly decreased the amplitude (>50%) and slope of current responses indicating closure of Kir7.1 channels (Fig. 3a–c). This effect was reversible, and the current amplitude was reduced to less than 25% of its own control by 2 mM Ba2+, consistent with the increased sensitivity of the Kir7.1 M125R variant to Ba2+14. Use of HEK293 cells allowed for a more direct assessment of kinetics of the α-MSH-induced current, indicating a rapid activation time course with an average τrise of 32 seconds. Cotransfection of tagged MC4R and Kir7.1 genes, followed by immunoprecipitation and western blot analysis showed a quantitative association of the two proteins in this system (Extended Data Fig. 5).
Fig. 3. α-MSH and AgRP couple MC4R to Kir7.1 in HEK293 cells.
a–c, Current responses of transfected HEK293 cells to voltage steps (a) and ramps (b) in control, 300nM α-MSH, and washout. Bath application of α-MSH significantly reduced the amplitude (c) and slope of responses to voltage steps and ramps in a reversible manner (bar graph indicates mean +/−SEM; *p<0.05, ***p<0.01, n=6, paired t test). d–g, α-MSH reduces flux (IC50 near 10−7.5 M, d & e) and AgRP increases flux (EC50 near 10−8.6 M, h & i) through Kir7.1 channels in a concentration–dependent manner. Concentration-response curves in e & g are plotted using the maxima from data in d & f. h–k, Specificity of melanocortin receptor-Kir subunit coupling. h, α-MSH -induced decrease in Tl+ flux in MC4R and MC1R expressing cells containing Kir7.1, but not in cells co-expressing Kir7.1 and the MC3R, or expressing Kir7.1 alone. i, α-MSH -induced decrease in Tl+ flux via the MC4R is observed in cells transfected with Kir7.1, more weakly in cells expressing Kir4.1, and is not in cells expressing Kir2.1 or Kir2.3. j, VU573 (10μM) blocks Tl+ flux in MC4R+Kir7.1 transfected cells. k, VU573 does not block MC4R-Kir4.1 mediated Tl+ flux in the transfected cell assay. l–m, Pre-incubation with 100nM α-MSH of MC4R-glo expressing HEK293 cells directly depresses a cAMP test response to a second exposure to 100nM α-MSH (l). Pre-incubation MC4R-Kir7.1 HEK293 cells with 100nM α-MSH directly increases the amplitude of the response of Kir7.1 to a second 100nM α-MSH exposure (m). n, Kinetics of the normalized maximal cAMP (black) and Kir7.1 (red) response to a single dose of 100nM α-MSH, calculated from Figs. l–m. In all Tl+ flux and cAMP accumulation assays, colored traces indicate mean and bars (black) indicate SEM.
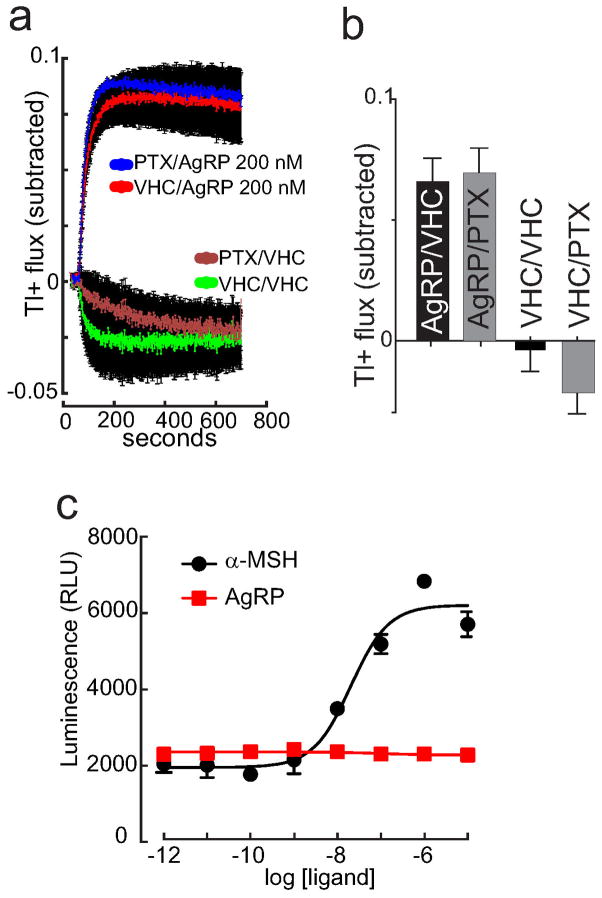
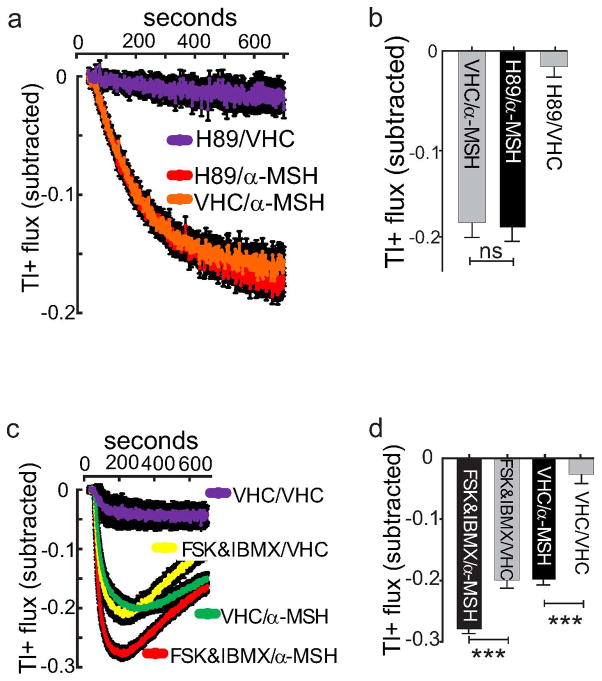
By loading HEK293 cells with a Tl+-sensitive fluorescent dye, Thallos, the flux of Tl+ ions through open K+ channels can be measured15. The effect of receptor modulation on channel conductance can then be studied by subtracting flux intensity after experimental treatments from levels after vehicle. Using this system, dose-response analysis indicated that α-MSH mediates a MC4R-dependent closure of Kir7.1 channels with an IC50 of 10−7.5M (Fig. 3d–e). Conversely, AgRP mediated a MC4R-dependent increase in Tl+ flux through Kir7.1, with an EC50 of 10−8.6M (Fig. 3 f–g). AgRP did not appear to couple the MC4R to the cAMP inhibitory G protein, Gαi16, or to recruit β-arrestin to the receptor (Extended Data Fig. 6a–c). These data support a G-protein independent mechanism for the MC4R-mediated regulation of Kir7.1 by AgRP as well. To examine the selectivity of coupling between melanocortin receptors and Kir7.1, we created stable HEK293 cells expressing Kir7.1 M125R alone, or Kir7.1 M125R plus MC1R, MC3R, or MC4R. α-MSH (100 nM) significantly decreased Tl+ flux in Kir7.1 HEK293 cells expressing MC1R or MC4R, but not MC3R (Fig. 3h). α-MSH (100 nM) significantly decreased Tl+ flux in HEK293 cells transfected with MC4R plus Kir7.1 or Kir4.1, but not cells expressing Kir2.1 or Kir2.3 (Fig. 3i). The Kir7.1 specific channel blocker VU573 blocked the α-MSH effects on Kir7.1 function in the HEK293 cells (Fig. 3j), as in the slice (Fig. 2l). However, VU573 had no effect on α-MSH inhibition of Kir4.1 in HEK293 cells (Fig 3k), suggesting the conductance regulated by α-MSH in MC4R PVN neurons primarily involves Kir7.1. PKA activity was also not required for α-MSH induced closure of Kir7.1 in HEK293 cells (Extended Data Fig. 7a–b), and we also observed a synergistic effect of α-MSH and cAMP on Kir7.1 closure, in this system (Extended Data Fig. 7a–d).
G protein-coupled signaling of the MC4R exhibits β-arrestin mediated desensitization. Pre-treatment of MC4R + Kir7.1 expressing HEK293 cells with α-MSH reduced the subsequent magnitude of the G protein-mediated cAMP response of these cells to α-MSH (Fig 3l). Supporting the argument that coupling of the MC4R to Kir7.1 is non-G-protein-mediated, the MC4R-dependent inhibition of Tl+ flux through Kir7.1 was hypersensitized by prior treatment with α-MSH (Fig. 3m). Thus, while the time course of acute effects of MC4R activation on Kir7.1 was rapid (Fig. 3a), the long term effects on the cAMP and Kir7.1 signaling pathways were highly divergent (Fig. 3n). While cAMP levels peak between 1–2 minutes after α-MSH treatment, inhibition of Tl+ flux by α-MSH treatment continues to increase up to 45 minutes post-treatment. Low dose AgRP treatment (1nM) increased Tl+ flux for up to 24h (data not shown); the apparent reduction in Tl+ flux after high dose AgRP treatment (e.g. Fig. 3f) is due to saturation of the fluorescent dye binding substrate.
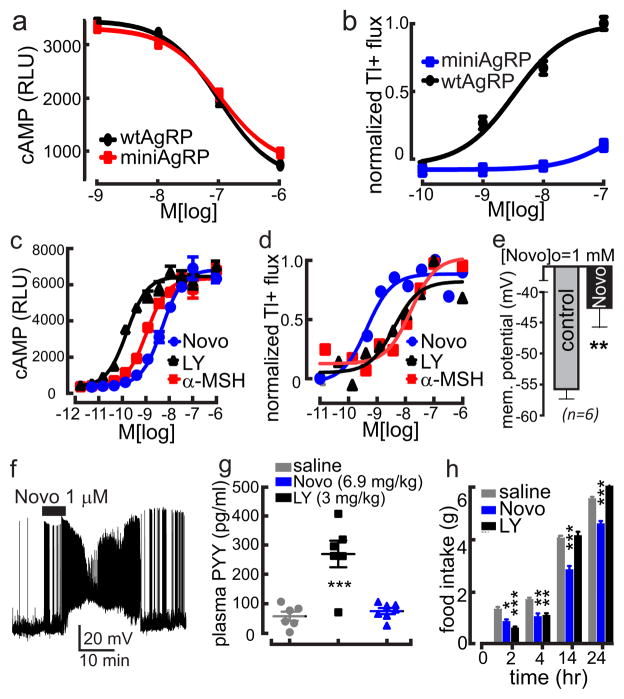
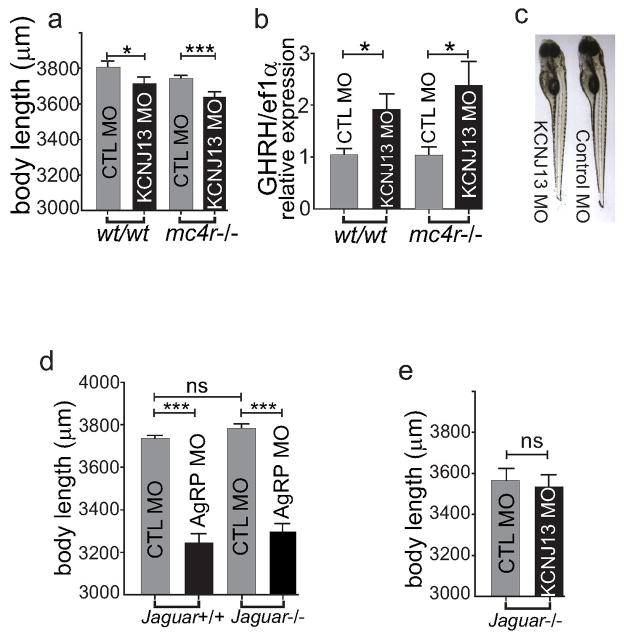
Additional data support a role for Kir7.1 in regulation of food intake by MC4R in vivo. The AgRP analogue (miniAgRP; AgRP87-120) retains normal affinity for MC4R, and potency in inhibition of MC4R coupling to Gαs (Fig. 4a), yet exhibits 70% reduction in its ability to stimulate food intake in rats5. In parallel with loss of orexigenic activity, this peptide has lost its ability to couple MC4R to Kir7.1 (Fig. 4b). Conversely, we have also identified an α-MSH analogue, MC4-NN2-045317 (Novo), that preferentially couples MC4R to Kir7.1 over GαS in cell culture, and potently depolarizes PVN MC4R neurons (Fig. 4c–f). MC4-NN2-0453 also exhibited biased actions at MC4R in vivo. In a cAMP-mediated response, the peptide was unable to induce intestinal PYY release in vivo18 (Fig. 4g), or ex vivo (Extended Data Fig. 8). In contrast, the peptide potently inhibited food intake at doses equimolar to other α-MSH analogues (Fig. 4h). Knockdown of Kir7.1 gene expression in WT and MC4R mutant larval zebrafish, but not Kir7.1 mutant jaguar zebrafish, produced a reduction in linear growth and upregulation of GHRH gene expression, responses reported previously for activation of the MC4R19, (Extended Data Fig. 9a–e), further supporting the argument that arguing that Kir7.1 acts downstream of MC4R.
Fig. 4. Biased agonists of the MC4R support a role for Kir7.1 in melanocortin signaling in vivo.
a, The potencies of wtAgRP (83-132, IC50, 9.9e-008) and miniAgRP (87-122, IC50, 1.0e-007) for inhibition of MC4R constitutive activity, measured by applying AgRPs indicated are not significantly different (p>0.1). b, Potencies of wtAgRP (3.6e-009) and miniAgRP (1.7e-007) are significantly different for stimulation of Kir7.1 activity. c–d, The α-MSH analogue MC4-NN2-0453 (Novo) is a biased agonist for coupling of the MC4R to Kir7.1. Coupling to intracellular cAMP: (Novo EC50 = 4.9×10⁻⁹ M; LY EC50 = 41.6×10⁻¹⁰ M;), Coupling to inhibition of thallium flux through Kir7.1 (Novo EC50 = 4.5×10⁻¹⁰ M; LY EC50 = 4.1×10⁻⁹ M; α-MSH EC50 = 1.6×10⁻⁸ M). e–f, Application of Novo induced significant depolarization of membrane potential in PVN neurons. g, ip administration of LY stimulated PYY release from L cells in vivo via an MC4R-dependent pathway, while NOVO did not. Data show mean and sem, ***p<0.001. (h) Novo is a potent inhibitor of cumulative food intake, following an overnight fast and administration of equimolar doses of compounds indicated (6.9 mg/kg Novo or 3 mg/kg LY) Data show mean +/− SEM, *p<0.05; **p<0.01, ***p<0.001, by paired t test (e), or 1-way ANOVA with Bonferroni post-test (g&h).
These data show the MC4R can depolarize or hyperpolarize hypothalamic PVN neurons in response to α-MSH or AgRP, respectively, through a novel G protein independent signaling pathway involving regulation of the activity of Kir7.1. While MC4R also is likely to couple to Gαs in most cells, cAMP/PKA-dependent activation of KATP channels, producing α-MSH induced hyperpolarization, has been demonstrated in MC4R neurons in the brainstem20. Thus, while Kir7.1 signaling appears to be essential for depolarization of PVN MC4R neurons by α-MSH, Gαs signaling and elevation of cAMP may be depolarizing or hyperpolarizing, depending on the cellular context (Extended Data Fig. 10).
Direct interactions between GPCRs and K+ channels, such as binding and regulation of Kv4.3 by the type 1 angiotensin receptor21, or of Kir4.1 and Kir4.2 by the Ca2+ sensing receptor22 have been previously reported. Kir7.1 is a widely expressed inwardly rectifying potassium channel, suggesting the possibility of regulation by other GPCRs. Mutations in Kir7.1 cause pigmentary defects in the jaguar zebrafish23. Interestingly, we also find that the MC1R couples to Kir7.1, suggesting that the induction of pheomelanin (yellow-red pigments) synthesis, may involve MC1R-Kir7.1 regulation by agouti24.
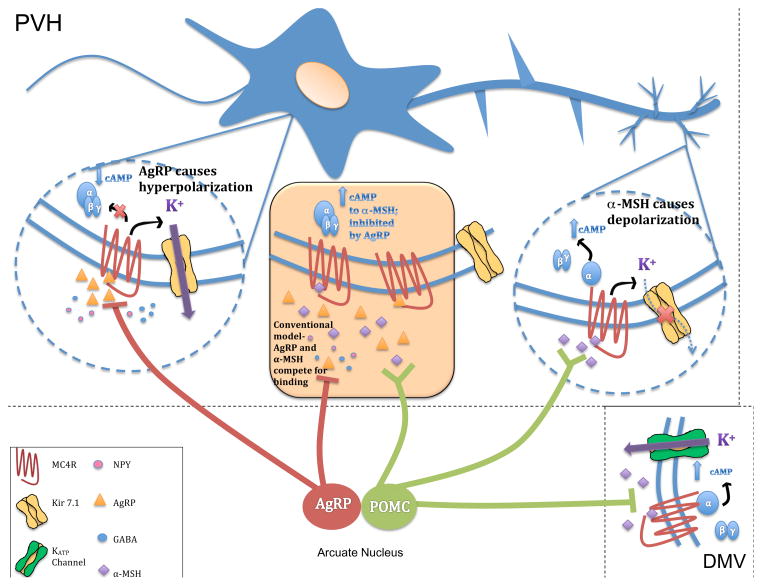
The discovery of independent agonist activity for AgRP through opening of Kir7.1 also necessitates revision (Extended Data Fig. 10) of the current neuroanatomical model of hypothalamic melanocortin signaling, in which AgRP acts primarily by antagonism of α-MSH25. Preliminary data from a limited electron micrographic reconstruction of the PVN, showing dendrites specifically targeted by POMC synapses and cell soma specifically targeted by AgRP synapses, suggests a potential neuroanatomical basis as well for independent action of AgRP and α-MSH26. The non-G-protein signaling mechanism reported here may also provide a basis for understanding the persistent action of AgRP on food intake5, and the gene dosage effect of MC4R mutations4, not typically seen for GPCRs. Furthermore, the pronounced bias for coupling the MC4R to Kir7.1 of α-MSH analogue MC4-NN2-0453, shown to potently inhibit food intake in the absence of a pressor response, suggests that biased agonists of the MC4R may retain useful therapeutic properties.
METHODS
Hypothalamic slice electrophysiology
MC4R-GFP mice, backcrossed onto the C57BL/6J background, were previously characterized by dual immunohistochemistry and in situ hybridization to validate that GFP-positive neurons in the PVN expressed MC4R RNA27. Randomly selected MC4R-GFP male and female mice, 8–12 weeks of age, were deeply anaesthetized with isoflurane prior to decapitation. The brain was entirely removed and immediately submerged in ice-cold, gassed (95% O2, 5% CO2) artificial cerebrospinal fluid (aCSF), containing (in mM): 126.2 NaCl, 3.1 KCl, 2 CaCl2, 1 MgCl2, 1 NaH2PO4, 26.2 NaHCO3, 10 glucose and 11 sucrose (320 mosm/kg, pH 7.39 when gassed with 95% O2, 5% CO2 at room temperature). Brain blocks of containing hypothalamus are then made by trimming the whole brains while immersed in oxygenated, near-freezing aCSF and glued to a dental-cement cast customized to the size of the block mounted on a plate with adjustable angle. Brain slices of 200 μm thicknesses were then cut at angle range between 44° and 49° in reference to horizontal plane and transferred to a glass beaker containing oxygenated ACSF at 31 °C. After an incubation period lasting at least one hour, a slice is transferred to a recording chamber (~2.0 ml in volume), where it is submerged and immobilized with nylon strands drawn taut across a C-shaped platinum wire (1 mm o.d.), and perfused with warmed (31–32 °C) oxygenated ACSF at a rate of 2–3 ml/min.
EGFP-fluorescent neurons were unambiguously identified and patched using combined epifluorescence and IR-DIC optics. Fluorescent neurons of healthy IR-DIC appearance but of every level of fluorescence brightness were chosen for electrophysiological recordings.
Drugs were either added to aCSF and bath applied to the slice via the perfusion system (for extracellular applications) or to the pipette solution to perform whole cell recordings (for intracellular applications). The small volume of the recording chamber relative to the flow rate assured a complete exchange of solution occurring in less than 1 minute. The persisting effects of a peptide were therefore due to prolonged effects rather than a slow wash out.
In this study, whole cell patch clamp recordings were used to obtain information about action potential firing activity, and membrane potentials and currents. Unless stated otherwise, whole cell recordings were performed using patch pipettes of 3.4 MΩ to 5 MΩ resistance when filled with a solution containing (in mM); 125 K gluconate, 8 KCl, 4 MgCl2, 10 HEPES, 5 NaOH, 4 Na2ATP, 0.4 Na3GTP, 5 Na2-creatine phosphate, 7 sucrose and 7 KOH which resulted in a pH ~7.23 and osmolality of 295–300 mosmol/kg. The permeability of the α-MSH regulated channels were investigated by replacing K gluconate and KCl with 130 RbCl and 4 KCl, but otherwise similar condition. The examination of effects of Mg2+ free internal solution on the α-MSH-induced current was conducted in voltage clamp mode from PVN neurons held at −55 mV. The Mg2+ free internal solution contained 103 K-gluconate, 30 KCl, 10 HEPES-KOH, 0.5 CaCl2, 5.5 EDTA-KOH, pH 7.23, with osmolality 304 mosmol/kg. The ATP free solution contained 83 K-gluconate, 30 KCl, 10 HEPES-KOH, 0.5 CaCl2, 4 MgCl2, 5.5 EGTA-KOH, pH 7.2 and osmolality 298 mosmol/kg.
Neuronal integrity was assessed by all of the following: small holding current (≤30 pA at −70 mV) when voltage clamped, large amplitude rebound spikes, the ability to fire and lack of obvious morphological deterioration (i.e. lack of blebbing and nucleus not visually present).
In order to quantify the action potential firing and amplitude of depolarization induced by α-MSH, current clamp recordings were performed in continuous mode while the membrane potential of neurons were held between −55 to −60 mV to prevent continuous spontaneous action potential firing. Effects of AgRP were measured while cells were held around −50 mV to allow neurons to fire action potentials spontaneously. The firing frequency and membrane potential of neurons was measured during a 3 min period before the application of the peptides, and for another 3 min period 7–11 minutes after administration of peptide, and results compared.
Voltage clamp recordings in episodic mode were used to study I–V relationships of the α-MSH and AgRP responses. The series resistance was not compensated but was monitored during voltage clamp experiments. Trials were excluded if the series resistance changed more than 10–15 MΩ during episodic voltage clamp recordings. To characterize the currents generated by peptides, we compared the I–V relationships of the TTX pre-treated PVN neurons obtained in control with that in the presence of bath applied peptide and wash. Individual I–V relationships were established by analyzing the current responses of each cell to a depolarizing voltage ramps of 2 s duration applied from hyperpolarized potentials. This protocol was repeated at regular intervals in control media, in the presence of a peptide, and after 10–15 min of washout of the peptide. Current and voltage traces from between 3–4 successive trials in control conditions were then digitally averaged offline and were compared with similarly averaged traces from an identical number of trials obtained after wash out. The values of the averaged current responses elicited under each condition were then plotted as a function of the corresponding values during voltage ramps to obtain individual I–V relationships.
Data were acquired at 10 kHz using a MultiClamp 700A amplifier (2000X gain, −3dB filter freq: 5 kHz) and Clampex 10.0.1 software (Axon Instruments, Union City, CA). GraphPad Prism 5.0 (Graphpad Software, Inc., San Diego, CA) and Excel 2010 (Microsoft Corp., Bellevue, WA were used for data analysis. Statistical tests used included the paired t test, when examining response of the same neurons before and after treatment with a compound, and the unpaired t test when comparing the responses of different sets of neurons. All studies were approved by the animal care and use committee of Vanderbilt University.
Thallium assay
HEK293 cells (ATCC, tested mycoplasma negative) stably expressing human MC4R and Kir7.1(M125R) grown in MEM medium with 10% FBS without antibiotics were suspended in 20 μL of medium plus 1μg/ml tetracycline, used to induce expression of the transfected tet-sensitive Kir7.1 gene, and plated in 384-well poly-D-lysine coated optical bottom plates (BD Biosciences) at 20,000/well. Plates were incubated overnight for 22–24 hours in the cell incubator at 37 °C, 5% CO2. The following day, each individual cell plate was washed and replaced with 20 μL assay buffer (Hank’s Balanced Salt Solution with HEPES). A Thallium–sensitive dye, Thallos (TEFLabs), was diluted with assay buffer to 0.9 ng/ml, and 20 μL was loaded into each well. Cell plates were kept in the dark for 1 hour at room temperature and then washed again with assay buffer to remove residual extracellular dye. Cell plates were then incubated with peptides, drugs and/or controls as indicated for 25 minutes (unless indicated otherwise). Thallium (10μl of a 0.48 mM stock in assay buffer) was then loaded and fluorescence generated by thallium influx was recorded for up to 15 minutes, as indicated, using a Hammamatsu FDSS plate reader.
Zebrafish
Wild-type Tab 14 or AB strain zebrafish were raised and bred at 26°C–28°C, with 14 h light/10 h dark cycle. All zebrafish studies were conducted in larvae unselected with regard to gender. Larval stage was determined according to Kimmel et al. (1995). The mc4r−/− mutant strain were obtained from the Sanger Institute Zebrafish Mutation Project; the jaguar (G157E) mutant were kindly provided by DM Parichy (Univ. Washington). All studies were approved by the animal care and use committee of Vanderbilt University.
β-arrestin recruitment assays
β-arrestin recruitment was measured using PathHunter™ hMC4R cells (DiscoverX; Fremont, CA) stably expressing pro-link attached β-arrestin proteins according to the manufacturer’s protocol. Cells were plated in 384-well plates at 5,000 cells/well. The following day, cells were treated with drug and incubated at 37 °C for 90 minutes. Substrate was added to each well and luminescence values were obtained after 60 minutes at room temperature using a Spectromax plate reader (Molecular Devices; Sunnydale, CA).
Morpholino oligonucleotide (MO) injection, and body length measurement
MOs, described below, were dissolved in nuclease-free water and stored in −20 °C as 1 mM stock. Serial dilutions were made using nuclease-free water to 0.01, 0.05, 0.1, 0.2, 0.3, and 0.4 mM working solution with 20% Phenol Red (Sigma; 0.5% in DPBS, sterile filtered, endotoxin tested). Before the injection, MOs were denatured at 65 °C for 5 min and quickly spun to avoid the formation of aggregates. Three to five microliters was loaded in a microinjection machine, and embryos at one or two cell stages were injected with 1–2 nl of a solution containing antisense targeting morpholino or standard control oligo. Each MO oligo injection was repeated at least three times, and doses were adjusted to optimize the phenotype-to-toxicity ratio. Following morpholino injections, embryos were raised in egg water, changed daily, under standard light/dark cycle up to 6 days post-fertilization (dpf). Dead embryos were excluded at 1 dpf. Embryos were assayed for quantitative RT-PCR of GHRH at 5 dpf. Linear body length (forehead to tail fin) was determined using a micrometer at 5 dpf. Embryos were mounted in 2.5% methyl cellulose, and images were taken by AxionVision (Ver3.1) software with a Lumar V12 Stereo Microscope (Carl Zeiss).
Quantitiative PCR
Embryos were homogenized in lysis buffer with a sonic dismembrator (model 100, Fisher Scientific, Pittsburgh, PA). Total RNA was extracted using an RNeasy Mini Kit (QIAGEN, Valencia, CA) according to the manufacturer’s instructions. To remove genomic DNA, On-Column DNase Digestion was performed using an RNase-Free DNase Set (QIAGEN). One microgram of purified total RNA was reverse transcribed with iScript cDNA Synthesis Kit (Bio-Rad, Hercules, CA). Q-PCR primers were designed by Beacon Designer 7.0 (Premier Biosoft International, Palo Alto, CA) to minimize primer self-dimerization, and primer sequences are indicated below. Q-PCRs were performed using 2 μl cDNA (20 ng) as template, 5 pmol of each of forward and reverse primers, and 2X Power SYBR PCR mix (Applied Biosystems, Carlsbad, CA) with nuclease free water (Promega, Madison, WI) to make the final volume to 20 μl in a 96-well plate (Bioexpress, Kaysville, UT). Q-PCRs were performed using an Mx3000PTM (Stratagene, Santa Clara, CA). The PCR cycle was performed according to manufacturer’s instructions with initial denaturation at 95 C for 10 min, followed by 45 cycles of 95 °C 20 s, 60 °C, 60 s. At the end of the cycles, melting curves of the products were verified for the specificity of PCR products. A standard curve with serial dilutions of cDNA sample was performed on each plate. All measurements were performed in duplicate, and Graph Pad Prism 5.0 was used for the interpretation and analysis of data.
Morpholino and QPCR oligonucleotides
Antisense morpholino oligonucleotide (MO) against the ATG translation initiation site of agrp, kcnj13 and standard control MO were designed and synthesized by GeneTools, LLC (Philomath, OR USA).
For morpholino injection-
agrp ATG MO: 5′TTTCAGCACCGCCGTCGTCATTTTC3′
Zebrafish Standard Control MO: 5′ CCTCTTACCTCAGTTACAATTTATA 3′
KCNJ13 MO targeting intron-exon boundary: 5′ CAAATGCACCTGATGGGCAGAGAAA 3′
For QPCR -
ghrh (growth hormone releasing hormone), forward primer 5′ GTGCTATGCTGCTTGTTACTATC 3′, reverse primer 5′ ATACTTGACTGACGCTTTACATTG 3′.
ef1α (Elongation Factor 1 alpha), with forward primer 5′ CTGGAGGCCAGCTCAAACAT 3′, reverse primer 5′ ATCAAGAAGAGTAGTACCGCTAGCATTAC 3′.
MC4R-mediated PYY release assay
Male C57BL/6J mice were ordered from The Jackson Laboratory (Bar Harbor, ME). Experiments were run when the mice reached 12 weeks of age. On the day of study, the mice were fasted during the daytime for 4 hours to reduce plasma PYY levels to baseline. Following the fast, mice were randomly selected to receive an intraperitoneal injection of saline (vehicle), 3 mg/kg of the α-MSH agonist LY2112688 (LY), or an equimolar dose of 6.9 mg/kg of MC4-NN2-0453 (NOVO). MC4-NN2-0453 corresponds to the previously reported peptide 1917. Numbers for each test were chosen based on prior experience suggesting significance could be achieved with as few as 6 animals per condition. At 10 minutes post-injection, the mice were quickly bled via the submandibular vein to obtain approximately 200 μl of whole blood. The blood was collected into vials containing EDTA and protease inhibitor cocktail for mammalian tissues (Sigma-Aldrich P8340) to prevent degradation of PYY. The vials containing whole blood were spun for 15 minutes at 1500 X G at 4 °C to isolate the plasma. The plasma was stored at −80 °C until PYY levels were assayed. PYY was assayed in duplicate using the Milliplex magnetic bead based mouse metabolic hormone panel (Millipore MMHMAG-44K, 1-plex kit for total PYY). Results were analyzed against a standard curve and concentrations were determined using Milliplex Analyst 5.1 software. Results were plotted and analyzed using Graphpad Prism. All animal care and experimental procedures were approved by Vanderbilt University Medical Center Institutional Animal Care and Use Committee.
Food intake analysis
18 wild-type male C57BL6 were obtained from Jackson Laboratory. Upon arrival, mice were single-housed and allowed to acclimatize at 22 °C–24 °C with a 12-hour light/12-hour dark cycle with standard chow and water provided ad libitum for one week. For 5 days after the environment acclimation, mice were handled during the light cycle and given subcutaneous injections of 100μL of saline to get them accustomed to being handled. During this time, daily food intake was also measured to establish a baseline. Mice were food deprived for 16 hours prior to drug treatment, starting shortly before the beginning of the dark cycle on the fifth day. Experiments were blinded; drug compounds were prepared and coded the morning of the injections by an individual who would not be conducting the experiment. The randomly selected experimental groups were as follows: 6 animals were given vehicle (100μL of saline), 6 animals were given 100μL of 3.0 mg/kg LY2112688 (LY), and 6 animals were given and equimolar dose of MC4-NN2-0453 (NOVO; 100μL of 6.9 mg/kg) subcutaneously. Numbers needed to achieve significant inhibition of food intake by a melanocortin compound versus saline were based on prior experience. Food intake was measured at 2 hours, 4 hours, 14 hours, and 24 hours after injection. The data was collected and analyzed using GraphPad Prism. Statistical significance was established using one-way ANOVA and Bonferonni post-hoc with a p<0.05 significance value. All animal care and experimental procedures were approved by Vanderbilt University Medical Center Institutional Animal Care and Use Committee.
Coimmunoprecipitation and Western blotting
HEK293T cells were plated in 6 well plates and transfected with indicated plasmids 24 hours prior to the experiment. Cells were rinsed once with PBS and proteins were crosslinked with 0.5 mM Dithiobismaleimidoethane (DTME) in PBS for 30 min at room temperature. Crosslinking solution was removed and remaining crosslinker was quenched using a quenching solution (20 mM Tris-HCl PH 7.4, 5mM L-Cystein) for 10 min at room temperature. Cells were lysed in 0.1% N-Dodecyl- -Maltoside in PBS with protease inhibitors for 20 min, lysates were spun at 10000 rpm for 10 min and supernatants were transferred to new tubes. Lysates were incubated with indicated antibody (M2 anti-flag, Sigma #F3165; anti-HA monoclonal antibody, Vanderbilt Antibody and Protein Resource, cat #12CA5) at 1:5000 with rotation for 1 h at RT. Antibodies were pulled down using protein-G coated magnetic beads (Dynabeads, Life Technologies). Beads were washed 3 times with lysis buffer and proteins were eluted and crosslinking reversed with sample buffer containing 100 mM DTT. Samples were separated by SDS- PAGE and membranes blotted using M2 anti-Flag 1:5000. Blots were revealed by ECL and film scanned. Densitometry analysis was done using Adobe Photoshop. n=2.
Mucosal electrophysiology
Male C57BL/6J mouse descending colon mucosa devoid of overlying muscle was cut into 6 adjacent pieces and each placed between the two halves of an Ussing chamber (aperture 0.17 cm2) and bathed in oxygenated Krebs-Henseleit (KH) buffer (in mM: 117 NaCl, 24.8 NaHCO3, 4.7 KCl, 1.2 MgSO4, 1.2 KH2PO4, 2.5 CaCl2 and 11.1 D-glucose), 5 ml on both sides. Mucosae were voltage-clamped at 0 mV and the resultant vectorial ion transport measured as short-circuit current (Isc) as described previously28. After a 15 min equilibration period, vasoactive intestinal peptide (VIP, 10 nM) was added to stimulate epithelial anion secretion and 5–10 min later (once the VIP maximum had been achieved) a single concentration of either MC4-NN2-0453 (3 nM - 3 μM) or α-MSH (300 nM) was administered. Consequent MC4R mediated reductions in Isc were measured for 20 min before a control concentration of PYY (10 nM) was added to reduce Isc levels via epithelial Y1 receptors28. All additions were basolateral and changes in Isc were converted to μA.cm2. MC4R activity and individual peptide responses were pooled and analyzed using Graphpad Prism (version 5). All animal care and experimental procedures were approved by the King’s College London Ethical Review Process Committee.
Fluorescent in situ hybridization for MCR4 and KIR7.1 mRNA
Various mRNA species expressed by PVN neurons were visualized with a variation of FISH (fluorescent in situ hybridization) called RNAscope (ACD; Advanced Cell Diagnostics, Inc., Hayward, CA). RNAscope cDNA probes and detection kits were purchased from ACD and used according to the company’s online protocols. The probe sets directed against MCR4 and KIR7.1 mRNA were designed from sequence information from the mouse RefSeq mRNA IDs NM_016977 and NM_001110277, respectively.
Four wild type male MC4-GFP littermates were sacrificed by an overdose of Nembutal (100 mg/kg, IP) and brains quickly removed and frozen in powdered dry ice. Brains from three MCR4 knockout mice 4 were prepared the same way. All brains were stored at −80 ° C until cut on a cryostat (Leica CM3000). 16 μm sections were adhered to warm Fisher plus slides (Fisher Scientific) and immediately refrozen. Slides were stored at −80 °C until fixed with ice cold 4% paraformaldehyde according to the ACD protocol for fresh frozen tissue. After fixation for 15 min, slides were dehydrated in an ethanol dilution series (50%, 70%, 100% X 2). Slides were then air dried for 5 min and a hydrophobic barrier was drawn around each section with an Immedge barrier pen. Sections were then incubated with ACD’s pretreatment 4 solution for 30 minutes at room temperature in a humidified chamber. After pretreatment, sections were incubated with RNAscope probes and a series of signal amplification steps according to the ACD protocol for the Fluorescent Multiplex Kit. In brief, incubation steps included: probe mixtures at kit recommended dilutions for the C1 channel (blank or probes for ubiquitin C mRNA), the C2 channel (MCR4 mRNA) and the C3 channel (KIR7.1 mRNA) for 2 h at 40 °C, wash X 2, AMP-1 FL reagent for 30 min at 40 °C, wash X 2, AMP-2 FL reagent for 15 min at 40 °C, wash X 2, AMP-3 FL reagent for 30 minutes at 40 °C, wash X 2, AMP-4 FL alt A or B reagent for 15 min at 40 °C, wash X 2, DAPI reagent for 1–2 min at room temperature, remove standing liquid and immediately cover slip with either SlowFade Gold (Molecular Probes) or Aqua-Polymount (PolySciences, Inc). 40 °C incubations were carried out in a HybEZ oven (ACD). Each run of 5 to 10 slides included one positive control (3 probe sets to house-keeping gene mRNA, ACD) and one negative control (3 probe sets for bacterial mRNA, ACD). 3–6 sections of the PVN from each animal, representative of rostral (AP = −0.58 to −0.80 relative to bregma), middle (AP = −0.80 to −1.0) and caudal (AP = −1.0 to −1.2; Franklin and Paxinos, 199729) levels, were processed for imaging.
Sections were imaged with a Zeiss 710 scanning confocal microscope using either a LD C-Apochromat 40x/1.1 water lens or a Plan-Apochromat 63x/1.40 oil lens. Z stacks were done on all sections using pin hole settings that resulted in 1.0 μm thick optical sections. Images were opened in Imaris (version 7.6), background subtracted and then contrast enhanced by increasing gamma to 1.5 to 2.3, then exported in tiff format for counting mRNA signals and labeled cells. Numbers of round, fraction delimited spots over and surrounding DAPI-labeled nuclei were manually counted with the aid of Metamorph software. Borders between cells were resolved with the help of grey scale DIC images overlaid on maximum intensity projections of the Z stacks. Negative control sections were used to count fluorescent dots that represented auto-fluorescent signals plus non-specific labeling by the multiplex kit. Sections of WT PVN hybridized with probes against bacterial mRNA were used to count background dots in the KIR7.1 channel and sections from MCR4 knockout mice hybridized with the probes against MCR4 mRNA were used to count background dots in the MCR4 channel. The average number of dots per cell for the MCR4 and KIR7.1 negative controls were 1.60 ± 0.87 STD and 1.31 ± 0.70, respectively (354 cells from 6 sections for MCR4 and 54 cells from 2 sections for KIR7.1; see supplemental figure). For cell counts in PVN sections from wild-type mice, cells were counted as positively labeled for MCR4 and/or KIR7.1 mRNA if the number of dots per cell exceeded the mean plus 3 X STD of their respective negative controls (5 or more dots for MCR4 and 4 or more dots for KIR7.1). Two of the images from WT mice were also analyzed by an automated cell counting multiplex FISH module from Indica Labs, Inc (Ahmedabad, India). The automated cell counts agreed with our manual count data with >90% of all MCR4 mRNA positive cells also positive for KIR7.1 mRNA in the PVN. All animal care and experimental procedures were approved by Vanderbilt University Medical Center Institutional Animal Care and Use Committee.
Extended Data
Fig. ED1. G protein signaling is not required for α-MSH induced depolarization of PVN MC4R neurons.
a & b, A MAP Kinase Kinase inhibitor, 1 μM U0126, fails to block α-MSH -induced increase in firing frequency of a PVN MC4R neuron recorded in whole cell configuration, (a, left panel shows a representative trace from one neuron, b, right panel shows mean ± SEM of firing frequency, *p<0.05, paired t test). c, GTPγS, a non-hydrolyzable GTP analogue, fails to block the depolarization induced by α-MSH, measured in whole cell configuration. This drug however does block the hyperpolarization induced by μ-opioid agonist, DAMGO (10 μM), (mean ± sem, ***p<0.001, paired t test). d, The Gβγ inhibitor gallein fails to inhibit α-MSH induced depolarization of PVN MC4R neurons (mean ± SEM, **p<0.01, paired t test), although it blocks the effects of DAMGO (10 μM) on membrane potential.
Fig. ED2. The charge generated by rubidium permeation through MC4R-regulated channels depolarizes PVN MC4 neurons.
Rb+ efflux through MC4R -gated Kir channels can generate greater α-MSH -induced depolarization of PVN MC4R neurons loaded with 130mM RbCl and 4 mM K+ through the recording pipette. Data show the mean and SEM (a, *p<0.05, unpaired t test), and a representative trace (b).
Fig. ED3. Co-expression of MC4R and Kir7.1 in the PVN.
a–d Detection of MC4R and Kir7.1 mRNA in PVN slices using fluorescent in situ hybridization (RNAscope). Images demonstrate the region of the hypothalamus under study (a; bar = 200 μm), colocalization of MC4R (green) and Kir7.1 (red) mRNAs (b, white open arrows = double labeled cells, yellow arrows = Kir7.1 expression only; bar = 10 μm), and negative controls (c, MC4R probe with tissue from MC4R knockout mice; bar = 10μm d, bacterial probe with tissue from wild type mice; bar = 10 μm).
Fig. ED4. Quantitation of MC4R and Kir7.1 RNA in PVN cells.
Single molecule RNA detection in sections was quantitated by counting fluorescent dots associated with individual cells (Fig. ED3). Background threshold was determined from the number of dots per cell in sections resulting from hybridization using a negative bacterial DNA control, or from hybridization of the MC4R probe to sections from the MC4R knockout mouse (a, columns 1 and 2). Threshold-subtracted dot numbers were then used to determine the % of PVN cells expressing MC4R or Kir7.1, and the % of MC4R cells expressing Kir7.1; cells were considered positive if the number of dots exceeded the mean of the negative controls by 3x std (b).
Fig. ED5. MC4R and Kir7.1 coimmunoprecipitate from transfected HEK293 cells.
a, Cells transfected with the indicated genetically flagged proteins were incubated with the reversible crosslinker dithiobismaleimidoethane (DTME) prior to lysis. Lysates were immunoprecipitated using the indicated antibody (F=Flag, HA=Hemaglutinin, X= no antibody), crosslinking was reversed with 100mM DL-dithiothreitol (DTT), and samples separated by SDS-PAGE. The membrane was blotted with the M2 anti-Flag antibody to detect Kir7.1. b, Relative quantitation of protein immunoprecipitation. Densitometry analysis to measure the amount of immunoreactive Kir7.1 material was performed using Adobe Photoshop. Amount of material immunoprecipitated with the Kir7.1-3X-Flag was set at 100%. Data shows relative amount of Kir7.1 immunoprecipitated using an antibody against the 3HA-MC4R protein; bars indicate range of data from 2 independent lanes. The protein molecular weight of Kir7.1 is calculated at 40kd, and the two larger bands represent glycosylated forms of the protein that are absent when the N-linked glycosylation site at position 93 is mutated (data not shown).
Fig. ED6. AgRP-induced increase in thallium flux does not involve Gi signaling or β-arrestin recruitment.
a & b, Subtracted Tl+ flux examining effects of 200 nM AgRP indicates that 8 hour pre incubation with pertussis toxin of MC4R and Kir7.1 expressing HEK293 cells fails to block AgRP -induced Kir7.1 regulation (mean +/−SEM, n=110). c, Addition of α-MSH stimulates β-arrestin recruitment to the MC4R in HEK cells stably expressing MC4R and β-arrestin fused to complementary fragments of β-galactosidase (DiscoverRx PathHunter assay, black line, LogEC50 = −7.69). In contrast, increasing concentrations of AgRP are without any effect using the same assay (red line). Individual points show mean +/− SEM.
Fig. ED7. Role of PKA and cAMP in the α-MSH-induced closure of Kir7.1.
a & b, Subtracted Tl+ flux assay examining effects of 100 nM α-MSH indicate that pre incubation with 1 μM H89, a PKA inhibitor, fails to block α-MSH -induced regulation of Kir7.1. Data show (a) mean +/−sem of kinetic traces, and (b) maxima (n=16). VHC = vehicle. c & d, Subtracted Tl+ flux assay examining effects of raising intracellular cAMP by forskolin (FSK, 20 μM) and IBMX treatment, with and without 100 nM α-MSH. Data show (c) kinetic traces, and (d) maxima. (IBMX: 100μM 3-isobutyl-1-methylxanthine, VHC: vehicle, mean +/− SEM, n=64, ***p<0.01, unpaired t test).
Fig. ED8. The α-MSH analogue MC4-NN2-0453 (NOVO) is a partial agonist of the MC4R in a murine colon mucosal assay of MC4R activity.
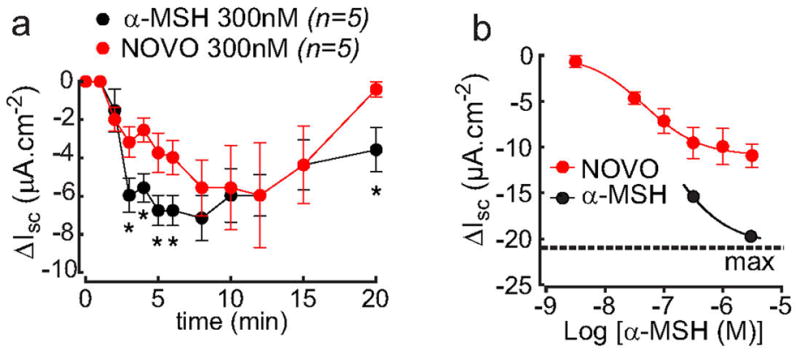
The activation MC4R inhibits vectorial ion transport across colonic epithelium, measured as reductions in the short circuit current (Isc). a, kinetic response to a sub-maximal basolateral concentration of α-MSH or NOVO, showing more rapid achievement of maximal activity with α-MSH, *p<0.05, 1-way ANOVA with Dunnett’s post test. b, full concentration-response to MC4-NN2-0453 (NOVO), showing that the compound does not achieve the efficacy reached by a maximal dose of α-MSH (denoted by the dashed line. Full characterization of the MC4R mediated α-MSH response in colonic epithelium is presented elsewhere18.
Fig. ED9. Effects of Kir7.1 and MC4R signaling in larval zebrafish.
a–c, Knock down of the Kir7.1 gene by KCNJ13 moropholino oligos suppresses the axial growth of larvae in wild type and mc4r null zebrafish. Sibling wild type or mc4r null zygotes were bred and injected with antisense KCNJ13 morpholino olinonucleotide at day 0. The axial body length was measured at 5dpf. Each group of 30 fish was harvested for RNA extraction and cDNA synthesis. Relative expression of GHRH mRNA was measured and normalized to the house keeping gene ef1a with qRT-PCR (b). The wild type fish that were injected with MO against KCNJ13 expressed significantly higher copies of GHRH mRNA than those that were injected with control MO. (control MO, n=9, 1.056+/−0.116 vs KCNJ MO, n=9, 1.935+/− 0.294, unpaired t test, *p <0.05). MC4R null fish that were injected with KCNJ13 MO have significantly higher GHRH expression than MC4R null fish that were injected with control MO (control MO, n=9, 1.040+/−0.164 vs KCNJ MO, n=8, 2.395+/−0.461, one way ANOVA, p< 0.05). c, representative WT fish injected with KCNJ13 MO vs control MO. d–e, jaguar wild type and null mutant siblings were bred and injected with 7.5ng non-targeting standard control or 7.5ng antisense morpholino oligonucleotide targeting agrp or kcnj13. d, Knockdown of AgRP with AgRP MO in the absence of Kir7.1 also reduces larval growth (mean+/−sem, n=43, ***p<0.001, unpaired t test). e, The deletion of Kir7.1 in jaguar null blocks effects of KCNJ13 MO on MC4R mediated inhibition of growth (mean+/−sem, n=58, unpaired t test).
Fig. ED10. A model for α-MSH and AgRP signaling at PVN MC4R neurons.
Data presented here supports a model in which MC4R may couple to both Gαs signaling and regulation of Kir7.1 activity in PVN MC4R neurons. α-MSH results in elevation of intracellular cAMP through activation of Gαs, and inhibition of K+ efflux through Kir7.1, both of which are depolarizing. AgRP lowers the constitutive activity of the MC4R and blocks α-MSH binding, but data here shows that AgRP also acts as an agonist to increase K+ efflux through Kir7.1, producing a strong hyperpolarizing signal. The relative distribution and composition of the MC4R signaling complex in different subcellular compartments of PVN MC4R neurons has not been directly determined. Earlier models of α-MSH and AgRP action suggested competitive binding of these peptides to individual MC4R sites (orange box). Existing neuroanatomical data characterizing POMC and AgRP neuronal projections shows that α-MSH may act independently of AgRP at many sites in the CNS, since AgRP immunoreactive fibers are only observed in a subset of MC4R expressing nuclei containing POMC-immunoreative fibers (right circle, for review see 25). The ability of AgRP to act independently of α-MSH as a potent hyperpolarizing agonist, via regulation of Kir7.1, suggests the likely existence of independent AgRP sites of action (left circle). Recent reconstruction of EM images of the PVN in which POMC and AgRP containing synaptic vesicles have been specifically labeled with a genetically encoded marker provides preliminary anatomical support for this new model26. This study demonstrates that 52% of AgRP boutons in the PVN are not found in synapses, potentially supporting volume transmission of AgRP that may lead to competition with α-MSH at synaptic and/or non-synaptic sites. Additionally, the study found the vast majority of AgRP and POMC synaptic sites localized to different subcellular compartments of PVN neurons, supporting the independent action of both peptides. Synaptic release sites on soma were almost exclusively AgRP-containing, while POMC release sites were concentrated on distal dendrites. Another MC4R signaling pathway, involving cAMP/PKA-dependent activation of KATP channels and α-MSH induced hyperpolarization, has been demonstrated in MC4R neurons in the dorsal motor nucleus of the vagus in the brainstem (bottom right)21. Thus, while Kir7.1 signaling appears to be essential for depolarization of PVN MC4R neurons by α-MSH, Gαs signaling and elevation of cAMP may be depolarizing or hyperpolarizing, depending on the cellular context.
Acknowledgments
We thank C. Zhang and A. M. Bradshaw for advice and technical assistance in performance of experiments in the zebrafish. We thank D.M. Parichy (Univ. Washington) for providing the jaguar zebrafish strain. We thank Birgitte S. Wulff and Kilian W. Conde-Frieboes and Novo Nordisk A/S for the contribution of MC4-NN2-0543. This work was supported by NIH RO1DK070332 (R.D.C), and NIH 5R01 DK082884-03 (J.S.D.), NIH R01DK064265 (G.L.M.). R.D.C. is also supported by the Vanderbilt Diabetes Research and Training Center grant DK020593.
Footnotes
The authors declare no competing financial interests
Supplementary Information is available in the online version of the paper.
Author Contributions M.G-L., G.J.D, J.A.S., R.M., H.M.C., J.D., & R.D.C designed experiments, M.G-L., G.J.D., J.A.S, R.M., B.L.P., T.G., and I.R.T., performed experiments, G.L.M. and R.P. synthesized, purified, and folded the AgRP mini peptide, and M.G-L. and R.D.C. analyzed the data and wrote the manuscript. All authors reviewed and commented on the manuscript.
References
- 1.Mountjoy KG, Mortrud MT, Low MJ, Simerly RB, Cone RD. Localization of the melanocortin-4 receptor (MC4-R) in neuroendocrine and autonomic control circuits in the brain. Mol Endo. 1994;8:1298–1308. doi: 10.1210/mend.8.10.7854347. [DOI] [PubMed] [Google Scholar]
- 2.Ollmann MM, et al. Antagonism of central melanocortin receptors in vitro and in vivo by agouti-related protein. Science. 1997;278(5335):135–138. doi: 10.1126/science.278.5335.135. [DOI] [PubMed] [Google Scholar]
- 3.Srinivasan S, et al. Constitutive activity of the melanocortin-4 receptor is maintained by its N-terminal domain and plays a role in energy homeostasis in humans. J Clin Invest. 2004;114:1158–1164. doi: 10.1172/JCI21927. [DOI] [PMC free article] [PubMed] [Google Scholar]
- 4.Huszar D, et al. Targeted disruption of the melanocortin-4 receptor results in obesity in mice. Cell. 1997;88:131–141. doi: 10.1016/s0092-8674(00)81865-6. [DOI] [PubMed] [Google Scholar]
- 5.Madonna ME, Schurdak J, Yang YK, Benoit S, Millhauser GL. Agouti-related protein segments outside of the receptor binding core are required for enhanced short- and long-term feeding stimulation. ACS Chem Biol. 2012;7:395–402. doi: 10.1021/cb2003412. [DOI] [PMC free article] [PubMed] [Google Scholar]
- 6.Balthasar N, et al. Divergence of Melanocortin Pathways in the Control of Food Intake and Energy Expenditure. Cell. 2005;123:493–505. doi: 10.1016/j.cell.2005.08.035. [DOI] [PubMed] [Google Scholar]
- 7.Ghamari-Langroudi M, Srisai D, Cone RD. Multinodal regulation of the arcuate/paraventricular nucleus circuit by leptin. Proc Natl Acad Sci U S A. 2011;108:355–360. doi: 10.1073/pnas.1016785108. [DOI] [PMC free article] [PubMed] [Google Scholar]
- 8.Smith MA, et al. Melanocortins and agouti-related protein modulate the excitability of two arcuate nucleus neuron populations by alteration of resting potassium conductances. The Journal of Physiology. 2007;578(Pt 2):425–438. doi: 10.1113/jphysiol.2006.119479. [DOI] [PMC free article] [PubMed] [Google Scholar]
- 9.Matsuda H, Saigusa A, Irisawa H. Ohmic conductance through the inwardly rectifying K channel and blocking by internal Mg2+ Nature. 1987;325:156–159. doi: 10.1038/325156a0. [DOI] [PubMed] [Google Scholar]
- 10.Huang CL, Feng S, Hilgemann DW. Direct activation of inward rectifier potassium channels by PIP2 and its stabilization by Gbetagamma. Nature. 1998;391:803–806. doi: 10.1038/35882. [DOI] [PubMed] [Google Scholar]
- 11.Swale DR, Kharade SV, Denton JS. Cardiac and renal inward rectifier potassium channel pharmacology: emerging tools for integrative physiology and therapeutics. Current Opinion in Pharmacology. 2014;15:7–15. doi: 10.1016/j.coph.2013.11.002. [DOI] [PMC free article] [PubMed] [Google Scholar]
- 12.Krapivinsky G, et al. A Novel Inward Rectifier K+ Channel with Unique Pore Properties. Neuron. 1998;20:995–1005. doi: 10.1016/s0896-6273(00)80480-8. [DOI] [PubMed] [Google Scholar]
- 13.Shimura M, et al. Expression and permeation properties of the K+ channel Kir7.1 in the retinal pigment epithelium. The Journal of Physiology. 2001;531:329–346. doi: 10.1111/j.1469-7793.2001.0329i.x. [DOI] [PMC free article] [PubMed] [Google Scholar]
- 14.Doring F, et al. The epithelial inward rectifier channel Kir7.1 displays unusual K+ permeation properties. J Neurosci. 1998;18:8625–8636. doi: 10.1523/JNEUROSCI.18-21-08625.1998. [DOI] [PMC free article] [PubMed] [Google Scholar]
- 15.Weaver CD, Harden D, Dworetzky SI, Robertson B, Knox RJ. A thallium-sensitive, fluorescence-based assay for detecting and characterizing potassium channel modulators in mammalian cells. J Biomol Screen. 2004;9:671–677. doi: 10.1177/1087057104268749. [DOI] [PubMed] [Google Scholar]
- 16.Buch TR, Heling D, Damm E, Gudermann T, Breit A. Pertussis toxin-sensitive signaling of melanocortin-4 receptors in hypothalamic GT1-7 cells defines agouti-related protein as a biased agonist. J Biol Chem. 2009;284:26411–26420. doi: 10.1074/jbc.M109.039339. [DOI] [PMC free article] [PubMed] [Google Scholar]
- 17.Conde-Frieboes K, et al. Identification and in vivo and in vitro characterization of long acting and melanocortin 4 receptor (MC4-R) selective alpha-melanocyte-stimulating hormone (alpha-MSH) analogues. J Med Chem. 2012;55:1969–1977. doi: 10.1021/jm201489a. [DOI] [PubMed] [Google Scholar]
- 18.Panaro BL, et al. The Melanocortin-4 Receptor is Expressed in Enteroendocrine L Cells and Regulates the Release of Peptide YY and Glucagon-Like Peptide 1 In Vivo. Cell Metab. doi: 10.1016/j.cmet.2014.10.004. in press. [DOI] [PMC free article] [PubMed] [Google Scholar]
- 19.Zhang C, Forlano PM, Cone RD. AgRP and POMC Neurons Are Hypophysiotropic and Coordinately Regulate Multiple Endocrine Axes in a Larval Teleost. Cell Metab. 2012;15:256–264. doi: 10.1016/j.cmet.2011.12.014. [DOI] [PMC free article] [PubMed] [Google Scholar]
- 20.Sohn JW, et al. Melanocortin 4 receptors reciprocally regulate sympathetic and parasympathetic preganglionic neurons. Cell. 2013;152:612–619. doi: 10.1016/j.cell.2012.12.022. [DOI] [PMC free article] [PubMed] [Google Scholar]
- 21.Doronin SV, Potapova IA, Lu Z, Cohen IS. Angiotensin receptor type 1 forms a complex with the transient outward potassium channel Kv4.3 and regulates its gating properties and intracellular localization. J Biol Chem. 2004;279:48231–48237. doi: 10.1074/jbc.M405789200. [DOI] [PubMed] [Google Scholar]
- 22.Huang C, et al. Interaction of the Ca2+-sensing receptor with the inwardly rectifying potassium channels Kir4.1 and Kir4.2 results in inhibition of channel function. Am J Physiol Renal Physiol. 2007;292:F1073–1081. doi: 10.1152/ajprenal.00269.2006. [DOI] [PubMed] [Google Scholar]
- 23.Iwashita M, et al. Pigment pattern in jaguar/obelix zebrafish is caused by a Kir7.1 mutation: implications for the regulation of melanosome movement. PLoS Genet. 2006;2:e197. doi: 10.1371/journal.pgen.0020197. [DOI] [PMC free article] [PubMed] [Google Scholar]
- 24.Hida T, et al. Agouti protein, mahogunin, and attractin in pheomelanogenesis and melanoblast-like alteration of melanocytes: a cAMP-independent pathway. Pigment Cell Melanoma Res. 2009;22:623–634. doi: 10.1111/j.1755-148X.2009.00582.x. [DOI] [PMC free article] [PubMed] [Google Scholar]
- 25.Cone RD. Anatomy and regulation of the central melanocortin system. Nat Neurosci. 2005;8:571–578. doi: 10.1038/nn1455. [DOI] [PubMed] [Google Scholar]
- 26.Atasoy D, Betley JN, Li W-P, Su HH, Sertel SM, Scheffer LK, Simpson JH, Fetter RD, Sternson SM. A genetically specified connectomics approach applied to long-range feeding regulatory circuits. Nat Neurosci. doi: 10.1038/nn.3854. in press. [DOI] [PMC free article] [PubMed] [Google Scholar]
- 27.Liu H, et al. Transgenic mice expressing green fluorescent protein under the control of the melanocortin-4 receptor promoter. J Neurosci. 2003;23(18):7143–7154. doi: 10.1523/JNEUROSCI.23-18-07143.2003. [DOI] [PMC free article] [PubMed] [Google Scholar]
- 28.Cox HM, et al. Peptide YY is critical for acylethanolamine receptor Gpr119-induced activation of gastrointestinal mucosal responses. Cell Metab. 2010;11(6):532–542. doi: 10.1016/j.cmet.2010.04.014. [DOI] [PMC free article] [PubMed] [Google Scholar]
- 29.Franklin KBJ, Paxinos G. The Mouse Brain in Stereotaxic Coordinates. Academic Press; San Diego: 1997. [Google Scholar]


